http://www.teijin.co.jp
Printed in Japan using waterless printing. Issued 2011.7
Annual R
eport 2011
2020
20112010
20092008Net Sales
Operating Income
Net Income
●
●●
●●
Year ended March 31, 2011
Annual Report

Product names and service names denoted with TM or ® are trademarks or registered trademarks of the Teijin Group in Japan and/or other countries. Product names and service names used in this report are trademarks or registered trademarks of the Teijin Group. Other product names and service names used in this report may be protected as their trademarks and/or trade names.
© 2011 Teijin Limited. All Rights Reserved.
Contents
2 Financial Highlights
4 Message from the CEO
8 The Teijin Group at a Glance
10 Business Group Review
10 Aramid Fibers Business Group
11 Carbon Fibers and Composites
Business Group
12 Polyester Fibers Business Group
13 Plastics Business Group
14 Films Business Group
15 Medical and Pharmaceuticals
Business Group
17 Fiber Products Marketing
Business Group
18 IT Business Group
19 New Business Development Group
20 Research and Development
24 Corporate Governance
27 Corporate Social Responsibility
29 Financial Section
30 Consolidated 11-Year Summary
32 Management’s Discussion and Analysis
40 Consolidated Financial Statements
76 Corporate Data
Composition of Sales in Fiscal 2010
13%
13%
26%
17%
26%
5%
Polyester Fibers
High-Performance Fibers
Films andPlastics
Pharmaceuticals and Home Health Care
Others
Trading and Retail
Net sales
up 6.5%
Free cash fl ow
up ¥2.4 billion
Operating income
up 3.6 times
Materials
Health Care
Servicesand Other
Disclaimer Regarding Forward-Looking Statements
Any statements in this document, other than
those of historical fact, are forward-looking
statements about the future performance of
Teijin and its Group companies, which are based
on management’s assumptions and beliefs in
light of information currently available and involve
risks and uncertainties. Actual results may differ
materially from these forecasts. Potential risks
and uncertainties include, but are not limited to,
domestic and overseas economic conditions,
such as consumer spending and private capital
expenditures; currency exchange rate fl uctua-
tions, notably with the Japanese yen, U.S. dollar,
Asian currencies, the euro and other currencies
in which Teijin operates its international business;
direct and indirect restrictions imposed by other
countries; fl uctuations in the market prices of
securities in which Teijin has substantial holdings;
and Teijin’s ability to maintain its strength in many
products and geographical areas, through such
means as new product introductions, in a market
that is highly competitive in terms of both price
and technology, pertinent to the industry to
which the Company primarily belongs.

Profi le
The promise of the Teijin brand is summed up in the resonant statement:
“Human Chemistry, Human Solutions.”
Our promise is to keep delivering real value through the development of chemical
technologies that are friendly to both people and the global environment,
and through the provision of solutions that society and our customers expect.
Brand Statement
Quality of LifeThe Teijin Group’s
purpose is to enhance
the quality of life through
a deep insight into
human nature and needs,
together with the
application of our
creative abilities.
In Harmony with Society
Empowering Our People
Corporate Philosophy
Our prom
techn
and thro
1Teijin Limited
Teijin Limited is the holding company for the Teijin
Group, a multinational corporate enterprise that
provides innovative solutions worldwide in eight
distinct businesses, notably in the areas of high-
performance materials and health care. Established
in 1918, Teijin has a long history of turning challenges
into opportunities and has evolved into a leading name
in many of its core businesses. In high-performance
materials, for example, the Company is currently one
of the top global manufacturers of aramid fi bers and
carbon fi bers, while in the health care fi eld, Teijin is
recognized as Japan’s market leader in both home
oxygen therapy (HOT) and continuous positive airway
pressure (CPAP) devices.
Since 1999, Teijin has implemented a series
of groundbreaking measures that have earned it a
reputation as a pioneer in corporate governance in
Japan. These include establishing its Advisory Board
in 1999 and restructuring its Board of Directors to
enhance the effectiveness of management. Today,
the Company is pursuing an approach based on
the integration of business strategies, corporate
governance and corporate social responsibility (CSR).

2 Teijin Limited
2002 2003 2004 2005 2006 2007 2008 2009 2010 2011
816
49
923
29
3.2%
1
(21)
0.3%
8
-7.1%
9
3.0%
25
3.1%
34
7.9%13
9.7%
(43)
3.3%
(36)-12.3%
25
-12.4%
9.1%
890 875 908 9381,010 1,037
943
766
1318
7565
77
39
52
35
4.0%4.4% 5.7%
8.2% 7.4%
6.3%
1.9%1.8%
6.0%
Billions of yenBillions of yen %
Net Sales Operating IncomeOperating Margin
Billions of yen %Net Income (Loss) ROE
0
200
400
600
800
1,000
1,200
0
20
40
60
80
100
120
0
2
4
6
8
10
12
-45
-30
-15
0
15
30
45
-15
-10
-5
0
5
10
15
2002 2003 2004 2005 2006 2007 2008 2009 2010 2011
Years ended March 31
Years ended/as of March 31 2002 2003 2004 2005
Operating Results Net sales ¥ 923 ¥ 890 ¥ 875 ¥ 908
Operating income 29 35 39 52
Net income (loss) 1 (21) 8 9
R&D expenses 32 30 33 30
Financial Position Total assets 1,105 1,037 915 852
Interest-bearing debt 429 444 357 277
Shareholders’ equity 311 279 294 291
Cash Flows Cash fl ows from operating activities 52 58 45 73
Cash fl ows from investing activities (51) (66) (17) 13
Free cash fl ow 1 (8) 28 86
Cash fl ows from fi nancing activities (6) 11 (32) (80)
Per Share Data Net income (loss) ¥ 1.1 ¥ (22.7) ¥ 9.0 ¥ 9.7
Shareholders’ equity 335.5 300.3 316.8 313.3
Cash dividends 6.5 6.5 6.5 6.5
Notes:
1. The U.S. dollar amounts represent translations of Japanese yen, for convenience only, at the rate of ¥83.15 to U.S.$1.00, the prevailing exchange rate at March 31, 2011.
2. Throughout this annual report, return on equity (ROE) is calculated as net income divided by average shareholders’ equity, and return on assets (ROA) is calculated as
operating income divided by average total assets. Shareholders’ equity = Total net assets at year-end – Subscription rights to shares at year-end – Minority interests at
year-end.
3. The debt-to-equity ratio is calculated as interest-bearing debt at year-end divided by shareholders’ equity at year-end.
Financial Highlights

3Teijin Limited
Billions of yen Percentage change Millions of U.S. dollars
2006 2007 2008 2009 2010 2011 2010/2011 2011
¥ 938 ¥1,010 ¥1,037 ¥ 943 ¥ 766 ¥ 816 6.5% $ 9,809
77 75 65 18 13 49 261.4% 584
25 34 13 (43) (36) 25 ̶ 303
31 35 36 38 33 31 -5.6% 379
944 1,000 1,016 874 823 762 -7.5% 9,159
298 296 325 361 320 267 -16.5% 3,216
339 367 391 306 271 284 4.8% 3,418
75 96 54 40 80 77 928
(74) (87) (79) (116) (33) (28) (334)
1 9 (26) (76) 47 49 594
2 (19) 16 79 (43) (42) (506)
Yen U.S. dollars
¥ 26.6 ¥ 36.8 ¥ 13.2 ¥ (43.7) ¥ (36.3) ¥ 25.6 $ 0.31
364.8 395.2 397.3 310.5 276.2 288.8 3.47
7.5 10.0 8.0 5.0 2.0 5.0 0.06
(51)(66)
(17)
52 5845
13
73
(74)(87) (79)
(116)
(33)
75
96
5440
80
1
(8)
28
86
1 9
(26)
(76)
47
(28)
77
49
Billions of yen
Cash Flows from Operating Activities Cash Flows from Investing Activities Free Cash Flow
-120
-80
-40
0
40
80
120
2002 2003 2004 2005 2006 2007 2008 2009 2010 2011
1,105
429 444
357 277 298 296 325 361320
267
1.6%
6.1%
1.18 times0.94 times
1,037
915852
9441,000 1,016
874823
762
1.38 times 1.59 times 1.21 times
0.95 times 0.88 times 0.81 times 0.83 times
1.18 times
2.7%3.3%
4.0% 5.9%
8.5%7.7% 6.5%
1.9%
TimesBillions of yen %
Total Assets Interest-Bearing Debt ROADebt-to-Equity Ratio
0
200
400
600
800
1,000
1,200
0
2
4
6
8
10
12
0
2
4
6
8
10
12
2002 2003 2004 2005 2006 2007 2008 2009 2010 2011
4 Teijin Limited
Message from the CEO
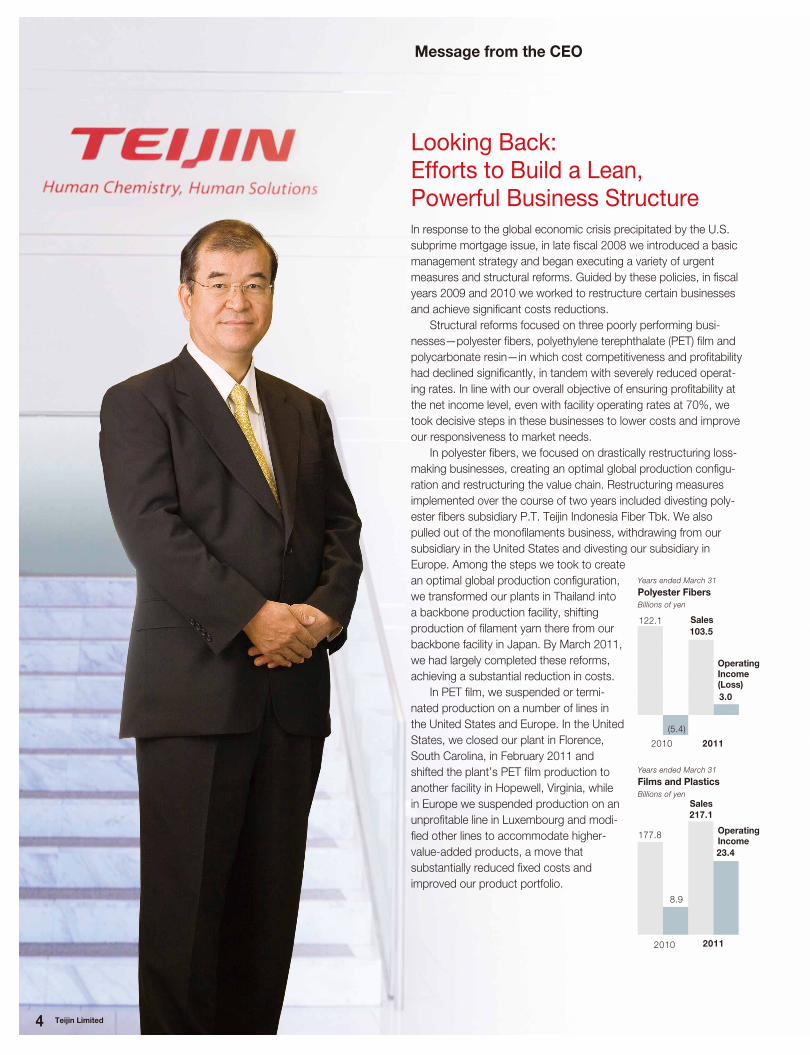
Looking Back: Efforts to Build a Lean, Powerful Business StructureIn response to the global economic crisis precipitated by the U.S.
subprime mortgage issue, in late fi scal 2008 we introduced a basic
management strategy and began executing a variety of urgent
measures and structural reforms. Guided by these policies, in fi scal
years 2009 and 2010 we worked to restructure certain businesses
and achieve signifi cant costs reductions.
Structural reforms focused on three poorly performing busi-
nesses—polyester fi bers, polyethylene terephthalate (PET) fi lm and
polycarbonate resin—in which cost competitiveness and profi tability
had declined signifi cantly, in tandem with severely reduced operat-
ing rates. In line with our overall objective of ensuring profi tability at
the net income level, even with facility operating rates at 70%, we
took decisive steps in these businesses to lower costs and improve
our responsiveness to market needs.
In polyester fi bers, we focused on drastically restructuring loss-
making businesses, creating an optimal global production confi gu-
ration and restructuring the value chain. Restructuring measures
implemented over the course of two years included divesting poly-
ester fi bers subsidiary P.T. Teijin Indonesia Fiber Tbk. We also
pulled out of the monofi laments business, withdrawing from our
subsidiary in the United States and divesting our subsidiary in
Europe. Among the steps we took to create
an optimal global production confi guration,
we transformed our plants in Thailand into
a backbone production facility, shifting
production of fi lament yarn there from our
backbone facility in Japan. By March 2011,
we had largely completed these reforms,
achieving a substantial reduction in costs.
In PET fi lm, we suspended or termi-
nated production on a number of lines in
the United States and Europe. In the United
States, we closed our plant in Florence,
South Carolina, in February 2011 and
shifted the plant’s PET fi lm production to
another facility in Hopewell, Virginia, while
in Europe we suspended production on an
unprofi table line in Luxembourg and modi-
fi ed other lines to accommodate higher-
value-added products, a move that
substantially reduced fi xed costs and
improved our product portfolio.
Polyester Fibers
20112010
Sales
Operating
Income
(Loss)
103.5
122.1
Billions of yen
Years ended March 31
3.0
(5.4)
Films and Plastics
Operating
Income177.8
217.1
23.4
2010 2011
SalesBillions of yen
Years ended March 31
8.9
5Teijin Limited
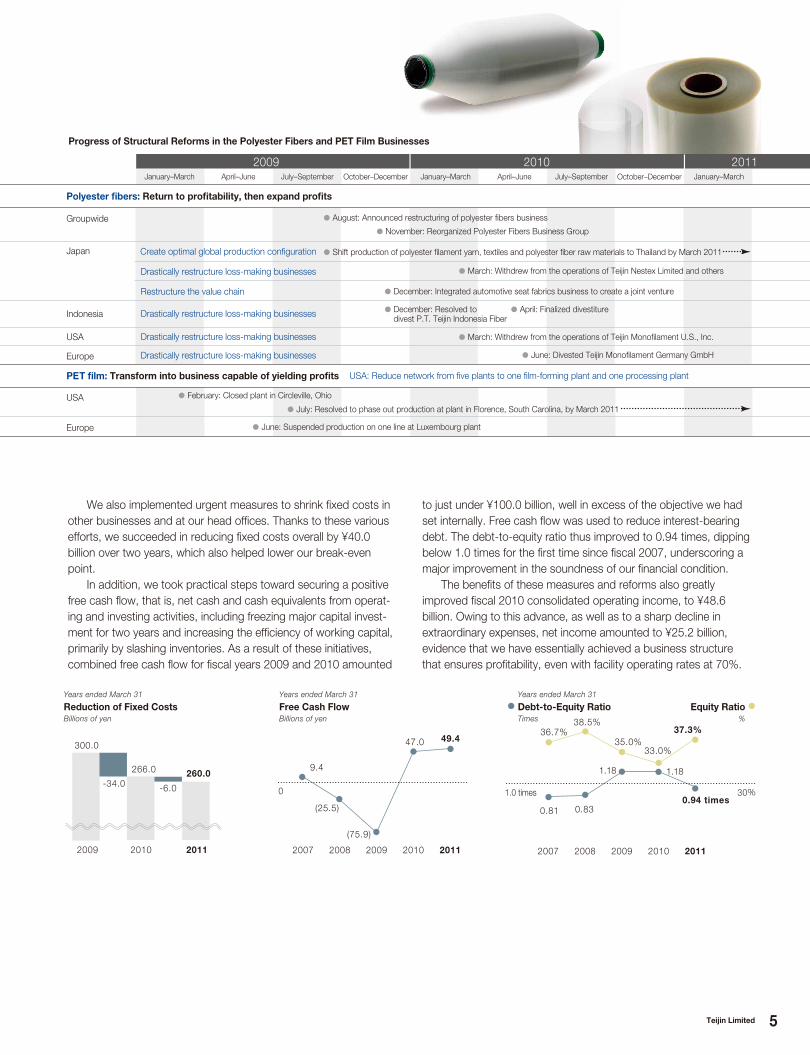
Create optimal global production configuration
Groupwide
Japan
USA
Europe
Indonesia
USA
Europe
Drastically restructure loss-making businesses
Restructure the value chain
Drastically restructure loss-making businesses
Drastically restructure loss-making businesses
Drastically restructure loss-making businesses
USA: Reduce network from five plants to one film-forming plant and one processing plant
● Shift production of polyester filament yarn, textiles and polyester fiber raw materials to Thailand by March 2011
● March: Withdrew from the operations of Teijin Nestex Limited and others
● December: Integrated automotive seat fabrics business to create a joint venture
● February: Closed plant in Circleville, Ohio
● July: Resolved to phase out production at plant in Florence, South Carolina, by March 2011
● June: Suspended production on one line at Luxembourg plant
● March: Withdrew from the operations of Teijin Monofilament U.S., Inc.
● June: Divested Teijin Monofilament Germany GmbH
● December: Resolved to divest P.T. Teijin Indonesia Fiber
● April: Finalized divestiture
Polyester fibers: Return to profitability, then expand profits
PET film: Transform into business capable of yielding profits
2009January–March April–June July–September October–December January–March January–MarchApril–June July–September October–December
2010 2011
● August: Announced restructuring of polyester fibers business
● November: Reorganized Polyester Fibers Business Group
Progress of Structural Reforms in the Polyester Fibers and PET Film Businesses
We also implemented urgent measures to shrink fi xed costs in
other businesses and at our head offi ces. Thanks to these various
efforts, we succeeded in reducing fi xed costs overall by ¥40.0
billion over two years, which also helped lower our break-even
point.
In addition, we took practical steps toward securing a positive
free cash fl ow, that is, net cash and cash equivalents from operat-
ing and investing activities, including freezing major capital invest-
ment for two years and increasing the effi ciency of working capital,
primarily by slashing inventories. As a result of these initiatives,
combined free cash fl ow for fi scal years 2009 and 2010 amounted
2007 20092008 2010 2011
1.0 times 30%
Debt-to-Equity Ratio Equity Ratio
0.94 times
1.181.18
0.830.81
37.3%
33.0%35.0%
38.5%36.7%
Times %
Years ended March 31
to just under ¥100.0 billion, well in excess of the objective we had
set internally. Free cash fl ow was used to reduce interest-bearing
debt. The debt-to-equity ratio thus improved to 0.94 times, dipping
below 1.0 times for the fi rst time since fi scal 2007, underscoring a
major improvement in the soundness of our fi nancial condition.
The benefi ts of these measures and reforms also greatly
improved fi scal 2010 consolidated operating income, to ¥48.6
billion. Owing to this advance, as well as to a sharp decline in
extraordinary expenses, net income amounted to ¥25.2 billion,
evidence that we have essentially achieved a business structure
that ensures profi tability, even with facility operating rates at 70%.
300.0
-34.0
266.0
-6.0
260.0
Reduction of Fixed Costs
2009 2010 2011
9.4
(25.5)
(75.9)
49.447.0
Free Cash Flow
0
2007 20092008 2010 2011
Billions of yen
Years ended March 31
Billions of yen
Years ended March 31

6 Teijin Limited
¥40–60
¥40–60
¥15–25
¥2–8
¥1–2
¥2–5
USA
Europe
Japan
ROK
Hong Kong
Taiwan
PRC
Asia/Oceania
Middle East/Africa
Central and South America
2009 2011 20132010Anticipated annual sales
2012 2014Billions of yen
Global Marketing of TMX-67 (treatment for hyperuricemia in gout)
Selection of licensees in progress
Repositioning Teijin on a Growth TrajectoryIn fi scal 2010, the year ended March 31, 2011, economic condi-
tions were generally favorable worldwide. However, the outlook
remains clouded by uncertainty, owing to the upheaval caused by
the Great East Japan Earthquake, which struck on March 11, 2011,
and rising raw materials prices, as well as by such factors as a
delay in the recovery of the U.S. economy and the tightening of
fi scal policies in Europe; political instability in the Middle East and
North Africa; and infl ationary pressure in emerging economies, a
consequence of excess liquidity worldwide. Having put the fi nal
touches to the aforementioned structural reforms, thereby creating
a foundation for sustainable growth in fi scal 2011 and beyond,
we are well positioned to meet the challenges presented by our
operating environment.
Within our existing businesses, we will focus on two that
we believe will be key profi t drivers in the coming years—high-
performance materials and health care. In the fi rst, our emphasis
is on materials that help reduce the weight and energy requirements
and enhance the safety and security of fi nished products, as well
as which contribute to environmental protection. In the second,
we will continue to provide solutions that respond to the aging of
society and the increasing prevalence of lifestyle-related diseases.
In our high-performance materials business, which centers
on aramid and carbon fi bers, our priority is decisive expansion.
Twaron® and Technora® para-aramid fi bers and Teijinconex® meta-
aramid fi bers are light, with superb strength, and boast excellent
tensile modulus and thermal resistance, making them ideal for
applications that respond to increasing concerns regarding product
safety and security. These products are currently used in, among
others, automotive-related materials and protective clothing and
materials, as well as in fi ber optic cables—the latter a growing mar-
ket thanks to the spread and evolution of the Internet. For all these,
we foresee further increases in demand in the near future. Tenax®
carbon fi bers are used extensively in aircraft; in wind turbine blades,
Outlook for Global Demand for Para-Aramid Fibers
Outlook for Global Demand for Carbon Fibers
Aircraft/aerospaceGeneral industrial applications Sports and leisure equipment
2004 2011 2021
120
90
60
30
0
Thousand tons Thousand tons120
90
60
30
02007 2011 2021
Years ended/ending March 31 Years ended/ending March 31
Annual growth 7% + Annual growth 15%
containers and other general industrial applications; and in sports
and leisure equipment, including golf club shafts. Looking ahead,
we expect demand from the aircraft and automotive sectors to
strengthen, mirroring the essential role these fi bers play in reducing
weight, energy requirements and CO2 emissions. We also anticipate
expanded demand for Panlite® polycarbonate resin and Tetoron®
PET fi lm for cutting-edge applications in such areas as electronics.
In health care, we specialize in three key therapeutic areas—
bone and joint disease, respiratory disease and cardiovascular and
metabolic disease. In our pharmaceuticals business, in 2011 we
launched a new treatment for hyperuricemia and gout—the fi rst
novel drug in this fi eld in 40 years—in the domestic market. We also
market the drug for use in treating hyperuricemia in gout in a num-
ber of overseas markets. Sales in Europe and North America con-
tinue to increase. Eventually we hope to make the drug available
in 60 countries worldwide and are targeting annual global sales of
¥100 billion. Additionally, we continue to advance the development
of a promising drug for treating and preventing atrial fi brillation and
fl utter. In our home health care business, we have leveraged our
position as a pioneer in home oxygen therapy (HOT) in Japan to
secure a leading share of the market for continuous positive airway
ULORIC®
FEBURIC®
ADENURIC®
TMX-67: Aiming to market in
60 countries and targeting annual
sales of at least ¥100 billion
Source: Teijin estimate
Source: Teijin estimate

7Teijin Limited
High-performance materials and new businesses
Pharmaceuticals and home health care
Commoditized materials
Expansion centered on high-performance materials and health care
Sales expanding in emerging economies and Asia
1999 2009 2021 (Approx.)
2021 (Approx.)
1999 2009 2021 (Approx.)
50%
35%
15%
10%
15%
50%
25%
30%
20%
25%
25%
Sales in Key Businesses
75%
10%
15%60%
20%
20%
40%
35%
25%
Sales by Region
High-performance materials and new businesses
Commoditized materials
Pharmaceuticals and home health care
Trading and retail, IT
Japan
Emerging economies/Asia
North America and Europe
High-performance materials: Aramid fibers, carbon fibers, other high-performance materialsCommoditized materials: Polyester fibers, PET film, polycarbonate resin
Sales in High-Performance Materials and Pharmaceuticals and Home Health Care Businesses
1999 2009
Billions of yen1,600
1,200
800
400
0
Years ended/ending March 31
Years ended/ending March 31
Years ended/ending March 31
pressure (CPAP) ventilators. Today, we are also expanding our
home health care business into overseas markets. In the United
States, where we recently completed the integration of several new
affi liates, we are seeing favorable sales gains. In Europe, we are
working through our joint venture in Spain to set up operations
elsewhere in the region.
Looking Ahead: Teijin in 2020We have formulated a long-term outlook that delineates where
we see the Teijin Group around 2020. Through technology-driven
innovation, we will continue working to achieve sustainable growth
by revamping our business portfolio and providing solutions that
refl ect changing social imperatives in two key domains—green
chemistry and health care.
Our efforts in green chemistry will focus on high-performance
materials, as well as green businesses and energy. This domain
includes advanced composites, biomaterials and recycling sys-
tems, through which we strive to provide solutions that contribute
to making fi nished products lighter, safer and more energy-
effi cient. In the second domain, health care, we will target the
development of blockbuster and next-generation pharmaceuticals,
as well as step up efforts to offer advanced home health care
solutions. Our basic strategy for expanding our operations
overseas, which emphasizes locations advantageous from both
a production and a sales perspective, will remain unchanged.
Accordingly, we will work to reinforce our presence in emerging
economies, notably the BRIC countries Brazil, Russia, India and
the People’s Republic of China (PRC). We see sales in overseas
markets growing to account for approximately 60% of consoli-
dated net sales by about 2020, from about 40% at present.
In line with our long-term outlook, we are currently formulating
a new medium-term management plan that will set out strategies
not only for a technology-driven restructuring of our business
portfolio, but also for the restructuring of our geographic and
technology portfolios. One target of this plan will be to raise our
consolidated operating margin to 10%, from 6% in fi scal 2010.
In these and all our efforts, we appreciate your continued
support and guidance.
July 2011
Shigeo Ohyagi
President and CEO

240
0
80
60
40
20
0
20
15
10
5
0
-20 -10
60
120
180
Billions of yen
Sales
2010 2011 2010 2011 2010 2011
177.8
217.1
23.4
8.9
10.8%
2.9%
5.0%
3.0
-4.4%
122.1
103.5
(5.4)
4.3%
4.4
-8.6%
89.9103.4
(7.7)
%Billions of yen
OperatingIncome (Loss)
OperatingMargin
Years ended March 31
8 Teijin Limited 8 Teijin Limited
Operatingincome
Sales 52%
50%
Materials businesses as a percentage of sales and operating income
Maximizing technologies that are among
the most advanced in the industry to
offer high-value-added products
Growing its para-aramid fi bers business,
a market it dominates in terms of global
market share
Expanding its global
industry-leading PET and proprietary
PEN fi lms businesses
Capitalizing on its position as the
top name in polycarbonate resin
in the Asian market
Films and Plastics
Films and Plastics
High-Performance Fibers
High-Performance Fibers
Materials Businesses
Polyester Fibers
Polyester Fibers
Polyester Fibers Business Group
Aramid Fibers Business Group
Reinforcing its presence in carbon
fi bers, in which it enjoys a leading
market share worldwide
Carbon Fibers and Composites Business Group
Films Business Group
Plastics Business Group
The Teijin Group at a Glance
Principal Products
• Para-aramid fi bers
• Meta-aramid fi bers
Principal Products
• Carbon fi bers
• Carbon fi ber composite materials
page
page
10
11
page
page
page
13
14
12
Principal Products
• PET fi lm
• PEN fi lm
Principal Products
• Polycarbonate resin
• PET resin
Principal Products
• Polyester fi bers
• PEN fi bers

240
0
60
120
180
2010 2011 2010 2011 2010 2011
136.4131.7
22.924.3
16.8%
18.5%216.9
205.3
4.73.4
2.2%1.7%
38.339.0
3.12.6
8.1%6.7%
OperatingIncome
OperatingMargin
%Billions of yenSales
Billions of yen
80
60
40
20
0
20
15
10
5
0
9Teijin Limited 9Teijin Limited
Services and Other Businesses
Health Care Businesses
Operatingincome
Operatingincome
SalesSales
13%
17%
37%
31%
Health care, services and other businesses as a percentage of sales and operating income
Leveraging its position as one of Japan’s
leading trading companies specializing
in fi ber products to expand operations
overseas
Promoting the development of total
IT solutions and Services, including systems
management and the provision of contentPharmaceuticalsDeveloping ethical pharmaceuticals
in three key therapeutic areas
Home Health CareA pioneer in Japan’s home health care
market and a domestic market leader
for HOT
Others
Others
Trading and Retail
Trading and Retail
Pharmaceuticals and Home Health Care
Pharmaceuticals and
Home Health Care
Health Care Businesses Services and Other Businesses
page page page
15 17 18
New Business Development Group
page
19
Principal Products
• Treatments for osteoporosis
• Treatments for asthma and expectorants
• Treatment for hyperlipidemia
• Treatment for hyperuricemia in gout
Principal Businesses
• Sales, import and export of textiles and industrial materials
• Retail sales of men’s and ladies’ fashion
Principal Businesses
• IT solutions and content
Advancing the incubation of new
businesses, investigative research
and Groupwide cross-business R&D
Principal Products
• HOT devices
• Ventilators for treating SAS
Medical and Pharmaceuticals Business Group
Fiber Products Marketing Business Group
IT Business Group

10 Teijin Limited
Aramid Fibers Business Group
Eiso W.A. Alberda van Ekenstein
General Manager,
Aramid Fibers Business Group
Business Group Review
The global market for para-aramid fi bers is essentially dominated by Teijin and E.I. du Pont de Nemours and Company (DuPont) of the United Sates, with technological barriers to new market entrants being sizeable. After falling 20% in fi scal 2009, demand worldwide recovered during fi scal 2010, returning to the prerecession level at the end of the period. Global demand is expected to rise by at least 7% annually for the foreseeable future. This projection refl ects the increasing need for materials that contribute to, among others, greater safety and security, weight reduction and lower energy and resource consumption.
Q How did the aramid fi bers business perform in fi scal 2010?A Both sales and operating income rose, owing to an ongoing recovery in demand
for key applications. Demand for para-aramid fi bers remained robust, driven pri-
marily by demand for use in automotive-related materials and protective clothing
and materials, as well as in fi ber optic cables. As a consequence, in September
we resumed full-scale production. Demand for meta-aramid fi bers also rallied,
bolstered by a recovery in the steel, asphalt and electrical machinery industries.
Q What do you see as your principal challenges in fi scal 2011 and how will you respond?
A We will strive to increase sales for applications in the promising automotive,
energy development, information and communications industries. One key aim is
to expand the markets for our products in emerging economies, including those
of BRIC countries Brazil, Russia, India and the PRC. We will also continue working
to reinforce the structure of the aramid fi bers business by enhancing productivity
and reducing costs, while at the same time taking decisive steps to strengthen our
competitive advantage by expanding midstream and downstream businesses. In
addition, we have plans to enter the market for high-performance polyethylene
products in the second half of fi scal 2011. We envisage high-performance poly-
ethylene products evolving into a third pillar of Teijin’s high-performance fi bers
portfolio, alongside aramid fi bers and carbon fi bers.
Q Can you give us any concrete information regarding the new high-performance polyethylene business?
A We will capitalize on the extensive customer base we have built up in the
aramid fi bers business and offer a wide range of products, including hybrids, that
respond to various needs. Initially, we will focus on applications in bullet-resistant
and stab-resistant clothing and materials and in industrial materials. Our target at
the moment is to secure a 15% global market share between 2015 and 2020.
Characteristics of Principal Products
Twaron®
Light, with excellent thermal, chemical and impact
resistance and eight times as strong as steel
Teijinconex®
Outstanding thermal resistance, allowing
it to withstand long-term exposure to
temperatures up to 200°C
Technora®
Boasts superb chemical resistance and even greater strength than Twaron®
Principal Products
Para-aramid fibers
Brand names Twaron®, Technora®
Applications Brake pads, gaskets, rubber reinforcements
(hoses, belts), tires, protective clothing,
plastic reinforcements, civil engineering
materials, optical fiber reinforcements
Meta-aramid fibersBrand name Teijinconex®
Applications Fireproof clothing, heat-resistant filters,
rubber reinforcements, plastic reinforcements
Artificial leatherBrand name Cordley®
Applications Sporting goods (shoes, balls)

11Teijin Limited
Norio Kamei
General Manager,
Carbon Fibers and Composites
Business Group
Carbon Fibers and Composites Business Group
The world’s top three manufacturers of carbon fi bers at present—Teijin, Toray Industries, Inc., and Mitsubishi Rayon Co., Ltd.—currently account for more than 50% of global production capacity. New market entrants face daunting technological barriers. Despite falling approximately 30% since its peak in fi scal 2007, demand for carbon fi bers bottomed out between January and March 2009. The supply–demand situation has also fi nally begun to improve. Global demand for carbon fi bers is expected to continue rising by approximately 15% annually for the foreseeable future, as tighter environmental regulations and the growing preference for energy-effi cient, ecologically sound options drives interest in carbon fi bers for aircraft, automotive and general industrial applications.
Q How did the carbon fi bers business perform in fi scal 2010?A Demand continued to rise for aircraft, sports and leisure equipment and general
industrial applications. As a consequence, facility operating rates and shipments
were up signifi cantly compared with fi scal 2009 and we started up production at
our newest facility in Germany. We also made progress in restoring sales prices,
particularly for carbon fi bers used in sports and leisure equipment, and in lowering
costs. These and other efforts facilitated a marked reduction of our operating loss.
Q What do you see as your principal challenges in fi scal 2011 and how will you respond?
A To restore stable profi tability in this business, we are striving to reduce costs
by revamping our production confi guration. We are also working to bring new
production facilities in Japan and Germany up to full-capacity operation, as well as
to boost sales in key emerging economies by maximizing the capabilities of our
Shanghai and Singapore offi ces. Over the medium to long term, we will focus on
building a secure profi t structure by implementing initiatives aimed at decisively
reinforcing our competitiveness in terms of both cost and quality. Additionally, we
will augment sales through the development of innovative high-performance car-
bon fi bers and carbon fi ber composite materials, as well as expand sales of mid-
stream and downstream products. For aircraft applications, our emphasis will be
on expanding direct contracts with manufacturers in that fi eld, which will position
us to respond better to customer needs and will bolster our share of the market
for carbon fi bers for next-generation aircraft. For midstream and downstream
products, we will concentrate on growing our mass-produced carbon fi ber com-
posite materials business, which centers on products for the automotive industry.
Q What is the status of product development efforts in the composite materials business?
A In the area of carbon fi ber composite materials for automotive applications,
which is expected to see substantial growth in demand in the years ahead, we
have established the world’s fi rst mass-production technologies for carbon fi ber–
reinforced plastic (CFRP) that reduce the time required for the molding of parts
to less than one minute by impregnating carbon fi bers with a thermoplastic resin.
The new technologies are also environment-friendly, minimizing waste during pro-
duction and facilitating repeated reheating and remolding. This is a major break-
through that has brought the day when CFRP can be used in mass-produced
vehicles considerably closer. With a view to the early commercialization of these
technologies, we will continue to conduct R&D in collaboration with automakers
and at the same time to cultivate applications in other industries.
Principal Products
Carbon fibersBrand name Tenax®
Applications Aircraft (structural and interior
components), general industrial
applications (wind turbine blades,
pressure vessels), sporting goods
(golf club shafts, fishing rods, tennis
racquets, yacht bodies)
Carbon fiber composite materials Applications Automobiles
(principal parts and components)
12 Teijin Limited
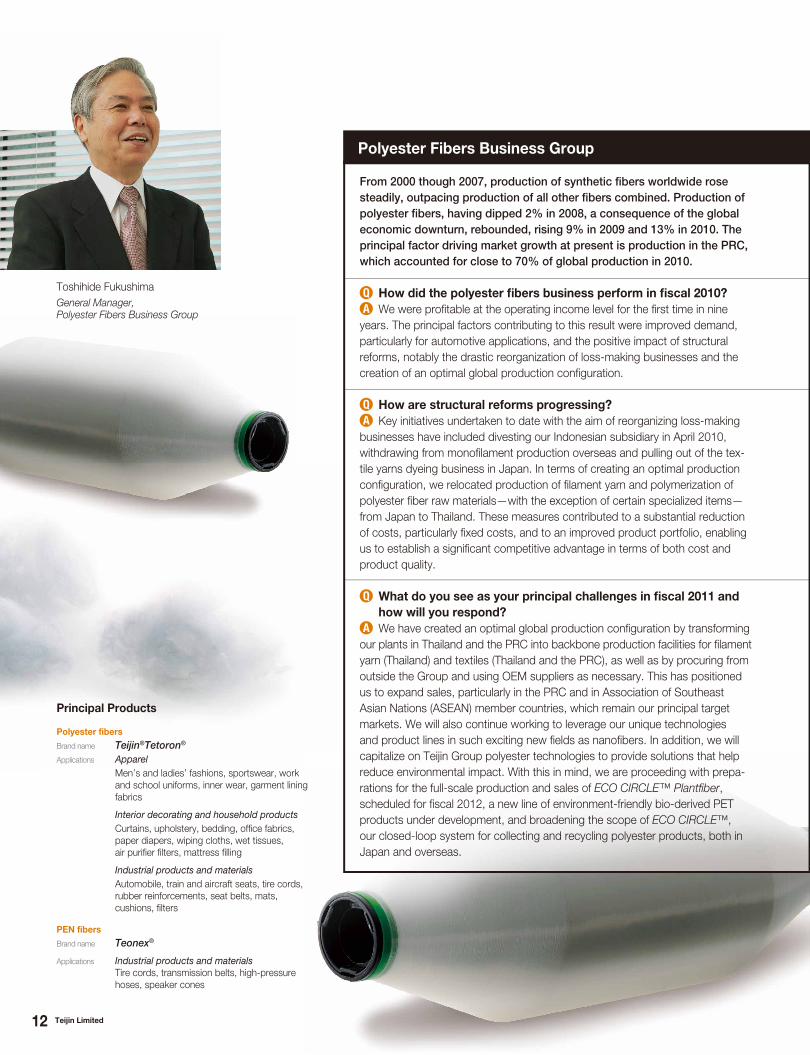
From 2000 though 2007, production of synthetic fi bers worldwide rose steadily, outpacing production of all other fi bers combined. Production of polyester fi bers, having dipped 2% in 2008, a consequence of the global economic downturn, rebounded, rising 9% in 2009 and 13% in 2010. The principal factor driving market growth at present is production in the PRC, which accounted for close to 70% of global production in 2010.
Q How did the polyester fi bers business perform in fi scal 2010?A We were profi table at the operating income level for the fi rst time in nine
years. The principal factors contributing to this result were improved demand,
particularly for automotive applications, and the positive impact of structural
reforms, notably the drastic reorganization of loss-making businesses and the
creation of an optimal global production confi guration.
Q How are structural reforms progressing?A Key initiatives undertaken to date with the aim of reorganizing loss-making
businesses have included divesting our Indonesian subsidiary in April 2010,
withdrawing from monofi lament production overseas and pulling out of the tex-
tile yarns dyeing business in Japan. In terms of creating an optimal production
confi guration, we relocated production of fi lament yarn and polymerization of
polyester fi ber raw materials—with the exception of certain specialized items—
from Japan to Thailand. These measures contributed to a substantial reduction
of costs, particularly fi xed costs, and to an improved product portfolio, enabling
us to establish a signifi cant competitive advantage in terms of both cost and
product quality.
Q What do you see as your principal challenges in fi scal 2011 and how will you respond?
A We have created an optimal global production confi guration by transforming
our plants in Thailand and the PRC into backbone production facilities for fi lament
yarn (Thailand) and textiles (Thailand and the PRC), as well as by procuring from
outside the Group and using OEM suppliers as necessary. This has positioned
us to expand sales, particularly in the PRC and in Association of Southeast
Asian Nations (ASEAN) member countries, which remain our principal target
markets. We will also continue working to leverage our unique technologies
and product lines in such exciting new fi elds as nanofi bers. In addition, we will
capitalize on Teijin Group polyester technologies to provide solutions that help
reduce environmental impact. With this in mind, we are proceeding with prepa-
rations for the full-scale production and sales of ECO CIRCLE™ Plantfi ber,
scheduled for fi scal 2012, a new line of environment-friendly bio-derived PET
products under development, and broadening the scope of ECO CIRCLE™,
our closed-loop system for collecting and recycling polyester products, both in
Japan and overseas.
Toshihide Fukushima
General Manager,
Polyester Fibers Business Group
Polyester Fibers Business Group
Principal Products
Polyester fibersBrand name Teijin®Tetoron®
Applications ApparelMen’s and ladies’ fashions, sportswear, work
and school uniforms, inner wear, garment lining
fabrics
Interior decorating and household products Curtains, upholstery, bedding, office fabrics,
paper diapers, wiping cloths, wet tissues,
air purifier filters, mattress filling
Industrial products and materials Automobile, train and aircraft seats, tire cords,
rubber reinforcements, seat belts, mats,
cushions, filters
PEN fibersBrand name Teonex®
Applications Industrial products and materials Tire cords, transmission belts, high-pressure
hoses, speaker cones

13Teijin Limited
The world’s top fi ve manufacturers of polycarbonate resin are Bayer AG, Saudi Basic Industries Corporation (SABIC), Teijin, the Mitsubishi Group and Styron LLC. Together, these companies account for approximately 80% of global production capacity. In fi scal 2010, market conditions—which have recovered steadily since bottoming out in the fi rst three months of 2009—remained robust, driven primarily by enhanced demand for applications in offi ce automation (OA) equipment, home appliances and automobile parts, as global demand rose 8% from the previous fi scal year. Continuing demand in the PRC and other emerging markets is expected to support an annual increase in global demand of approximately 5% to 6% for the foreseeable future.
Q How did the plastics business perform in fi scal 2010?A Operating rates at our plants in Japan, the PRC and Singapore remained high,
supported by fi rm domestic demand for mainstay polycarbonate resin in the PRC
and in emerging markets in Asia. In response to rising prices for principal raw mate-
rials, we worked to reduce costs—particularly fi xed costs—through rationalization
and to increase the weighting of high-value-added products in our portfolio, in
addition to which we implemented sales price adjustments. As a consequence,
we reported a sizeable improvement in operating income.
Q What do you see as your principal challenges in fi scal 2011 and how will you respond?
A The price of bisphenol-A (BPA), our principal raw material, remains high. It is
therefore crucial that we continue adjusting sales prices accordingly. We must also
buttress our ability to propose attractive solutions by collaborating closely with our
sales and R&D teams to develop high-value-added products, including such spe-
cialty products as high-end compounds and copolymerized polycarbonate resins.
Q What is the current status of and your outlook for the processed polycarbonate products business?
A In the area of processed polycarbonate sheet products, our focus in the domes-
tic market is on industrial applications, including dummy cans for vending machines
and automotive instrument panels. Looking ahead, we aim to increase domestic
sales of high-value-added polycarbonate sheet products, including one with
enhanced fl ame-resistant properties and another that delivers outstanding surface
hardness. Overseas, our emphasis is on strengthening our production confi guration
and profi t structure. For these reasons, we have established a strategic partnership
in the PRC with a local manufacturer of high-end plastic sheet products.
In the area of polycarbonate retardation fi lm, we will work to maintain our signif-
icant share of the market for use in 3D movie glasses and to bolster sales of our
exclusive reverse-dispersion solvent-cast retardation fi lm for use as antirefl ective
fi lm for mobile phones. In transparent electroconductive fi lm for smartphone touch
screens, a growing market, we recently completed the development of technol-
ogies necessary to produce fi lm for capacitive screens, positioning us well to
respond to the shift from resistive to capacitive touch screens, and have stepped
up commercialization efforts.
Kazuyuki Sakai
General Manager,
Plastics Business Group
Plastics Business Group
Principal Products
Polycarbonate resinBrand name Panlite®
Applications Electrical and electronics components,
audiovisual (AV) and office automation (OA)
equipment, personal computer casings,
optical discs (Blu-ray discs, DVDs and CDs),
precision instrument components, automotive
components (headlamps, door handles,
bumpers)
Brand names Panlite® Sheet, ELECLEAR®, PURE-ACE®
Applications Sheet Mobile phone front panels, flat panel LCD TVs
(flame-resistant sheet), automotive instrument
panels, dummy cans for vending machines
Film LCDs for mobile phones, personal digital
assistants (PDAs) and other handheld
electronics equipment, touch screens (OA
and FA equipment, handheld video game
machines)
PET resinApplications PET bottles
PEN resinBrand name Teonex®
Applications Cosmetics containers, school lunch dishware,
pharmaceuticals containers

14 Teijin Limited
Teijin manufactures PET fi lm worldwide through joint ventures with DuPont of the United States. In fi scal 2010, the global market for PET fi lm rallied early, begin-ning in Asia, particularly the PRC, returning to the prerecession level in the fi rst half. In the second half, demand climbed for use in fl at panel displays (FPDs) and solar cell back sheets. As a consequence, global demand for PET fi lm was up 7% for the full term as the market resumed a growth trajectory. Demand in the high-growth Asian market accounted for approximately 70% of global demand.
Q How did the fi lms business perform in fi scal 2010?A Demand for PET fi lm for use in FPDs and solar cell back sheets was so brisk
that supplies fell short. As a consequence, our production facilities worldwide con-
tinued to operate at full capacity and to sell out production. During the period, we
proceeded with crucial structural reforms. The business also benefi ted from the pos-
itive impact of efforts to streamline unprofi table production facilities and lines at joint
ventures in Europe and the United States, as well as from price increases imple-
mented in light of robust demand and from improvements to our sales confi guration.
For our six PET fi lm joint ventures as a whole and for three of these on an individual
level—one each in Europe, the United States and the PRC—operating results
in fi scal 2010 were the highest since the joint ventures’ establishment in 2000.
Moreover, our joint venture in Japan reported its second-best performance ever.
Q What is the current status of structural reforms?A We have essentially completed structural reforms in both the United States and
Europe. In the former, we closed our plant in Circleville, Ohio, in February 2009 and
completed a phased closure of our plant in Florence, South Carolina, in February
2011, shifting that facility’s production to our plant in Hopewell, Virginia. In Europe,
we terminated production on one unprofi table line at our plant in Luxembourg
and substantially downsized our European joint venture’s head offi ce and support
departments. In Japan, we implemented urgent measures aimed at reducing
costs—especially fi xed costs—and converted one line at our Utsunomiya Plant to
accommodate thick PET fi lm in response to rising demand for use in solar cells,
among others. In the coming years, we will focus on realigning our production con-
fi guration in Asia, including transferring additional production of general-purpose
products to Indonesia and the PRC, and on increasing cost competitiveness.
Q What do you see as your principal challenges in fi scal 2011 and how will you respond?
A In the area of fi lms for cutting-edge applications, we expect competition from
other Japanese manufacturers, as well as from certain key fi rms based in the
Republic of Korea (ROK), to remain intense. We further expect that product life
cycles will become more limited. Accordingly, the challenges for us are to create an
optimal production confi guration for such products in Asia, centered on Japan, that
will give us an unassailable edge in terms of cost competitiveness, and to reinforce
ties and collaboration with key customers by expanding our marketing capabilities
and our sales network. We will concentrate on the promising market for fi lms for
electronics applications, working to fortify our supply capabilities and ensure the
seamless launch of new products, enabling us to secure or maintain the leading
market share for strategic products. To cement our position as the principal supplier
in the promising market for differentiated products in the PRC, we will pursue a
two-pronged strategy of exporting products from Japan and enhancing production
technologies at our facilities in the PRC.
Takashi Takahashi
General Manager,
Films Business Group
Films Business Group
PET filmBrand names Teijin®Tetoron®, Mylar®, Melinex®, Teflex®
Applications Industrial applications Materials for LCDs and plasma and organic
electroluminescent displays (OELDs),
cards (integrated circuit [IC] cards, ID cards,
radio frequency identification [RFID] chips),
automotive products (interior and exterior
materials and electronic components)
Packaging materials Laminating film for beverage and food cans,
shrink wrap, retort pouches, environment-
friendly plastic trays
PEN filmBrand name Teonex®
Applications Digital videocassettes (DVCs), high-density data
backup tapes, electronics materials, electronic
circuit materials, high-performance materials
for automotive applications (seat sensors and
hybrid motor materials), advanced photo
system (APS) film
Processed filmBrand name Purex®
Applications Materials for LCDs, electronics materials,
films for semiconductor materials, medical
materials, photocatalysts, moisturizing facial
masks
Brand name CurrentFine®
Applications Flexible panel displays, touch screens,
membrane switch materials
Principal Products

15Teijin Limited
Pharmaceuticals Teijin specializes in three key therapeutic areas, namely, bone and joint disease, respiratory disease and cardiovascular and metabolic disease, and in Japan commands a leading share of the markets for pharmaceuticals for treating bone and joint disease and respiratory disease. In the area of cardiovascular and metabolic disease, Teijin has positioned TMX-67 (generic name: febuxostat)—a promising new treatment for hyperuricemia in patients with gout—as a strategic product with global currency and is pushing ahead with efforts to expand marketing worldwide. In May 2011, Teijin launched TMX-67 in Japan under the name FEBURIC®, for hyperuricemia and gout.Home Health Care The fi rst company to commercialize home oxygen therapy (HOT) services in Japan, Teijin has established a solid relation-ship with patients and health care professionals nationwide. Today, an estimated 150,000 patients across the country are undergoing treatment that involves HOT. Teijin is the top name in Japan in terms of market share. The Company has also expanded its focus to include overseas markets and currently provides home health care services in the United States, Spain and the ROK.
Q How did the pharmaceuticals and home health care businesses perform in fi scal 2010?
A Both the pharmaceuticals and home health care businesses reported solid
sales. However, owing to the revision of drug reimbursement prices—the offi cial
prices for prescription drugs under Japan’s National Health Insurance (NHI)
scheme—combined operating income dipped slightly.
In pharmaceuticals, sales of osteoporosis treatments Bonalon® and Onealfa®,
an active vitamin D3 preparation, were stable. We also saw encouraging sales
of Synvisc Dispo™, an intra-articular injection-form drug for treating pain associ-
ated with osteoarthritis of the knee, which we launched in Japan in December
2010. We continued to expand the geographic scale of marketing efforts for
TMX-67, an exciting new drug for treating hyperuricemia in patients with gout,
in North America, where it is called ULORIC ®, and in Europe, where it is known
as ADENURIC®, and were rewarded with solid sales in both markets. In January
2011, we received approval to manufacture and market TMX-67 in Japan under
the name FEBURIC®.
In home health care, we continued to see high rental volumes for mainstay
HOT equipment. We also saw favorable increases in rentals of other home
health care equipment, namely continuous positive airway pressure (CPAP)
ventilators, noninvasive positive pressure ventilators (the NIP NASAL® series
and AutoSet™ CS) and SAFHS® (Sonic Accelerated Fracture Healing System).
Rentals also expanded steadily in the United States, Spain and the ROK.
Kentaro Arao
General Manager,
Medical and Pharmaceuticals
Business Group
Medical and Pharmaceuticals Business Group
Principal Products
Respiratory disease
Pharmaceuticals
Mucosolvan® Expectorant
Spiropent® Bronchodilator
Atrovent® Prophylaxis for bronchial constriction
Rhinocort® Treatment for allergic rhinitis
Alvesco® Inhaled corticosteroid agent for asthma
Home Health Care
Hi-Sanso™ series Therapeutic oxygen concentrator
Mildsanso® Therapeutic oxygen concentrator
NIP NASAL® Noninvasive positive pressure ventilator (NPPV)
for sufferers of sleep apnea syndrome (SAS)
SLEEPMATE® Positive pressure ventilator for sufferers of SAS
AutoSet™ Positive pressure ventilator for sufferers of SAS
GoodKnight® Positive pressure ventilator for sufferers of SAS
SleepWatcher® High-performance sleep disorder diagnostic system
Bone and joint disease
Pharmaceuticals
Bonalon®* Treatment for osteoporosis
Onealfa® Treatment for osteoporosis
Synvisc Dispo™ Treatment for pain associated with osteoarthritis
of the knee
Home Health Care
SAFHS® Sonic Accelerated Fracture Healing System
Cardiovascular and metabolic disease
FEBURIC® Treatment for hyperuricemia
Tricor® Treatment for hyperlipidemia
Other
Venilon® Treatment for severe infectious diseases
Laxoberon® Laxative
Bonalfa® Treatment for psoriasis
* Bonalon® is the registered trademark of Merck & Co., Inc.,
Whitehouse Station, NJ, U.S.A.

16 Teijin Limited
Q What do you see as your principal challenges in fi scal 2011 and how will you respond?
A Our biggest challenges will be to swiftly expand sales of the two most recent
additions to our portfolio—FEBURIC® (TMX-67) and Synvisc Dispo™—in Japan.
We will also seek to expand marketing of TMX-67, developed in-house, which
we have positioned as a strategic product, bolstering sales in Japan, North
America and Europe while gaining approval to market the drug in other regions.
In home health care, we will work to ensure sustainable growth and safe-
guard our position as a domestic market leader for HOT and at the same time
promote the expansion of our overseas network to strengthen the profi tability
of our operations in the United States and Europe. We will also take active steps
to launch rentals in other regions, including emerging economies.
Q What is the status of drug candidates currently in the R&D pipeline?
A We continue to emphasize three key therapeutic areas, namely, bone and
joint disease, respiratory disease and cardiovascular and metabolic disease. To
enhance our R&D pipeline, we are conducting research in-house and in collabo-
ration with universities, research institutes and other pharmaceuticals manufac-
turers in Japan and overseas. In May 2010, we commenced phase I clinical trials
for GTH-42J, a new jelly version of osteoporosis treatment Bonalon®. In February
2011, we fi led for approval of GTH-42V, a new injection-form of Bonalon®, with
Japan’s Ministry of Health, Labour and Welfare, while in the preceding month we
received approval from the Ministry to manufacture and market inhaled steroid
Alvesco®, for treating bronchial asthma in children, a new indication. We also
proceeded with the development of NTC-801, a novel drug for the treatment
and prevention of atrial fi brillation and fl utter, now in phase II clinical trials, that
we are developing in collaboration with Nissan Chemical Industries, Ltd.
Feb 2011
Sept 2010
Jan 2011
Jan 2011
May 2010
R&D PipelineAs of March 31, 2011
Area Code No. Target DiseaseMedical Properties/Characteristics
Phase of Clinical Trials Approved/New LaunchPhase I Phase II Phase III Filed
Bone and joint
disease
GTH-42V Osteoporosis Alendronate
ITM-058 Osteoporosis Human PTHrP analog
GTH-42J Osteoporosis Alendronate
Respiratory disease BTR-15K Asthma (children) Inhaled steroid
Cardiovascular and
metabolic disease
TMX-67 Hyperuricemia and gout Xanthine oxidase inhibitor (Japan)
ITM-014 AcromegalySustained-release formulation of
somatostatin analog
ITM-077 Type II diabetes Human glucagon-like peptide-1 analog
NTC-801 Atrial fi brillation and fl utter Selective antiarrythmia agent
Other
GGS Multiple sclerosis Human immunoglobulin
TV-02H Psoriasis vulgaris Tacalcitol monohydrate (PRC)
y

17Teijin Limited
Building on its technological expertise as a manufacturer and its outstanding planning prowess, the core company of this business group, N.I. Teijin Shoji Co., Ltd., is evolving its innovative business model, whereby it is leveraging its ability to propose sophisticated multifaceted solutions that build value for its customers. These efforts are guided by what the company calls its “3C” approach:• Coordinating our value chain;• Compounding materials, technologies and human resources to cultivate
new business opportunities; and • Converting, i.e., maximizing our converter functions to add value. In the textiles and apparel business, N.I. Teijin Shoji has established a broad global production and sales network that facilitates its involvement in a wide range of apparel-related businesses. In the industrial textiles and materials business, the company capitalizes on the extensive network it has cultivated in the area of textile materials for industrial applications, as well as its unique converter functions, to provide a variety of products for consumer and industrial applications.
Q How did the businesses in this group perform in fi scal 2010?A In textiles and apparel, in our mainstay OEM business, sales of casual and
everyday apparel, suits and other items remained brisk. In industrial textiles and
materials, demand—which had fallen, owing to the global economic downturn—
recovered encouragingly, particularly for products for automotive applications,
as well as for use in liquid crystal display (LCD) televisions and mobile phone
handsets. Thanks to these results, and to the positive impact of ongoing struc-
tural reforms, which substantially lowered business costs, we reported increases
in sales and operating income.
Q What do you see as your principal challenges in fi scal 2011 and how will you respond?
A Our vision for achieving sustainable growth is to respond to the increasingly
diverse needs of our markets and customers, as well as to the rapid trend
toward globalization, and to confi rm our position as Japan’s leading specialized
fi ber products trading company. Accordingly, we will seek to cultivate commer-
cial rights by promoting the strategic use of our global network, including collab-
orating with the High-Performance Fibers and the Polyester Fibers business
groups, and by reinforcing our production and processing facilities, particularly
those in the PRC and in ASEAN member countries. We will also continue to
improve asset effi ciency and reduce business and logistics costs, thereby
enhancing profi tability. Over the medium to long term, our efforts will focus on
strategically expanding our overseas businesses, enlarging our industrial textiles
and materials business, adapting to changes in consumer markets and sales
channels and actively promoting supply chain management in cooperation with
principal customers.
Tetsushi Takenaka
General Manager,
Fiber Products Marketing
Business Group
Fiber Products Marketing Business Group
18 Teijin Limited
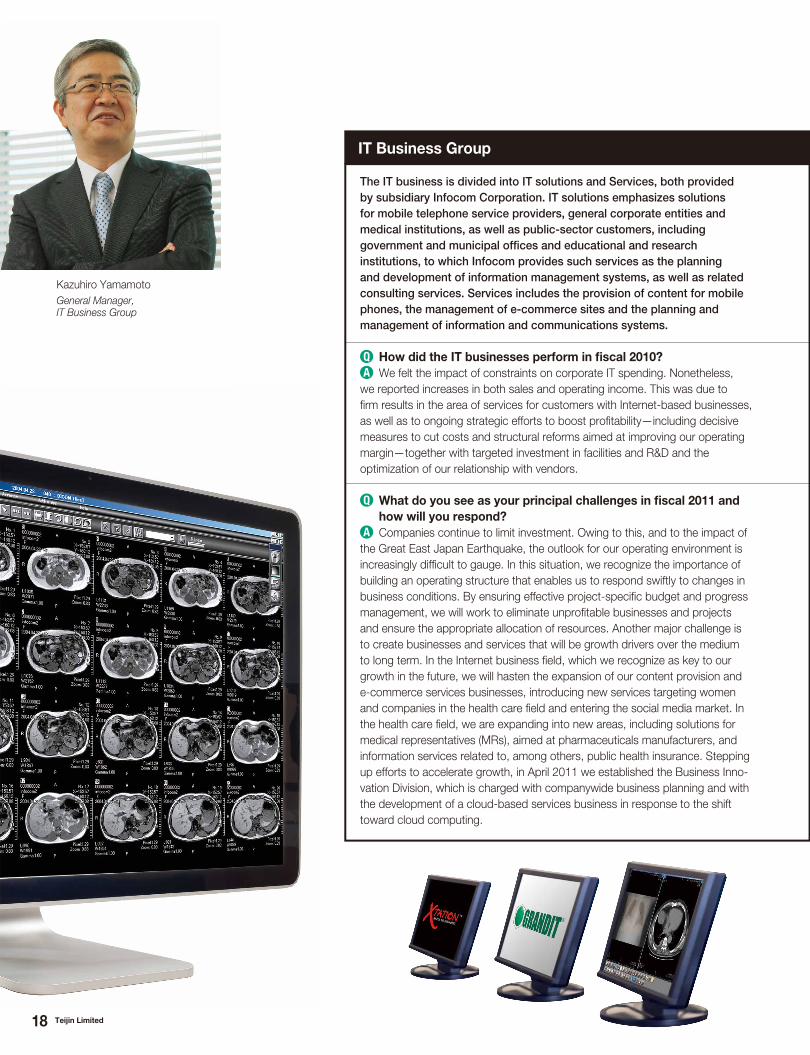
The IT business is divided into IT solutions and Services, both provided by subsidiary Infocom Corporation. IT solutions emphasizes solutions for mobile telephone service providers, general corporate entities and medical institutions, as well as public-sector customers, including government and municipal offi ces and educational and research institutions, to which Infocom provides such services as the planning and development of information management systems, as well as related consulting services. Services includes the provision of content for mobile phones, the management of e-commerce sites and the planning and management of information and communications systems.
Q How did the IT businesses perform in fi scal 2010?A We felt the impact of constraints on corporate IT spending. Nonetheless,
we reported increases in both sales and operating income. This was due to
fi rm results in the area of services for customers with Internet-based businesses,
as well as to ongoing strategic efforts to boost profi tability—including decisive
measures to cut costs and structural reforms aimed at improving our operating
margin—together with targeted investment in facilities and R&D and the
optimization of our relationship with vendors.
Q What do you see as your principal challenges in fi scal 2011 and how will you respond?
A Companies continue to limit investment. Owing to this, and to the impact of
the Great East Japan Earthquake, the outlook for our operating environment is
increasingly diffi cult to gauge. In this situation, we recognize the importance of
building an operating structure that enables us to respond swiftly to changes in
business conditions. By ensuring effective project-specifi c budget and progress
management, we will work to eliminate unprofi table businesses and projects
and ensure the appropriate allocation of resources. Another major challenge is
to create businesses and services that will be growth drivers over the medium
to long term. In the Internet business fi eld, which we recognize as key to our
growth in the future, we will hasten the expansion of our content provision and
e-commerce services businesses, introducing new services targeting women
and companies in the health care fi eld and entering the social media market. In
the health care fi eld, we are expanding into new areas, including solutions for
medical representatives (MRs), aimed at pharmaceuticals manufacturers, and
information services related to, among others, public health insurance. Stepping
up efforts to accelerate growth, in April 2011 we established the Business Inno-
vation Division, which is charged with companywide business planning and with
the development of a cloud-based services business in response to the shift
toward cloud computing.
Kazuhiro Yamamoto
General Manager,
IT Business Group
IT Business Group

19Teijin Limited
The New Business Development Group has three basic missions. The fi rst is to leverage our incubation capabilities to facilitate the swift creation of new businesses. The second is to conduct investigative research aimed at developing basic technologies that will enable new businesses to germinate. Our third mission is to promote research with a long-term perspective in areas that straddle existing Group businesses. To fulfi ll these missions, we conduct R&D aimed at transforming technological achievements in various fi elds into commercial products. Such efforts are conducted principally at the Teijin Technology Innovation Center and the Integrative Technology Research Institute.
Q How are efforts to develop new businesses progressing?A We are reinforcing R&D with the aim of promptly commercializing achieve-
ments in fi ve key areas—bioplastics, high-performance electronics materials,
highly thermoconductive materials, water treatment and advanced medical
materials.
In the area of bioplastics, we have successfully marketed BIOFRONT®,
which delivers exceptional heat resistance, for use in eyeglass frames and fabric
for Japanese kimono, and are cultivating new markets with a view to full-scale
commercialization. In high-performance electronics materials, we are emphasiz-
ing the development of thermoresistant separators for lithium-ion batteries
(LiBs), responding to demands for enhanced battery safety. We are working
toward the early commercialization of LiB separators made with aramid materials,
thus ensuring superior heat resistance and durability. In July 2010, we acquired
NanoGram Corporation, a U.S. nanoparticles R&D fi rm noted for its innovative
nanomaterials design technologies, with the aim of expediting the development
of silicon inks for semiconductors and commencing commercial production.
This technology will also help to signifi cantly reduce the cost of LCDs and
solar cells, among others. In highly thermoconductive materials, we collaborated
in the development of a heat-dissipating material made with Raheama®, an
innovative carbon fi ber material, for use in light-emitting diode (LED) lamp hous-
ings. In water treatment our aim is to provide comprehensive wastewater treat-
ment solutions. Of particular note, our MSABP® (Multi-Stage Activated Biological
Process) system—which uses the action of microorgan-
isms, thereby making it possible to effectively treat effl u-
ent with high concentrations of organic substances—was
recently selected for use in such countries as Angola and
the PRC. In advanced medical materials, we are currently
promoting development efforts to facilitate our early entry
into the global market. Related measures include the
instigation in April 2010 of a new R&D project.
Kenji Kubo
General Manager,
New Business Development Group
New Business Development Group

20 Teijin Limited Teijin Limited 20
Research and Development
Recognizing technological innovation as the source of sustainable growth, we continue to promote R&D in two domains—green chemistry and health care—emphasizing three core technological areas, namely, high-performance materials, green businesses and energy and life sciences. With the aim of enhancing the effi ciency of R&D activities and shortening time to market, in fi scal 2010 we revised our R&D management system. We also expanded the Group Technological Strategy Committee to reinforce the sharing of information pertaining to market trends and intellectual property throughout the Teijin Group.
R&D Strategy: Focus on High-Performance Materials, Green Businesses and Energy and Life Sciences
At present, we have nine major research sites in Japan and seven
overseas, which together employ more than 1,600 researchers.
We endeavor to conduct R&D that evokes our brand statement—
“Human Chemistry, Human Solutions”—
and to advance the development of original
business models. We also work to expedite
the transformation of technological achieve-
ments into commercially viable products.
For strategic purposes, we have
grouped highly promising markets in
our three core technological areas into four key fi elds: automobiles
and aircraft; information and electronics; health care; and environ-
ment and energy. By concentrating resources in these areas, we
seek to provide solutions that respond to changing social impera-
tives. Having identifi ed a number of crucial technologies that will be
necessary for restructuring our business portfolio, we are also work-
ing to accelerate product development by establishing and promot-
ing the effective management of development pipelines. To this
end, we are further enhancing key technologies and creating new
value by fusing basic technologies—including polymerization, cata-
lyzing and other chemical technologies, and technologies used in
pharmaceuticals, home health care and IT—with nanotechnology,
biotechnology and other next-generation technologies.
● Materials for solar/fuel cells
● Next-generation recording media/display materials
● LED lighting materials● Water treatment technologies● Recycling technologies
● Automobiles: Composite materials
● Aircraft: Carbon fibers/composite materials
● Electrical/electronics materials
● Biopolymers● Advanced
medical materials
Automobiles and Aircraft
Health Care
Environment and Energy
Information and Electronics
High-performance materials
Life sciences● Pharmaceuticals● Health care
equipment
Overlappingbusiness domains
Green businesses and
energy
Greeeenn ChChChemmisisistrtrtryyy
Core Technological Areas

21Teijin Limited
LED: Light-emitting diode LiB: Lithium-ion battery HEV/EV: Hybrid electric vehicle/electric vehicle PLA: Polylactic acid HOT: Home oxygen therapy
2010
Carbon fibers for windpower generators
Prepreg for aircraft
Aramid materials for protective applications
SULFRON (for rubber
reinforcements)
PET film for solar cells
Films fortouch screens
Multilayeredoptical films
Heat-resistant PLA
Films for HEV/EV motors
Recycling systems for wastewater
Film substratesfor
electronic paper
PLA
Biologicalwater treatment devices
TMX-67(hyperuricemia
in gout)(Europe/USA)
Home rehabilitation
robots
HOT devices for
global markets
TMX-67(hyperuricemia
and gout)(Japan)
ITM-077 (diabetes)
ITM-058 (osteoporosis)
DW1350(osteoporosis)
NTC-801(atrial fibrillation)
New drug for hyperuricemia
New home health care services
(home hemodialysis)
Advanced medical materials
Biopharmaceuticals
Thermal interface materials for LED lighting
Materials for LiB electrodes
LiBseparators
Aramid pulp New materialsfor protective applications
Structural materials for aircraft
Structural materials for automobiles
Compound materials for protective andsafety applications
Materials for thin-film solar cells
Materials for organic
semiconductors
Bioprocess wastewater treatment systems
Materials for alternative energies
Coatable electronics devices
Bioplastics derived from inedible vegetation
Prepreg for wind power generators
High-performance
materials
Green businesses and energy
Life sciences
2020
●
●
● ● ● ● ● ●
● ● ●
●
●
● ● ● ● ●
● ● ● ● ● ●
● ●
● ● ● ● ●
● ● ●
● ● ● ● ●
●
R&D Achievements in Three Core Technological Areas
High-Performance Materials
R&D in the area of high-performance materials focuses on balanc-
ing performance and price, as well as on adding value by making
products more environment-friendly. Building on our success in
developing a special polycarbonate resin that was adopted for use
in the windows of Series N700 Shinkansen bullet trains, we have
developed products for such applications as rear quarter windows
for vehicles. We have also developed production technologies for
carbon fi ber composite materials that will make vehicles lighter,
including the world’s fi rst mass-production technologies for thermo-
plastic CFRP that achieves a molding time of less than one minute.
By expanding into midstream and downstream processing for
materials for automotive parts and electrical and electronics
equipment, among others, we are determined to
earn greater customer and market confi dence
and to enhance product value.
Green Businesses and Energy
In green businesses and energy, we are pro-
moting cutting-edge R&D in such areas as
high-performance bioplastics derived from
inedible vegetation rather than petroleum;
silicon inks with semiconductor properties, essential for printable
electronics; biotechnology-based wastewater treatment systems;
heat-dissipating materials made from carbon fi bers; and LiB battery
materials made with heat-resistant aramid materials.
Life Sciences
In the life sciences fi eld, our focus is on the development of a cell-
based drug for treating stroke, using technologies licensed in from
SanBio, Inc., of the United States. In collaboration with Motorika
Medical (Israel) Ltd., we are also developing rehabilitation robots
designed to help stroke survivors regain lost function in their upper
and lower extremities.
Teijin’s Main Technology-Driven Product Development Pipelines
22 Teijin Limited
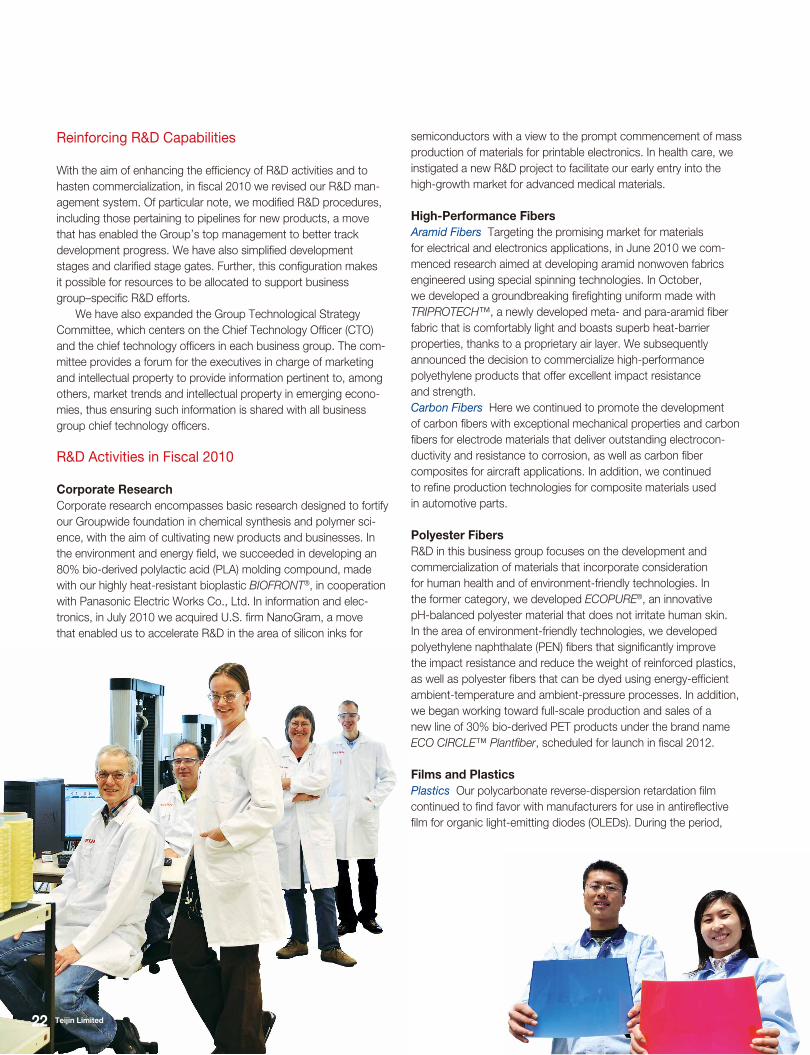
Reinforcing R&D Capabilities
With the aim of enhancing the effi ciency of R&D activities and to
hasten commercialization, in fi scal 2010 we revised our R&D man-
agement system. Of particular note, we modifi ed R&D procedures,
including those pertaining to pipelines for new products, a move
that has enabled the Group’s top management to better track
development progress. We have also simplifi ed development
stages and clarifi ed stage gates. Further, this confi guration makes
it possible for resources to be allocated to support business
group–specifi c R&D efforts.
We have also expanded the Group Technological Strategy
Committee, which centers on the Chief Technology Offi cer (CTO)
and the chief technology offi cers in each business group. The com-
mittee provides a forum for the executives in charge of marketing
and intellectual property to provide information pertinent to, among
others, market trends and intellectual property in emerging econo-
mies, thus ensuring such information is shared with all business
group chief technology offi cers.
R&D Activities in Fiscal 2010
Corporate Research
Corporate research encompasses basic research designed to fortify
our Groupwide foundation in chemical synthesis and polymer sci-
ence, with the aim of cultivating new products and businesses. In
the environment and energy fi eld, we succeeded in developing an
80% bio-derived polylactic acid (PLA) molding compound, made
with our highly heat-resistant bioplastic BIOFRONT®, in cooperation
with Panasonic Electric Works Co., Ltd. In information and elec-
tronics, in July 2010 we acquired U.S. fi rm NanoGram, a move
that enabled us to accelerate R&D in the area of silicon inks for
semiconductors with a view to the prompt commencement of mass
production of materials for printable electronics. In health care, we
instigated a new R&D project to facilitate our early entry into the
high-growth market for advanced medical materials.
High-Performance Fibers
Aramid Fibers Targeting the promising market for materials
for electrical and electronics applications, in June 2010 we com-
menced research aimed at developing aramid nonwoven fabrics
engineered using special spinning technologies. In October,
we developed a groundbreaking fi refi ghting uniform made with
TRIPROTECH™, a newly developed meta- and para-aramid fi ber
fabric that is comfortably light and boasts superb heat-barrier
properties, thanks to a proprietary air layer. We subsequently
announced the decision to commercialize high-performance
polyethylene products that offer excellent impact resistance
and strength.
Carbon Fibers Here we continued to promote the development
of carbon fi bers with exceptional mechanical properties and carbon
fi bers for electrode materials that deliver outstanding electrocon-
ductivity and resistance to corrosion, as well as carbon fi ber
composites for aircraft applications. In addition, we continued
to refi ne production technologies for composite materials used
in automotive parts.
Polyester Fibers
R&D in this business group focuses on the development and
commercialization of materials that incorporate consideration
for human health and of environment-friendly technologies. In
the former category, we developed ECOPURE®, an innovative
pH-balanced polyester material that does not irritate human skin.
In the area of environment-friendly technologies, we developed
polyethylene naphthalate (PEN) fi bers that signifi cantly improve
the impact resistance and reduce the weight of reinforced plastics,
as well as polyester fi bers that can be dyed using energy-effi cient
ambient-temperature and ambient-pressure processes. In addition,
we began working toward full-scale production and sales of a
new line of 30% bio-derived PET products under the brand name
ECO CIRCLE™ Plantfi ber, scheduled for launch in fi scal 2012.
Films and Plastics
Plastics Our polycarbonate reverse-dispersion retardation fi lm
continued to fi nd favor with manufacturers for use in antirefl ective
fi lm for organic light-emitting diodes (OLEDs). During the period,
22222222222222222222222222222222222222222222222222222222222222222222222222222222222222222222222222222222222222222222222222222222222222222222222222222 eiTeTTeijTeijTeijTeijTeTeijeTeTeijTeijeijTTTTeijeTeTTeijeijTeTeijeijeTeTTeTTTeTeijTTeTTeijTTTeTeTTeTTTTeijTTTeijTeijTeTeee jTeeijjjin Lin Linin Lin Lin Lin Lin Lin Lin Ln n Ln Ln Ln LLn Linin Ln Lin Ln Ln Ln Ln LLLin Linn Linin Ln LLinin Ln LLLLinn LLini LLiiin Lin Lin Lin Ln Limitimitimitimitimitmitimitmmitmimmimitmimitmitmiimmitimittimitimimitmitmmimitmitimitmmimiitimittiimitimitmitmimitmmiiimitimitimimitmimmmimmititmiitmmiiimitmmmimmitiiimitmimimmm timitm timitttimitmmmitimitmitmiimittimmmmittimitmm ttimitimittimmittitmmittimitimmm tteded ed edededed ed edded eddededeedeededdeeddedeeedddeddedededddeeddedededdedeedeeee22 Teijin Limited

23Teijin Limited 23Teijin Limited
250
500
750
1,000
Number of applications
0
15
30
45
60
02006 2007 2008 2009 20112010
%OthersKey technological themes Key technological themes as a
percentage of total applications
this fi lm also earned Teijin an award of the Society of Polymer
Science, Japan.
R&D efforts in this business yielded the Panlite® ML-5200
series of light-diffusion grade polycarbonate resin products for LED
lighting applications that combine superb fl ame resistance with
high transparency. We also commenced production and marketing
of Panlite® SP-3810, a newly developed polycarbonate resin with
a high refractive index and extremely low birefringence for use in
mobile phone and other camera lenses that accommodates the
trend toward higher picture quality and smaller lens size. Further,
we succeeded in developing mass-production technologies for a
new biopolycarbonate resin that is made primarily with bio-derived
isosorbide and boasts outstanding durability, transparency and
moldability.
Films In the area of products for optical applications, we
commercialized a new ultrahigh-transparency fi lm for FPDs and
touch screens. For environmental and energy-related applications,
we began mass production of a new highly durable fi lm for solar
cell back sheets. For information-related applications, we pro-
ceeded with efforts to develop next-generation base fi lms for data
storage media. Additionally, we focused on promoting the use of
Teonex® PEN fi lm in printable electronics and the automotive sector
and of Tefl ex® formable PET fi lm in automotive interior and exterior
materials and components. We also worked to perfect technologies
to facilitate the use of multilayered fi lms in a variety of new areas.
Pharmaceuticals and Home Health Care
Pharmaceuticals In May 2010, we commenced phase I clinical
trials for GTH-42J, a new jelly formulation of osteoporosis treatment
Bonalon®.* In January 2011, we received approval from Japan’s
Ministry of Health, Labour and Welfare to manufacture and market
TMX-67 for treating hyperuricemia and gout in Japan. The same
month, the Ministry approved the use of Alvesco®, an inhaled
steroid bronchial asthma treatment, for asthma in children—a new
indication.
Home Health Care In April 2010, we augmented our rental
lineup for home oxygen therapy (HOT) with Hi-Sanso™ 5Fx, an
energy-effi cient high-performance oxygen concentrator. In July
2010, we introduced Hi-Sanso™ 7R, an oxygen concentrator that
delivers enhanced levels of safety, security and energy effi ciency,
as well as an around-the-clock remote oxygen-concentrator
monitoring system that uses Japan’s mobile phone network.
In line with our forward-looking growth strategies, we have desig-
nated a number of core technological areas and key fi elds in which
we are working to create, protect and make effective use of
intellectual property.
The driving force behind these efforts is Teijin Intellectual Prop-
erty Center Limited, which works closely with intellectual property
specialists in individual business groups to expand our patent
portfolios and extend patent terms by fostering inventions and
new technologies, products and processes; applying for patents;
securing intellectual property rights; and analyzing competitors’
patent information. To enhance the effectiveness of intellectual
property management, we are selective in seeking patent
protection, maintaining a high percentage of applications for
achievements related to key Groupwide technological themes.
The Teijin Intellectual Property Center has established an intel-
lectual property strategy offi ce, which is tasked with ensuring infor-
mation pertaining to achievements and challenges with respect
to intellectual property is shared with management. The offi ce is
establishing a mechanism for clarifying the current state of our
intellectual property portfolio and determining strategic directions.
33%
27%4%
New BusinessDevelopment
and others
Pharmaceuticals and Home Health Care
Films and Plastics
16%
20%
Polyester Fibers
High-Performance Fibers
High-Performance Fibers 115
Polyester Fibers 95
Films and Plastics 159
Pharmaceuticals and Home Health Care
26
New Business Development and others
187
Total 582
Patent Applications in Fiscal 2010 (Japan)
Patent Applications Related to Key Technological Themes
* Bonalon® is the registered trademark of Merck & Co., Inc., Whitehouse Station,
NJ, U.S.A.
Intellectual Property

24 Teijin Limited
We believe effective corporate governance is essential if a company is to steadily increase its returns to shareholders on their investments over the medium to long term, as well as to fulfi ll its responsibilities to its various stakeholders. To these ends, we have implemented pioneering reforms aimed at enhancing transparency, ensuring fairness and objectivity and accelerating decision making. These include establishing an Advisory Board, reducing the number of directors on Teijin’s Board of Directors, introducing a corporate offi cer system and adopting a compensation system for directors that is linked to our business performance.
Board of Directors and Corporate Offi cers
To expedite decision making and clarify responsibility for frontline
management, we have set the number of directors on Teijin’s Board
of Directors at a maximum of 10. We have also introduced a corpo-
rate offi cer system and have delegated considerable authority and
responsibility to those offi cers. To ensure the appropriate separation
of responsibility for frontline management and monitoring/supervising,
the Board of Directors is directly responsible to the chairman, who
does not participate in internal, operations-level decision making.
Three of the directors on the Board are independent and
appointed from outside the Company. Responsibility for supervising
the internal directors is vested with these independent outside direc-
tors, who also draw on the exceptional insight they bring to the
position to advise on management-related issues, thereby helping
to increase the transparency and accountability of the Board.N
ine
Bu
sin
ess G
rou
ps
Majority of members are external
Corporate Governance System
Holding Company System
Ten members(of whom three are external)
Five members(of whom three are external)
Advisory Board
Shareholders’Meeting
Board of Directors
Board of Auditors
CEOTRM Committee
CEO, CSRO, CTO, CFO, CHO,General Manager of
Corporate Strategy Division
Nomination and Remuneration
Group Board of Auditors
Management CommitteeHeads of Business Groups
and Chief Officers
CEO Corporate
Strategic CommitteeChief Officers
New Business
Development
IT Business
Fiber Products
Marketing
Medical and
Pharmaceuticals
Films
Plastics
Polyester Fibers
Carbon Fibers
and Composites
Aramid Fibers
The Teijin Group’s Corporate Governance SystemAs of July 2011
Teijin’s Three-Pronged Approach to Management
Audit System and Board of Auditors
Teijin’s Board of Auditors comprises fi ve members, three of whom
are independent outside corporate auditors, thereby ensuring trans-
parency and the effective monitoring and auditing of all aspects of
management, including Total Risk Management (TRM). To further
enhance the effi cacy of monitoring and auditing, full-time corporate
auditors not only attend meetings of the CEO Corporate Strategic
Committee and the Management Committee, but also coordinate
meetings of the Group Board of Auditors and may, in addition, serve
concurrently as outside corporate auditors for core Group companies.
Businessstrategies
Corporategovernance CSR
Corporate Governance
Board of Directors Board of Auditors Advisory Board
Total number of individuals 10 5 7
Number of independent
outside individuals 3 3 5
Percentage of independent
outside individuals 30% 60% 70%
Note: Teijin has formulated its own requirements concerning the independence of
outside directors and corporate auditors that are comparable with those mandated
by U.S. stock exchanges.
Percentage of Independent Outside Members on Teijin’s BoardsAs of July 2011

25Teijin Limited
One focus of the management reforms we initiated in 1999 was
the creation of a fi rst-class corporate governance system, a move
designed to bring Teijin in line with other top global players. Our
Advisory Board performed a key role in this effort. In addition to
leading experts from Japan, the Advisory Board’s original mem-
bers included John A. Krol, former chairman of global chemicals
giant DuPont, and Sir Ronald Hampel, previously chairman of ICI
and of the Hampel Committee, which established certain key
principles of corporate governance in the United Kingdom. Both
these gentlemen took a very active role in Advisory Board discus-
sions. Subsequent Advisory Board members have also made
valuable contributions that have consistently enhanced both
our corporate governance system and corporate value.
Toru NagashimaChairman of Teijin
John W. HimesFormer senior vice-president
of DuPont
Lord Leon BrittanChairman of UBS Limited,
Vice-chairman of UBS
Investment Bank
Corporate Governance Milestones
1993 Establishes corporate philosophy, Standards of Conduct and
Corporate Code of Conduct
1998 Establishes Corporate Ethics Committee and formulates
Corporate Standards of Conduct
1999 Installs Advisory Board and introduces corporate offi cer system
2003 Adopts holding company system and issues Teijin Group
Corporate Governance Guide
2007 Updates Teijin Group Corporate Governance Guide
2009 Updates Teijin Group Corporate Governance Guide
Advisory Board
The Advisory Board is a consultative body that is tasked with
advising on all aspects of management and evaluating the perfor-
mance of top executives. The Board, which has two ordinary
meetings each year, comprises fi ve or six leading experts from
outside the Company—of whom three are Japanese and two or
three non-Japanese—as well as Teijin’s chairman and the presi-
dent, who also serves as CEO. The Advisory Board additionally
functions as a nomination and remuneration committee and is
charged with deliberating the replacement of the CEO and putting
forward successors, proposing candidates for chairman, reviewing
systems and standards governing remuneration for directors and
evaluating the performance of the CEO and representative direc-
tors. Compensation for directors is based on consolidated ROA,
calculated using operating income; consolidated ROE; and consol-
idated operating income—i.e., on an examination of whether those
targets have been met and/or improvements seen—as well as on
a qualitative assessment of each individual director’s execution of
his or her duties.
Compliance and Total Risk Management
We operate on the principal that effective corporate governance
depends on strict compliance and comprehensive risk manage-
ment. Individuals employed by the Teijin Group are required not
only to comply with relevant laws and regulations, but also to act
with good faith as a businessperson and a member of society in
accordance with ethical and social norms. In line with this convic-
tion, we formulated the Corporate Code of Conduct and the Cor-
porate Standards of Conduct, which set forth consistent guidelines
for the entire Teijin Group, and work diligently to reinforce aware-
ness of compliance issues among management and employees.
As a countermeasure to the risks and uncertainties we face
as a corporate entity, we established our TRM Committee,
which answers directly to the Board of Directors and which
is charged with the comprehensive management of strategic
and operational risk.
Kunio SuzukiCounselor of Mitsui O.S.K. Lines, Ltd.
Hajime SawabeDirector and Chairman of the Board
of TDK Corporation
Yutaka IimuraSpecial Envoy of the Government
of Japan (Middle East, Europe)
Shigeo OhyagiPresident and CEO of Teijin
Teijin’s Disclosure Policies
1. In disclosing information, Teijin’s basic policy is to disclose
the same content both in and outside Japan simultaneously.
2. In addition to disclosing legally stipulated fi nancial information,
Teijin proactively discloses corporate information from the
perspective of good CSR.
3. Teijin’s general meetings of shareholders are open meetings,
wherein communicating with shareholders is our fi rst priority.
Advisory Board MembersAs of July 2011
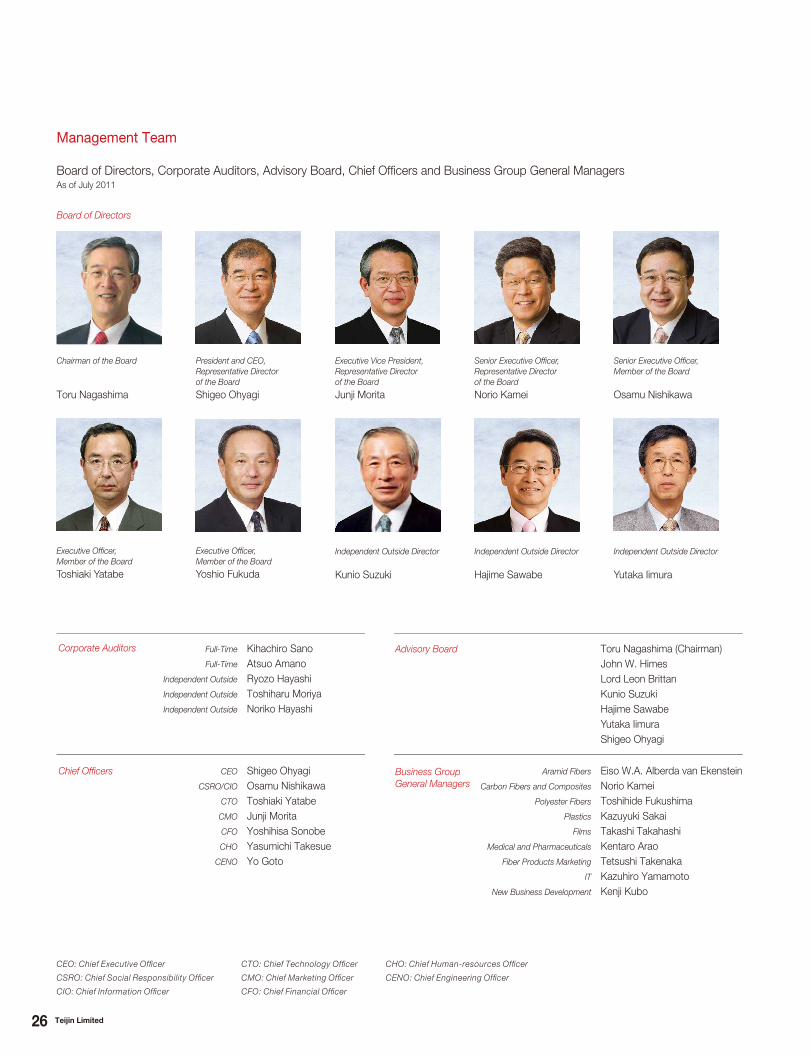
26 Teijin Limited
Management Team
Board of Directors, Corporate Auditors, Advisory Board, Chief Offi cers and Business Group General ManagersAs of July 2011
Board of Directors
Chairman of the Board
Toru Nagashima
President and CEO,
Representative Director
of the Board
Shigeo Ohyagi
Executive Vice President,
Representative Director
of the Board
Junji Morita
Senior Executive Officer,
Representative Director
of the Board
Norio Kamei
Senior Executive Officer,
Member of the Board
Osamu Nishikawa
Executive Officer,
Member of the Board
Toshiaki Yatabe
Independent Outside Director
Kunio Suzuki
Executive Officer,
Member of the Board
Yoshio Fukuda
Independent Outside Director
Hajime Sawabe
Independent Outside Director
Yutaka Iimura
CEO: Chief Executive Offi cer
CSRO: Chief Social Responsibility Offi cer
CIO: Chief Information Offi cer
CTO: Chief Technology Offi cer
CMO: Chief Marketing Offi cer
CFO: Chief Financial Offi cer
CHO: Chief Human-resources Offi cer
CENO: Chief Engineering Offi cer
Corporate Auditors Full-Time Kihachiro Sano
Full-Time Atsuo Amano
Independent Outside Ryozo Hayashi
Independent Outside Toshiharu Moriya
Independent Outside Noriko Hayashi
Advisory Board Toru Nagashima (Chairman)
John W. Himes
Lord Leon Brittan
Kunio Suzuki
Hajime Sawabe
Yutaka Iimura
Shigeo Ohyagi
Business Group
General Managers
Aramid Fibers Eiso W.A. Alberda van Ekenstein
Carbon Fibers and Composites Norio Kamei
Polyester Fibers Toshihide Fukushima
Plastics Kazuyuki Sakai
Films Takashi Takahashi
Medical and Pharmaceuticals Kentaro Arao
Fiber Products Marketing Tetsushi Takenaka
IT Kazuhiro Yamamoto
New Business Development Kenji Kubo
Chief Offi cers CEO Shigeo Ohyagi
CSRO/CIO Osamu Nishikawa
CTO Toshiaki Yatabe
CMO Junji Morita
CFO Yoshihisa Sonobe
CHO Yasumichi Takesue
CENO Yo Goto

27Teijin Limited
CSR Management
The Evolution of Teijin’s CSR Program
The basic goals underlying our approach to CSR are articulated
by the phrases, “Quality of Life,” “In Harmony with Society,” and
“Empowering our People,” which comprise the Teijin Group corpo-
rate philosophy, set forth in 1993. To achieve the goals entailed
in this philosophy, we have formulated a basic policy for CSR and
are implementing a variety of systematic, well-planned initiatives.
In April 2005, we inaugurated the role of Chief Social Responsibility
Offi cer (CSRO) and created an internal organization to coordinate
all aspects of our CSR program, including corporate ethics; compli-
ance; risk management; environment, safety and health (ESH); and
other efforts to contribute to society. We have also developed spe-
cifi c policies, targets and strategies and continue to promote a wide
range of related activities. In March 2011, we announced that we
joined the United Nations Global Compact, thus committing our-
selves to abiding by a set of universally accepted principles related
to human rights, labor practices, environmental concerns and the
prevention of corruption.
Advancing CSR Management
We have categorized our various CSR initiatives as addressing
“basic,” “advanced” or “selective” issues. Basic CSR issues include
those related to corporate ethics, ESH, environmental protection,
product liability and quality assurance. Advanced CSR issues
are those that arise in the process of refl ecting CSR in policies
governing personnel and labor, as well as purchasing and
logistics. Selective CSR issues encompass issues related
to social contribution and support. This categorization has
enabled us to clarify the focus of and appropriate course
of action for these initiatives, set medium-term goals and
enhance the effectiveness of our activities.
Environmental Preservation
Teijin’s Sustainable Environment Declaration
Having long recognized environmental issues as a cru-
cial management responsibility, in 1992 we formulated
the Teijin Group Global Environmental Charter. Today,
we remain committed to protecting the environment
through ambitious measures. In light of the increasing
severity of environmental problems, in July 2007 we
published our Sustainable Environment Declaration,
which outlines three principal elements: Environmental
preservation, environmental design and environmental
business. In line with these elements, we continue to
implement a variety of advanced initiatives. In the area
of environmental preservation, we engage in a wide
range of activities aimed at reducing the environmental
impact of our daily business processes. In particular,
we have set long-term targets for lowering emissions
Corporate Social Responsibility
Selective CSR issues
Advanced CSR issues
Social contribution
Personnel and occupational issues,
Purchasing and logistics
Basic CSR issues
Corporate ethics and compliance,Risk management, ESH,
Product liability issues andquality assurance
CSRO
Teijin Group CSR Committee
CSR Planning Office
ESH Office
Group Compliance and Risk Management Subcommittee
Group ESH Subcommittee
Group PL* and Quality Assurance Subcommittee
Group Security Export Control Conference
Group CSR Promotion Subcommittee
*PL is used here as an acronym for “product liability.”
SOCIALLY RESPONSIBLE INVESTMENT
As of July 2011, the Teijin Group is included in the Dow Jones Sustainability Indexes (criteria for inclusion:
economic, environmental and social performance); the FTSE4Good Index Series, which measures the performance of companies that meet globally recognized CSR standards
(criteria for inclusion: efforts to ensure environmental sustainability, development of positive relationships with
stakeholders and support for universal human rights); and the Ethibel Investment Register (criteria for inclusion: ethical economic policy, environmental policy, internal
social policy and external social policy).
Teijin’s CSR Framework
Teijin’s CSR Management System

28 Teijin Limited
1
2
3
4
Million tons Years ended March 31
0 1991 2006 2007 2008 2010 20112009
Overseas
Initial long-term target (domestic)
Domestic
of CO2 and harmful chemicals, as well as for reducing the amount
of waste disposed of as landfi ll, and are taking systematic steps to
ensure these targets are met.
We are committed to creating a working environment that sup-
ports personal growth and skill enhancement and which encour-
ages employees to achieve their full potential. We have a
scheme in place for managing human resources that respects
individual lifestyles and values. Currently, we are pursuing per-
sonnel initiatives designed to foster a global and highly diverse
labor force.
In a bid to promote global personnel strategies, in April 2009
we established an international human resources department,
while in April 2011 we introduced EaGLES, a global leadership
excellence training program. Aimed at employees newly
appointed to management-level positions at Group companies
in Japan and overseas, EaGLES seeks to instill necessary skills,
as well as promote awareness of Teijin’s corporate philosophies
and basic values. Training is available in four languages, namely,
Japanese, English, Mandarin and Thai. In fi scal 2011, we will
also introduce overseas training—in the form of secondment to
either India or the PRC—for new recruits.
Efforts to promote diversity began in 1999 with the establish-
ment of a committee to empower female employees. In 2007,
this committee was reorganized as the Diversity Promotion
Offi ce, which is responsible for creating a positive, enriching
work environment for all employees. We continue to implement
measures to ensure that all Teijin Group employees—regardless
of gender, nationality or ethnicity—are able to bring their full
capabilities into play.
CO2 Emissions from Teijin Manufacturing Operations Worldwide
EaGLES Global Leadership Excellence Standard for (Early) newly Assigned manager
Item Scope Minimum Target
CO2 emissions Japan 20% reduction from the fi scal 1990 level
Chemical substance emissions
Global 80% reduction from the fi scal 1998 level
Disposal of unusable industrial waste
Global 85% reduction from the fi scal 1998 level
Social Responsibility
To date, individual Teijin Group production facilities and companies
have taken the initiative in developing corporate citizenship activities
in their own communities. We also engage in complementary pur-
suits in line with a common Groupwide social contribution program
formulated and launched in 2006. The program places particular
emphasis on three areas, namely, environment, international
exchanges and social education, and centers on employee volun-
teer programs that contribute to the community. To support the
efforts of employees participating in such programs, we have
implemented a system that allows individuals to take days off or
extended leave for volunteer activities. We have also designed
systems to enable employees to become, for example, registered
bone marrow donors or volunteer fi refi ghters. Early in fi scal 2011,
we introduced the Volunteer Support Program, which is intended
to assist employees’ efforts to contribute to society and encourage
employee participation in volunteer activities. Expenses for volunteer
activities are covered in part by donations from concerned employ-
ees and directors. Looking ahead, we will continue to promote
initiatives to ensure Teijin contributes to the community in an active,
meaningful manner.
Step 1. E-Learning (offered in four languages)Comprises two parts: Teijin Standard, which encompasses
Teijin’s basic values, management policies and history; and
Leadership Basics, focusing on skills required for employees
newly assigned to management-level positions.
Step 2. Group Training (available in fi ve countries)Small groups of participants (10–15) share experiences through
group discussions, case studies and other activities designed
to build on knowledge and skills acquired through Step 1.
Step 3. Measuring Achievements (offered in four languages)Evaluates whether participants’ attitudes and conduct in the
workplace have changed as a result of participation in EaGLES
and whether they have fully taken newly acquired leadership
skills on board and are successfully putting them into practice.
Efforts are also made to ensure that awareness of the Teijin
Group’s philosophies, values and policies have fi ltered down
into participants’ workplaces.
Human Resources
Principal Environmental Targets of the Teijin Group for 2020

29Teijin Limited
Financial Section
Consolidated 11-Year Summary 30
Management’s Discussion and Analysis 32
Summary 32
Results of Operations 33
Business Segment Results 34
Financial Position 37
Tasks Ahead 37
Risk Factors 39
Consolidated Financial Statements 40
Consolidated Balance Sheets 40
Consolidated Statements of Operations 42
Consolidated Statements of Comprehensive Income 43
Consolidated Statements of Changes in Net Assets 44
Consolidated Statements of Cash Flows 46
Notes to Consolidated Financial Statements 47
Independent Auditors’ Report 75

30 Teijin Limited
Consolidated 11-Year Summary
Notes: 1. Prior to fi scal 2003, this segment was called “New Products and Other Businesses.” In fi scal 2003, the segment name was changed to “IT and New Products, etc.” In
fi scal 2010, the year ended March 31, 2011, the segment name was changed to “Others.”
2. In fi scal 2003, ended March 31, 2004, the allocation method for corporate expenses was changed.
3. Throughout this annual report, ROE is calculated as net income divided by average shareholders’ equity, and ROA is calculated as operating income divided by average
total assets. Shareholders’ equity = Total net assets at year-end – Subscription rights to shares at year-end – Minority interests at year-end.
4. Effective from fi scal 2010, the Company revised its method of accounting for segments. Segment information for fi scal 2009, the year ended March 31, 2010, has been
restated for the purpose of comparison.
Years ended March 31 2001 2002 2003 2004
Operating Results Net sales ¥ 761,410 ¥ 923,446 ¥ 890,434 ¥874,569
Gross profi t 205,404 211,660 209,491 212,682
Percentage of net sales 27.0% 22.9% 23.5% 24.3%
Operating income 43,713 29,497 35,298 38,745
Percentage of net sales 5.7% 3.2% 4.0% 4.4%
Net income (loss) 15,950 975 (20,977) 8,455
Percentage of net sales 2.1% 0.1% –2.4% 1.0%
Segment Information Sales:
Fibers and Textiles 343,911 509,891 489,485 —
Synthetic Fibers — — — 247,530
High-Performance Fibers — — — —
Polyester Fibers — — — —
Films and Plastics 210,997 192,426 182,398 186,504
Pharmaceuticals and Home Health Care 88,643 94,542 92,464 93,104
Trading and Retail — — — 256,295
Machinery and Engineering 71,538 74,481 72,784 43,290
Others(1) 46,321 52,106 53,303 47,846
Total ¥ 761,410 ¥ 923,446 ¥ 890,434 ¥874,569
Operating income (loss):
Fibers and Textiles 430 7,435 8,221 —
Synthetic Fibers — — — 9,144
High-Performance Fibers — — — —
Polyester Fibers — — — —
Films and Plastics 17,560 (3,158) 3,734 4,020
Pharmaceuticals and Home Health Care 15,809 16,916 16,192 17,252
Trading and Retail — — — 5,320
Machinery and Engineering 4,744 2,568 3,723 3,861
Others(1) 4,684 4,919 3,528 5,456
Elimination and corporate(2) 486 817 (100) (6,308)
Total ¥ 43,713 ¥ 29,497 ¥ 35,298 ¥ 38,745
Financial Position Total assets ¥1,058,514 ¥1,104,633 ¥1,036,518 ¥914,502
Total current assets 416,784 459,334 435,187 342,127
Property, plant and equipment, net 391,383 433,022 432,999 393,820
Total current liabilities 386,477 495,591 444,140 330,862
Long-term loans payable 189,121 159,661 207,774 199,298
Shareholders’ equity 320,769 311,469 278,527 293,898
Cash Flows Cash fl ows from operating activities 79,446 52,394 58,316 44,973
Depreciation and amortization 48,777 51,185 53,028 52,794
Cash fl ows from investing activities (50,511) (51,284) (65,919) (16,715)
Purchase of property, plant and equipment (41,520) (50,862) (66,936) (47,569)
Cash fl ows from fi nancing activities (55,842) (6,197) 10,842 (32,325)
Net increase (decrease) in cash and cash equivalents (26,267) (3,957) 2,762 (4,451)
Per Share Data (Yen) Net income (loss): Primary ¥ 17.6 ¥ 1.1 ¥ (22.7) ¥ 9.0
Fully diluted 17.3 1.1 (22.7) 9.0
Shareholders’ equity 354.1 335.5 300.3 316.8
Cash dividends 6.5 6.5 6.5 6.5
Ratios Net income to shareholders’ equity (ROE)(3) 5.2% 0.3% –7.1% 3.0%
Operating income to total assets (ROA)(3) 4.2 2.7 3.3 4.0
Shareholders’ equity to total assets 30.3 28.2 26.9 32.1
Dividend payout ratio 37 607 — 72
Other Data R&D expenses (Millions of yen) ¥ 30,275 ¥ 31,864 ¥ 29,880 ¥ 32,830
Number of shares outstanding (Thousands) 905,993 928,299 928,299 928,299
Number of employees 22,256 24,026 23,265 20,551

31Teijin Limited
Millions of yen
2005 2006 2007 2008 2009 2010 2010(4) 2011
¥908,389 ¥938,082 ¥1,009,586 ¥1,036,624 ¥943,410 ¥765,840 ¥000,000 ¥815,656
222,607 250,365 258,737 256,428 218,636 191,901 000,000 229,394
24.5% 26.7% 25.6% 24.7% 23.2% 25.1% 00.0% 28.1%
51,865 76,757 75,061 65,162 17,966 13,436 00,000 48,560
5.7% 8.2% 7.4% 6.3% 1.9% 1.8% 0.0% 6.0%
9,159 24,853 34,125 12,613 (42,963) (35,684) (00,000) 25,182
1.0% 2.6% 3.4% 1.2% — — — 3.1%
— — — — — — ¥ — —
278,846 260,967 293,280 317,612 273,208 205,154 — —
— — — — — — 89,912 103,354
— — — — — — 122,092 103,502
216,432 264,511 287,902 293,834 258,004 177,791 177,791 217,109
97,104 105,589 113,093 114,403 127,146 131,711 131,711 136,446
261,199 259,828 266,492 265,931 239,163 205,314 205,314 216,922
— — — — — — — —
54,808 47,187 48,819 44,844 45,889 45,870 39,020 38,323
¥908,389 ¥938,082 ¥1,009,586 ¥1,036,624 ¥943,410 ¥765,840 ¥765,840 ¥815,656
— — — — — — — —
10,520 14,549 17,342 24,448 (2,780) (15,111) — —
— — — — — — (7,738) 4,423
— — — — — — (5,371) 3,017
19,145 40,950 33,900 20,247 226 7,997 8,910 23,447
18,148 19,318 21,192 21,691 24,838 24,201 24,324 22,910
6,145 5,316 5,395 5,255 3,873 3,441 3,441 4,744
— — — — — — — —
3,758 3,760 4,320 3,516 3,589 2,954 2,600 3,105
(5,851) (7,136) (7,088) (9,995) (11,780) (10,046) (12,730) (13,086)
¥ 51,865 ¥ 76,757 ¥ 75,061 ¥ 65,162 ¥ 17,966 ¥ 13,436 ¥ 13,436 ¥ 48,560
¥852,029 ¥943,991 ¥ 999,917 ¥1,015,991 ¥874,157 ¥823,071 ¥000,000 ¥761,535
369,860 399,002 417,409 417,395 351,120 332,746 000,000 336,895
322,652 346,498 379,632 382,568 339,704 316,901 000,000 259,659
320,828 397,919 426,748 417,534 325,074 293,848 000,000 244,771
158,959 108,715 102,105 117,200 177,081 188,480 000,000 168,871
290,586 338,609 366,753 391,010 305,577 271,306 000,000 284,236
73,313 75,491 96,456 53,740 40,392 80,433 000,000 77,132
52,287 50,389 54,009 62,668 67,364 61,879 000,000 56,410
12,708 (74,062) (87,065) (79,218) (116,304) (33,437) 000,000 (27,745)
(43,900) (66,620) (69,996) (78,821) (75,845) (34,119) 000,000 (25,456)
(79,643) 1,511 (19,074) 16,080 79,178 (42,949) 000,000 (42,063)
6,249 4,689 (9,309) (9,271) 1,274 4,128 000,000 5,378
¥ 9.7 ¥0 26.6 ¥ 36.8 ¥ 13.2 ¥ (43.7) ¥ (36.3) ¥ 00.0 ¥ 25.6
9.7 26.6 36.8 13.2 — — 25.6
313.3 364.8 395.2 397.3 310.5 276.2 288.8
6.5 7.5 10.0 8.0 5.0 2.0 5.0
3.1% 7.9% 9.7% 3.3% –12.3% –12.4% 00.0% 9.1%
5.9 8.5 7.7 6.5 1.9 1.6 0.0 6.1
34.1 35.9 36.7 38.5 35.0 33.0 0.0 37.3
67 28 27 61 — — — 20
¥ 30,024 ¥ 31,196 ¥ 35,097 ¥ 36,282 ¥ 37,630 ¥ 33,356 ¥ 00,000 ¥ 31,483
928,299 928,299 928,299 984,754 984,759 984,759 00,000 984,759
18,960 18,819 19,053 19,125 19,453 18,778 00,000 17,542

32 Teijin Limited
Management’s Discussion and Analysis
Operating Environment
In fiscal 2010, the year ended March 31, 2011, economic conditions
were generally favorable worldwide. The PRC and key ASEAN
countries continued to enjoy brisk domestic demand-led growth.
In the United States, the underlying tone remained encouraging,
while in Europe conditions overall remained stable, although the
impact of the financial crisis became an issue in certain countries.
The Japanese economy was firm, despite the rising value of the
yen, buttressed by exports and the implementation of economic
stimulus measures.
Strategies in Action
Having designated fiscal 2010 as the year in which we would
conclude structural reforms and accomplish a return to profitability
at the net income level, we pressed ahead with a variety of urgent
measures and structural reforms, including withdrawing from loss-
making businesses, reducing fixed costs and establishing optimal
global production configurations. Thanks to such initiatives, and to
steady efforts to respond to a recovery in demand—particularly in
our materials businesses—we achieved this target, restoring profit-
ability at the net income level. We also succeeded in maintaining
free cash flow on a par with the previous period.
Operating Results
Billions of yen
Years ended March 31 2010 2011 Change
Net Sales ¥765.8 ¥815.7 6.5%
Net sales totaled ¥815.7 billion, up 6.5% from fiscal 2009. This
increase occurred despite the negative impact of such factors as
our withdrawal from loss-making businesses and was attributable
to a recovery in demand in our materials businesses.
Billions of yen
Years ended March 31 2010 2011 Change
Operating Income ¥13.4 ¥48.6 3.6 times
Strengthened demand in our materials businesses and the benefits
of restructuring measures were the principal factors behind a
substantial increase in operating income.
Billions of yen
Years ended March 31 2010 2011 Change
Net Income ¥(35.7) ¥25.2 —We made a decisive return to profitability at the net income level.
Reasons for this included the upturn in operating income, signifi-
cantly better results at unconsolidated affiliates accounted for by
the equity method and a sharp decrease in extraordinary losses.
Summary Billions of yen
As of March 31 2010 2011 Change
Total Assets ¥823.1 ¥761.5 –7.5%
Total assets were down as a result of declines in the yen value of
assets denominated in foreign currencies and in fixed assets—the
former attributable to the appreciation of the yen and the latter
to a freeze on major capital investment—and to the advance of
depreciation and amortization.
Billions of yen
Years ended March 31 2010 2011
Free Cash Flow ¥47.0 ¥49.4Free cash flow remained close to ¥50.0 billion, despite a decrease
in net cash and cash equivalents provided by operating activities,
thanks to ongoing efforts to restrain capital investment.
Key Indicators
Years ended March 31 2010 2011
ROA 1.6 % 6.1 % ROE -12.4 % 9.1 % Debt-to-equity ratio 1.18 times 0.94 times
Owing to the sharp increase in operating income and our return
to profitability at the net income level, return on assets (ROA)—
calculated using operating income—improved markedly, while
return on equity (ROE) turned positive. The debt-to-equity ratio also
improved to below 1.0 times for the first time since the year ended
March 31, 2008, reflecting efforts to reduce interest-bearing debt.
Tasks Ahead
Our target for fiscal 2011 is to return Teijin to a growth trajectory.
During the period, we will focus on manifesting the positive results
of structural reforms, as well as on strengthening our sales capabili-
ties and R&D platform, and on ensuring efficient risk management.
We will also strive to respond swiftly and effectively to the devasta-
tion caused by the earthquake and tsunami of March 11, 2011,
and do our utmost to achieve the prompt restoration of normal
operations. Additionally, we will continue to place a high priority
on securing and enhancing financial soundness. At the same time,
we will actively foster businesses that support future growth, as
well as promising projects.

33Teijin Limited
Operating Income
Operating income soared 3.6 times, or ¥35.1 billion, to ¥48.6 billion.
Strengthened demand and the benefits of restructuring measures
were the principal factors behind this increase, underscoring a sub-
stantial gain in our materials businesses, particularly those accounted
for in the Films and Plastics segment. The High-Performance
Fibers and Polyester Fibers segments, which finished in the red
in fiscal 2009, improved markedly and returned to profitability.
As a consequence, the operating margin rose 4.2 percentage
points, to 6.0%.
Rising prices for raw materials and fuel had a negative impact
on operating income of ¥18.0 billion. This was offset by increases
in sales prices and shipments, as well as cost-cutting measures,
which together added ¥63.0 billion.
Other Income (Expenses)
Other expenses, a net figure, amounted to ¥4.1 billion, down
significantly from ¥50.0 billion in the previous fiscal year, despite an
earthquake-related loss of ¥2.9 billion. This reflected the absence
of a ¥10.7 billion special factory operating loss recognized in fiscal
2009, thanks to the progress of structural reforms, as well as to
declines in business structure improvement expenses and impair-
ment loss of ¥19.6 billion and ¥2.6 billion, respectively. Equity in
earnings of affiliates totaled ¥6.3 billion, compared to equity in
losses of affiliates of ¥3.4 billion in the previous period, largely attrib-
utable to an improvement in the income performance of our U.S.
and European films joint ventures.
Net Income
Owing to the substantial improvements in operating income, as well
as to equity in earnings of affiliates—as opposed to equity in losses
of affiliates—and a sharp decline in extraordinary expenses, we
reported net income of ¥25.2 billion, compared with net loss of
¥35.7 billion in fiscal 2009. As a consequence, ROE was 9.1%,
a significant improvement from -12.4% in the previous period.
Net Sales
Despite the negative impact of such factors as our withdrawal from
loss-making businesses, which pushed down polyester fibers sales,
consolidated net sales in the period under review totaled ¥815.7
billion, up 6.5%, or ¥49.8 billion, from fiscal 2009, as a recovery in
demand bolstered sales in other materials businesses. Sales in our
materials businesses accounted for 52% of net sales for the period,
while sales in overseas markets represented 37% of the total.
Costs and Expenses
Despite higher shipments and rising fuel prices, which added ¥18.0
billion to the total, cost of sales was held to an increase of 2.1%, or
¥12.3 billion, owing to decisive efforts to reduce costs, particularly
in our materials businesses. As a percentage of net sales, cost of
sales edged down 3.0 percentage points, to 71.9%. Selling, gen-
eral and administrative (SG&A) expenses rose 2.9%, or ¥4.2 billion,
a consequence of expenses associated with the hiring of new
personnel in advance of the launch of new drugs. Despite this
increase, ongoing cost-cutting measures held SG&A to 18.3%
of net sales, down 0.6 percentage point. R&D expenses dropped
5.6%, or ¥1.9 billion, to ¥31.5 billion. This reflected strategic
efforts to promote concentration and selectivity, while still pursuing
ongoing forward-looking investments in corporate research in key
technological areas and in the cultivation of new businesses.
Results of Operations
700
750
800
850
0 2010 2011
¥765.8
¥ 815.7
Net salesTrading and Retail+11.6
Others-0.7
Polyester Fibers-18.6
Films and Plastics+39.3
Net sales
Billions of yenAnalysis of Net Sales
Years ended March 31
High-Performance Fibers+13.4
Pharmaceuticals and Home Health Care+4.7
25
50
75
100 40
30
20
10
%%
0 02007 2008 2009 20112010
75.3%74.4% 76.8% 74.9% 71.9%
14.7% 15.0%17.3%
18.9% 18.3%
Years ended March 31
Cost of Sales as a Percentage of Net Sales
SG&A Expenses as aPercentage of Net Sales
25
50
75
100
0 2010 2011
Operatingincome¥13.4
Operatingincome
¥48.6
Sales prices up* +¥23.0
Cost-cutting +¥6.0
+¥34.0
Raw materials prices and fuel costs up -¥18.0
Other†
-¥10.0
Sales volume up
Billions of yenAnalysis of Operating Income
Years ended March 31
* Net change resulting from increase in sales prices, improvement in product mix and revision of drug reimbursement prices.
† Includes increase in amortization of goodwill.
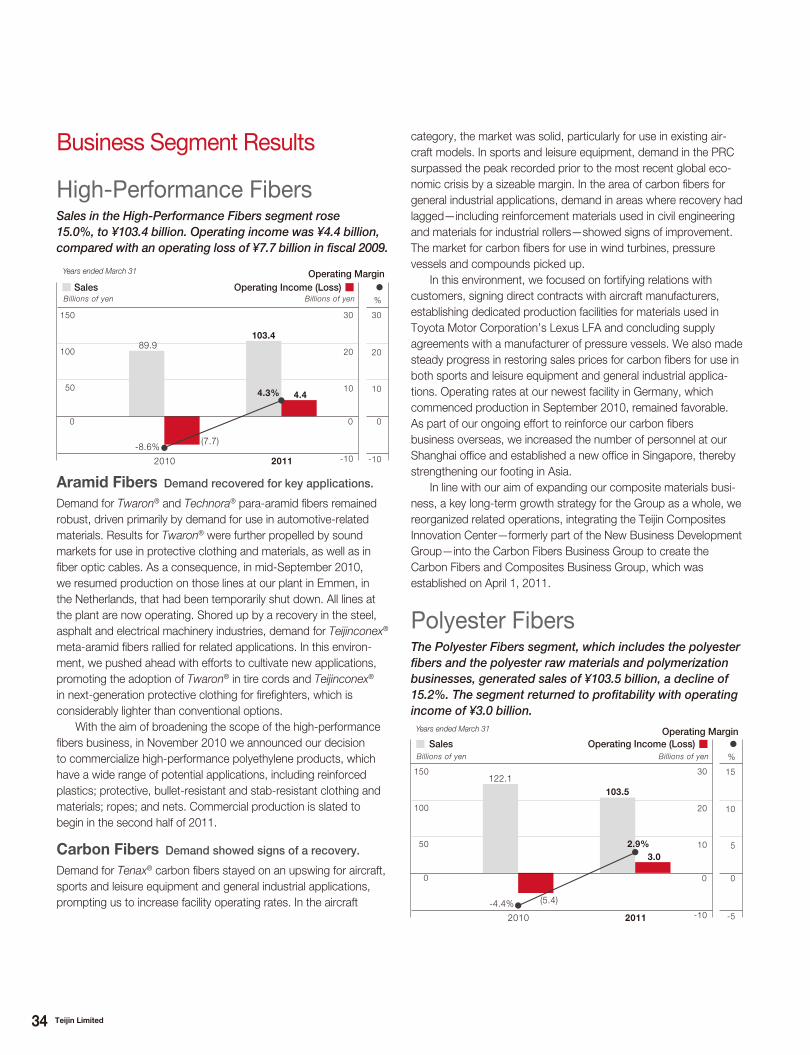
34 Teijin Limited
High-Performance FibersSales in the High-Performance Fibers segment rose 15.0%, to ¥103.4 billion. Operating income was ¥4.4 billion, compared with an operating loss of ¥7.7 billion in fiscal 2009.
Aramid Fibers Demand recovered for key applications.
Demand for Twaron® and Technora® para-aramid fibers remained
robust, driven primarily by demand for use in automotive-related
materials. Results for Twaron® were further propelled by sound
markets for use in protective clothing and materials, as well as in
fiber optic cables. As a consequence, in mid-September 2010,
we resumed production on those lines at our plant in Emmen, in
the Netherlands, that had been temporarily shut down. All lines at
the plant are now operating. Shored up by a recovery in the steel,
asphalt and electrical machinery industries, demand for Teijinconex®
meta-aramid fibers rallied for related applications. In this environ-
ment, we pushed ahead with efforts to cultivate new applications,
promoting the adoption of Twaron® in tire cords and Teijinconex®
in next-generation protective clothing for firefighters, which is
considerably lighter than conventional options.
With the aim of broadening the scope of the high-performance
fibers business, in November 2010 we announced our decision
to commercialize high-performance polyethylene products, which
have a wide range of potential applications, including reinforced
plastics; protective, bullet-resistant and stab-resistant clothing and
materials; ropes; and nets. Commercial production is slated to
begin in the second half of 2011.
Carbon Fibers Demand showed signs of a recovery.
Demand for Tenax® carbon fibers stayed on an upswing for aircraft,
sports and leisure equipment and general industrial applications,
prompting us to increase facility operating rates. In the aircraft
category, the market was solid, particularly for use in existing air-
craft models. In sports and leisure equipment, demand in the PRC
surpassed the peak recorded prior to the most recent global eco-
nomic crisis by a sizeable margin. In the area of carbon fibers for
general industrial applications, demand in areas where recovery had
lagged—including reinforcement materials used in civil engineering
and materials for industrial rollers—showed signs of improvement.
The market for carbon fibers for use in wind turbines, pressure
vessels and compounds picked up.
In this environment, we focused on fortifying relations with
customers, signing direct contracts with aircraft manufacturers,
establishing dedicated production facilities for materials used in
Toyota Motor Corporation’s Lexus LFA and concluding supply
agreements with a manufacturer of pressure vessels. We also made
steady progress in restoring sales prices for carbon fibers for use in
both sports and leisure equipment and general industrial applica-
tions. Operating rates at our newest facility in Germany, which
commenced production in September 2010, remained favorable.
As part of our ongoing effort to reinforce our carbon fibers
business overseas, we increased the number of personnel at our
Shanghai office and established a new office in Singapore, thereby
strengthening our footing in Asia.
In line with our aim of expanding our composite materials busi-
ness, a key long-term growth strategy for the Group as a whole, we
reorganized related operations, integrating the Teijin Composites
Innovation Center—formerly part of the New Business Development
Group—into the Carbon Fibers Business Group to create the
Carbon Fibers and Composites Business Group, which was
established on April 1, 2011.
Polyester FibersThe Polyester Fibers segment, which includes the polyester fibers and the polyester raw materials and polymerization businesses, generated sales of ¥103.5 billion, a decline of 15.2%. The segment returned to profitability with operating income of ¥3.0 billion.
Business Segment Results
50
100
150 30
20
10
-10
0 0
20112010
30
20
10
-10
0
%
103.489.9
(7.7)
4.4
-8.6%
4.3%
Billions of yenBillions of yen
Years ended March 31
Sales Operating Income (Loss)Operating Margin
50
100
150 30
20
10
-10
0 0
20112010
15
10
5
-5
0
%
103.5
122.1
(5.4)
3.0
-4.4%
2.9%
Billions of yenBillions of yen
Years ended March 31
Sales Operating Income (Loss)Operating Margin
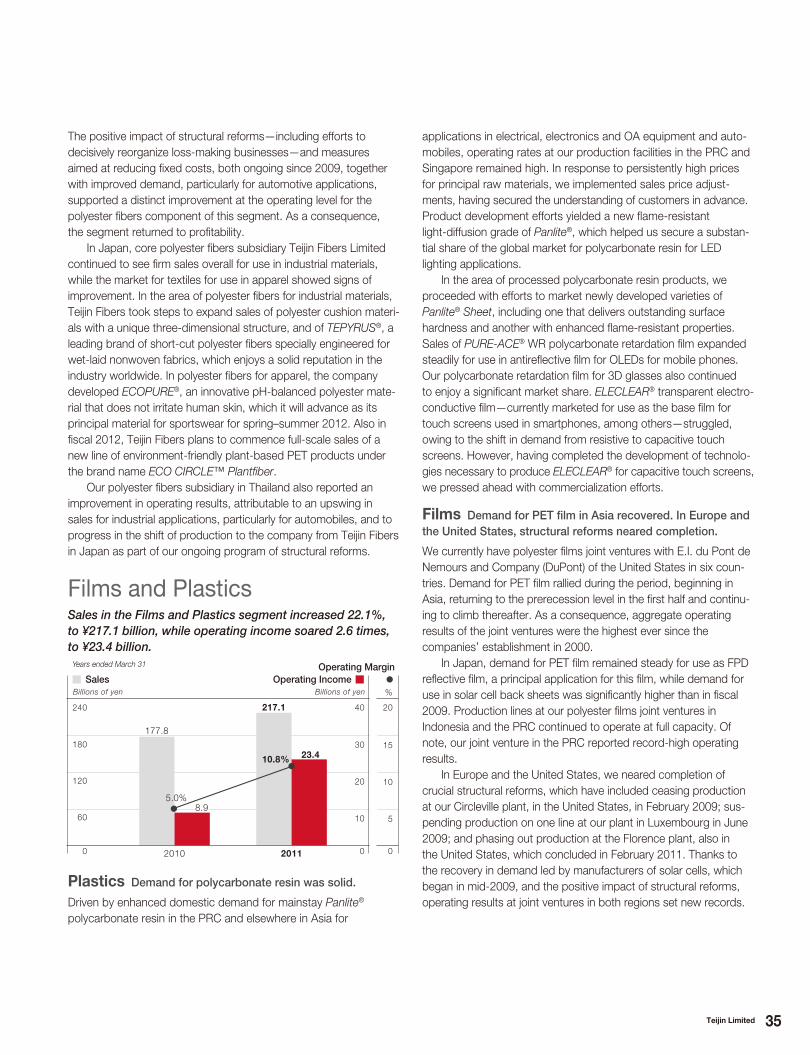
35Teijin Limited
The positive impact of structural reforms—including efforts to
decisively reorganize loss-making businesses—and measures
aimed at reducing fixed costs, both ongoing since 2009, together
with improved demand, particularly for automotive applications,
supported a distinct improvement at the operating level for the
polyester fibers component of this segment. As a consequence,
the segment returned to profitability.
In Japan, core polyester fibers subsidiary Teijin Fibers Limited
continued to see firm sales overall for use in industrial materials,
while the market for textiles for use in apparel showed signs of
improvement. In the area of polyester fibers for industrial materials,
Teijin Fibers took steps to expand sales of polyester cushion materi-
als with a unique three-dimensional structure, and of TEPYRUS®, a
leading brand of short-cut polyester fibers specially engineered for
wet-laid nonwoven fabrics, which enjoys a solid reputation in the
industry worldwide. In polyester fibers for apparel, the company
developed ECOPURE®, an innovative pH-balanced polyester mate-
rial that does not irritate human skin, which it will advance as its
principal material for sportswear for spring–summer 2012. Also in
fiscal 2012, Teijin Fibers plans to commence full-scale sales of a
new line of environment-friendly plant-based PET products under
the brand name ECO CIRCLE™ Plantfiber.
Our polyester fibers subsidiary in Thailand also reported an
improvement in operating results, attributable to an upswing in
sales for industrial applications, particularly for automobiles, and to
progress in the shift of production to the company from Teijin Fibers
in Japan as part of our ongoing program of structural reforms.
Films and PlasticsSales in the Films and Plastics segment increased 22.1%, to ¥217.1 billion, while operating income soared 2.6 times, to ¥23.4 billion.
Plastics Demand for polycarbonate resin was solid.
Driven by enhanced domestic demand for mainstay Panlite®
polycarbonate resin in the PRC and elsewhere in Asia for
applications in electrical, electronics and OA equipment and auto-
mobiles, operating rates at our production facilities in the PRC and
Singapore remained high. In response to persistently high prices
for principal raw materials, we implemented sales price adjust-
ments, having secured the understanding of customers in advance.
Product development efforts yielded a new flame-resistant
light-diffusion grade of Panlite®, which helped us secure a substan-
tial share of the global market for polycarbonate resin for LED
lighting applications.
In the area of processed polycarbonate resin products, we
proceeded with efforts to market newly developed varieties of
Panlite® Sheet, including one that delivers outstanding surface
hardness and another with enhanced flame-resistant properties.
Sales of PURE-ACE® WR polycarbonate retardation film expanded
steadily for use in antireflective film for OLEDs for mobile phones.
Our polycarbonate retardation film for 3D glasses also continued
to enjoy a significant market share. ELECLEAR® transparent electro-
conductive film—currently marketed for use as the base film for
touch screens used in smartphones, among others—struggled,
owing to the shift in demand from resistive to capacitive touch
screens. However, having completed the development of technolo-
gies necessary to produce ELECLEAR® for capacitive touch screens,
we pressed ahead with commercialization efforts.
Films Demand for PET film in Asia recovered. In Europe and the United States, structural reforms neared completion.
We currently have polyester films joint ventures with E.I. du Pont de
Nemours and Company (DuPont) of the United States in six coun-
tries. Demand for PET film rallied during the period, beginning in
Asia, returning to the prerecession level in the first half and continu-
ing to climb thereafter. As a consequence, aggregate operating
results of the joint ventures were the highest ever since the
companies’ establishment in 2000.
In Japan, demand for PET film remained steady for use as FPD
reflective film, a principal application for this film, while demand for
use in solar cell back sheets was significantly higher than in fiscal
2009. Production lines at our polyester films joint ventures in
Indonesia and the PRC continued to operate at full capacity. Of
note, our joint venture in the PRC reported record-high operating
results.
In Europe and the United States, we neared completion of
crucial structural reforms, which have included ceasing production
at our Circleville plant, in the United States, in February 2009; sus-
pending production on one line at our plant in Luxembourg in June
2009; and phasing out production at the Florence plant, also in
the United States, which concluded in February 2011. Thanks to
the recovery in demand led by manufacturers of solar cells, which
began in mid-2009, and the positive impact of structural reforms,
operating results at joint ventures in both regions set new records.
%
60
120
180
240
177.8
217.1 40
30
20
10
23.4
8.9
10.8%
5.0%
0 02010 2011
20
15
10
5
0
Billions of yenBillions of yen
Years ended March 31
Sales Operating IncomeOperating Margin

36 Teijin Limited
Pharmaceuticals and Home Health CareSales in the Pharmaceuticals and Home Health Care segment amounted to ¥136.4 billion, an increase of 3.6%. Operating income declined 5.8%, to ¥22.9 billion.
Pharmaceuticals We received approval to manufacture and market TMX-67, a treatment for hyperuricemia and gout, in Japan. We also expanded marketing of the drug in Europe and North America.
In the area of drugs for treating bone and joint disease, sales were
encouraging for Synvisc Dispo™ 2ml, an intra-articular injection-
form drug for treating pain associated with osteoarthritis of the knee
launched in Japan in December 2010. Among osteoporosis treat-
ments, shipments of Bonalon®* and Onealfa®, an active vitamin D3
preparation, were stable. In the area of treatments for cardiovascu-
lar and metabolic disease, in January 2011 we received approval
to manufacture and market TMX-67—for treating hyperuricemia
and gout—in Japan, under the name FEBURIC®. Developed by
Teijin, TMX-67 is the first novel drug in this field for 40 years. We
are persevering with expanding the geographic scale of marketing
efforts for TMX-67 in North America, where it is sold under the
name ULORIC®, and in Europe, where it is known as ADENURIC®.
The drug continues to see firm sales in both regions. In the area
of treatments for respiratory disease, we received authorization
to market inhaled steroid Alvesco® for treating bronchial asthma
in children, a new indication. Sales of the drug for pediatric use
began on April 7.
In R&D, in May 2010 we commenced phase I clinical trials for
GTH-42J, a new jelly version of osteoporosis treatment Bonalon®.
In February 2011, we filed for approval of GTH-42V, a new injection
form of Bonalon®, with Japan’s Ministry of Health, Labour and
Welfare.
Home Health Care Rental volume was encouraging for both HOT equipment and CPAP ventilators.
In Japan, rental volume for mainstay HOT equipment remained firm.
We continued to capitalize on products such as Hi-Sanso™ 7R,
an energy-efficient oxygen concentrator, and TOMS®-M, a remote
monitoring system for HOT equipment that uses the country’s
mobile phone network—both of which were launched in July
2010—to strengthen our share of the domestic HOT equipment
market. Rentals of other equipment, including CPAP ventilators,
noninvasive positive pressure ventilators (the NIP NASAL® series
and AutoSet™ CS), and SAFHS® also rose gradually.
Overseas, we currently provide home health care services in the
United States, Spain and the ROK. During the period under review,
rental volume expanded steadily in all three markets.
* Bonalon® is the registered trademark of Merck & Co., Inc., Whitehouse Station, NJ, U.S.A.
Trading and RetailThe Trading and Retail segment yielded sales of ¥216.9 billion, an increase of 5.7%, while operating income was ¥4.7 billion, up 37.9%. In textiles and apparel, we expanded our mainstay OEM business. The market for industrial textiles remained robust.
Textiles and ApparelIn our mainstay OEM business, we reported increases in sales and
income, reflecting efforts to expand sales of casual and everyday
apparel, suits and jackets, among others, to key customers.
Industrial Textiles and MaterialsSales of products for automotive applications—including rubber
reinforcements, airbag materials and vehicle interior materials—
strengthened significantly, owing to the positive impact of domestic
economic stimulus measures and flourishing export demand.
Demand for use in general-purpose products, including filters and
nonwoven materials, recovered. In film- and resin-related products,
demand for use in LCD televisions and mobile phone handsets
rose dramatically, supporting robust sales of film, sheet and resin
products.
OthersThis segment, which does not qualify as a reportable operating segment, achieved sales of ¥38.3 billion, down 1.8%. Operating income rose 19.4%, to ¥3.1 billion. Despite the impact of constraints on IT spending, sales to customers in the IT business sector were firm. This,
60
120
180
240 8
6
4
2
0 020112010
4
3
2
1
0
%
216.9205.3
4.7
3.4
2.2%1.7%
Billions of yenBillions of yen
Years ended March 31
Sales Operating IncomeOperating Margin
40
80
120
160 40
30
20
10
0 020112010
20
15
10
5
0
%
136.4131.7
22.924.3
16.8%
18.5%
Billions of yenBillions of yen
Years ended March 31
Sales Operating IncomeOperating Margin

37Teijin Limited
Analysis of Assets, Liabilities, Net Assets and Cash Flows
Interest-bearing debt decreased ¥52.9 billion, to ¥267.4 billion.
Shareholders’ equity and total valuation and translation adjustments
together amounted to ¥284.2 billion of the total, up ¥12.9 billion. As
a consequence, the debt-to-equity ratio improved 0.24 point, to
0.94 times. The equity ratio was 37.3%, up 4.3 percentage points.
Although our long-term debt ratings remained level, Moody’s
raised its outlook—Negative in fiscal 2009—to Stable. Owing to
successful efforts to secure a positive free cash flow, we also saw
improvements in the interest coverage ratio, which rose to 17.2
times, from 13.1 times, and the debt payback period, which
declined to 3.5 years, from 4.0 years.
As of March 31, 2011
Moody’s Rating and Investment Information, Inc.
Rating A3 AOutlook Stable Stable
Assets, Liabilities and Net AssetsTotal assets as of March 31, 2011, amounted to ¥761.5 billion,
down ¥61.5 billion from the end of fiscal 2009. This result was
largely attributable to declines in the yen value of assets denomi-
nated in foreign currencies and in property, plant and equipment,
the former attributable to the appreciation of the yen and the
latter to a freeze on major capital investment and the advance
of depreciation and amortization.
Total liabilities, at ¥453.8 billion, were down ¥74.0 billion from
the fiscal 2009 year-end. Interest-bearing debt, which includes
commercial paper, short-term loans payable and long-term loans
payable, decreased ¥52.9 billion, to ¥267.4 billion. This reflected
the use of cash generated as a result of operating activities and the
freeze on major capital investment to pay down such debt, as well
as a decline in the yen value of liabilities denominated in foreign
currencies as a consequence of the higher yen.
Financial Position
Total net assets were ¥307.7 billion, an increase of ¥12.4 billion.
Shareholders’ equity and total valuation and translation adjustments
together represented ¥284.2 billion of the total, up ¥12.9 billion.
This occurred despite an increase in the deduction for foreign cur-
rency translation adjustments and was due largely to net income of
¥25.2 billion for the period under review.
Cash FlowsNet cash and cash equivalents provided by operating activities in
fiscal 2010 amounted to ¥77.1 billion. Factors contributing to this
result included net income, depreciation and amortization and an
increase in notes and accounts payable—trade, which countered
increases in notes and accounts receivable—trade and inventories,
both attributable to expanded sales, and income taxes paid.
Net cash and cash equivalents used in investing activities came
to ¥27.7 billion, owing primarily to outlays for purchase of property,
plant and equipment.
Operating and investing activities in fiscal 2010 thus provided
a total of ¥49.4 billion.
Net cash and cash equivalents used in financing activities
amounted to ¥42.1 billion. This result reflected the issue and
redemption of bonds and commercial paper, the net result of pro-
ceeds from short- and long-term loans payable and the repayment
thereof, and cash dividends paid, among others.
After factoring in the impact of exchange rate fluctuations, oper-
ating, investing and financing activities in the period under review
resulted in a ¥5.5 billion net increase in cash and cash equivalents
as of March 31, 2011.
Groupwide Challenges
To date, the Teijin Group has implemented a variety of urgent
measures and structural reforms in response to the economic crisis
that overshadowed fiscal years 2008 and 2009. Having essentially
completed these efforts, in fiscal 2010 we achieved a return to prof-
itability at the net income level, thereby largely fulfilling our principal
objective, which was to create an operating structure that would
ensure we were profitable, even with facility operating rates at 70%.
Tasks Ahead
together with decisive efforts to cut costs, contributed to increases in sales and operating income.
20
40
60
80 12
9
6
3
0 020112010
12
9
6
3
0
%
38.339.0
3.12.6
8.1%
6.7%
Billions of yenBillions of yen
Years ended March 31
Sales Operating IncomeOperating Margin
5
10
15
20 40
30
20
10
%
0 02007 2008 2009 20112010
3.54.0
8.9
6.1
3.1
37.3%
33.0%35.0%
38.5%36.7%
Years
Years ended March 31
Debt Payback Period Equity Ratio

38 Teijin Limited
materials for use in LED lamp housings. In the area of water treat-
ment, our aim is to provide comprehensive wastewater treatment
solutions. In regenerative medicine, our focus is on drugs for the
treatment of stroke patients and rehabilitation robot devices.
In a bid to accelerate our global expansion, in early fiscal 2011
we introduced EaGLES—a leadership training program developed
primarily for employees newly appointed to management-level
positions—at Group companies in Japan and overseas. Through
this program, we will endeavor to promote greater awareness of
our philosophy and corporate values, as well as foster common
leadership skills, across the global Teijin Group.
Challenges in Individual Business Segments
High-Performance Fibers We will strive to expand sales for appli-
cations in such promising areas as fiber optic cables and protective
clothing, while at the same time reinforcing the structure of our
aramid fibers business, enhancing productivity and reducing costs.
We will also push ahead with efforts to cultivate markets for high-
performance polyethylene products, the commercialization of which
was announced in November 2010.
In our carbon fibers business, we will expand sales of products
for use in aircraft and compounds, the principal markets for our
carbon fibers. At the same time, we will work to cultivate new appli-
cations and enhance the efficiency of our production configuration
with the aim of ensuring stable profitability. Additionally, by capitaliz-
ing on the unique characteristics of carbon fibers, we will focus
on expanding applications for composite materials, including
thermoplastic CFRP, particularly in the automotive industry.
Polyester Fibers We will continue to promote the establishment
of the best possible production configuration for our polyester fibers
business with the aim of enhancing competitiveness in terms of
both cost and quality, thereby positioning us to expand sales of
products for use in industrial materials and ensure the profitability
of products for apparel. We will also actively promote environment-
friendly solutions and new business models—including ECO
CIRCLE™, our closed-loop system for collecting and recycling
polyester products, and ECO CIRCLE™ Plantfiber, a new line
of environment-friendly bio-derived PET products currently under
development.
Films and Plastics In our plastics business, we will respond to
persistently high prices for core raw materials by implementing
sales price adjustments and working to expand sales of high-value-
added products, while for processed plastics, efforts will focus on
expanding sales in promising areas, including film for use as anti-
reflective film for OLEDs and transparent film for touch screens. We
will endeavor to further expand our films business by proceeding
with the shift of operations to promising Asian markets and expand-
ing our production capacity to accommodate soaring demand for
use in FPDs and solar cell back sheets.
Pharmaceuticals and Home Health Care Having gained regula-
tory approval in Japan in January 2011, in May we began sales of
Fiscal 2011 has begun on a distressing note, owing to the Great
East Japan Earthquake and to political unrest in the Middle East and
North Africa, while the outlook remains clouded by uncertainties.
Nonetheless, having designated this as the year for repositioning the
Teijin Group on a growth trajectory, we will focus on manifesting the
full benefits of structural reforms, as well as on strengthening our
sales capabilities and R&D platform. We will also emphasize efficient
risk management. We will respond swiftly and effectively to the dev-
astation caused by the earthquake and tsunami and do our utmost
to achieve the prompt restoration of normal operations. Additionally,
we will continue to place a high priority on securing and enhancing
financial soundness. At the same time, we will actively foster busi-
nesses that support future growth, as well as promising projects.
Our overriding objective is to achieve sustainable growth by
providing sophisticated solutions in two core technological areas—
green chemistry and health care—and in overlapping domains.
Green chemistry encompasses high-performance materials and
green businesses and energy, while health care covers pharmaceu-
ticals and home health care. To this end, we will work, through
technology-driven innovation, to provide solutions in promising mar-
kets, which we have grouped into four key fields: automobiles and
aircraft, information and electronics, health care and environment
and energy.
Existing businessesIn our materials businesses, we will focus on high-performance
fibers—primarily aramid fibers and carbon fibers—that help reduce
the weight and energy requirements and enhance the safety
and security of finished products, as well as which contribute to
environmental protection. Among our services businesses, we will
concentrate on health care, where we will continue to respond to
the aging of society and the increasing prevalence of lifestyle-related
disease by emphasizing solutions in three therapeutic areas—bone
and joint disease, respiratory disease and cardiovascular and
metabolic disease.
On another front, we will work to establish an optimal global
production configuration, including capabilities in promising new
markets, including BRIC countries Brazil, Russia, India and the
PRC, and the creation of additional value through the expansion
of midstream and downstream businesses and the addition of
new materials to our portfolio.
New businessesNew business development efforts will center on reinforcing R&D
with the aim of promptly commercializing achievements in five key
areas—bioplastics, high-performance electronics materials, highly
thermoconductive materials, water treatment and regenerative medi-
cine. In the area of bioplastics, we will nurture markets for a new
product that is exceptionally resistant to heat. In high-performance
electronics materials, we will emphasize thermoresistant LiB separa-
tors, responding to demands for enhanced battery safety, and silicon
inks for semiconductors, for use in printable electronics, which are
electronics components produced using printing processes. In highly
thermoconductive materials, we are stepping up the development of

39Teijin Limited
TMX-67, our innovative treatment for hyperuricemia and gout, in
the domestic market under the name FEBURIC®. TMX-67 is also
available in North America and Europe. In addition to seeking to
rapidly expand sales of the drug in Japan, we will work to launch
the drug in other markets. We will also strive to expand sales of
Synvisc Dispo™ 2ml, an intra-articular injection-form drug for treat-
ing pain associated with osteoarthritis of the knee. In home health
care, we will step up efforts to expand our overseas operations.
Trading and Retail In response to increasingly diverse market
needs and the escalating globalization of user industries, we will
reinforce our operating foundation by strengthening collaboration
with the polyester fibers and high-performance fibers businesses,
as well as by cultivating new markets in Asia.
Others In the IT business, we will take decisive steps to develop
solutions that respond to the needs of customers, particularly
those in the Internet business and health care fields.
Fluctuations in foreign exchange and interest rates also have
the potential to affect the Teijin Group’s operating results and/or
financial position.
Product Quality Risk
Teijin Pharma Limited, the principal subsidiary in the Teijin Group’s
Pharmaceuticals and Home Health Care segment, has established
its own product reliability assurance function in the form of a com-
pliance division. This division, which functions independently of
other Group businesses, is charged with quality assurance in all
aspects of the pharmaceuticals and home health care businesses.
The Group maintains insurance coverage against product liability.
Nonetheless, as the pharmaceuticals business involves prod-
ucts that may affect the lives of users, quality issues have the
potential to negatively affect, among others, the Group’s operating
results, financial position and public reputation.
R&D-Related Risk in the Pharmaceuticals Business
R&D in the pharmaceuticals business is characterized by significant
investments of funds and time. Pharmaceuticals discovery research
has a high incidence of failure. In the initial stages, there is a high
risk that researchers will fail to discover a promising drug. Even if a
promising drug is discovered, clinical trials may prove it not to be as
effective as anticipated, or to have unexpected adverse side effects,
thereby forcing the abandonment of plans to apply for approval.
There is also a risk that a new drug candidate may not receive
regulatory approval as a result of the examination process that
follows application, or that approval may be rescinded based on
the outcome of research conducted subsequent to launch.
Risks Related to Overseas Operations
The Teijin Group has operations—in the High-Performance Fibers,
Polyester Fibers, Films and Plastics, Pharmaceuticals and Home
Health Care, and Trading and Retail segments—in the PRC,
Southeast Asia (including Thailand and Singapore), Europe (includ-
ing Germany and the Netherlands) and the United States. These
operations are vulnerable to the impact of fluctuations in foreign
exchange and interest rates. Our operations in the PRC and
Southeast Asia, in particular, may also be affected by such factors
as the enforcement of new—or unexpected changes to existing—
laws, regulations or tax systems that exert an adverse impact on
the Group; economic fluctuations; or by social unrest triggered by,
among others, changes of government or acts of terror or war. The
manifestation of such risks has the potential to adversely affect the
Group’s operating results and/or financial position.
Risks Related to Accidents and Disasters
The Teijin Group has prepared common disaster prevention guide-
lines for use by all Group companies and is an active proponent of
efforts to prevent and/or alleviate the impact of disasters through
disaster prevention diagnostics, earthquake response measures,
fire prevention and other advance prevention strategies, disaster
prevention education and training and post-disaster impact
mitigation measures.
The Teijin Group recognizes certain risks as having the potential to
affect its operating results and/or financial position. As of the date
of this document, these risks included, but were not limited to, the
risks listed below. The upheaval that has characterized the global
financial markets of late appears to have settled to some degree
and the Teijin Group faces very little risk of difficulty in procuring
necessary funds.
Market-Related Risk
The Teijin Group manufactures and sells products, the sales of
which may be affected by market conditions and competition with
other companies, and by market price fluctuations arising thereof.
Businesses involving commoditized materials—notably the polyester
fibers business of the Polyester Fibers segment and the polyester
films and polycarbonate resin businesses of the Films and Plastics
segment—are particularly vulnerable to fluctuations in shipments,
sales prices and procurement costs for raw materials and fuel
related to market conditions and competition with other companies.
Because the cost of raw materials and fuel accounts for a major por-
tion of production costs in these businesses, fluctuations in the price
of crude oil may have a significant impact on the Group’s income
performance.
The majority of products in the Teijin Group’s materials busi-
nesses are intermediates. Owing to inventory adjustments at each
stage of production and sales, the rate of expansion or contraction
of end-user demand for such products may exceed that of the real
economy.
The Teijin Group’s Pharmaceuticals and Home Health Care seg-
ment is vulnerable to changes in drug reimbursement prices under
Japan’s NHI scheme, as well as to increasingly intense competition,
both of which may have a negative impact on sales prices.
Risk Factors

40 Teijin Limited
Consolidated Balance Sheets
Millions of yen
Thousands of
U.S. dollars
(Note 1)
2010 2011 2011
ASSETS
Current assets:
Cash and time deposits (Note 3) ¥ 23,122 ¥ 28,612 $ 344,101
Receivables:
Notes and accounts receivable—trade:
Unconsolidated subsidiaries and affiliates 3,056 3,439 41,359
Other 155,895 152,693 1,836,356
Short-term loans receivable:
Unconsolidated subsidiaries and affiliates 2,873 8,368 100,637
Other 627 594 7,144
Other 13,036 16,360 196,753
Inventories (Note 7) 106,315 105,507 1,268,876
Deferred tax assets (Note 16) 19,783 13,230 159,110
Other current assets 10,710 10,206 122,742
Allowance for doubtful accounts (2,671) (2,114) (25,424)
Total current assets 332,746 336,895 4,051,654
Investments and other assets:
Investment securities (Notes 4 and 5):
Unconsolidated subsidiaries and affiliates 19,087 22,184 266,795
Other 43,289 39,932 480,241
Long-term loans receivable:
Unconsolidated subsidiaries and affiliates 1,665 2,533 30,463
Other 2,514 1,368 16,452
Prepaid pension cost (Note 9) 16,208 15,994 192,351
Other 12,794 13,109 157,655
Allowance for doubtful accounts (2,005) (1,970) (23,692)
93,552 93,150 1,120,265
Property, plant and equipment (Note 11):
Land 45,636 44,532 535,562
Buildings and structures 187,267 176,560 2,123,391
Machinery, equipment and vehicles 575,159 512,070 6,158,388
Tools 72,467 72,108 867,204
Construction in progress 9,258 6,629 79,723
Other 2,369 2,261 27,193
892,156 814,160 9,791,461
Accumulated depreciation (575,255) (554,501) (6,668,683)
316,901 259,659 3,122,778
Intangible assets 17,614 15,843 190,535
Deferred tax assets (Note 16) 2,438 4,215 50,692
Goodwill 59,820 51,773 622,646
79,872 71,831 863,873
¥823,071 ¥ 761,535 $ 9,158,570
See accompanying Notes to Consolidated Financial Statements.
TEIJIN LIMITED
As of March 31, 2010 and 2011
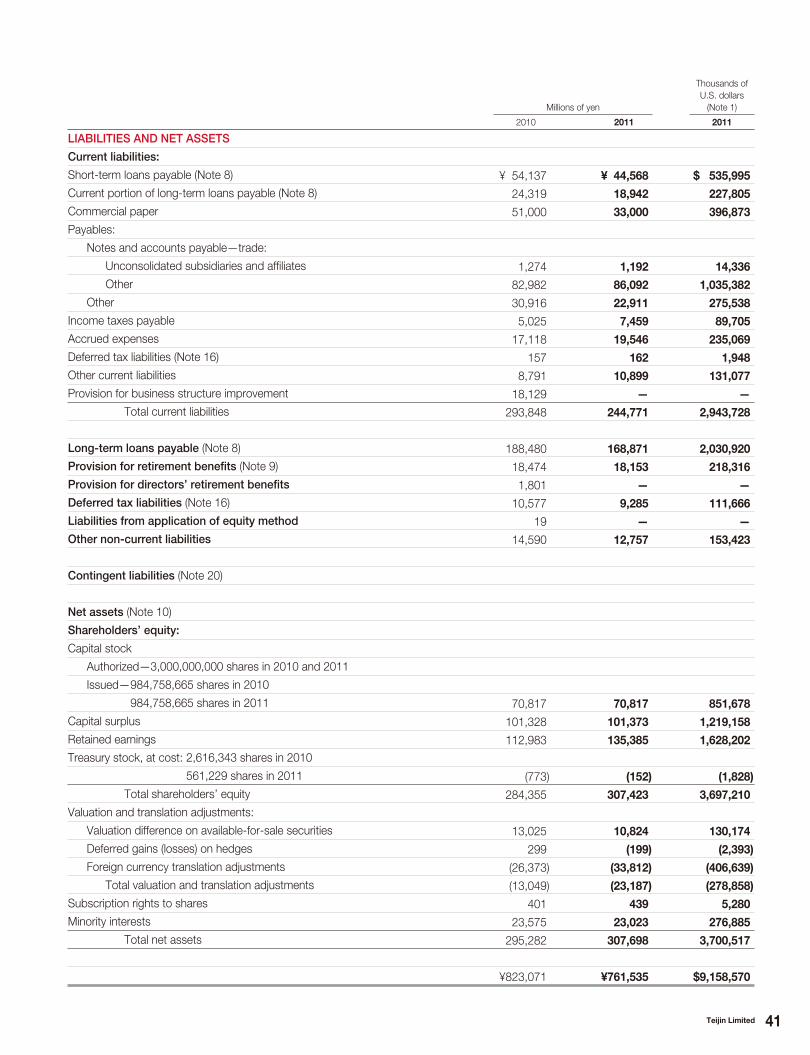
41Teijin Limited
Millions of yen
Thousands of
U.S. dollars
(Note 1)
2010 2011 2011
LIABILITIES AND NET ASSETS
Current liabilities:
Short-term loans payable (Note 8) ¥ 54,137 ¥ 44,568 $ 535,995
Current portion of long-term loans payable (Note 8) 24,319 18,942 227,805
Commercial paper 51,000 33,000 396,873
Payables:
Notes and accounts payable—trade:
Unconsolidated subsidiaries and affiliates 1,274 1,192 14,336
Other 82,982 86,092 1,035,382
Other 30,916 22,911 275,538
Income taxes payable 5,025 7,459 89,705
Accrued expenses 17,118 19,546 235,069
Deferred tax liabilities (Note 16) 157 162 1,948
Other current liabilities 8,791 10,899 131,077
Provision for business structure improvement 18,129 — —
Total current liabilities 293,848 244,771 2,943,728
Long-term loans payable (Note 8) 188,480 168,871 2,030,920
Provision for retirement benefits (Note 9) 18,474 18,153 218,316
Provision for directors’ retirement benefits 1,801 — —
Deferred tax liabilities (Note 16) 10,577 9,285 111,666
Liabilities from application of equity method 19 — —
Other non-current liabilities 14,590 12,757 153,423
Contingent liabilities (Note 20)
Net assets (Note 10)
Shareholders’ equity:
Capital stock
Authorized—3,000,000,000 shares in 2010 and 2011
Issued— 984,758,665 shares in 2010
984,758,665 shares in 2011 70,817 70,817 851,678
Capital surplus 101,328 101,373 1,219,158
Retained earnings 112,983 135,385 1,628,202
Treasury stock, at cost: 2,616,343 shares in 2010
561,229 shares in 2011 (773) (152) (1,828)
Total shareholders’ equity 284,355 307,423 3,697,210
Valuation and translation adjustments:
Valuation difference on available-for-sale securities 13,025 10,824 130,174
Deferred gains (losses) on hedges 299 (199) (2,393)
Foreign currency translation adjustments (26,373) (33,812) (406,639)
Total valuation and translation adjustments (13,049) (23,187) (278,858)
Subscription rights to shares 401 439 5,280
Minority interests 23,575 23,023 276,885
Total net assets 295,282 307,698 3,700,517
¥823,071 ¥761,535 $9,158,570

42 Teijin Limited
Millions of yen
Thousands of
U.S. dollars
(Note 1)
2010 2011 2011
Net sales ¥765,840 ¥815,656 $9,809,453
Costs and expenses:
Cost of sales 573,939 586,262 7,050,655
Selling, general and administrative expenses 145,109 149,351 1,796,164
Research and development expenses 33,356 31,483 378,629
Operating income 13,436 48,560 584,005
Other income (expenses):
Interest and dividend income 1,591 1,382 16,621
Interest expenses (5,785) (4,416) (53,109)
Gain on sales of investment securities 7,165 2,220 26,699
Gain on sales of property, plant and equipment 1,022 1,354 16,284
Compensation for transfer of property 120 — —
Loss on disposal of property, plant and equipment (1,509) (585) (7,035)
Loss on valuation of investment securities (1,221) (117) (1,407)
Impairment loss (Note 11) (4,387) (1,792) (21,551)
Provision for allowance for doubtful accounts (525) (883) (10,619)
Business structure improvement expenses (20,621) (1,050) (12,628)
Special factory operating loss (Note 12) (10,713) — —
Environmental expenses (Note 13) (408) (124) (1,491)
Equity in earnings (losses) of affiliates (3,389) 6,300 75,767
Additional contribution to cover losses on disposal
of securities with market value held in money trusts (7,199) — —
Earthquake-related loss (Note 14) — (2,861) (34,408)
Other, net (4,173) (3,494) (42,023)
(50,032) (4,066) (48,900)
Income (loss) before income taxes (36,596) 44,494 535,105
Income taxes (Note 16):
Income taxes—current 7,766 11,976 144,029
Income taxes—deferred (9,288) 4,196 50,463
(1,522) 16,172 194,492
Minority interests in net (income) losses (610) (3,140) (37,763)
Net income (loss) ¥ (35,684) ¥ 25,182 $ 302,850
Yen
U.S. dollars
(Note 1)
Net income (loss) per share (Note 2) ¥(36.26) ¥25.59 $0.31
Net income per share—diluted — 25.56 0.31
Cash dividends applicable to the year 2.00 5.00 0.06
Consolidated Statements of OperationsTEIJIN LIMITED
Years ended March 31, 2010 and 2011
See accompanying Notes to Consolidated Financial Statements.

43Teijin Limited
Millions of yen
Thousands of
U.S. dollars
(Note 1)
2010 (Note 15) 2011 (Note 2) 2011
Income before minority interests ¥— ¥ 28,323 $ 340,625
Other comprehensive income:
Valuation difference on available-for-sale securities — (2,209) (26,566)
Deferred gains (losses) on hedges — (487) (5,857)
Foreign currency translation adjustments — (8,294) (99,747)
Share of other comprehensive income of associates accounted for
using the equity method — 770 9,260
Total — (10,220) (122,910)
Comprehensive income ¥— ¥ 18,103 $ 217,715
Breakdown of comprehensive income:
Comprehensive income attributable to shareholders of the parent ¥— ¥ 15,045 $ 180,938
Comprehensive income attributable to minority interests ¥— ¥ 3,058 $ 36,777
Consolidated Statements of Comprehensive IncomeTEIJIN LIMITED
Years ended March 31, 2010 and 2011
See accompanying Notes to Consolidated Financial Statements.

44 Teijin Limited
Millions of yen
Thousands of
U.S. dollars
(Note 1)
2010 2011 2011
Shareholders’ equity Capital stock Balance at end of previous fiscal year ¥ 70,817 ¥ 70,817 $ 851,678
Changes in items during the period:
Issuance of new shares — — —
Total — — —
Balance at end of current fiscal year 70,817 70,817 851,678
Capital surplus Balance at end of previous fiscal year 101,325 101,328 1,218,617
Changes in items during the period:
Issuance of new shares — — —
Disposal of treasury stock 3 45 541
Transfer of loss on disposal of treasury stock — — —
Total 3 45 541
Balance at end of current fiscal year 101,328 101,373 1,219,158
Retained earnings Balance at end of previous fiscal year 150,886 112,983 1,358,785
Change owing to application of accounting policies for overseas equity method affiliates — 1,154 13,879
Changes in items during the period:
Dividends from surplus—other capital surplus (1,969) (3,933) (47,300)
Net income (loss) (35,684) 25,182 302,850
Others* (250) (1) (12)
Transfer of loss on disposal of treasury stock — — —
Total (37,903) 21,248 255,538
Balance at end of current fiscal year 112,983 135,385 1,628,202
Treasury stock at cost Balance at end of previous fiscal year (226) (773) (9,296)
Changes in items during the period:
Purchase of treasury stock (580) (41) (493)
Disposal of treasury stock 33 662 7,961
Total (547) 621 7,468
Balance at end of current fiscal year (773) (152) (1,828)
Shareholders’ equity, total Balance at end of previous fiscal year 322,802 284,355 3,419,784
Change owing to application of accounting policies for overseas equity method affiliates — 1,154 13,879
Changes in items during the period:
Issuance of new shares — — —
Dividends from surplus—other capital surplus (1,969) (3,933) (47,300)
Net income (loss) (35,684) 25,182 302,850
Others* (250) (1) (12)
Purchase of treasury stock (580) (41) (493)
Disposal of treasury stock 36 707 8,502
Total (38,447) 21,914 263,547
Balance at end of current fiscal year ¥284,355 ¥307,423 $3,697,210
Consolidated Statements of Changes in Net AssetsTEIJIN LIMITED
Years ended March 31, 2010 and 2011
* In 2010, changes in surpluses owing to actuarial differences in retirement benefi t obligations calculated based on U.K. accounting standards.
In 2011, changes in surpluses owing to change in scope of consolidation.
See accompanying Notes to Consolidated Financial Statements.

45Teijin Limited
Millions of yen
Thousands of
U.S. dollars
(Note 1)
2010 2011 2011
Valuation and translation adjustments Valuation difference on available-for-sale securities Balance at end of previous fiscal year ¥ 12,744 ¥ 13,025 $ 156,645
Changes in items during the period:
Net changes in items other than shareholders’ equity 281 (2,201) (26,471)
Total 281 (2,201) (26,471)
Balance at end of current fiscal year 13,025 10,824 130,174
Deferred gains (losses) on hedges Balance at end of previous fiscal year (1,321) 299 3,596
Changes in items during the period:
Net changes in items other than shareholders’ equity 1,620 (498) (5,989)
Total 1,620 (498) (5,989)
Balance at end of current fiscal year 299 (199) (2,393)
Foreign currency translation adjustments Balance at end of previous fiscal year (28,648) (26,373) (317,174)
Changes in items during the period:
Net changes in items other than shareholders’ equity 2,275 (7,439) (89,465)
Total 2,275 (7,439) (89,465)
Balance at end of current fiscal year (26,373) (33,812) (406,639)
Valuation and translation adjustments, total Balance at end of previous fiscal year (17,225) (13,049) (156,933)
Changes in items during the period:
Net changes in items other than shareholders’ equity 4,176 (10,138) (121,925)
Total 4,176 (10,138) (121,925)
Balance at end of current fiscal year (13,049) (23,187) (278,858)
Subscription rights to shares Balance at end of previous fiscal year 320 401 4,823
Changes in items during the period:
Net changes in items other than shareholders’ equity 81 38 457
Total 81 38 457
Balance at end of current fiscal year 401 439 5,280
Minority interests Balance at end of previous fiscal year 24,088 23,575 283,524
Changes in items during the period:
Net changes in items other than shareholders’ equity (513) (552) (6,639)
Total (513) (552) (6,639)
Balance at end of current fiscal year 23,575 23,023 276,885
Net assets, total Balance at end of previous fiscal year 329,985 295,282 3,551,198
Change owing to application of accounting policies for overseas equity method affiliates — 1,154 13,879
Changes in items during the period:
Issuance of new shares — — —
Dividends from surplus—other capital surplus (1,969) (3,933) (47,300)
Net income (loss) (35,684) 25,182 302,850
Others* (250) (1) (12)
Purchase of treasury stock (580) (41) (493)
Disposal of treasury stock 36 707 8,502
Net changes in items other than shareholders’ equity 3,744 (10,652) (128,107)
Total (34,703) 11,262 135,440
Balance at end of current fiscal year ¥295,282 ¥307,698 $3,700,517

46 Teijin Limited
Consolidated Statements of Cash Flows
Millions of yen
Thousands of
U.S. dollars
(Note 1)
2010 2011 2011
Cash flows from operating activities:Income (loss) before income taxes ¥ (36,596) ¥ 44,494 $ 535,105
Depreciation and amortization 61,879 56,410 678,413
Impairment loss 4,387 1,792 21,551
Increase (decrease) in provision for retirement benefits (551) 630 7,577
Increase in provision for business structure improvement 18,129 — —
Increase (decrease) in allowance for doubtful accounts (68) 1,082 13,013
Interest and dividend income (1,591) (1,382) (16,621)
Interest expenses 5,785 4,416 53,109
Equity in losses (earnings) of affiliates 3,389 (6,300) (75,767)
Loss (gain) on sales or disposal of property, plant and equipment 487 (770) (9,260)
Loss (gain) on sales of investment securities (7,165) (2,220) (26,699)
Loss on valuation of investment securities 1,221 117 1,407
Decrease (increase) in notes and accounts receivable—trade (7,234) (10,937) (131,533)
Decrease (increase) in inventories 29,631 (6,283) (75,562)
Increase (decrease) in notes and accounts payable—trade 15,451 8,477 101,948
Other, net 6,893 (260) (3,127)
Subtotal 94,047 89,266 1,073,554
Interest and dividend income received 3,774 4,053 48,743
Interest expenses paid (6,155) (4,481) (53,891)
Income taxes paid (4,034) (11,706) (140,781)
Additional contribution to cover losses on disposal of securities with market value held
in money trusts (7,199) — —
Net cash and cash equivalents provided by (used in) operating activities 80,433 77,132 927,625
Cash flows from investing activities:Purchase of property, plant and equipment (34,119) (25,456) (306,146)
Proceeds from sales of property, plant and equipment 1,757 1,125 13,530
Purchase of investment securities (1,183) (4,439) (53,385)
Proceeds from sales of investment securities 10,242 3,719 44,726
Decrease (increase) in short-term loans receivable (2,502) (810) (9,741)
Increase in long-term loans receivable (1,805) (662) (7,962)
Decrease in of long-term loans receivable 260 933 11,221
Other, net (6,087) (2,155) (25,917)
Net cash and cash equivalents provided by (used in) investing activities (33,437) (27,745) (333,674)
Cash flows from financing activities:Net increase (decrease) in short-term loans payable (20,488) (3,648) (43,873)
Net increase (decrease) in commercial paper (25,000) (18,000) (216,476)
Proceeds from issuance of bonds 15,226 13,022 156,609
Redemption of bonds (28,436) (22,584) (271,606)
Proceeds from long-term loans payable 25,754 6,788 81,636
Repayment of long-term loans payable (8,473) (10,517) (126,482)
Cash dividends paid (1,969) (3,933) (47,300)
Cash dividends paid to minority shareholders (169) (2,996) (36,031)
Other, net 606 (195) (2,346)
Net cash and cash equivalents provided by (used in) financing activities (42,949) (42,063) (505,869)
Effect of exchange rate changes on cash and cash equivalents 81 (1,946) (23,403)
Net increase (decrease) in cash and cash equivalents 4,128 5,378 64,679
Cash and cash equivalents at beginning of year 18,796 22,964 276,175
Increase in cash and cash equivalents resulting from change in scope of consolidation 40 113 1,359
Cash and cash equivalents at end of year (Note 3) ¥ 22,964 ¥ 28,455 $ 342,213
See accompanying Notes to Consolidated Financial Statements.
TEIJIN LIMITED
Years ended March 31, 2010 and 2011

47Teijin Limited
Notes to Consolidated Financial Statements
Note 1. Basis of presenting consolidated financial statements
The accompanying consolidated financial statements of Teijin
Limited (the “Company”) have been prepared in accordance with
the provisions set forth in the Financial Instruments and Exchange
Law (the “Law”) and the related accounting regulations, and in
conformity with accounting principles generally accepted in Japan
(“Japanese GAAP”), which are different in certain respects as to
application and disclosure requirements of International Financial
Reporting Standards.
Prior to the year ended March 31, 2009, the accounts of over-
seas subsidiaries were based on their accounting records main-
tained in conformity with generally accepted accounting principles
prevailing in the respective countries of domicile. From the fiscal
year ended March 31, 2009, the Company adopted “Practical
Solution on Unification of Accounting Policies Applied to Foreign
Subsidiaries for Consolidated Financial Statement” (Practical Issues
Task Force (“PITF”) No. 18, issued by the Accounting Standards
Board of Japan (“ASBJ”) on May 17, 2006). In principle, the
Company unified accounting standards for foreign subsidiaries and
makes necessary adjustments upon consolidation. There were no
material effects as a result of the adoption of PITF No. 18 on the
consolidated financial statements for the year ended March 31,
2010 and 2011.
The accompanying consolidated financial statements have
been reformatted and translated into English with some expanded
descriptions from the consolidated financial statements of the
Company prepared in accordance with Japanese GAAP and
filed with the appropriate Local Finance Bureau of the Ministry of
Finance as required by the Law. Certain supplementary information
included in the statutory Japanese-language consolidated financial
statements, but not required for fair presentation, is not presented
in the accompanying consolidated financial statements.
The translation of the Japanese yen amounts into U.S. dollar
amounts is included solely for the convenience of readers outside
Japan, using the prevailing exchange rate at March 31, 2011, which
was ¥83.15 to U.S.$1.00. The convenience translations should not
be construed as representations that the Japanese yen amounts
have been, could have been, or could in the future be, converted
into U.S. dollars at this or any other rate of exchange.
Note 2. Summary of significant accounting policies
Consolidation
The consolidated financial statements include the accounts of the
Company and 76 significant subsidiaries for the year ended March
31, 2011. For 2010, 81 significant subsidiaries were included in the
consolidated financial statements. Investments in 69 (70 in 2010)
unconsolidated subsidiaries and affiliates are, with minor excep-
tions, stated at cost, adjusted for equity in undistributed earnings
and losses since acquisition.
Companies which are 40% or more owned and substantially
controlled by the Company are considered subsidiaries for inclusion
in the consolidation. Equity method accounting is applied to
unconsolidated subsidiaries and affiliates which are substantially
controlled or of which operating and financial policies are
significantly influenced by the Company.
In the elimination of investments in subsidiaries, the assets and
liabilities of the subsidiaries, including the portion attributable to
minority shareholders, are evaluated using the fair value at the time
the Company acquired the control of respective subsidiaries.
Goodwill is usually amortized using the straight-line method
over the estimated useful life from five to 20 years.
The accounts of 38 (41 in 2010) consolidated subsidiaries are
included on the basis of their fiscal years ending December 31
(January 31 for one (two in 2010) and February 28 for two (two
in 2010) other subsidiaries). These subsidiaries do not prepare,
for consolidation purposes, statements for the period, which
corresponds with the fiscal year of the Company.
For these 41 (45 in 2010) consolidated subsidiaries, when there
are significant transactions that occur between their respective fiscal
year-ends and the Company’s year-end, necessary adjustments
are made to reflect the transactions in the accompanying
consolidated financial statements.
Statements of cash flows
In preparing the consolidated statements of cash flows, cash on
hand, readily available deposits and short-term highly liquid invest-
ments with maturities not exceeding three months at the time of
purchase are considered to be cash and cash equivalents.
Allowance for doubtful accounts
The allowance for doubtful accounts is provided in amounts
sufficient to cover possible losses on collection. It is determined by
adding the individually estimated uncollectible amounts of certain
accounts to an amount calculated using the provision rate based
on past experience.
Securities
Under the Japanese accounting standard for financial instruments,
all companies are required to classify securities as (a) securities
held for trading purposes (“trading securities”), (b) debt securities
intended to be held to maturity (“held-to-maturity debt securities”),
(c) equity securities issued by subsidiaries and affiliated companies,
and (d) all other securities that are not classified in any of the above
categories (“available-for-sale securities”).
TEIJIN LIMITED

48 Teijin Limited
The Company and its consolidated subsidiaries (the “Companies”)
do not hold trading securities. Held-to-maturity debt securities are
stated at amortized cost.
Equity securities issued by subsidiaries and affiliated compa-
nies, which are not consolidated or accounted for using the equity
method, are stated at moving-average cost. Available-for-sale
securities with available fair market values are stated at fair market
value. Unrealized gains and losses on these securities are reported,
net of applicable income taxes, as a separate component of net
assets. Realized gains and losses on sales of such securities are
computed using moving-average cost.
Debt securities with no available fair market value are stated at
amortized cost, net of the amount considered not collectible. Other
securities with no available fair market value are stated at moving-
average cost.
If the market value of held-to-maturity debt securities, equity
securities issued by unconsolidated subsidiaries and affiliated com-
panies and available-for-sale securities decline significantly, such
securities are stated at fair market value and the difference between
fair market value and the carrying amount is recognized as a loss in
the period of the decline. If the fair market value of equity securities
issued by unconsolidated subsidiaries and affiliated companies not
on the equity method is not readily available, the securities should
be written down to net asset value with a corresponding charge in
the consolidated statements of operations in the event net asset
value declines significantly. In these cases, the fair market value or
the net asset value will be the carrying amount of the securities at
the beginning of the following year.
Inventories
Inventories are stated at the lower of average cost or net realizable
value.
Property, plant and equipment
Property, plant and equipment are stated at cost. Depreciation is
determined over the estimated useful life of the asset principally by
the declining-balance method for domestic companies and by the
straight-line method for overseas subsidiaries. For domestic com-
panies, buildings acquired after March 31, 1998, are depreciated
using the straight-line method.
Intangible assets
Goodwill, patents, trademarks and other intangible assets are
amortized using the straight-line method over the estimated useful
life of the asset.
Software for internal use is amortized using the straight-line
method over the estimated useful life, i.e. five to 10 years.
Research and development expenses
The Company charges research and development expenses to
income as incurred.
Retirement benefits
(1) EmployeesThe Company has an unfunded lump-sum benefit plan and a
funded contributory pension plan, generally covering all employees.
Certain consolidated subsidiaries have unfunded lump-sum benefit
plans and non-contributory pension plans. Most foreign subsidiaries
do not have pension plans.
Under the terms of the lump-sum benefit plans, eligible employ-
ees are entitled under most circumstances, upon mandatory retire-
ment at age 60 or earlier voluntary termination, to a lump-sum
payment based on their compensation at the time of severance
and years of service.
The liabilities and expenses for severance and retirement bene-
fits are determined based on the amounts actuarially calculated
using certain assumptions. The Company and its consolidated sub-
sidiaries provided for employees’ severance and retirement benefits
at March 31, 2010 and 2011, based on the estimated amounts of
projected benefit obligation and the fair value of the pension assets
at those dates.
Prior service costs and actuarial gains and losses are recog-
nized in expenses using the straight-line method over mainly
12 years, which is within the average of the estimated remaining
service years of the employees, commencing with the current
and the following period, respectively.
(2) Directors and statutory auditorsThe Company and its domestic consolidated subsidiaries (the
“domestic companies”) provide for lump-sum retirement payments
for directors and statutory auditors in amounts that would be
required if they retired at the balance sheet dates.
Liabilities arising from application of equity method
Liabilities arising from application of equity method have been pro-
vided with respect to losses that may arise from the Company’s
portion of the capital deficits of unconsolidated subsidiaries and
affiliates which are accounted for by the equity method, after giving
consideration to the Company’s investments in, and guarantees for,
such companies.
Provision for business structure improvement
The provision is provided in amounts sufficient to cover possible
losses for business structure improvement.
Derivatives and hedge accounting
The Companies state derivative financial instruments at fair value
and recognize changes in the fair value as gain or loss unless the
derivative financial instruments are used for hedging purposes.
If derivative financial instruments are used as hedges and meet
certain hedging criteria, the domestic companies defer recognition
of the gain or loss resulting from a change in fair value of the
derivative financial instrument until the related loss or gain on
the hedged item is recognized.
49Teijin Limited
However, prior to the year ended March 31, 2010, in cases
where foreign currency forward contracts are used as hedges and
meet certain hedging criteria, foreign currency forward contracts
and hedged items are accounted for in the following manner:
(1) If a foreign currency forward contract is executed to hedge
an existing foreign currency receivable or payable,
(a) the difference, if any, between the Japanese yen amount of
the hedged foreign currency receivable or payable trans-
lated using the spot rate at the inception date of the con-
tract and the book value of the receivable or payable is
recognized in the consolidated statements of operations
in the period which includes the inception date, and
(b) the discount or premium on the contract (that is, the differ-
ence between the Japanese yen amount of the contract
translated using the contracted forward rate and that
translated using the spot rate at the inception date of
the contract) is recognized over the term of the contract.
(2) If a foreign currency forward contract is executed to hedge a
future transaction denominated in a foreign currency, the future
transaction will be recorded using the contracted forward rate,
and no gain or loss on the foreign currency forward contract
will be recognized.
Also, if interest rate swap contracts are used as hedges and
meet certain hedging criteria, the net amount to be paid or received
under the interest rate swap contract is added to or deducted from
the interest on the assets or liabilities for which the swap contract
was executed.
(Change in accounting procedures)Prior to the year ended March 31, 2010, the domestic companies
applied a method of accounting for foreign currency forward con-
tract transactions entered into to hedge transactions denominated
in foreign currencies over the term of the contract based on a
predetermined rate.
With the implementation of a new backbone system, effective
from the year ended March 31, 2011, the domestic companies
changed the method of accounting for such foreign currency for-
ward contract transactions and began applying a principle-based
method, in line with the accounting standard for financial instru-
ments. The aim of this change was to achieve a more accurate
presentation of foreign currency assets, liabilities and derivatives
positions. This change had no material impact on the consolidated
financial statements for the year ended March 31, 2011.
Income taxes
The provision for income taxes is based on income for financial
statement purposes. Income taxes comprise corporation tax,
enterprise tax, and prefectural and municipal inhabitants taxes.
The assets and liabilities approach is used to recognize deferred
tax assets and liabilities for the expected future tax consequences
of temporary differences between the carrying amounts of assets
and liabilities for financial reporting purposes and the amounts used
for income tax purposes.
The Company and its wholly owned domestic consolidated
subsidiaries have adopted the consolidated tax return filing under
Japanese tax regulations for the year ended March 31, 2006 and
thereafter.
Translation of foreign currency
Cash, receivables and payables denominated in foreign currencies
are translated into Japanese yen at year-end exchange rates. All
revenues and expenses in foreign currencies are translated at the
exchange rates prevailing when such transactions are made. The
resulting exchange loss or gain is charged or credited to income.
The balance sheet accounts of the foreign consolidated subsid-
iaries and foreign investments accounted for by the equity method
are translated at the rates of exchange in effect at the balance
sheet date, except for capital accounts and assets and liabilities
due to/from the Company, which are translated at historical rates.
Accounts in the consolidated statements of operations are trans-
lated at the average rates of exchange for the year. Differences aris-
ing from translations are presented as “Foreign currency translation
adjustments” in the accompanying consolidated financial state-
ments. The Companies report foreign currency translation
adjustments in net assets.
Net income (loss) per share
Computations of net income per share of common stock are based
on the weighted-average number of shares outstanding during
each period. Diluted net income per share is calculated based on
the assumption that all dilutive convertible debentures and stock
warrants were converted or exercised at the beginning of the year
or at the time of issue.
Net income (loss) per share for the years ended March 31,
2010 and 2011, is calculated based on the following factors:
Year ended March 31, 2010
( a ) Net loss: ¥35,684 million
(b ) Amount not attributable to
common shareholders: ¥ — million
( c ) Bonuses to directors and
statutory auditors included in (b): ¥ — million
(d ) Net loss allocated to common
stock: ¥35,684 million
( e ) Average number of shares
outstanding during the period: 984,000 thousand shares
( f ) Increase in number of shares: — thousand shares
(g ) Increase in number of subscription
rights to shares included in (f): — thousand shares
( h ) Summary of outstanding
potential shares excluded from
the computation of diluted EPS,
if calculated for the period,
since such potential stocks
do not have a dilutive effect:
Subscription rights to shares for the
purpose of granting stock options
(390 thousand shares of common
stock can be issued under the
subscription rights to shares).

50 Teijin Limited
Year ended March 31, 2011
( a ) Net income: ¥25,182 million ($302,850 thousand)
(b ) Amount not attributable to
common shareholders: ¥ — million ($ — thousand)
( c ) Bonuses to directors and
statutory auditors included in (b): ¥ — million ($ — thousand)
(d ) Net income allocated to common
stock: ¥25,182 million ($302,850 thousand)
( e ) Average number of shares
outstanding during the period: 984,033 thousand shares
( f ) Increase in number of shares: 1,269 thousand shares
(g ) Increase in number of subscription
rights to shares included in (f): 1,269 thousand shares
( h ) Summary of outstanding
potential shares excluded from
the computation of diluted EPS,
if calculated for the period,
since such potential stocks
do not have a dilutive effect:
—
(Change in accounting procedures)Recognition of revenues and costs on construction
contracts
Prior to the year ended March 31, 2010, the domestic companies
recognized revenues and costs of construction contracts using the
completed-contract method. Effective from the year ended March
31, 2010, the domestic companies adopted the “Accounting
Standard for Construction Contracts” (ASBJ Statement No. 15,
issued on December 27, 2007) and the “Guidance on Accounting
Standard for Construction Contracts” (ASBJ Guidance No. 18,
issued on December 27, 2007). Accordingly, when the outcome
of individual contracts can be estimated reliably, the domestic
companies apply the percentage-of-completion method to work
commencing in the year ended March 31, 2010; otherwise the
completed-contract method is applied. The percentage/stage of
completion at the end of the reporting period is measured by the
proportion of the cost incurred to the estimated total cost. The
change had no material impact on the consolidated financial
statements.
Accounting standards for investments applied to equity
method affiliates
Effective from the year ended March 31, 2011, the Company has
applied “Accounting Standard for Equity Method of Accounting for
Investments” (ASBJ Statement No. 16, issued on March 10, 2008)
and “Practical Solution on Unification of Accounting Policies Applied
to Associates Accounted for Using the Equity Method” (ASBJ PITF
Statement No. 24, issued on March 10, 2008). In principle, the
Companies make adjustments as necessary for its consolidated
financial statements.
As a result, operating income and income before income taxes
each decreased by ¥420 million ($5,051 thousand), compared to
what would have been recorded under the previous method.
Accounting standards for asset retirement obligations
Effective from the year ended March 31, 2011, the domestic
companies have applied “Accounting Standard for Asset
Retirement Obligations” (ASBJ Statement No. 18, issued on March
31, 2008) and “Guidance on Accounting Standard for Asset
Retirement Obligations” (ASBJ Guidance No. 21, issued on March
31, 2008).
As a result, operating income decreased by ¥34 million ($409
thousand), and income before income taxes decreased by ¥563
million ($6,771 thousand), compared to what would have been
recorded under the previous method.
Accounting standards for business combinations
Effective from the year ended March 31, 2011, the domestic com-
panies applied “Accounting Standard for Business Combinations”
(ASBJ Statement No. 21, issued December 26, 2008), “Accounting
Standard for Consolidated Financial Statements” (Statement No.
22, issued by ASBJ on December 26, 2008), “Partial Amendments
to Accounting Standard for Research and Development Costs”
(ASBJ Statement No. 23, issued on December 26, 2008), “Revised
Accounting Standard for Business Divestitures” (ASBJ Statement
No. 7, issued on December 26, 2008), “Revised Accounting
Standard for Equity Method of Accounting for Investments” (ASBJ
Statement No. 16, issued on December 26, 2008), and “Revised
Guidance on Accounting Standard for Business Combinations and
Accounting Standard for Business Divestitures” (ASBJ Guidance
No. 10, issued on December 26, 2008).
Reclassifications and restatement
Certain prior year amounts have been reclassified and restated to
conform to the current year presentation. These reclassifications
and restatements have no impact on previously reported results of
operations or retained earnings.
(Additional information)Effective from the year ended March 31, 2011, the Company has
applied “Accounting Standard for Presentation of Comprehensive
Income” (ASBJ Statement No. 25, issued on June 30, 2010).

51Teijin Limited
Note 3. Statements of cash flows
The reconciliation of cash and time deposits in the consolidated balance sheets and cash and cash equivalents in the consolidated
statements of cash flows as of March 31, 2010 and 2011, is as follows:
Millions of yenThousands of U.S. dollars
2010 2011 2011
Cash and time deposits in the consolidated balance sheets ¥23,122 ¥28,612 $344,101
Time deposits with maturities exceeding 3 months (158) (157) (1,888)
Cash and cash equivalents in the consolidated statements of cash flows ¥22,964 ¥28,455 $342,213
The assets and liabilities of two subsidiaries, PT. Teijin Indonesia Fiber Tbk. and Teijin Monofilament Germany GmbH, which are
excluded from the consolidation following the sale of their share of common stock during the year ended March 31, 2011, were as follows:
Millions of yenThousands of U.S. dollars
Current assets ¥ 8,965 $ 107,817
Fixed assets 12,654 152,183
Assets, total ¥ 21,619 $ 260,000
Current liabilities (22,983) (276,404)
Long-term liabilities (1,765) (21,227)
Liabilities, total ¥(24,748) $(297,631)
Note 4. Fair value of financial instruments
(1) Qualitative information on financial instruments
(a) Policies for using financial instruments
The Companies’ fund management policy is to put money
into short-term deposit only and to raise money through loans
payable, commercial paper and corporate bonds.
The Companies principally enter into derivatives transac-
tions in connection with managing their market risk and not
for speculation or trading purposes.
(b) Details of financial instruments used and the exposure to risk
and how it arises
Notes and accounts receivable—trade are exposed to cus-
tomers’ credit risk. To manage that risk, the Companies
check the balance of the accounts and confirm the collection
of money at the due date. The Companies also review the
credit risk of main customers every six months in accordance
with the Company’s credit management regulations.
Securities are exposed to market price fluctuation risk,
however, the Companies only hold shares in firms with which
they have business relations and these are not for speculation.
The due dates of notes and accounts payable—trade are
mainly within one year.
Commercial paper and short-term loans receivable are
used mainly for operating purposes, and funding through
corporate bonds and long-term loans payable is mainly for
capital investment. Debts with a floating rate are exposed to
interest rate fluctuation risk, but interest on some long-term
loans payable is converted to a fixed rate through interest
rate swap transactions.
The Companies use derivative transactions of, for example,
forward currency exchange and currency swaps that are
used to hedge the risk of fluctuation in foreign currency
exchange rates with respect to monetary receivables and
payables denominated in foreign currencies resulting from
import and export transactions. With respect to other
derivative transactions, interest rate swap transactions are
used to hedge the risk of fluctuation in interest rates and
commodity swap transactions are used to hedge the risk
of fluctuation in the commodity price of fuel. The Companies
evaluate hedge effectiveness by comparing the cumulative
changes in cash flows from, or the changes in fair value
of, hedged items with the corresponding changes in the
hedging derivative instruments.
The Companies report periodically to the Chief Financial
Officer and the Accounting and Treasury Office on the actual
results of derivative transactions. The actual results of deriva-
tive transactions for which hedge accounting cannot be
applied are reported to the Board of Directors after the end of
each year. Furthermore, the Companies enter into contracts
with highly rated international institutions as counterparts to
these transactions to minimize credit risk exposure.
(c) Supplementary information on fair values
The fair value of financial instruments is calculated based on
quoted market price or, in cases where there is no market
price, by making a reasonable estimation. Because the pre-
conditions applied include a floating element, estimations of
fair value may vary. The contracted amounts, as presented in
Note 6, “Derivative transactions,” do not reflect market risk.
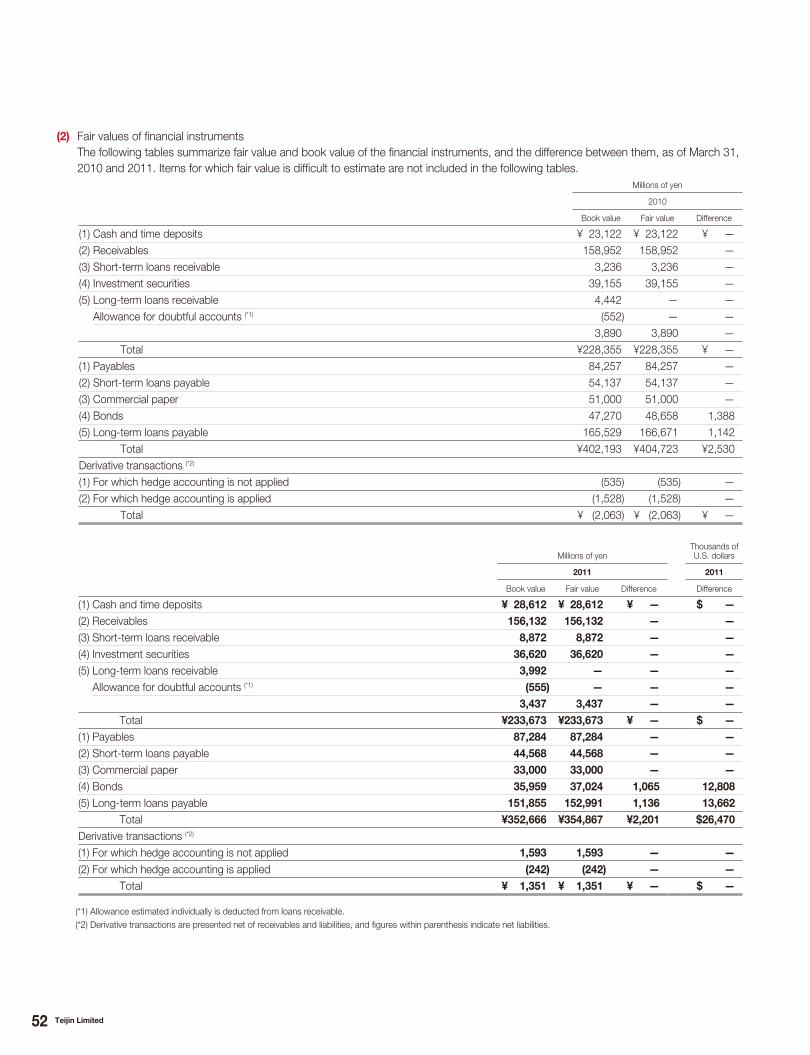
52 Teijin Limited
(2) Fair values of financial instruments
The following tables summarize fair value and book value of the financial instruments, and the difference between them, as of March 31,
2010 and 2011. Items for which fair value is difficult to estimate are not included in the following tables.
Millions of yen
2010
Book value Fair value Difference
(1) Cash and time deposits ¥ 23,122 ¥ 23,122 ¥ —
(2) Receivables 158,952 158,952 —
(3) Short-term loans receivable 3,236 3,236 —
(4) Investment securities 39,155 39,155 —
(5) Long-term loans receivable 4,442 — —
Allowance for doubtful accounts (*1) (552) — —
3,890 3,890 —
Total ¥228,355 ¥228,355 ¥ —
(1) Payables 84,257 84,257 —
(2) Short-term loans payable 54,137 54,137 —
(3) Commercial paper 51,000 51,000 —
(4) Bonds 47,270 48,658 1,388
(5) Long-term loans payable 165,529 166,671 1,142
Total ¥402,193 ¥404,723 ¥2,530
Derivative transactions (*2)
(1) For which hedge accounting is not applied (535) (535) —
(2) For which hedge accounting is applied (1,528) (1,528) —
Total ¥ (2,063) ¥ (2,063) ¥ —
Millions of yenThousands of U.S. dollars
2011 2011
Book value Fair value Difference Difference
(1) Cash and time deposits ¥ 28,612 ¥ 28,612 ¥ — $ —
(2) Receivables 156,132 156,132 — —
(3) Short-term loans receivable 8,872 8,872 — —
(4) Investment securities 36,620 36,620 — —
(5) Long-term loans receivable 3,992 — — —
Allowance for doubtful accounts (*1) (555) — — —
3,437 3,437 — —
Total ¥233,673 ¥233,673 ¥ — $ —
(1) Payables 87,284 87,284 — —
(2) Short-term loans payable 44,568 44,568 — —
(3) Commercial paper 33,000 33,000 — —
(4) Bonds 35,959 37,024 1,065 12,808
(5) Long-term loans payable 151,855 152,991 1,136 13,662
Total ¥352,666 ¥354,867 ¥2,201 $26,470
Derivative transactions (*2)
(1) For which hedge accounting is not applied 1,593 1,593 — —
(2) For which hedge accounting is applied (242) (242) — —
Total ¥ 1,351 ¥ 1,351 ¥ — $ —
(*1) Allowance estimated individually is deducted from loans receivable.
(*2) Derivative transactions are presented net of receivables and liabilities, and figures within parenthesis indicate net liabilities.

53Teijin Limited
(Note 1) The method of estimating the fair value for securities and derivative transactions is as follows:
Assets(1) Cash and time deposits, (2) Receivables, (3) Short-term loans receivable
These terms are all short-term, and the fair value is nearly equal to book value, so the book value is used as fair value.
(4) Investment securities
The fair value of shares is the market price. See Note 5, “Investment securities” for information on investment securities
categorized as holding purpose.
(5) Long-term loans receivable
The fair value of long-term loans receivable, distinguished by the term, is discounted by the interest rate that is based on that
of government bonds, to which a spread that reflects credit risk has been added.
Moreover, the fair value of long-term loans receivable that are doubtful is estimated in the same way or is provided in an
amount sufficient to cover possible losses on collection.
Liabilities(1) Payables, (2) Short-term loans payable, (3) Commercial paper
These terms are all short-term and the fair value is nearly equal to book value, so the book value is used as fair value.
(4) Bonds
The fair value of corporate bonds is calculated based on market price, or, in cases where there is no market price, by using
the discounted cash flow, based on the sum of the principal and total interest of the remaining period and credit risk.
(5) Long-term loans payable
The fair value of long-term loans payable is the sum of the principal and total interest discounted by the rate that is applied
if a new loan is made. Certain long-term loans payable with floating rates are tied to interest rate swap transactions and
subject to special treatment.
Derivative transactions See Note 6, “Derivative transactions.”
(Note 2) Financial instruments for which the fair value is difficult to estimate:
Millions of yenThousands of U.S. dollars
2010 2011 2011
Unlisted shares ¥ 3,959 ¥ 3,142 $ 37,787
Shares in affiliated companies 15,302 17,258 207,553
Total ¥19,261 ¥20,400 $245,340
Market prices of the above shares are not available and the future cash flow cannot be estimated. Therefore, the fair value is
difficult to estimate. Hence these are not included in Note 5, “Investment securities,” below.
(Note 3) Expected repayment of monetary assets and securities with maturity after the date of the accounting period is as follows:
Millions of yen Millions of yen Thousands of U.S. dollars
2010 2011 2011
Within one yearOne year to five years Within one year
One year to five years Within one year
One year to five years
Cash and time deposits ¥ 23,122 ¥ — ¥ 28,612 ¥ — $ 344,101 $ —
Receivables 158,952 — 156,132 — 1,877,715 —
Short-term loans receivable 3,236 — 8,872 — 106,699 —
Investment securities — — — — — —
Long-term loans receivable 263 4,179 90 3,902 1,082 46,927
(Note 4) Expected repayment of bonds and long-term loans payable:
See Note 8, “Loans payable.”
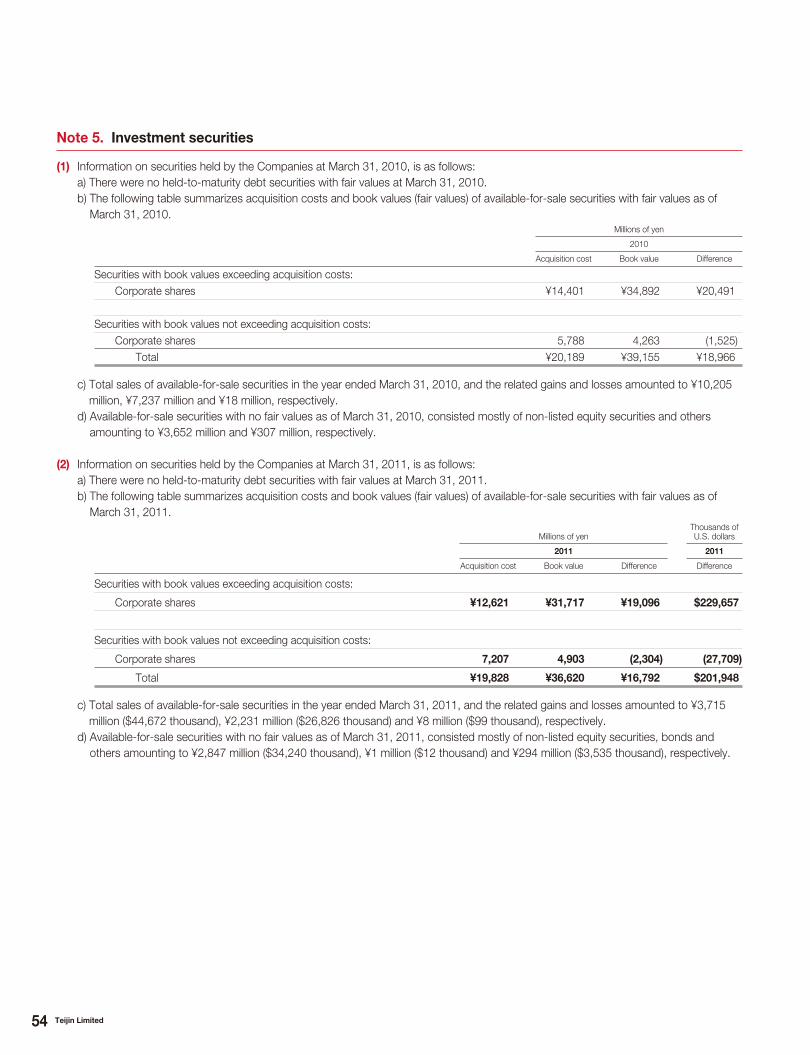
54 Teijin Limited
Note 5. Investment securities
(1) Information on securities held by the Companies at March 31, 2010, is as follows:
a) There were no held-to-maturity debt securities with fair values at March 31, 2010.
b) The following table summarizes acquisition costs and book values (fair values) of available-for-sale securities with fair values as of
March 31, 2010.
Millions of yen
2010
Acquisition cost Book value Difference
Securities with book values exceeding acquisition costs:
Corporate shares ¥14,401 ¥34,892 ¥20,491
Securities with book values not exceeding acquisition costs:
Corporate shares 5,788 4,263 (1,525)
Total ¥20,189 ¥39,155 ¥18,966
c) Total sales of available-for-sale securities in the year ended March 31, 2010, and the related gains and losses amounted to ¥10,205
million, ¥7,237 million and ¥18 million, respectively.
d) Available-for-sale securities with no fair values as of March 31, 2010, consisted mostly of non-listed equity securities and others
amounting to ¥3,652 million and ¥307 million, respectively.
(2) Information on securities held by the Companies at March 31, 2011, is as follows:
a) There were no held-to-maturity debt securities with fair values at March 31, 2011.
b) The following table summarizes acquisition costs and book values (fair values) of available-for-sale securities with fair values as of
March 31, 2011.
Millions of yenThousands of U.S. dollars
2011 2011
Acquisition cost Book value Difference Difference
Securities with book values exceeding acquisition costs:
Corporate shares ¥12,621 ¥31,717 ¥19,096 $229,657
Securities with book values not exceeding acquisition costs:
Corporate shares 7,207 4,903 (2,304) (27,709)
Total ¥19,828 ¥36,620 ¥16,792 $201,948
c) Total sales of available-for-sale securities in the year ended March 31, 2011, and the related gains and losses amounted to ¥3,715
million ($44,672 thousand), ¥2,231 million ($26,826 thousand) and ¥8 million ($99 thousand), respectively.
d) Available-for-sale securities with no fair values as of March 31, 2011, consisted mostly of non-listed equity securities, bonds and
others amounting to ¥2,847 million ($34,240 thousand), ¥1 million ($12 thousand) and ¥294 million ($3,535 thousand), respectively.

55Teijin Limited
Currency-related derivativesMillions of yen
2010
Contract amountAmount of principal due over one year Fair value Recognized gain (loss)
Foreign currency swap transactions:
Japanese yen received for U.S. dollars ¥ 8,381 ¥— ¥(114) ¥(114)
Foreign currency forward contract transactions:
Sell: U.S. dollars ¥ 2,476 ¥— ¥ 276 ¥ 276
Sell: Japanese yen ¥ 855 ¥— ¥ 101 ¥ 101
Buy: Japanese yen ¥13,172 ¥— ¥(796) ¥(796)
Interest-rate-related derivativesMillions of yen
2010
Contract amountAmount of principal due over one year Fair value Recognized gain (loss)
Interest rate swap transactions:
Variable rate received for fixed rate ¥92 ¥— ¥(3) ¥(3)
(2) The following tables summarize market value information as of March 31, 2010, of outstanding derivative transactions for which hedge
accounting is applied.
Currency-related derivatives: Principle-based method Millions of yen
2010
Contracted amountAmount of principal due over one year Fair value
Foreign currency swap transactions:
Japanese yen received for Euro ¥34,678 ¥11,197 ¥(2,922)
Foreign currency forward contract transactions:
Sell: U.S. dollars ¥11,864 ¥ — ¥ 136
Sell: Euro ¥ 37 ¥ — ¥ (2)
Sell: Japanese yen ¥ 9,098 ¥ 5,020 ¥ 1,146
Buy: U.S. dollars ¥ 8,521 ¥ — ¥ 339
Buy: Euro ¥ 36 ¥ — ¥ 0
Currency-related derivatives: Conventional methodMillions of yen
2010
Contracted amountAmount of principal due over one year Fair value
Foreign currency forward contract transactions:
Sell: U.S. dollars ¥4,212 ¥— ¥—
Sell: Euro ¥1,288 ¥— ¥—
Buy: U.S. dollars ¥ 601 ¥— ¥—
Buy: Euro ¥ 103 ¥— ¥—
Note 6. Derivative transactions
(1) The following tables summarize market value information as of March 31, 2010, of outstanding derivative transactions for which hedge
accounting is not applied.
Outstanding positions, for which gains and losses were recognized in the consolidated financial statements as of March 31, 2010,
were as follows:

56 Teijin Limited
Interest-rate-related derivatives: Principle-based methodMillions of yen
2010
Contract amountAmount of principal due over one year Fair value
Interest rate swap transactions:
Variable rate received for fixed rate ¥25,740 ¥25,740 ¥(286)
Interest-rate-related derivatives: Conventional methodMillions of yen
2010
Contract amountAmount of principal due over one year Fair value
Interest rate swap transactions:
Variable rate received for fixed rate ¥22,400 ¥22,400 ¥—
Fixed rate received for variable rate ¥ 1,000 ¥ — ¥—
Commodity-related derivatives: Principle-based methodMillions of yen
2010
Contract amountAmount of principal due over one year Fair value
Commodity swap transactions:
Oil ¥265 ¥— ¥61
(3) The fair value of foreign currency forward contract transactions is based on the year-end forward rate. The fair value of foreign
currency swap transactions, interest rate swap transactions and commodity swap transactions is based on the prices presented by
the counterpart financial institutions.
(4) The recognized gain or loss is estimated by the counterpart financial institutions.
(5) The following tables summarize market value information as of March 31, 2011, of outstanding derivative transactions for which hedge
accounting is not applied.
Outstanding positions, for which gains and losses were recognized in the financial statements as of March 31, 2011, were as
follows:
Currency-related derivativesMillions of yen
Thousands of U.S. dollars
2011 2011
Contract amountAmount of principal due over one year Fair value Recognized gain (loss) Recognized gain (loss)
Foreign currency swap transactions:
Japanese yen received for Euro ¥19,481 ¥7,566 ¥1,656 ¥1,656 $19,916
Foreign currency forward contract transactions:
Sell: U.S. dollars ¥ 1,912 ¥ — ¥ (26) ¥ (26) $ (313)
Sell: Japanese yen ¥ 679 ¥ — ¥ (36) ¥ (36) $ (433)
Buy: U.S. dollars ¥ 195 ¥ — ¥ 0 ¥ 0 $ 0

57Teijin Limited
(6) The following tables summarize market value information as of March 31, 2011, of outstanding derivative transactions for which hedge
accounting is applied.
Currency-related derivatives: Principle-based methodMillions of yen
Thousands of U.S. dollars
2011 2011
Contract amountAmount of principal due over one year Fair value Fair value
Foreign currency forward contract transactions:
Sell: U.S. dollars ¥24,962 ¥8,273 ¥ 941 $11,317
Sell: Euro ¥ 2,988 ¥ — ¥(113) $ (1,359)
Sell: Japanese yen ¥ 6,956 ¥3,531 ¥(260) $ (3,127)
Buy: U.S. dollars ¥17,896 ¥ — ¥ 181 $ 2,177
Buy: Euro ¥ 125 ¥ — ¥ 2 $ 24
Buy: British pounds ¥ 0 ¥ — ¥ 0 $ 0
Buy: Thai baht ¥ 0 ¥ — ¥ 0 $ 0
Buy: Hong Kong dollars ¥ 0 ¥ — ¥ 0 $ 0
Interest-rate-related derivatives: Principle-based methodMillions of yen
Thousands of U.S. dollars
2011 2011
Contract amountAmount of principal due over one year Fair value Fair value
Interest rate swap transactions:
Receive variable rate in Euro, pay fixed rate in Euro ¥21,041 ¥21,041 ¥(542) $(6,518)
Receive variable rate in Euro, pay variable rate in Euro ¥ 745 ¥ 745 ¥ (5) $ (60)
Receive variable rate in Japanese yen, pay fixed rate in Euro ¥14,217 ¥ 7,566 ¥(446) $(5,364)
Receive fixed rate in Japanese yen, pay fixed rate in Euro ¥ 2,502 ¥ — ¥ (2) $ (24)
Receive fixed rate in Japanese yen, pay variable rate in Euro ¥ 2,762 ¥ — ¥ 2 $ 24
Interest-rate-related derivatives: Conventional methodMillions of yen
Thousands of U.S. dollars
2011 2011
Contract amountAmount of principal due over one year Fair value Fair value
Interest rate swap transactions:
Receive variable rate in Japanese yen, pay fixed rate in Japanese yen ¥22,400 ¥20,000 ¥— $—
Receive variable rate in U.S. dollars, pay fixed rate in U.S. dollars ¥ 246 ¥ 246 ¥— $—
(7) The fair value of foreign currency forward contract transactions is based on the year-end forward rate. The fair value of foreign currency
swap transactions and interest rate swap transactions is based on the prices presented by the counterpart financial institutions.
(8) The recognized gain or loss is estimated by the counterpart financial institutions.

58 Teijin Limited
Note 8. Loans payable
Short-term loans payable were represented by bank overdrafts and short-term notes with average annual interest rates of approximately
1.2% in 2010 and 2011.
Long-term loans payable at March 31, 2010 and 2011, consisted of the following:
Millions of yenThousands of U.S. dollars
2010 2011 2011
Unsecured:
Banks and insurance companies at 0.3–1.7%, maturing serially through 2016 ¥105,821 ¥ 99,110 $1,191,942
1.6% bonds, due 2013 15,000 15,000 180,397
1.8% bonds, due 2015 15,000 15,000 180,397
1.0% medium-term notes, due 2011 991 993 11,942
1.1% medium-term notes, due 2010 1,586 — —
1.1–1.3% medium-term notes, due 2010 3,965 — —
0.3–1.3% medium-term notes, due 2010–2011 10,727 1,986 23,885
0.4% medium-term notes, due 2011 — 993 11,942
0.5% medium-term notes, due 2011 — 1,986 23,885
Loans denominated in foreign currencies (principally U.S. dollars),
0.6–5.7% maturing serially through 2015 59,708 52,745 634,336
Lease obligations, 7.7% maturing serially through 2024 2,349 2,019 24,281
215,147 189,832 2,283,007
Less amounts due within one year 24,506 19,179 230,656
Total ¥190,641 ¥170,653 $2,052,351
At March 31, 2011, assets pledged as collateral for secured other liabilities of ¥24 million ($289 thousand) were as follows:
Millions of yenThousands of U.S. dollars
Property, plant and equipment, net of accumulated depreciation ¥151 $1,816
Other assets 5 60
The aggregate annual maturities of long-term loans payable at March 31, 2011, were as follows:
Year ending March 31 Millions of yenThousands of U.S. dollars
2012 ¥19,179 $230,655
2013 59,390 714,251
2014 54,252 652,459
2015 28,010 336,861
2016 and thereafter 29,001 348,779
Inventories at March 31, 2010 and 2011, consisted of the following:
Millions of yenThousands of U.S. dollars
2010 2011 2011
Finished goods ¥ 71,583 ¥ 71,448 $ 859,266
Work in process 9,389 9,163 110,199
Raw materials 19,348 19,559 235,226
Supplies 5,995 5,337 64,185
Total ¥106,315 ¥105,507 $1,268,876
Note 7. Inventories

59Teijin Limited
(1) The liabilities for severance and retirement benefits included in the liability section of the consolidated balance sheets as of March 31,
2010 and 2011, consisted of the following:
Millions of yenThousands of U.S. dollars
2010 2011 2011
Projected benefit obligation ¥ 131,446 ¥ 131,743 $ 1,584,402
Unrecognized prior service costs 4,034 3,349 40,276
Less unrecognized actuarial differences (18,705) (25,247) (303,632)
Less fair value of pension assets (117,662) (110,522) (1,329,188)
Prepaid pension cost 19,361 18,830 226,458
Liability for severance and retirement benefits ¥ 18,474 ¥ 18,153 $ 218,316
(2) The expenses for severance and retirement benefits included in the consolidated statements of operations for the years ended March
31, 2010 and 2011, comprised the following:
Millions of yenThousands of U.S. dollars
2010 2011 2011
Service costs—benefits earned during the year ¥ 5,403 ¥ 4,846 $ 58,280
Interest cost on projected benefit obligation 3,465 3,144 37,811
Expected return on pension assets (3,369) (3,586) (43,127)
Amortization of actuarial differences 3,835 3,038 36,537
Amortization of prior service costs (662) (669) (8,046)
Severance and retirement benefit expenses ¥ 8,672 ¥ 6,773 $ 81,455
(3) The discount rate and the rate of expected return on pension assets used by the Companies were mainly 2.0% and 3.3%, respectively,
for the year ended March 31, 2010, and mainly 2.0% and 3.6%, respectively, for the year ended March 31, 2011.
(4) The estimated amount of all retirement benefits to be paid at future retirement dates is allocated equally to each service year using
the estimated number of total service years. Prior service costs and actuarial gains and losses are recognized in expenses using the
straight-line method over mainly 12 years, which is within the average of the estimated remaining service years of the employees,
commencing with the current and the following period, respectively.
Note 9. Employees’ retirement benefits
(Change in accounting procedures)Effective from the year ended March 31, 2010, the domestic com-
panies adopted the “Partial Amendments to Accounting Standard
for Retirement Benefits (Part 3)” (ASBJ No. 19, issued on July 31,
2008). This change had no material impact on the consolidated
financial statements for the year ended March 31, 2010.

60 Teijin Limited
Certain consolidated subsidiaries accounted for impairment losses for the year ended March 31, 2011, as follows:
Impairment lossLocation Usage purpose Type of assets Millions of yen
Thousands of U.S. dollars
Shunan City in Yamaguchi Prefecture Power supply facilities Machinery, etc. ¥ 557 $ 6,699
Matsuyama City in Ehime Prefecture Polyester fiber production facilities Machinery 476 5,725
Kentucky, U.S.A. High-performance fibers business Goodwill 307 3,692
Sennan City in Osaka Prefecture Idle assets Land 242 2,910
Matsuyama City in Ehime Prefecture Idle assets Machinery 111 1,335
Nomi City in Ishikawa Prefecture Idle assets Land 49 589
Others — — 50 601
Total ¥1,792 $21,551
Note 11. Impairment loss
earnings reserve is included in retained earnings in the accompany-
ing consolidated balance sheets.
Legal earnings reserve and additional paid-in capital may be
used to eliminate or reduce a deficit or may be capitalized by a res-
olution of the shareholders’ meeting. All additional paid-in capital
and all legal earnings reserve may be transferred to other capital
surplus and retained earnings, respectively, which are potentially
available for dividends. The maximum amount that the Company
can distribute as dividends is calculated based on the unconsoli-
dated financial statements of the Company in accordance with
Japanese laws and regulations.
At the Board of Directors’ meeting held on May 9, 2011, appropriations of retained earnings for year-end dividends applicable to the
year ended March 31, 2011, were duly approved as follows:
Millions of yenThousands of U.S. dollars
Cash dividends: ¥3.00 ($0.04) per share ¥2,953 $35,514
Note 10. Net assets
Under Japanese laws and regulations, the entire amount of the
issue price of shares is required to be accounted for as capital
stock, although a company may, by resolution of its Board of
Directors, account for an amount not exceeding one-half of the
issue price of the new shares as capital surplus.
Under the Japanese Corporate Law, in cases where dividend
distribution of surplus is made, the smaller of an amount equal to
10% of the dividend and excess, if any, of 25% of capital stock over
the total of additional paid-in capital and legal earnings reserve must
be set aside as additional paid-in capital or legal earnings reserve.
Additional paid-in capital is included in capital surplus and legal
The Companies set asset groups by the business unit on which
the profit or loss is continually controlled. Idle assets, which are not
being used for business, are separately treated.
Among the assets used for business purposes, certain produc-
tion facilities were devalued to the recoverable values by ¥1,390
million ($16,717 thousand) as “Impairment loss.” Recoverable
value was measured by the usage value, which was calculated
by discounting future cash flows with discount rates of 7%–20%.
The book values of idle assets with no utilization plan were writ-
ten down to recoverable values by ¥402 million ($4,834 thousand).
Recoverable value was measured by the net salvage value, based
on real-estate appraisals or similar methods. If it is determined that
an idle asset cannot be sold or diverted to another use, the asset is
valued at zero.

61Teijin Limited
Earthquake-related loss represents costs related to the Great East Japan Earthquake in March 2011 and consisted of the following:
Millions of yenThousands of U.S. dollars
Restoration expense ¥1,442 $17,342
Loss on valuation of inventories 816 9,814
Others 603 7,252
Total ¥2,861 $34,408
Note 14. Earthquake-related loss
Note 12. Special factory operating loss
Special factory operating loss included in other income (expenses) was incurred due to a decline in the capacity utilization ratio.
Note 13. Environmental expenses
Environmental expenses represent the costs for asbestos exposure prevention and polychlorinated biphenyls detoxifying processes.
Note 15. Consolidated statements of comprehensive income
Comprehensive income for the year ended March 31, 2010
Millions of yen
Comprehensive income attributable to owners of the parent ¥(31,508)
Comprehensive income attributable to minority interests 786
Total ¥(30,722)
Other comprehensive income for the year ended March 31, 2010
Millions of yen
Valuation difference on available-for-sale securities ¥ 298
Deferred gains (losses) on hedges 1,617
Foreign currency translation adjustments 2,285
Share of other comprehensive income of associates accounted for using the equity method 151
Total ¥4,351

62 Teijin Limited
Millions of yenThousands of U.S. dollars
2010 2011 2011
Deferred tax assets:
Excess bonuses accrued ¥ 3,244 ¥ 4,060 $ 48,827
Provision for loss on guarantees 3,035 2,529 30,415
Loss on valuation of stocks of subsidiaries and affiliates 9,145 — —
Write-down of investment securities 3,817 2,965 35,658
Retirement benefits 3,805 4,507 54,203
Accumulated impairment loss 8,796 3,631 43,668
Provision for business structure improvement 7,117 — —
Net operating losses 56,773 68,022 818,064
Capital losses 3,593 1,778 21,383
Other 11,848 11,952 143,741
Total 111,173 99,444 1,195,959
Valuation allowance (67,332) (62,157) (747,528)
Total deferred tax assets 43,841 37,287 448,431
Offset with deferred tax liabilities (21,620) (19,842) (238,629)
Net deferred tax assets ¥ 22,221 ¥ 17,445 $ 209,802
Deferred tax liabilities:
Adjustments to fixed assets based on Corporate Tax Law ¥ (7,384) ¥ (7,108) $ (85,484)
Accelerated depreciation of foreign subsidiaries’ fixed assets (3,779) (3,677) (44,221)
Tax effect of foreign subsidiaries’ undistributed earnings (4,007) (3,849) (46,290)
Valuation difference of newly acquired subsidiaries (5,958) (5,750) (69,152)
Valuation difference on available-for-sale securities (5,845) (6,062) (72,904)
Other (5,381) (2,843) (34,192)
Total deferred tax liabilities (32,354) (29,289) (352,243)
Offset with deferred tax assets 21,620 19,842 238,629
Net deferred tax liabilities ¥(10,734) ¥ (9,447) $ (113,614)
Significant components of the Companies’ deferred tax assets and liabilities as of March 31, 2010 and 2011, are as follows:
Note 16. Income taxes
The Company is subject to a number of taxes based on income,
which, in the aggregate, indicate a statutory rate in Japan of
approximately 40.4% for the year ended March 31, 2011. The
following table summarizes the significant differences between
the Company’s effective tax rate and the actual income tax
rate for financial statement purposes for the year ended
March 31, 2011.
2011
The Company’s effective tax rate 40.4%
Non-deductible expenses 2.1
Difference in statutory tax rate between Japan and other countries (7.6)
Equity in earnings of affiliates (5.7)
Amortization of goodwill 5.9
Changes in valuation allowance 3.2
Other (2.0)
Actual income tax rate 36.3%

63Teijin Limited
Note 17. Leases
(1) Finance leases as lessee
Finance lease transactions that commenced on and before March 31, 2008, and which did not transfer ownership are accounted for in
the same manner as operating leases.
The original lease obligations, payments to date and payments remaining for assets leased from other parties under non-capitalized
finance leases as of March 31, 2010 and 2011, are as follows:
Millions of yen
Year ended March 31, 2010 Original lease obligation Payments to date Payments remaining
Machinery, equipment and vehicles ¥2,097 ¥1,601 ¥496
Other fixed assets 1,245 875 370
Intangible assets 81 56 25
Total ¥3,423 ¥2,532 ¥891
Millions of yen
Year ended March 31, 2011 Original lease obligation Payments to date Payments remaining
Machinery, equipment and vehicles ¥2,058 ¥1,787 ¥271
Other fixed assets 878 693 185
Intangible assets 48 36 12
Total ¥2,984 ¥2,516 ¥468
Thousands of U.S. dollars
Year ended March 31, 2011 Original lease obligation Payments to date Payments remaining
Machinery, equipment and vehicles $24,751 $21,491 $3,259
Other fixed assets 10,559 8,335 2,225
Intangible assets 577 433 144
Total $35,887 $30,259 $5,628
Future minimum lease payments for the remaining lease periods as of March 31, 2010 and 2011, including interest, are as follows:
Millions of yenThousands of U.S. dollars
2010 2011 2011
Due within one year ¥455 ¥236 $2,838
Due over one year 458 234 2,814
Total ¥913 ¥470 $5,652
Lease payments for finance leases which do not transfer ownership were ¥667 million and ¥451 million ($5,424 thousand) for the
years ended March 31, 2010 and 2011, respectively.
(2) Operating leases as lessee
Future minimum lease payments for the remaining lease periods, as of March 31, 2010 and 2011, are as follows:
Millions of yenThousands of U.S. dollars
2010 2011 2011
Due within one year ¥ 272 ¥ 257 $ 3,091
Due over one year 1,338 1,491 17,931
Total ¥1,610 ¥1,748 $21,022

64 Teijin Limited
(1) Information on stock option plans at March 31, 2010, is shown below.
The account title and the amount related to stock options in the year ended March 31, 2010, are as follows:
Account title Selling, general and administrative expenses
Amount ¥106 million
The following tables summarize the contents of stock options as of March 31, 2010.
Company name Teijin Limited
Position and number of grantee Directors, Employees and Directors of affiliates: 53
Class and number of stock Common Stock 460,000
Date of issue July 2, 2004
Condition of settlement of rights No provisions
Period grantees provide service in return for stock options No provisions
Period subscription rights are to be exercised From July 3, 2006 to July 2, 2009
Company name Teijin Limited
Position and number of grantee Directors, Employees and Directors of affiliates: 55
Class and number of stock Common Stock 430,000
Date of issue July 4, 2005
Condition of settlement of rights No provisions
Period grantees provide service in return for stock options No provisions
Period subscription rights are to be exercised From July 5, 2007 to July 4, 2010
Company name Teijin Limited
Position and number of grantee Directors and Corporate Officers: 54
Class and number of stock Common Stock 146,000
Date of issue July 10, 2006
Condition of settlement of rights No provisions
Period grantees provide service in return for stock options No provisions
Period subscription rights are to be exercised From July 10, 2006 to July 9, 2026
Company name Teijin Limited
Position and number of grantee Directors and Corporate Officers: 55
Class and number of stock Common Stock 207,000
Date of issue July 5, 2007
Condition of settlement of rights No provisions
Period grantees provide service in return for stock options No provisions
Period subscription rights are to be exercised From July 5, 2007 to July 4, 2027
Company name Teijin Limited
Position and number of grantee Directors and Corporate Officers: 57
Class and number of stock Common Stock 328,000
Date of issue July 7, 2008
Condition of settlement of rights No provisions
Period grantees provide service in return for stock options No provisions
Period subscription rights are to be exercised From July 7, 2008 to July 6, 2028
Company name Teijin Limited
Position and number of grantee Directors and Corporate Officers: 57
Class and number of stock Common Stock 420,000
Date of issue July 9, 2009
Condition of settlement of rights No provisions
Period grantees provide service in return for stock options No provisions
Period subscription rights are to be exercised From July 9, 2009 to July 8, 2029
Note 18. Stock option plans

65Teijin Limited
The following tables summarize the scale and movement of stock options as of March 31, 2010.
Non-exercisable stock optionsStocks
Company name Teijin Limited
2004 2005 2006 2007 2008 2009
Stock options outstanding at April 1, 2009 — — — — — —
Stock options granted — — — — — 420,000
Forfeitures — — — — — —
Conversion to exercisable stock options — — — — — 420,000
Stock options outstanding at March 31, 2010 — — — — — —
Exercisable stock options Stocks
Company name Teijin Limited
2004 2005 2006 2007 2008 2009
Stock options outstanding at April 1, 2009 195,000 390,000 142,000 207,000 328,000 —
Conversion from non-exercisable stock options — — — — — 420,000
Stock options exercised — — 15,000 23,000 6,000 —
Forfeitures 195,000 — — — — —
Stock options outstanding at March 31, 2010 — 390,000 127,000 184,000 322,000 420,000
The following table summarizes price information of stock options as of March 31, 2010.
Yen
Company name Teijin Limited
2004 2005 2006 2007 2008 2009
Paid-in value ¥405 ¥515 ¥ 1 ¥ 1 ¥ 1 ¥ 1
Average market price of the stock at the time of exercise — — ¥275 ¥275 ¥282 —
Fair value at the date of grant — — ¥663 ¥610 ¥307 ¥253
The method of estimation for the fair value of stock options granted in the year ended March 31, 2010, is as follows:
Method of valuation Black-Scholes Model
Volatility 31%
Expected remaining period 5.5 years
Expected dividend ¥5.0 per share
Interest rate without any risks 0.73%

66 Teijin Limited
(2) Information on stock option plans at March 31, 2011, is shown below.
The account title and the amount related to stock options in the year ended March 31, 2011, are as follows:
Account title Selling, general and administrative expenses
Amount ¥91 million ($1,094 thousand)
The following tables summarize the contents of stock options as of March 31, 2011.
Company name Teijin Limited
Position and number of grantee Directors, Employees and Directors of affiliates: 55
Class and number of stock Common Stock 430,000
Date of issue July 4, 2005
Condition of settlement of rights No provisions
Period grantees provide service in return for stock options No provisions
Period subscription rights are to be exercised From July 5, 2007 to July 4, 2010
Company name Teijin Limited
Position and number of grantee Directors and Corporate Officers: 54
Class and number of stock Common Stock 146,000
Date of issue July 10, 2006
Condition of settlement of rights No provisions
Period grantees provide service in return for stock options No provisions
Period subscription rights are to be exercised From July 10, 2006 to July 9, 2026
Company name Teijin Limited
Position and number of grantee Directors and Corporate Officers: 55
Class and number of stock Common Stock 207,000
Date of issue July 5, 2007
Condition of settlement of rights No provisions
Period grantees provide service in return for stock options No provisions
Period subscription rights are to be exercised From July 5, 2007 to July 4, 2027
Company name Teijin Limited
Position and number of grantee Directors and Corporate Officers: 57
Class and number of stock Common Stock 328,000
Date of issue July 7, 2008
Condition of settlement of rights No provisions
Period grantees provide service in return for stock options No provisions
Period subscription rights are to be exercised From July 7, 2008 to July 6, 2028
Company name Teijin Limited
Position and number of grantee Directors and Corporate Officers: 57
Class and number of stock Common Stock 420,000
Date of issue July 9, 2009
Condition of settlement of rights No provisions
Period grantees provide service in return for stock options No provisions
Period subscription rights are to be exercised From July 9, 2009 to July 8, 2029
Company name Teijin Limited
Position and number of grantee Directors and Corporate Officers: 55
Class and number of stock Common Stock 349,000
Date of issue July 9, 2010
Condition of settlement of rights No provisions
Period grantees provide service in return for stock options No provisions
Period subscription rights are to be exercised From July 9, 2010 to July 8, 2030

67Teijin Limited
The following tables summarize the scale and movement of stock options as of March 31, 2011.
Non-exercisable stock options Stocks
Company name Teijin Limited
2005 2006 2007 2008 2009 2010
Stock options outstanding at April 1, 2010 — — — — — —
Stock options granted — — — — — 349,000
Forfeitures — — — — — —
Conversion to exercisable stock options — — — — — 349,000
Stock options outstanding at March 31, 2011 — — — — — —
Exercisable stock options Stocks
Company name Teijin Limited
2005 2006 2007 2008 2009 2010
Stock options outstanding at April 1, 2010 390,000 127,000 184,000 322,000 420,000 —
Conversion from non-exercisable stock options — — — — — 349,000
Stock options exercised — 24,000 34,000 47,000 10,000 —
Forfeitures 390,000 — — — — —
Stock options outstanding at March 31, 2011 — 103,000 150,000 275,000 410,000 349,000
The following table summarizes price information of stock options as of March 31, 2011.Yen
Company name Teijin Limited
2005 2006 2007 2008 2009 2010
Paid-in value ¥515 ¥ 1 ¥ 1 ¥ 1 ¥ 1 ¥ 1
Average market price of the stock at the time of exercise — ¥290 ¥292 ¥295 ¥294 —
Fair value at the date of grant — ¥663 ¥610 ¥307 ¥253 ¥261
The method of estimation for the fair value of stock options granted in the year ended March 31, 2011, is as follows:
Method of valuation Black-Scholes Model
Volatility 33%
Expected remaining period 5.5 years
Expected dividend ¥2.0 per share
Interest rate without any risks 0.41%

68 Teijin Limited
(a) Statements of operations items Millions of yen
Year ended March 31, 2010Net sales to external
customersIntersegment net sales and transfer amounts Net sales Operating expenses
Operating income (loss)
Synthetic Fibers ¥205,154 ¥ 47,482 ¥252,636 ¥267,747 ¥(15,111)
Films and Plastics 177,791 6,978 184,769 176,772 7,997
Pharmaceuticals and Home Health Care 131,711 1 131,712 107,511 24,201
Trading and Retail 205,314 4,787 210,101 206,660 3,441
IT and New Products, etc. 45,870 31,351 77,221 74,267 2,954
Total 765,840 90,599 856,439 832,957 23,482
Elimination and corporate — (90,599) (90,599) (80,553) (10,046)
Consolidated total ¥765,840 ¥ — ¥765,840 ¥752,404 ¥ 13,436
(b) Assets, depreciation and amortization, impairment loss and capital expenditure
Millions of yen
Year ended March 31, 2010 Assets Depreciation and amortization Impairment loss Capital expenditure
Synthetic Fibers ¥357,206 ¥27,438 ¥5,201 ¥14,184
Films and Plastics 182,000 12,567 171 5,797
Pharmaceuticals and Home Health Care 108,913 8,920 — 8,444
Trading and Retail 78,212 271 40 159
IT and New Products, etc. 51,255 2,205 141 2,263
Total 777,586 51,401 5,553 30,847
Elimination and corporate 45,485 3,140 174 5,467
Consolidated total ¥823,071 ¥54,541 ¥5,727 ¥36,314
(2) Regional segment information
Regional segment information for the year ended March 31, 2010, is as follows:
Millions of yen
Year ended March 31, 2010Net sales to
external customersIntersegment net sales
or transfer amounts Net sales Operating expensesOperating
income (loss) Assets
Japan ¥535,214 ¥ 26,431 ¥561,645 ¥534,310 ¥27,335 ¥ 615,160
Asia 132,747 19,000 151,747 150,142 1,605 130,345
America 51,914 419 52,333 54,925 (2,592) 42,934
Europe 45,965 21,789 67,754 71,546 (3,792) 156,975
Total 765,840 67,639 833,479 810,923 22,556 945,414
Elimination and corporate — (67,639) (67,639) (58,519) (9,120) (122,343)
Consolidated total ¥765,840 ¥ — ¥765,840 ¥752,404 ¥13,436 ¥ 823,071
The main countries included in Asia, America and Europe are as follows:
Asia: Thailand, Indonesia, China and Singapore
America: The United States of America
Europe: The Netherlands and Germany
Segment information for the year ended March 31, 2010, is shown below.
Note 19. Segment information
(1) Industry segment information
The Company has five industry segments.
Synthetic Fibers: — Production and sales of polyester filaments and other fibers
for apparel and industrial applications, and artificial leather
Films and Plastics: — Production and sales of films and resins for various industrial
applications
Pharmaceuticals and Home Health Care: — Production and sales of prescription and non-prescription
drugs and production, sales and rental of home health care
devices
Trading and Retail: — Trading and retail of polyester filaments and other fibers
IT and New Products, etc.: — Serving software and other

69Teijin Limited
(3) Overseas sales for the year ended March 31, 2010, were as follows:
Millions of yen
2010
Asia ¥165,208
America 59,939
Europe and others 52,459
Overseas sales ¥277,606
Overseas sales include overseas subsidiaries’ sales to overseas third parties, as well as the Company’s and domestic subsidiaries’
export sales to third parties.
The main countries included in Asia, America, and Europe and others are as follows:
Asia: Thailand, Indonesia and China
America: The United States of America
Europe and others: Italy, Germany and France
(4) “Elimination and corporate” in the “Operating expenses”
column of the above schedules includes corporate expenses
amounting to ¥10,324 million for the year ended March 31,
2010, which mainly consist of basic research expenses
and corporate administrative departments’ expenses in the
Company.
(5) “Elimination and corporate” in the “Assets” column of the above
schedules includes corporate assets amounting to ¥112,483
million for the year ended March 31, 2010, which mainly con-
sist of cash, time deposits and investment securities held by
the Company.
(Additional information) Effective from the year ended March 31, 2011, the Company
adopted the revised “Accounting Standard for Disclosures
about Segments of an Enterprise and Related Information”
(ASBJ Statement No. 17, issued on March 27, 2009) and
“Guidance on Accounting Standard for Disclosures about
Segments of an Enterprise and Related Information” (ASBJ
Guidance No. 20, issued on March 21, 2008).
(6) Reportable segment information
The Company’s reportable operating segments are compo-
nents of an entity for which separate financial information is
available and evaluated regularly by its chief decision-making
authority in determining the allocation of management
resources and in assessing performance. The Company cur-
rently divides its operations into business groups based on
type of product, nature of business and services provided. The
business groups formulate product and service strategies in a
comprehensive manner in Japan and overseas. Accordingly,
the Company divides its operations into five reportable
operating segments on the same basis as it uses internally:
High-Performance Fibers; Polyester Fibers; Films and Plastics;
Pharmaceuticals and Home Health Care; and Trading and
Retail.
Each segment is as follows:
High-Performance Fibers: — Production and sales of aramid and carbon fibers for indus-
trial applications, and artificial leather
Polyester Fibers: — Production and sales of polyester fibers and raw materials for
apparel and industrial applications
Films and Plastics: — Production and sales of films and resins for various industrial
applications
Pharmaceuticals and Home Health Care: — Production and sales of prescription and non-prescription
drugs and production, sales and rental of home health care
devices
Trading and Retail: — Trading and retail of polyester filaments and other fibers
(7) Accounting methods used to calculate segment sales, segment
income (loss), segment assets and other items for reportable
segments
Accounts for reportable segments are for the most part calcu-
lated in line with generally accepted standards for the prepara-
tion of consolidated financial statements. Segment income
(loss) for reportable segments is based on operating income
(loss). Amounts for intersegment transactions or transfers are
calculated based on market prices or on prices determined
using the cost-plus method.

70 Teijin Limited
(8) Segment sales, segment income (loss), segment assets and other items for reportable segments
Segment information for the years ended March 31, 2010 and 2011, is shown below. Figures for the previous fiscal year have
been restated to conform with new segmentation.
Millions of yen
2010
High-Performance
Fibers Polyester FibersFilms and Plastics
Pharmaceuticals and Home
Health CareTrading and
Retail Total OthersConsolidated
total
Sales:
1) External customers ¥ 89,912 ¥122,092 ¥177,791 ¥131,711 ¥205,314 ¥726,820 ¥39,020 ¥765,840
2) Intersegment net sales
and transfer 9,758 39,379 6,978 1 4,787 60,903 31,052 91,955
Net sales 99,670 161,471 184,769 131,712 210,101 787,723 70,072 857,795
Segment income (loss) (7,738) (5,371) 8,910 24,324 3,441 23,566 2,600 26,166
Segment assets 244,495 118,441 182,540 92,210 78,212 715,898 34,548 750,446
Other items:
Depreciation 19,363 8,211 12,567 8,920 271 49,332 2,276 51,608
Amortization of goodwill 5,597 (3) (46) 1,809 0 7,357 (19) 7,338
Investments in associates
accounted for using the
equity method 3,868 3,800 6,233 1,560 305 15,766 3,321 19,087
Increase in tangible and
intangible fixed assets 9,014 5,198 5,797 8,444 159 28,612 2,734 31,346
Millions of yen
2011
High-Performance
Fibers Polyester FibersFilms and Plastics
Pharmaceuticals and Home
Health CareTrading and
Retail Total OthersConsolidated
total
Sales:
1) External customers ¥103,354 ¥103,502 ¥217,109 ¥136,446 ¥216,922 ¥777,333 ¥38,323 ¥815,656
2) Intersegment net sales
and transfer 10,651 40,776 7,951 1 4,813 64,192 30,312 94,504
Net sales 114,005 144,278 225,060 136,447 221,735 841,525 68,635 910,160
Segment income (loss) 4,423 3,017 23,447 22,910 4,744 58,541 3,105 61,646
Segment assets 215,824 105,937 184,560 93,420 76,472 676,213 36,004 712,217
Other items:
Depreciation 16,781 5,624 11,492 9,486 201 43,584 2,052 45,636
Amortization of goodwill 5,531 — (40) 1,817 16 7,324 (73) 7,251
Investments in associates
accounted for using the
equity method 3,816 3,409 9,314 772 367 17,678 4,506 22,184
Increase in tangible and
intangible fixed assets 5,077 4,204 4,277 12,441 273 26,272 1,242 27,514
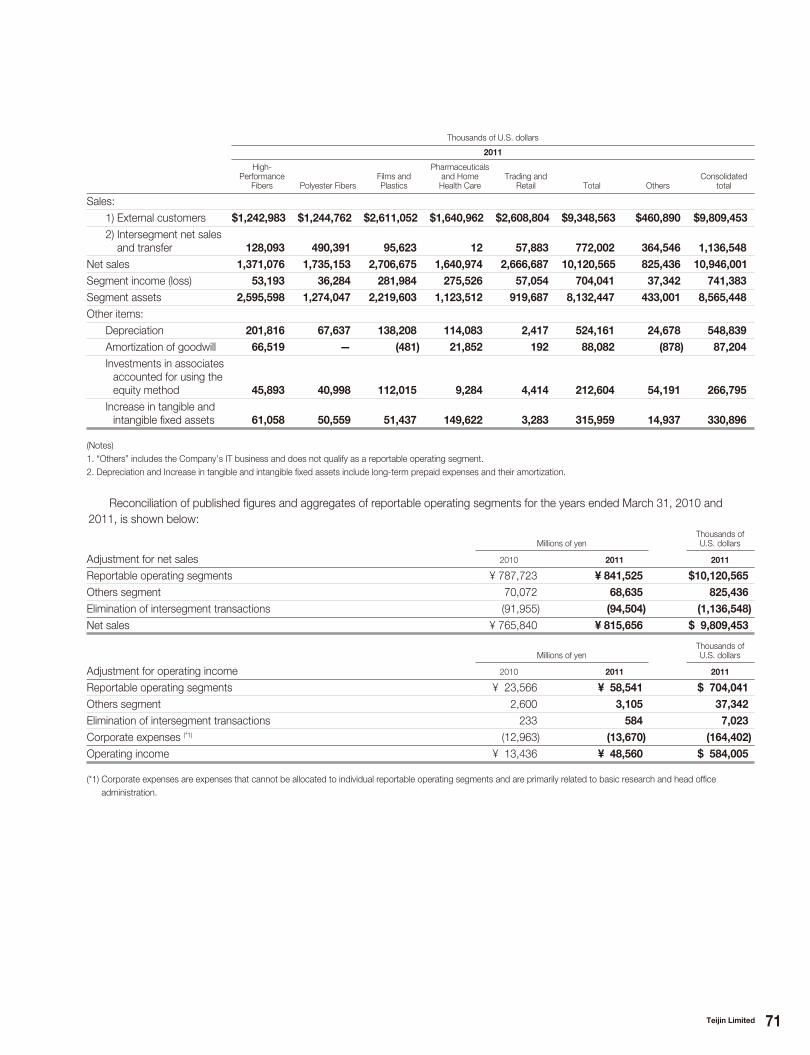
71Teijin Limited
Thousands of U.S. dollars
2011
High-Performance
Fibers Polyester FibersFilms and Plastics
Pharmaceuticals and Home
Health CareTrading and
Retail Total OthersConsolidated
total
Sales:
1) External customers $1,242,983 $1,244,762 $2,611,052 $1,640,962 $2,608,804 $9,348,563 $460,890 $9,809,453
2) Intersegment net sales
and transfer 128,093 490,391 95,623 12 57,883 772,002 364,546 1,136,548
Net sales 1,371,076 1,735,153 2,706,675 1,640,974 2,666,687 10,120,565 825,436 10,946,001
Segment income (loss) 53,193 36,284 281,984 275,526 57,054 704,041 37,342 741,383
Segment assets 2,595,598 1,274,047 2,219,603 1,123,512 919,687 8,132,447 433,001 8,565,448
Other items:
Depreciation 201,816 67,637 138,208 114,083 2,417 524,161 24,678 548,839
Amortization of goodwill 66,519 — (481) 21,852 192 88,082 (878) 87,204
Investments in associates
accounted for using the
equity method 45,893 40,998 112,015 9,284 4,414 212,604 54,191 266,795
Increase in tangible and
intangible fixed assets 61,058 50,559 51,437 149,622 3,283 315,959 14,937 330,896
(Notes)
1. “Others” includes the Company’s IT business and does not qualify as a reportable operating segment.
2. Depreciation and Increase in tangible and intangible fixed assets include long-term prepaid expenses and their amortization.
Reconciliation of published figures and aggregates of reportable operating segments for the years ended March 31, 2010 and
2011, is shown below:
Millions of yenThousands of U.S. dollars
Adjustment for net sales 2010 2011 2011
Reportable operating segments ¥ 787,723 ¥ 841,525 $10,120,565
Others segment 70,072 68,635 825,436
Elimination of intersegment transactions (91,955) (94,504) (1,136,548)
Net sales ¥ 765,840 ¥ 815,656 $ 9,809,453
Millions of yenThousands of U.S. dollars
Adjustment for operating income 2010 2011 2011
Reportable operating segments ¥ 23,566 ¥ 58,541 $ 704,041
Others segment 2,600 3,105 37,342
Elimination of intersegment transactions 233 584 7,023
Corporate expenses (*1) (12,963) (13,670) (164,402)
Operating income ¥ 13,436 ¥ 48,560 $ 584,005
(*1) Corporate expenses are expenses that cannot be allocated to individual reportable operating segments and are primarily related to basic research and head office
administration.
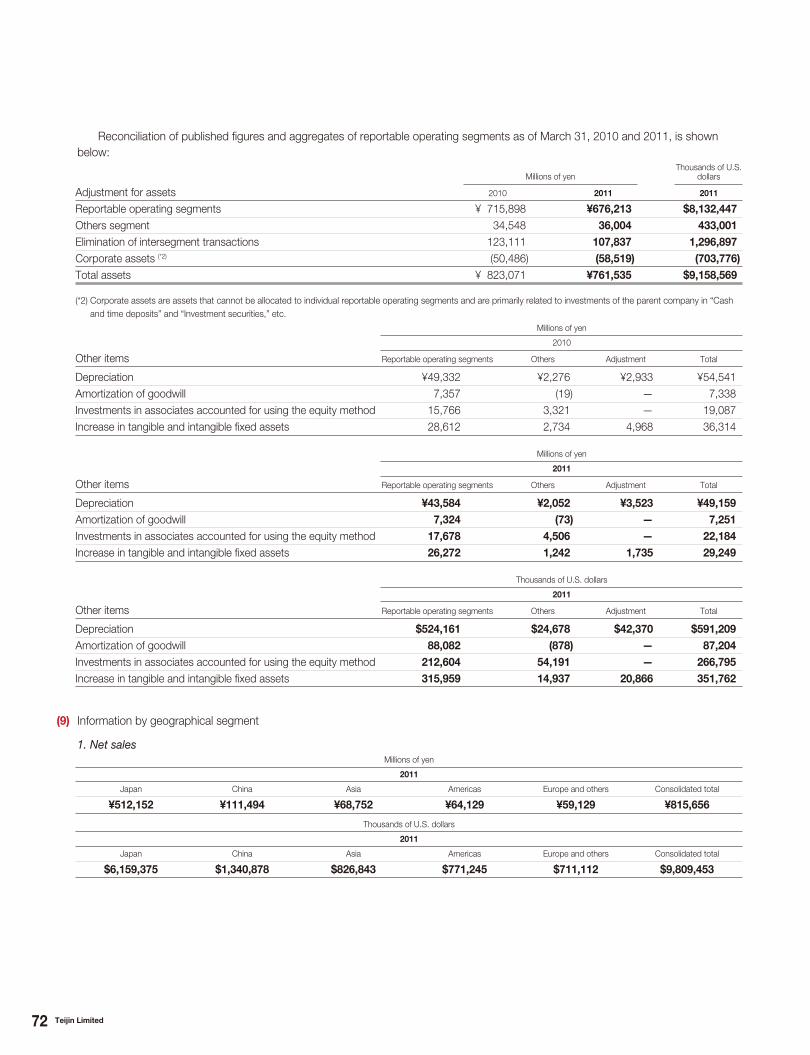
72 Teijin Limited
Reconciliation of published figures and aggregates of reportable operating segments as of March 31, 2010 and 2011, is shown
below:
Millions of yenThousands of U.S.
dollars
Adjustment for assets 2010 2011 2011
Reportable operating segments ¥ 715,898 ¥676,213 $8,132,447
Others segment 34,548 36,004 433,001
Elimination of intersegment transactions 123,111 107,837 1,296,897
Corporate assets (*2) (50,486) (58,519) (703,776)
Total assets ¥ 823,071 ¥761,535 $9,158,569
(*2) Corporate assets are assets that cannot be allocated to individual reportable operating segments and are primarily related to investments of the parent company in “Cash
and time deposits” and “Investment securities,” etc.
Millions of yen
2010
Other items Reportable operating segments Others Adjustment Total
Depreciation ¥49,332 ¥2,276 ¥2,933 ¥54,541
Amortization of goodwill 7,357 (19) — 7,338
Investments in associates accounted for using the equity method 15,766 3,321 — 19,087
Increase in tangible and intangible fixed assets 28,612 2,734 4,968 36,314
Millions of yen
2011
Other items Reportable operating segments Others Adjustment Total
Depreciation ¥43,584 ¥2,052 ¥3,523 ¥49,159
Amortization of goodwill 7,324 (73) — 7,251
Investments in associates accounted for using the equity method 17,678 4,506 — 22,184
Increase in tangible and intangible fixed assets 26,272 1,242 1,735 29,249
Thousands of U.S. dollars
2011
Other items Reportable operating segments Others Adjustment Total
Depreciation $524,161 $24,678 $42,370 $591,209
Amortization of goodwill 88,082 (878) — 87,204
Investments in associates accounted for using the equity method 212,604 54,191 — 266,795
Increase in tangible and intangible fixed assets 315,959 14,937 20,866 351,762
(9) Information by geographical segment
1. Net sales Millions of yen
2011
Japan China Asia Americas Europe and others Consolidated total
¥512,152 ¥111,494 ¥68,752 ¥64,129 ¥59,129 ¥815,656
Thousands of U.S. dollars
2011
Japan China Asia Americas Europe and others Consolidated total
$6,159,375 $1,340,878 $826,843 $771,245 $711,112 $9,809,453

73Teijin Limited
2. Tangible fixed assetsMillions of yen
2011
Japan Netherlands Asia Americas Europe Consolidated total
¥142,582 ¥55,194 ¥44,297 ¥6,984 ¥10,602 ¥259,659
Thousands of U.S. dollars
2011
Japan Netherlands Asia Americas Europe Consolidated total
$1,714,756 $663,788 $532,736 $83,993 $127,505 $3,122,778
(10) Information by major customer
Omitted as no single customer accounts for more than 10% of consolidated net sales as reported in the consolidated statements of
income.
(11) Loss on impairment and goodwill by reportable segment
Loss on impairment by reportable segment for the year ended March 31, 2011.
Millions of yen
2011
High-Performance
Fibers Polyester FibersFilms and Plastics
Pharmaceuticals and Home
Health CareTrading and
Retail OthersElimination and
corporateConsolidated
total
Loss on impairment (*1) ¥549 ¥537 ¥148 ¥— ¥— ¥558 ¥— ¥1,792
Thousands of U.S. dollars
2011
High-Performance
Fibers Polyester FibersFilms and Plastics
Pharmaceuticals and Home
Health CareTrading and
Retail OthersElimination and
corporateConsolidated
total
Loss on impairment (*1) $6,603 $6,458 $1,780 $— $— $6,710 $— $21,551
(*1) The figure for “Others” is losses on impairment of power supply equipment and/or facilities.
Goodwill by reportable segment for the year ended March 31, 2011.
Millions of yen
2011
High-Performance
Fibers Polyester FibersFilms and Plastics
Pharmaceuticals and Home
Health CareTrading and
Retail OthersElimination and
corporateConsolidated
total
Amortization of goodwill ¥ 5,531 ¥— ¥ (40) ¥ 1,817 ¥16 ¥ (73) ¥— ¥ 7,251
Balance as of March 31, 2011 ¥39,869 ¥— ¥(135) ¥12,251 ¥62 ¥(274) ¥— ¥51,773
Thousands of U.S. dollars
2011
High-Performance
Fibers Polyester FibersFilms and Plastics
Pharmaceuticals and Home
Health CareTrading and
Retail OthersElimination and
corporateConsolidated
total
Amortization of goodwill $ 66,519 $— $ (481) $ 21,852 $192 $ (878) $— $ 87,204
Balance as of March 31, 2011 $479,483 $— $(1,624) $147,336 $746 $(3,295) $— $622,646

74 Teijin Limited
Note 20. Contingent liabilities
At March 31, 2011, the Companies were contingently liable as follows:
Millions of yenThousands of U.S. dollars
(a) As endorser of notes discounted or endorsed ¥ 52 $ 625
(b) As guarantors of indebtedness of:
Unconsolidated subsidiaries and affiliates ¥2,429 $29,212
Others 2,744 33,001
¥5,173 $62,213
(c) As guarantor of accounts receivable negotiated to third parties ¥3,086 $37,114
Note 21. Subsequent events
At the Board of Directors’ meeting held on May 9, 2011, appropriations of retained earnings for year-end dividends applicable to the year
ended March 31, 2011, were duly approved as follows:
Millions of yenThousands of U.S. dollars
Cash dividends: ¥3.00 ($0.04) per share ¥2,953 $35,514

75Teijin Limited
To the Shareholders and the Board of Directors of Teijin Limited:
We have audited the accompanying consolidated balance sheets of Teijin Limited and consolidated subsidiaries as of March 31, 2010 and
2011, the related consolidated statements of operations and comprehensive income for the year ended March 31, 2011, statement of
operations for the year ended March 2010, and statement of changes in net assets and cash flows for each of the years then ended
expressed in Japanese yen. These consolidated financial statements are the responsibility of the Company’s management. Our responsibility
is to independently express an opinion on these consolidated financial statements based on our audits.
We conducted our audits in accordance with auditing standards generally accepted in Japan. Those standards require that we plan and
perform the audit to obtain reasonable assurance about whether the financial statements are free of material misstatement. An audit includes
examining, on a test basis, evidence supporting the amounts and disclosures in the financial statements. An audit also includes assessing
the accounting principles used and significant estimates made by management, as well as evaluating the overall financial statement
presentation. We believe that our audits provide a reasonable basis for our opinion.
In our opinion, the consolidated financial statements referred to above present fairly, in all material respects, the consolidated financial
position of Teijin Limited and consolidated subsidiaries as of March 31, 2010 and 2011, and the consolidated results of their operations and
their cash flows for the years then ended, in conformity with accounting principles generally accepted in Japan.
The U.S. dollar amounts in the accompanying consolidated financial statements with respect to the year ended March 31, 2011 are
presented solely for convenience. Our audit also included the translation of yen amounts into U.S. dollar amounts and, in our opinion, such
translation has been made on the basis described in Note 1 to the consolidated financial statements.
(KPMG AZSA LLC)
Tokyo, Japan
June 22, 2011
Independent Auditors’ Report

76 Teijin Limited
Established June 17, 1918
Head Offices Osaka Head Office6-7, Minami Hommachi 1-chome, Chuo-ku, Osaka 541-8587, Japan
Tel: +81-6-6268-2132
Tokyo Head OfficeKasumigaseki Common Gate West Tower,
2-1, Kasumigaseki 3-chome, Chiyoda-ku, Tokyo 100-8585, Japan
Tel: +81-3-3506-4529
Fiscal Year-End March 31
Common Stock Authorized 3,000,000,000 shares
Issued 984,758,665 shares
Paid-in capital ¥70,817 million
Shareholders 120,366
Number of Teijin Group Companies Japan 72
Overseas 78
Total 150
Number of Teijin Group Employees
(Consolidated)
Japan 9,954
Overseas 7,588
Total 17,542
Stock Exchange Listings Tokyo, Osaka
Stock Code 3401
Stock Transfer Agent Mitsubishi UFJ Trust and Banking Corporation
Dividends Dividends are usually declared in May and November.
Dividends are usually paid in or about May and November.
Reports Available to Shareholders and Investors Corporate Brochure
Annual Report
Fact Book
Kessan Tanshin (Japanese summary financial report)
The Teijin Group CSR Report
Annual Meeting of Shareholders The annual meeting of shareholders is held before the end of June.
Independent Public Accountants KPMG AZSA LLC
Teijin on the Internet http://www.teijin.co.jp
Teijin’s web site offers a wealth of corporate and product information, including the latest annual report,
financial results and corporate news.
Investor Relations If you have any questions or would like copies of any of our reports, please contact:
Yoshihito Usami,
General Manager,
Public Relations & Investor Relations Office,
Kasumigaseki Common Gate West Tower,
2-1, Kasumigaseki 3-chome,
Chiyoda-ku, Tokyo 100-8585, Japan
Tel: +81-3-3506-4407 Fax: +81-3-3506-4150
E-mail: [email protected]
Corporate DataAs of March 31, 2011

Product names and service names denoted with TM or ® are trademarks or registered trademarks of the Teijin Group in Japan and/or other countries. Product names and service names used in this report are trademarks or registered trademarks of the Teijin Group. Other product names and service names used in this report may be protected as their trademarks and/or trade names.
© 2011 Teijin Limited. All Rights Reserved.
Contents
2 Financial Highlights
4 Message from the CEO
8 The Teijin Group at a Glance
10 Business Group Review
10 Aramid Fibers Business Group
11 Carbon Fibers and Composites
Business Group
12 Polyester Fibers Business Group
13 Plastics Business Group
14 Films Business Group
15 Medical and Pharmaceuticals
Business Group
17 Fiber Products Marketing
Business Group
18 IT Business Group
19 New Business Development Group
20 Research and Development
24 Corporate Governance
27 Corporate Social Responsibility
29 Financial Section
30 Consolidated 11-Year Summary
32 Management’s Discussion and Analysis
40 Consolidated Financial Statements
76 Corporate Data
Composition of Sales in Fiscal 2010
13%
13%
26%
17%
26%
5%
Polyester Fibers
High-Performance Fibers
Films andPlastics
Pharmaceuticals and Home Health Care
Others
Trading and Retail
Net sales
up 6.5%
Free cash fl ow
up ¥2.4 billion
Operating income
up 3.6 times
Materials
Health Care
Servicesand Other
Disclaimer Regarding Forward-Looking Statements
Any statements in this document, other than
those of historical fact, are forward-looking
statements about the future performance of
Teijin and its Group companies, which are based
on management’s assumptions and beliefs in
light of information currently available and involve
risks and uncertainties. Actual results may differ
materially from these forecasts. Potential risks
and uncertainties include, but are not limited to,
domestic and overseas economic conditions,
such as consumer spending and private capital
expenditures; currency exchange rate fl uctua-
tions, notably with the Japanese yen, U.S. dollar,
Asian currencies, the euro and other currencies
in which Teijin operates its international business;
direct and indirect restrictions imposed by other
countries; fl uctuations in the market prices of
securities in which Teijin has substantial holdings;
and Teijin’s ability to maintain its strength in many
products and geographical areas, through such
means as new product introductions, in a market
that is highly competitive in terms of both price
and technology, pertinent to the industry to
which the Company primarily belongs.

http://www.teijin.co.jp
Printed in Japan using waterless printing. Issued 2011.7
Annual R
eport 2011
2020
20112010
20092008Net Sales
Operating Income
Net Income
●
●●
●●
Year ended March 31, 2011
Annual Report
Recommended