1
A patient-level meta-analysisA patient-level meta-analysis of the prognostic significance of the prognostic significance
of baseline quality of life (QOL) of baseline quality of life (QOL) for overall survival (OS) for overall survival (OS)
among 3704 patients among 3704 patients in 24 oncology clinical trialsin 24 oncology clinical trials
Angelina D. Tan, Paul J. Novotny, Judith S. Kaur, Jan C. Buckner, Paul L. Schaefer, Philip J. Stella, Phil Kuebler, Jeff A. Sloan
Division of Biostatistics, Mayo Clinic, Rochester, MN, Medical Oncology, Mayo Clinic, Rochester, MN, TCCOP, Toledo, OH, St. Joseph Mercy Health System, Ann Arbor, MI
ASCO, Chicago, June 2, 2008
2
Philosophical QuestionPhilosophical Question
Is there a relationship
between a cancer patient’s
self-reported baseline quality of life (QOL)
and overall survival (OS)?

3
BackgroundBackground
• Theoretical framework from Wilson and Cleary (Ferrans, 2005)
• A recent literature review (n=13,874) indicated that in 36 of 39 studies indicated that at least one patient-reported outcome (PRO) was significantly associated with overall survival (Gotay, JCO, 26: 1355 -1363, March 2008)
4
Prognostic Evidence: Simple PROs Prognostic Evidence: Simple PROs
• Single-item symptom distress prognostic for lung cancer survival (Degner, JPSM, 1995)
• Simple single-item overall measure of QOL (Sloan, JCO, 1998)
5
Prognostic Evidence: the next stepPrognostic Evidence: the next step
• Research to date has focused primarily on:• Individual studies• Multi-item PROs• Advanced Disease
• This led us to explore pooled analysis across multiple studies
6
MethodsMethods
• Studies were conducted either at the Mayo Clinic Cancer Center or in the North Central Cancer Treatment Group
• 3704 total patients (24 clinical trials)

7
Studies IncludedStudies Included
• 8 GI cancer treatment studies
• 5 cancer control studies
• 6 lung cancer treatment studies
• 2 QOL assessment studies
• 3 other studies (various treatment trials)
8
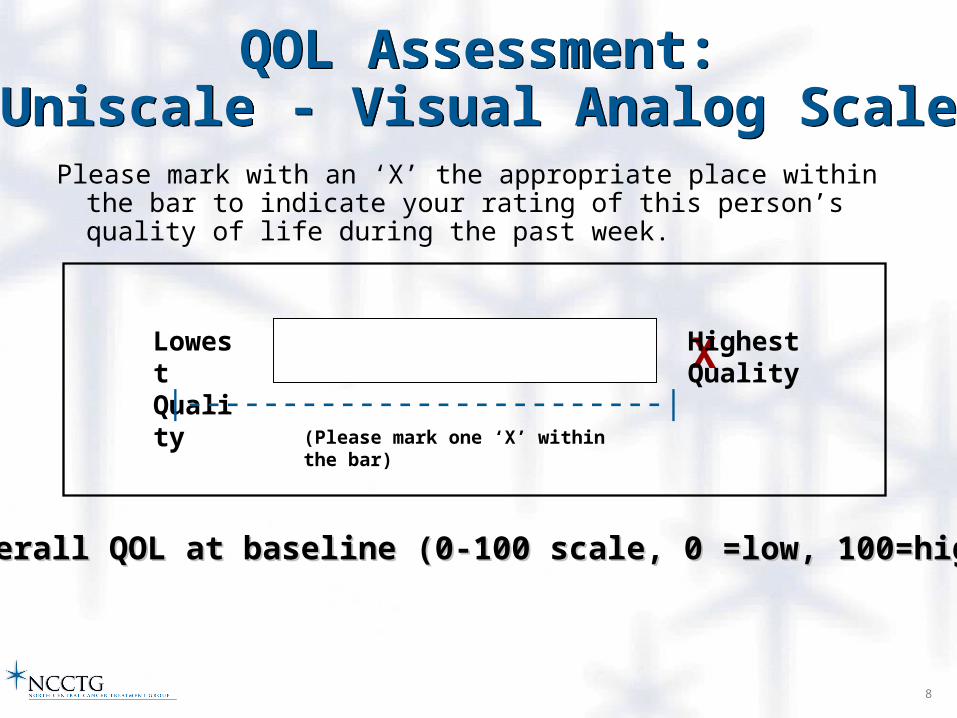
QOL Assessment:Uniscale - Visual Analog Scale
QOL Assessment:Uniscale - Visual Analog Scale
Please mark with an ‘X’ the appropriate place within the bar to indicate your rating of this person’s quality of life during the past week.
XLowest Quality
Highest Quality
(Please mark one ‘X’ within the bar)
Overall QOL at baseline (0-100 scale, 0 =low, 100=high)Overall QOL at baseline (0-100 scale, 0 =low, 100=high)
|-------------------------|
9
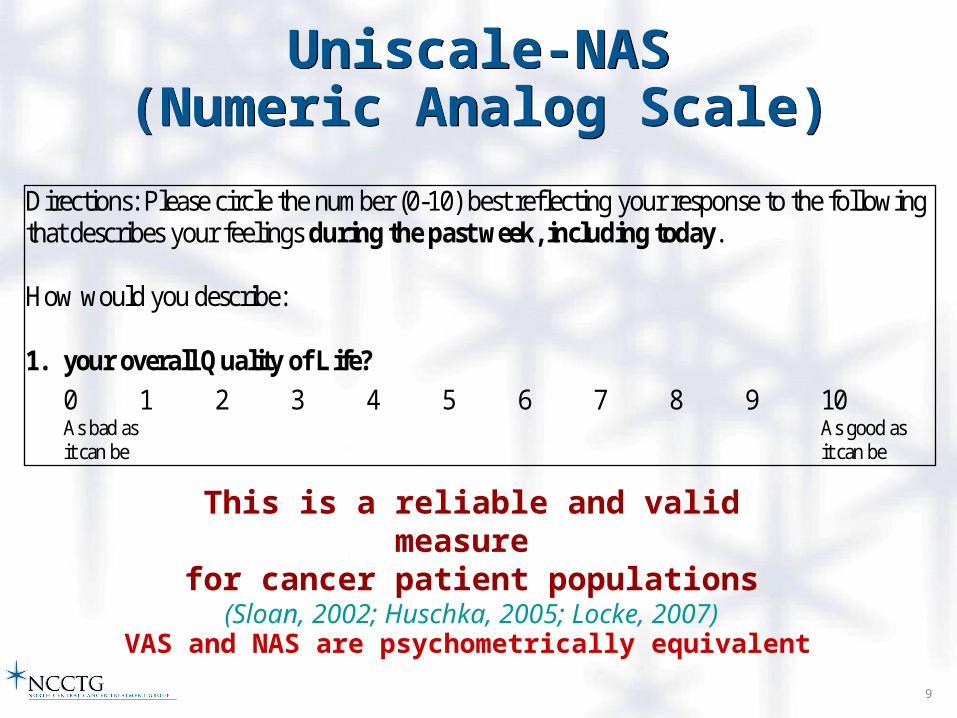
Uniscale-NAS(Numeric Analog Scale)
Uniscale-NAS(Numeric Analog Scale)
Directions: Please circle the number (0-10) best reflecting your response to the following that describes your feelings during the past week, including today. How would you describe: 1. your overall Quality of Life? 0 1 2 3 4 5 6 7 8 9 10 As bad as As good as it can be it can be
This is a reliable and valid measure for cancer patient populations
(Sloan, 2002; Huschka, 2005; Locke, 2007)
VAS and NAS are psychometrically equivalent
10
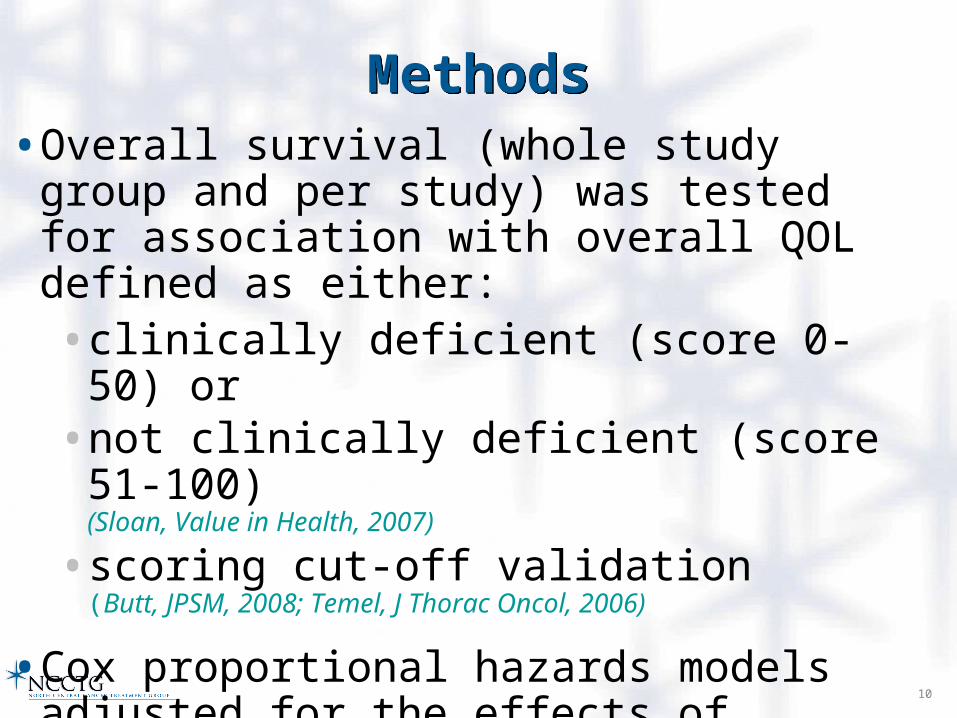
MethodsMethods• Overall survival (whole study group and per
study) was tested for association with overall QOL defined as either:• clinically deficient (score 0-50) or • not clinically deficient (score 51-100)
(Sloan, Value in Health, 2007)
• scoring cut-off validation (Butt, JPSM, 2008; Temel, J Thorac Oncol, 2006)
• Cox proportional hazards models adjusted for the effects of performance score, race, site, age and gender
11
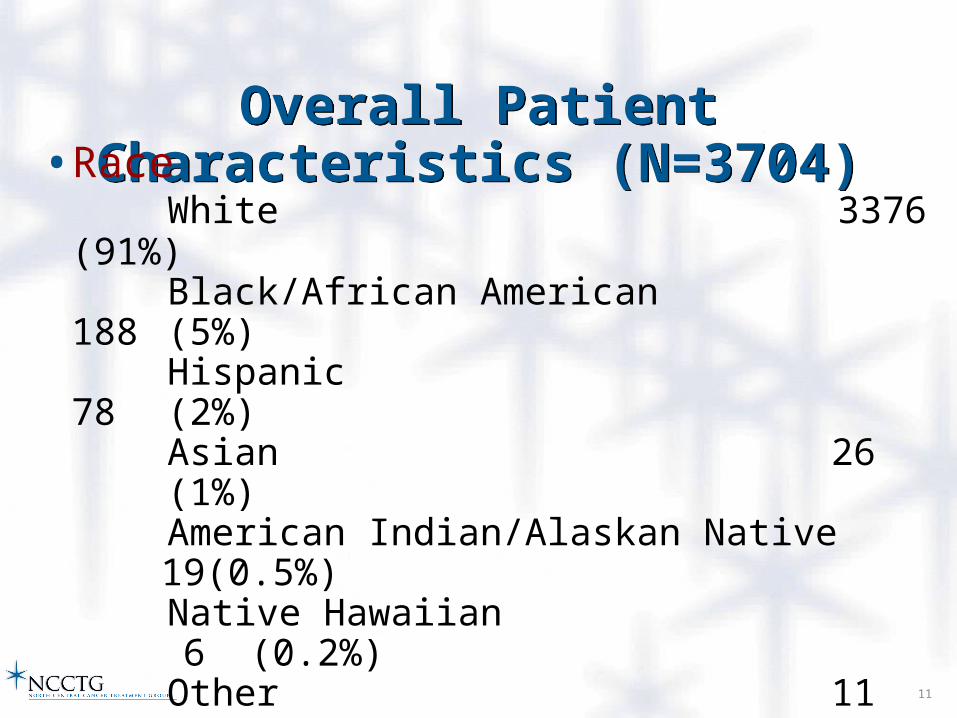
Overall Patient Characteristics (N=3704)Overall Patient Characteristics (N=3704)• Race
White 3376 (91%)
Black/African American 188 (5%)Hispanic 78 (2%)Asian 26 (1%)American Indian/Alaskan Native
19(0.5%)Native Hawaiian 6
(0.2%)Other 11
(0.3%)
• Age (Median, Range) (63, 18-95)
• % Female 44
12
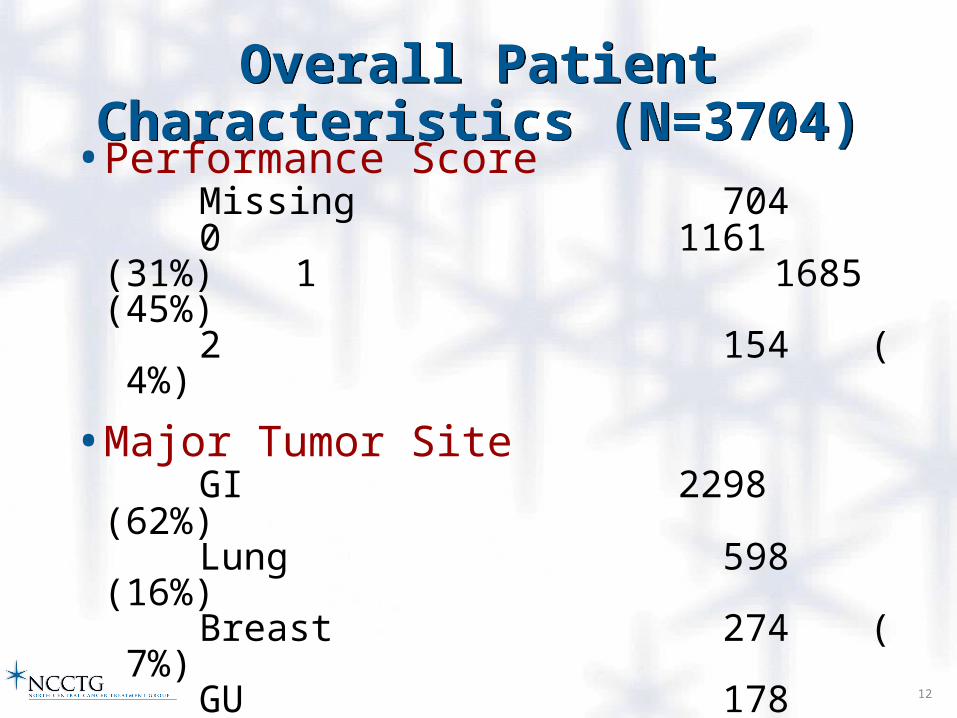
Overall Patient Characteristics (N=3704)Overall Patient Characteristics (N=3704)
• Performance ScoreMissing 7040 1161 (31%) 1 1685 (45%)2 154 ( 4%)
• Major Tumor SiteGI 2298 (62%)Lung 598 (16%)Breast 274 ( 7%)GU 178 ( 5%)
Other 332 ( 9%)Unknown 24 ( 1%)
13
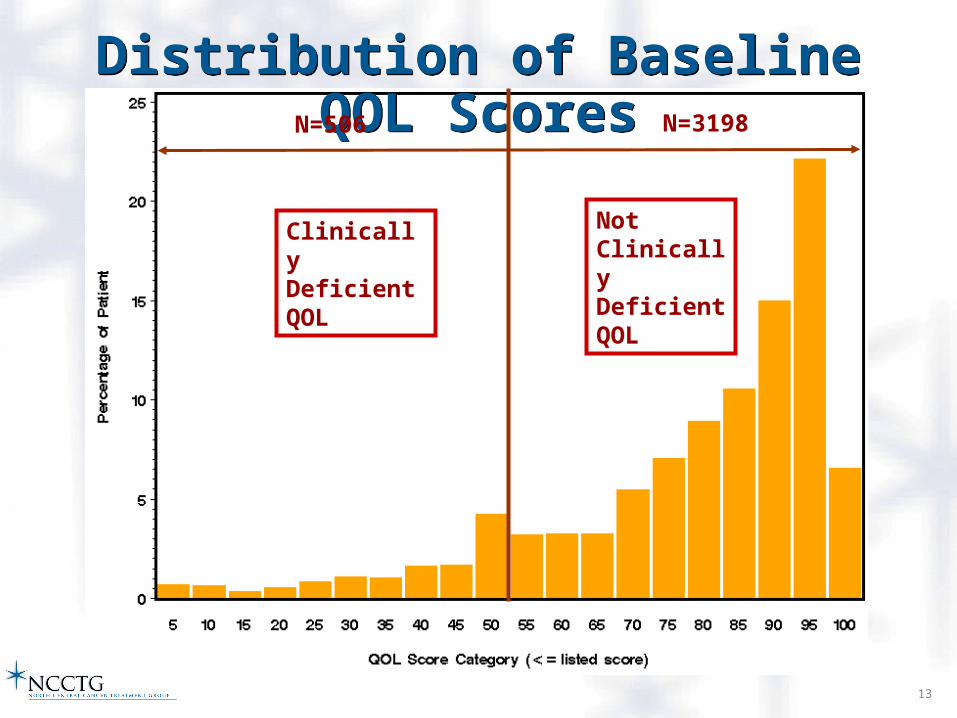
Distribution of Baseline QOL ScoresDistribution of Baseline QOL Scores
NotClinically Deficient QOL
N=506 N=3198
Clinically DeficientQOL
14
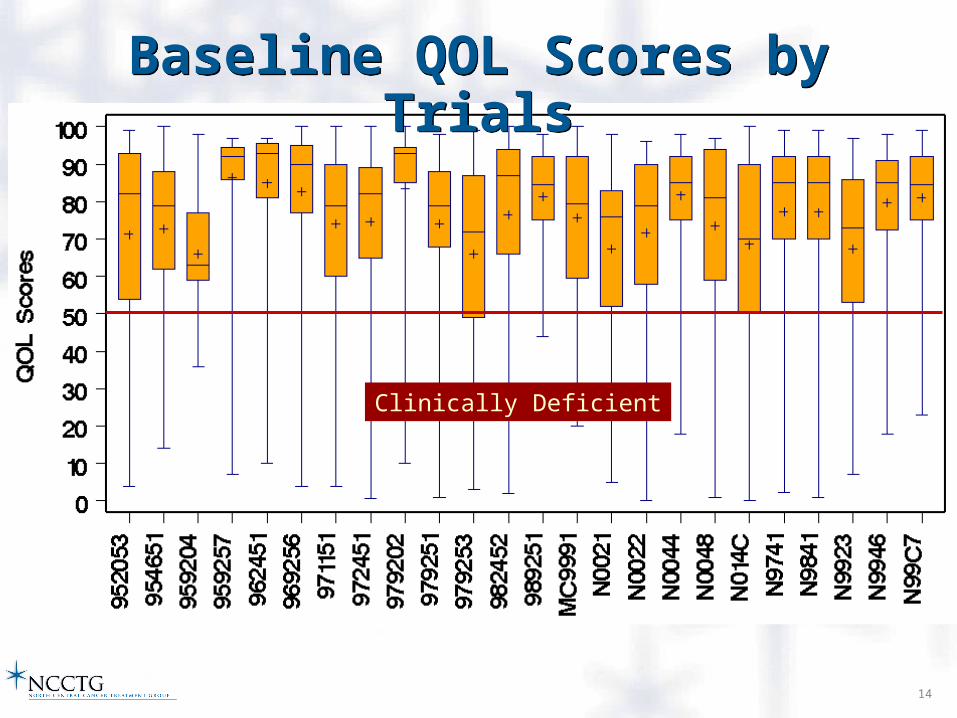
Baseline QOL Scores by TrialsBaseline QOL Scores by Trials
Clinically Deficient
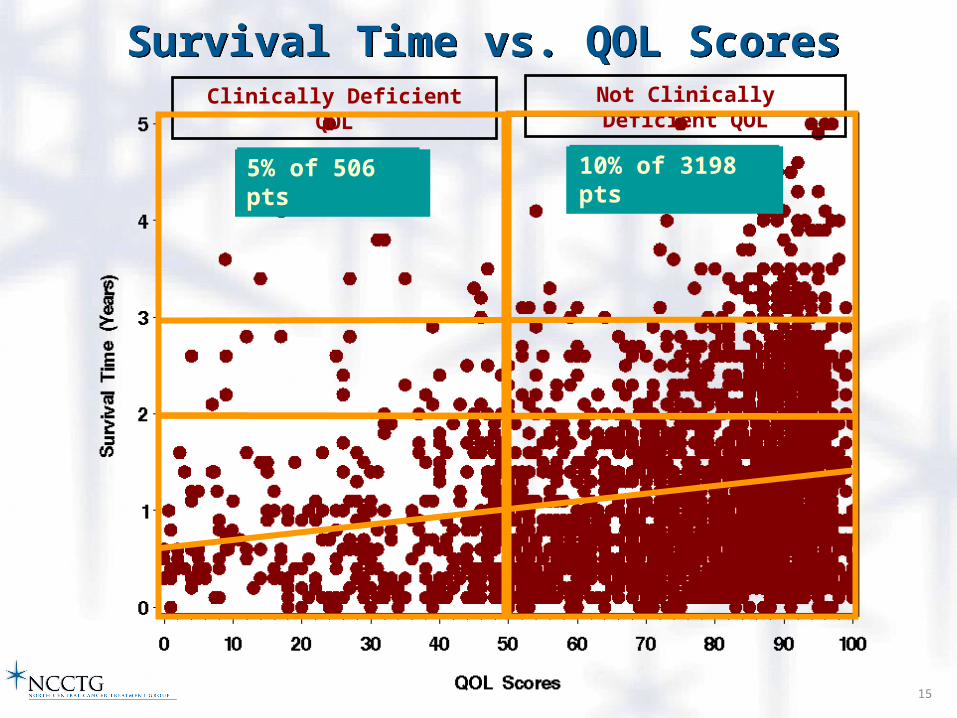
15
Survival Time vs. QOL ScoresSurvival Time vs. QOL ScoresClinically Deficient QOL Not Clinically Deficient QOL
12% of 506 pts5% of 506 pts 24% of 3198 pts10% of 3198 pts
16
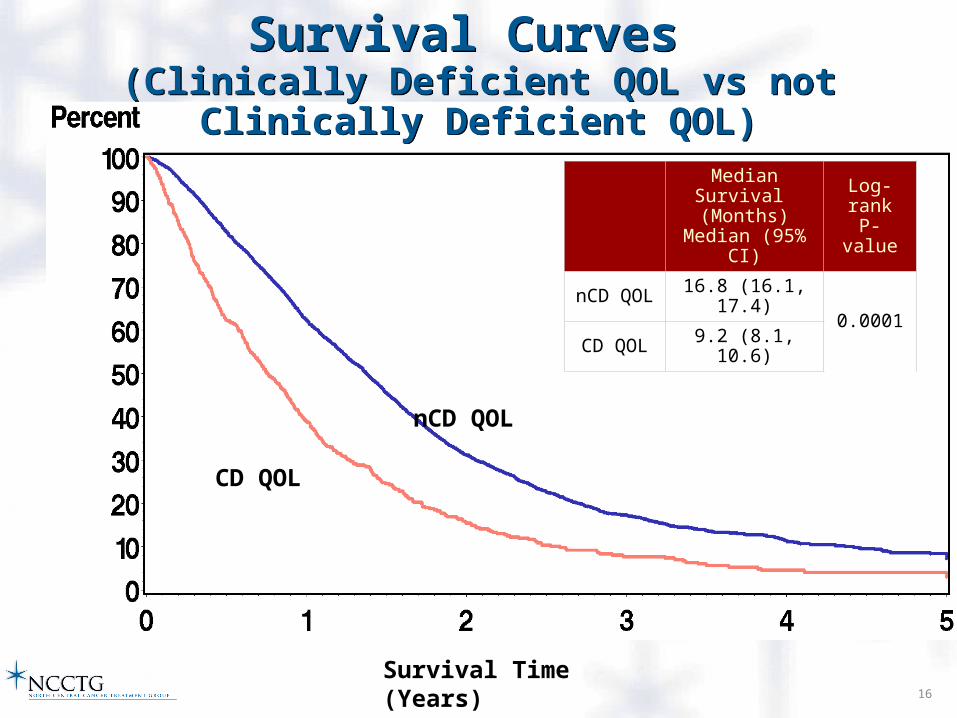
Survival Curves (Clinically Deficient QOL vs not Clinically Deficient QOL)
Survival Curves (Clinically Deficient QOL vs not Clinically Deficient QOL)
Median Survival (Months)
Median (95% CI)
Log-rank
P-value
nCD QOL 16.8 (16.1, 17.4)0.0001
CD QOL 9.2 (8.1, 10.6)
Survival Time (Years)
nCD QOL
CD QOL
17
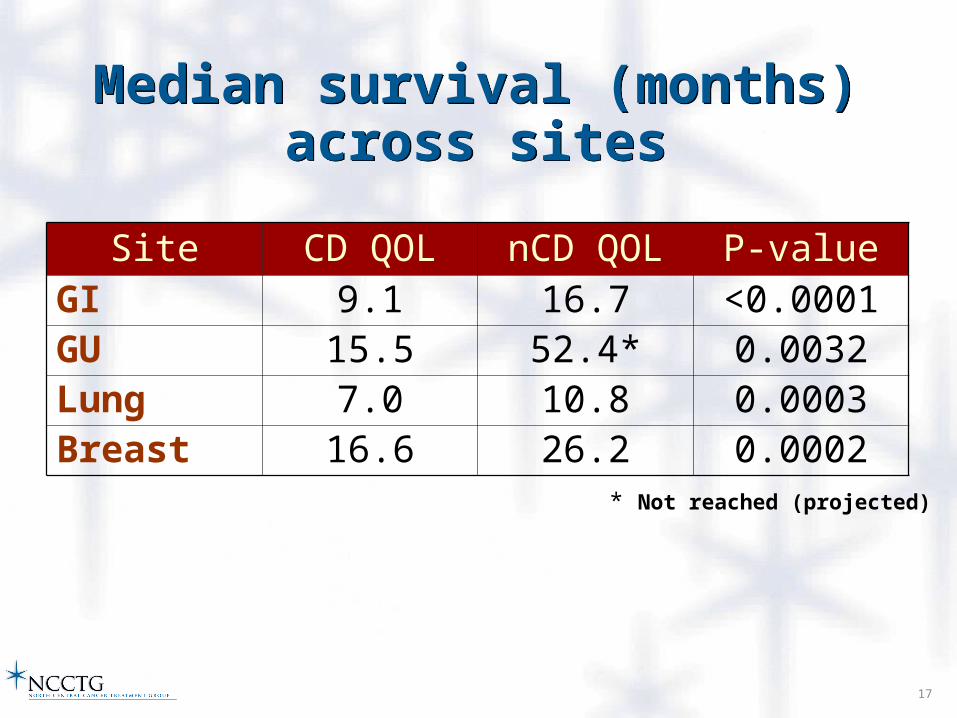
Median survival (months) across sitesMedian survival (months) across sites
Site CD QOL nCD QOL P-valueGI 9.1 16.7 <0.0001GU 15.5 52.4* 0.0032Lung 7.0 10.8 0.0003Breast 16.6 26.2 0.0002
* Not reached (projected)
18
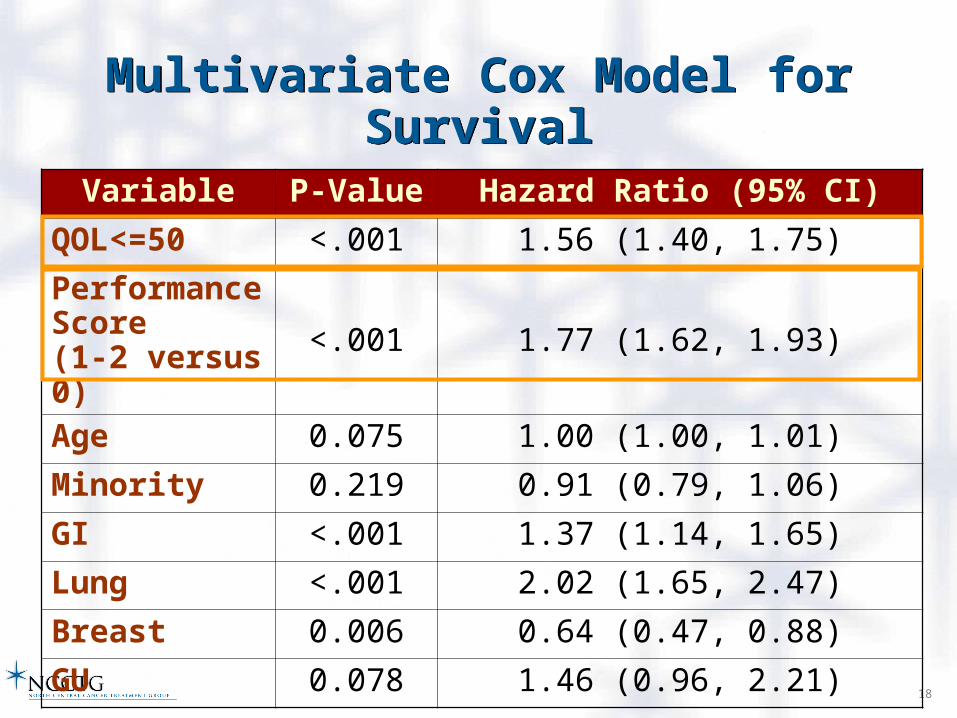
Multivariate Cox Model for SurvivalMultivariate Cox Model for Survival
Variable P-Value Hazard Ratio (95% CI)
QOL<=50 <.001 1.56 (1.40, 1.75)
Performance Score (1-2 versus 0)
<.001 1.77 (1.62, 1.93)
Age 0.075 1.00 (1.00, 1.01)
Minority 0.219 0.91 (0.79, 1.06)
GI <.001 1.37 (1.14, 1.65)
Lung <.001 2.02 (1.65, 2.47)
Breast 0.006 0.64 (0.47, 0.88)
GU 0.078 1.46 (0.96, 2.21)
19
DiscussionDiscussion
• Simplicity of the single item
• Demonstrates superior sensitivity over multiple item measures as prognostic indicator (Huschka, 2005 for example)
• For more detailed clinical investigation, further assessment would be necessary or interventions initiated.
20
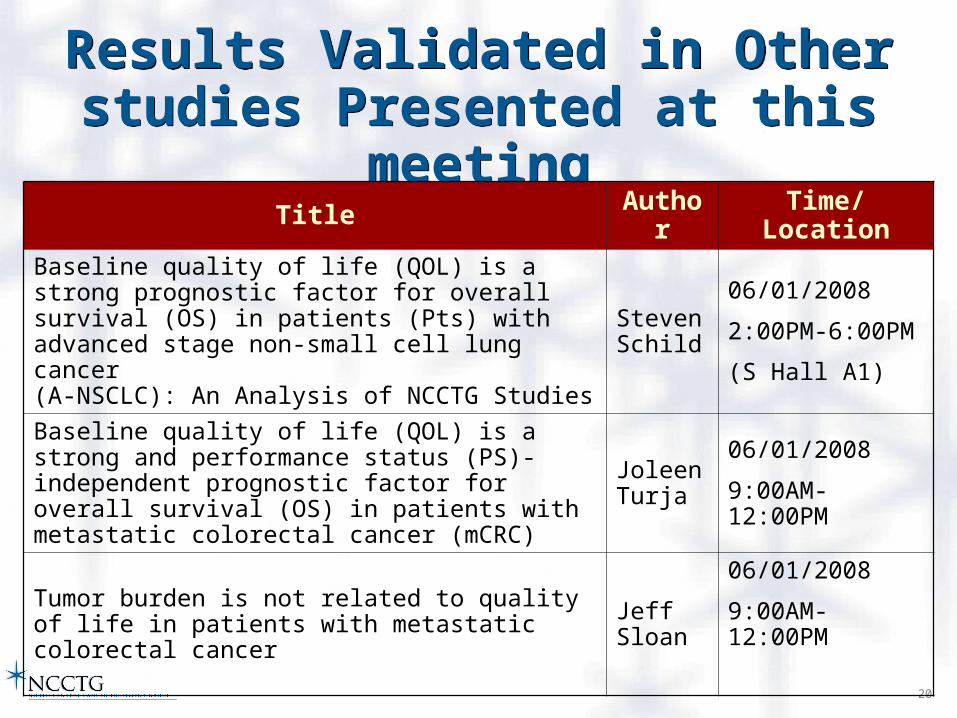
Results Validated in Other studies Presented at this meeting
Results Validated in Other studies Presented at this meeting
Title Author Time/Location
Baseline quality of life (QOL) is a strong prognostic factor for overall survival (OS) in patients (Pts) with advanced stage non-small cell lung cancer (A-NSCLC): An Analysis of NCCTG Studies
Steven Schild
06/01/2008
2:00PM-6:00PM
(S Hall A1)
Baseline quality of life (QOL) is a strong and performance status (PS)-independent prognostic factor for overall survival (OS) in patients with metastatic colorectal cancer (mCRC)
Joleen Turja
06/01/2008
9:00AM-12:00PM
Tumor burden is not related to quality of life in patients with metastatic colorectal cancer
Jeff Sloan
06/01/2008
9:00AM-12:00PM
21
ConclusionConclusion
• There is a strong and demonstrable relationship between baseline QOL and OS for patients on cancer clinical trials
• QOL is a strong and independent prognostic factor for OS independent of PS in a wide variety of oncology patient populations
22
What could the findings mean for future clinical trials?
What could the findings mean for future clinical trials?
• Stratify for future randomized trials
• Improve efficiency of trial, remove confounding of QOL impact on treatment outcomes which may not be balanced across treatment arms
23
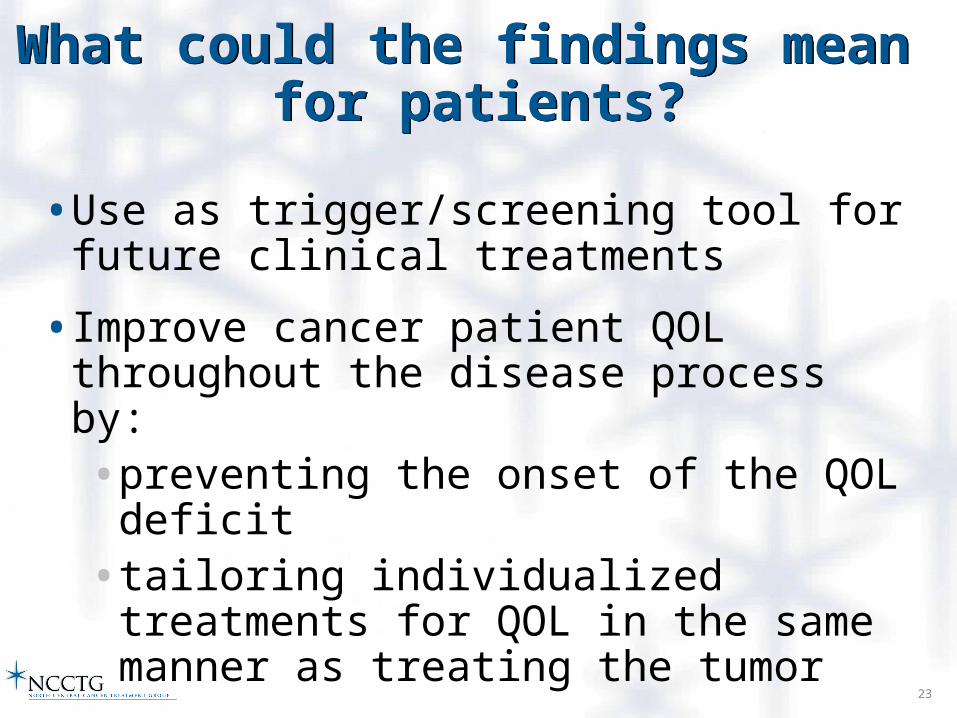
What could the findings mean for patients?
What could the findings mean for patients?
• Use as trigger/screening tool for future clinical treatments
• Improve cancer patient QOL throughout the disease process by:• preventing the onset of the QOL deficit• tailoring individualized treatments for QOL
in the same manner as treating the tumor
25
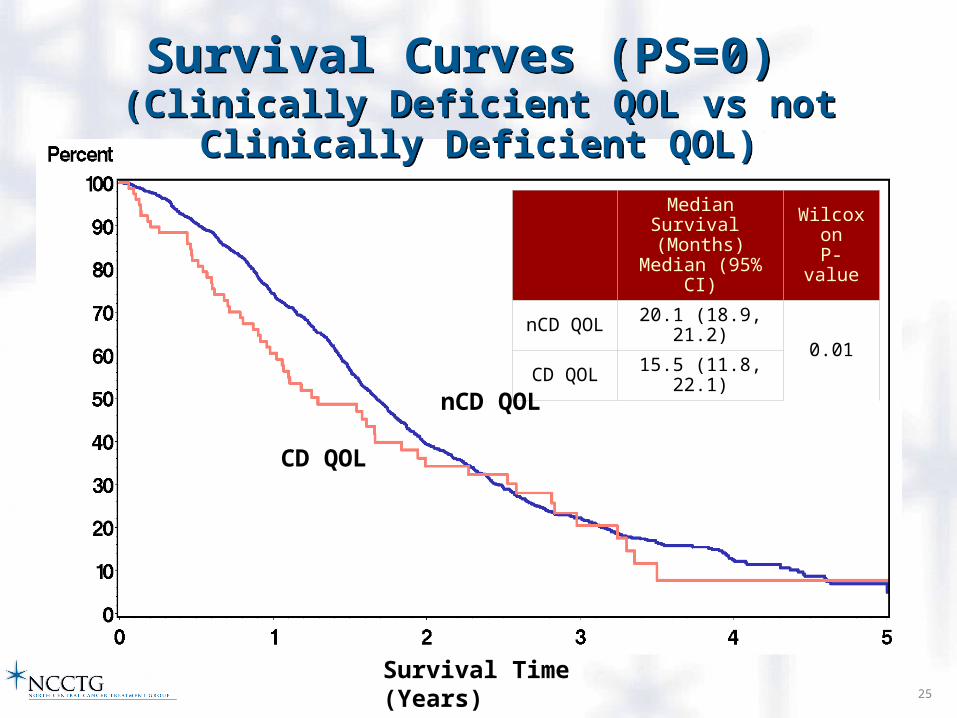
Survival Curves (PS=0) (Clinically Deficient QOL vs not Clinically Deficient QOL)
Survival Curves (PS=0) (Clinically Deficient QOL vs not Clinically Deficient QOL)
Median Survival (Months)
Median (95% CI)
WilcoxonP-value
nCD QOL 20.1 (18.9, 21.2)0.01
CD QOL 15.5 (11.8, 22.1)
Survival Time (Years)
nCD QOL
CD QOL

26
Median Survival (Months)
Median (95% CI)
WilcoxonP-value
nCD QOL 12.1 (11.4, 12.9)<0.0001
CD QOL 7.6 (6.8, 8.9)
Survival Time (Years)
nCD QOL
CD QOL
Survival Curves (PS=1,2) (Clinically Deficient QOL vs not Clinically Deficient QOL)
Survival Curves (PS=1,2) (Clinically Deficient QOL vs not Clinically Deficient QOL)
Recommended