16 May 2013

Agenda
›Highlights›Highlights
›Project Highlights›Project Highlights
›Operating Performance›Operating Performance
›Financial Performance›Financial Performance
›Appendix›Appendix

HighlightsHighlights
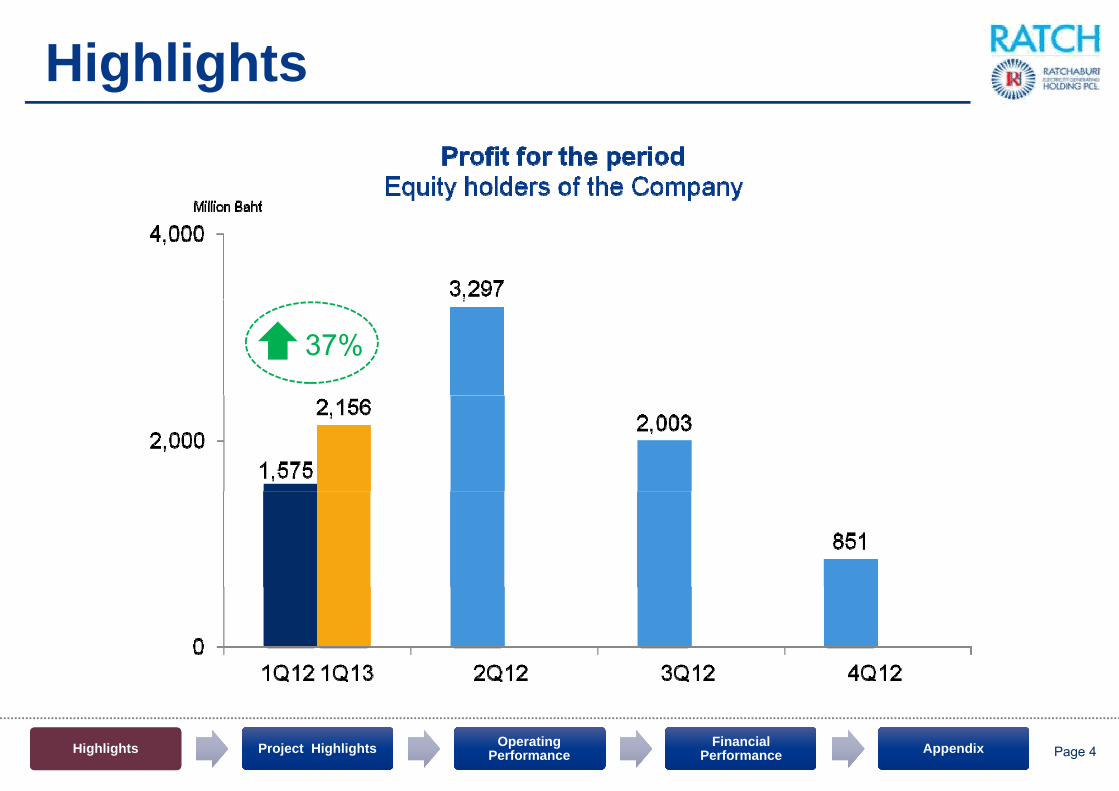
Highlights
37%
HighlightsHighlights Project HighlightsProject Highlights Operating Performance
Operating Performance
Financial Performance
Financial Performance AppendixAppendix Page 4

Highlights COD
: Huay Bong 2 Wind-Turbine Power Project 8 Feb 2013y g j
Signed Agreement
: Signed PPA of Xe-Pian Xe-Namnoy Hydroelectric Power Plant Project 6 Feb 2013
HighlightsHighlights Project HighlightsProject Highlights Operating Performance
Operating Performance
Financial Performance
Financial Performance AppendixAppendix Page 5
Project HighlightsProject Highlights

Overview of RATCH projectsPower GenerationI Renewable EnergyII Related BusinessIII
End of 2012 I IIUnit : MW
T t l C itt d C it b 2018 6 336 52 MWLocation
Power Generation Renewable Energy Grand Total
Gas Coal Hydro Capital Investment Wind Solar
Thailand 4,351.25 - - 20.70 23.98 4,395.93
Laos 153 75 89 05 242 80
653.5210%
Total Committed Capacity by 2018 = 6,336.52 MW
Unit : MW
Laos - - 153.75 89.05 - - 242.80
Australia 455.52 144.00 - - 54.00 - 653.52
Total 4,806.77 144.00 153.75 89.05 74.70 23.98 5,292.25 4,586.5073%
1,096.5017%
LocationPower Generation Renewable Energy
Grand Total Gas(SPP) Coal Hydro Wind Biomass
Project from 2013 to 2018I II
Unit : MW
Thailand 132.80 - - 53.81 3.96 190.57
Laos - 751.20 102.50 - - 853.70
Total 132.80 751.20 102.50 53.81 3.96 1,044.27
Thailand Laos Australia
Related BusinessIII
• RATCH-LAO Services Co., Ltd• Chubu Ratchaburi Electric Services Co., Ltd• RATCH O&M Co., Ltd
Sukhothai Energy Co., Ltd
Service of flared gas quality improvement
EGAT Diamond Service Co., Ltd
Gas turbine maintenance
• Phu Fai Mining Co., Ltd• Songkhla Biofuel Co., Ltd
Fuel Supply
HighlightsHighlights Project HighlightsProject Highlights Operating Performance
Operating Performance
Financial Performance
Financial Performance AppendixAppendix Page 7
Operations and maintenance Service of flared gas quality improvement Gas turbine maintenance Fuel Supply
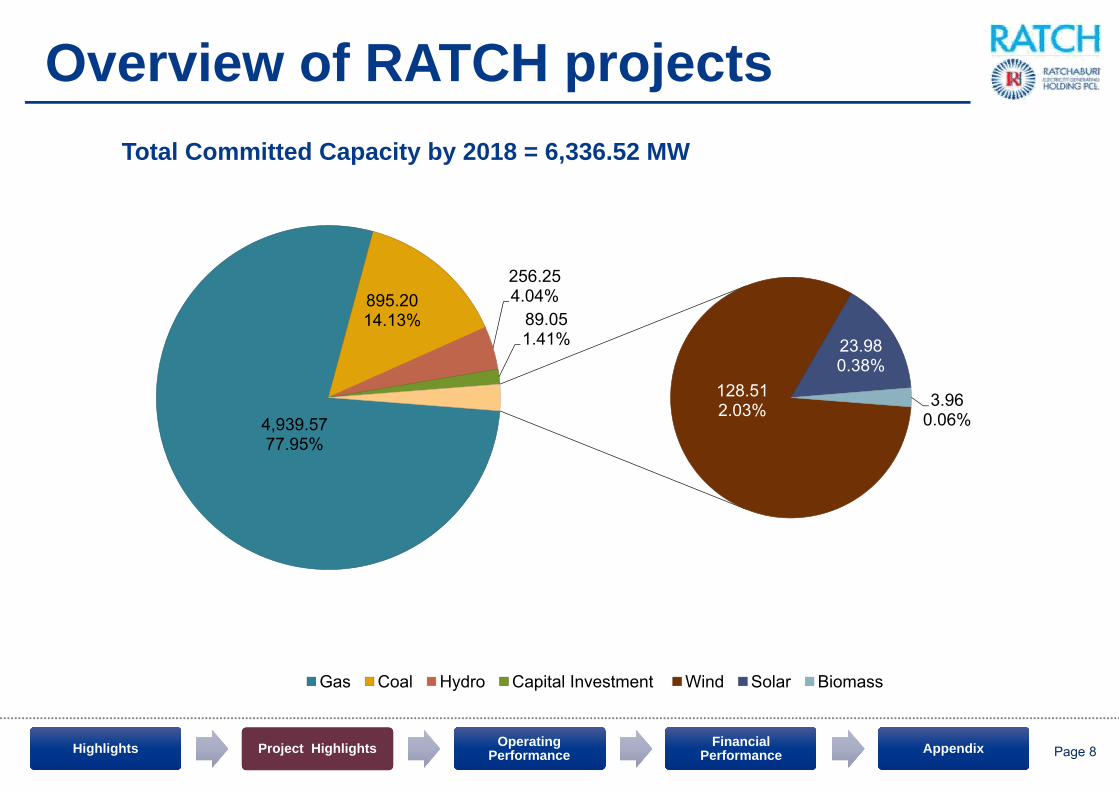
Overview of RATCH projectsTotal Committed Capacity by 2018 = 6,336.52 MW
895 20256.254 04%895.20
14.13%4.04%
89.051.41%
128.51
23.980.38%
3 964,939.5777.95%
128.512.03% 3.96
0.06%
Gas Coal Hydro Capital Investment Wind Solar Biomass
HighlightsHighlights Project HighlightsProject Highlights Operating Performance
Operating Performance
Financial Performance
Financial Performance AppendixAppendix Page 8
Gas Coal Hydro Capital Investment Wind Solar Biomass

O tiOperating P fPerformance

RATCHGEN Operation PerformanceDispatch Factor 1Q13 & 1Q12Dispatch Factor 1Q13 & 1Q12 Equivalent Availability Factor 1Q13 & 1Q12Equivalent Availability Factor 1Q13 & 1Q12
Unit: % Unit: %
100100.00 99.26 96.76
100.00 97.98 97.89
85.96
100
62.84
78.34
66.85 62.82
70.90
81.54
60
80 74.65 76.84 77.27
60
80
42.00 40
60
40
60
6.05
22.05
12.86
0
20
0
20
0TP # 1 TP # 2 CCGT # 1 CCGT # 2 CCGT # 3
1Q13 1Q12
TP # 1 TP # 2 CCGT # 1 CCGT # 2 CCGT # 3
1Q13 1Q12
HighlightsHighlights Project HighlightsProject Highlights Operating Performance
Operating Performance
Financial Performance
Financial Performance AppendixAppendix Page 10

Fi i lFinancial P fPerformance

Statements of Comprehensive IncomeUnit : in Million Baht 1Q13 4Q12 3Q12 2Q12 1Q12Revenues 12,411.95 13,269.49 13,970.28 17,354.99 12,014.87
C t & E (9 550 82) (11 407 33) (10 587 87) (13 780 46) (9 117 64)Cost & Expenses (9,550.82) (11,407.33) (10,587.87) (13,780.46) (9,117.64)
Gross Profit 2,861.13 1,862.16 3,382.41 3,574.53 2,897.23
Share of profit of jointly-controlled entities and associates included gain (loss) on exchange rate
529.46 16.73 372.04 255.82 106.01
EBITDA 3,390.59 1,878.89 3,754.45 3,830.35 3,003.24
Gain (Loss) on exchange rate of subsidiaries 447.60 566.42 30.73 (245.28) 446.18
EBITDA included gain (loss) from associated 3,838.19 2,445.31 3,785.18 3,585.07 3,449.42
Gain on disposal of long-term investment - - - 783.68 -
Gain on termination of power purchase agreement - - - 1,069.44 -
Depreciation & Amortization (951.76) (955.34) (859.61) (1,031.00) (1,048.32)p ( ) ( ) ( ) ( ) ( )
EBIT 2,886.43 1,489.97 2,925.57 4,407.19 2,401.10
Finance costs (496.02) (560.89) (578.82) (616.68) (643.63)
Income tax expense (265.99) (150.44) (371.94) (134.25) (230.60)p ( ) ( ) ( ) ( ) ( )
Profit for the period 2,124.42 778.64 1,974.81 3,656.26 1,526.87
Non-controlling interests 31.17 72.61 27.88 (359.32) 48.52
Profit for the period: 2 155 59 851 25 2 002 69 3 296 94 1 575 39
HighlightsHighlights Project HighlightsProject Highlights Operating Performance
Operating Performance
Financial Performance
Financial Performance AppendixAppendix Page 12
pEquity holders of the Company 2,155.59 851.25 2,002.69 3,296.94 1,575.39

Statements of Comprehensive IncomeUnit : in Million Baht 1Q13 1Q12 %Revenues 12,411.95 12,014.87 3.30
Cost & Expenses (9,550.82) (9,117.64) 4.75
Gross Profit 2,861.13 2,897.23 (1.25)
Share of profit of jointly-controlled entities and associates included gain (loss) on exchange rate
529.46 106.01 n.a.included gain (loss) on exchange rate
EBITDA 3,390.59 3,003.24 12.90
Gain (Loss) on exchange rate of subsidiaries 447.60 446.18 0.32
EBITDA included gain (loss) from associated 3,838.19 3,449.42 11.27
Depreciation & Amortization (951.76) (1,048.32) (9.21)
EBIT 2,886.43 2,401.10 20.21
Finance costs (496.02) (643.63) (22.93)
Income tax expense (265.99) (230.60) 15.35
Profit for the period 2,124.42 1,526.87 39.14Profit for the period 2,124.42 1,526.87 39.14
Non-controlling interests 31.17 48.52 (35.76)
Profit for the period: Equity holders of the Company 2,155.59 1,575.39 36.83
HighlightsHighlights Project HighlightsProject Highlights Operating Performance
Operating Performance
Financial Performance
Financial Performance AppendixAppendix Page 13

Statements of Financial PositionTotal Assets Million Baht Total Liabilities & Equity Million Baht
Assets Liabilities
Current Assets 20,770.66 Loans from Financial Institutions & 28,614.31,Debentures
,
Investment in Jointly-controlled entities/Associates
14,918.48 Other Liabilities 12,418.68
Property plant & equipments 45,120.53Property, plant & equipments 45,120.53
Others Assets 14,864.23
Total Assets 95,673.90 Total Liabilities 41,032.99
Equity
Issued and paid-up share capital 16,031.78
Other components of equity 859.20
Retained earnings 37,043.16
Total equity attributable to owners of h C
53,934.14the Company
Non-controlling interests 706.77
Total Liabilities & Equity 95,673.90
HighlightsHighlights Project HighlightsProject Highlights Operating Performance
Operating Performance
Financial Performance
Financial Performance AppendixAppendix Page 14
Total Liabilities & Equity 95,673.90

Financial Ratios
1.66 1.701.80
2.00
13 3114.91 15.32 16.27
15 00
20.00
1.34 1.381.31
1.20
1.40
1.6011.01
13.31
10.00
15.00
1.001Q12 2Q12 3Q12 4Q12 1Q13
Current Ratio (times)
5.001Q12 2Q12 3Q12 4Q12 1Q13
ROE (%)
2.27
1 38 1 492.00
2.50
35 36 35.7436.53
37.20
36 00
38.00
1.091.38
0.59
1.49
0 50
1.00
1.50
33.23
35.36
34.00
36.00
0.00
0.50
1Q12 2Q12 3Q12 4Q12 1Q13
EPS (Baht per share)
32.001Q12 2Q12 3Q12 4Q12 1Q13
Book Value (Baht per share)
HighlightsHighlights Project HighlightsProject Highlights Operating Performance
Operating Performance
Financial Performance
Financial Performance AppendixAppendix Page 15
( p ) ( p )

Financial Ratios0.56
0.48 0.470.50
0.60
0.330.37
0.30
0.40
0.201Q12 2Q12 3Q12 4Q12 1Q13
Net Debt/Equity (times)
2.18
1.69 1.652.00
2.50
0 16 0 160.18
0.20
1.19 1.30
0 50
1.00
1.500.15 0.15
0.13
0.16 0.16
0.14
0.16
0.00
0.50
1Q12 2Q12 3Q12 4Q12 1Q13
Net Debt / EBITDA
0.10
0.12
1Q12 2Q12 3Q12 4Q12 1Q13
EBITDA /ASSET
HighlightsHighlights Project HighlightsProject Highlights Operating Performance
Operating Performance
Financial Performance
Financial Performance AppendixAppendix Page 16
Net Debt / EBITDA EBITDA /ASSET

Appendixppe dRATCH Company StructureRATCH Company Structure

RATCH Company Structure
100 % 100 % 100 % 33.33 % 40% 100 % 40 % 40 % 25%3,645 MW 751.2 MW 84 MW 48.8 MW 102.5 MW
50%25 %
Ratchaburi Electricity Generating Company
Limited
Ratchaburi Gas Company Limited
Ratch Udom Power Company Limited
SouthEast Asia Energy Limited
Hongsa Power Company Limited
RH International Corporation
Limited
Ratchaburi World Cogeneration
Company Limited
Nava Nakorn Electricity Generation
Company Limited0% 100% %
Xe-Pian Xe-Namnoy Power Company
Limited
3,645 MW 751.2 MW
1 878 MW
102.5 MW
KK Power Company Limited
Nam Ngum 3Power Co., Ltd
Ratchaburi AlliancesTri Energy Nam Ngum 2 Power
50% 100% 75%100 %350 MW 153.75 MW
3,645 MW.1,878 MW.
210 MW. 410 MW.122 MW.
Ratchaburi Alliances Company Limited
Tri Energy Company Limited
Nam Ngum 2 Power Company Limited RH International
(Mauritius)Corporation Limited25%
100 %350 MW
700 MW. 615 MW.
Ratchaburi Power Company Limited
RH International (Singapore)
Corporation Pte. Limited
80 %1,400 MW.4 307%
RATCH-LAO EDL-Generation RATCH – Australia
80 %
653.52 MW
4.307%
5.801%
89.05 MW
HighlightsHighlights Project HighlightsProject Highlights Operating Performance
Operating Performance
Financial Performance
Financial Performance AppendixAppendix Page 18
Services Company Limited Public Company Corporation Limited
816.9 MW.881 MW.

RATCH Company Structure
100 % 49 % 40 % 40 % 40 % 20 % 20 % 40 %
Ratchaburi Energy Company Limited
Solarta Company Limited
Solar Power (Korat 3) Company Limited
Solar Power (Korat 4) Company Limited
Solar Power (Korat 7) Company Limited
K.R. Two Co., Ltd First Korat Co., Ltd Songkhla Biomass Company Limited
16.78 MW 2.4 MW 2.4 MW 2.4 MW 20.7 MW
103.50 MW.
20.7 MW
103.50 MW.
3.96MW
Kh K Wi d P
55.18 %
100 % 33.11MW
34.25 MW. 6 MW. 6 MW. 6 MW. 9.9 MW.
Sustainable Energy Corporation Company Limited
Khao Kor Wind Power Company Limited
60 MW.
50 % 100 % 10 % 37.5 % 40% 100%100 %
Phu Fai Mining Company Limited
Songkhla Biofuel RATCH O&M Chubu Ratchaburi Electric Services Company Limited
RATCH-LAO Services EGAT Diamond ServiceRatchaburi Energy C Li it d
Sukhothai Energy C Li it d
51%
HighlightsHighlights Project HighlightsProject Highlights Operating Performance
Operating Performance
Financial Performance
Financial Performance AppendixAppendix Page 19
Company Limited Company LimitedServices Company Limited Company Limited Company LimitedCompany LimitedCompany Limited

Appendixppe dFinancial PerformanceFinancial Performance

RevenuesUnit : in Million Baht 1Q13 1Q12 Diff %Net Sales 11,912.73 11,756.95 155.78 1.33
AP - RG 2,938.63 2,767.20 171.43 6.20
- RAC 517.95 880.17 (362.22) (41.15)
EP (Fuel) - RG 8 270 50 7 876 49 394 01 5 00EP (Fuel) RG 8,270.50 7,876.49 394.01 5.00
- RAC 95.55 139.73 (44.18) (31.62)
- Flared Gas 2.20 27.04 (24.84) (91.86)
- VOM 87.90 66.32 21.58 32.54
Revenue from Rendering of services 45.95 29.61 16.34 55.18
Management service income 59.09 53.35 5.74 10.76
Interest Income 157.88 117.40 40.48 34.48
Di id d I 130 15 130 15Dividend Income 130.15 - 130.15 n.a.
Other Incomes 106.15 57.56 48.59 84.42
Total Revenues 12,411.95 12,014.87 397.08 3.30
HighlightsHighlights Project HighlightsProject Highlights Operating Performance
Operating Performance
Financial Performance
Financial Performance AppendixAppendix Page 21
Total Revenues 12,411.95 12,014.87 397.08 3.30
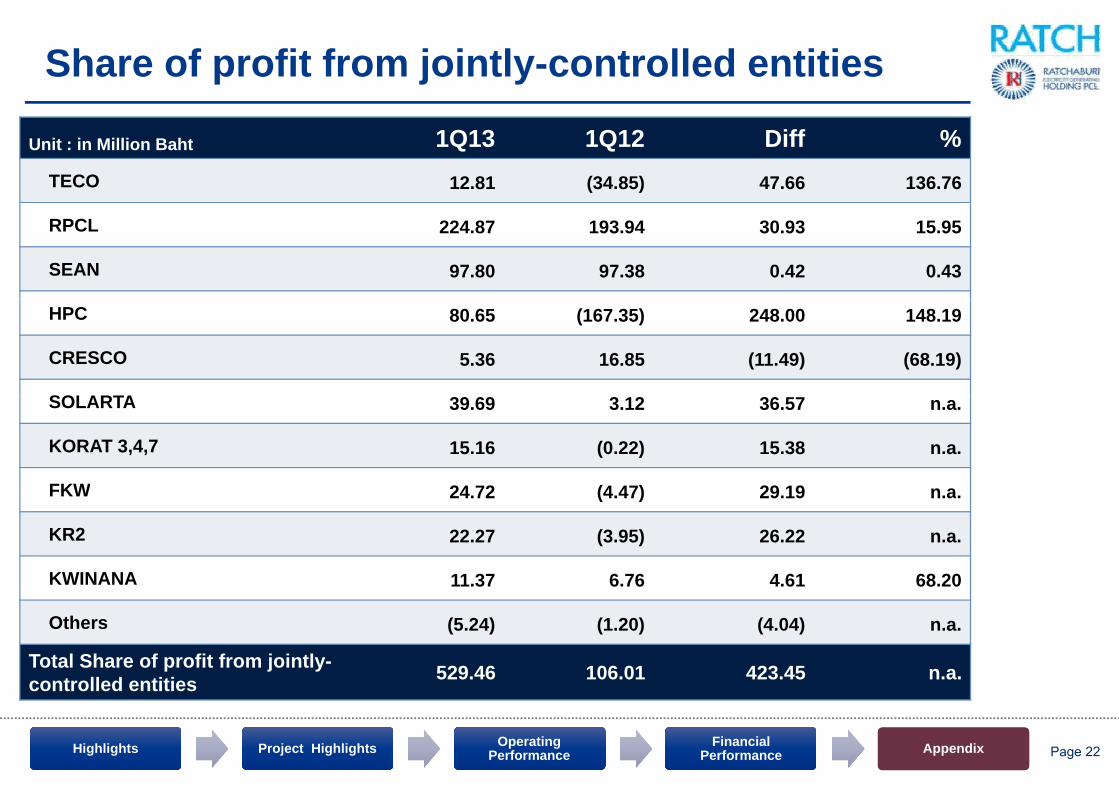
Share of profit from jointly-controlled entities
Unit : in Million Baht 1Q13 1Q12 Diff %TECO 12.81 (34.85) 47.66 136.76
RPCL 224.87 193.94 30.93 15.95
SEAN 97.80 97.38 0.42 0.43
HPC 80.65 (167.35) 248.00 148.19
CRESCO 5.36 16.85 (11.49) (68.19)
SOLARTASOLARTA 39.69 3.12 36.57 n.a.
KORAT 3,4,7 15.16 (0.22) 15.38 n.a.
FKW 24 72 (4 47) 29 19 n aFKW 24.72 (4.47) 29.19 n.a.
KR2 22.27 (3.95) 26.22 n.a.
KWINANA 11.37 6.76 4.61 68.20
Others (5.24) (1.20) (4.04) n.a.
Total Share of profit from jointly-controlled entities 529.46 106.01 423.45 n.a.
HighlightsHighlights Project HighlightsProject Highlights Operating Performance
Operating Performance
Financial Performance
Financial Performance AppendixAppendix Page 22
controlled entities
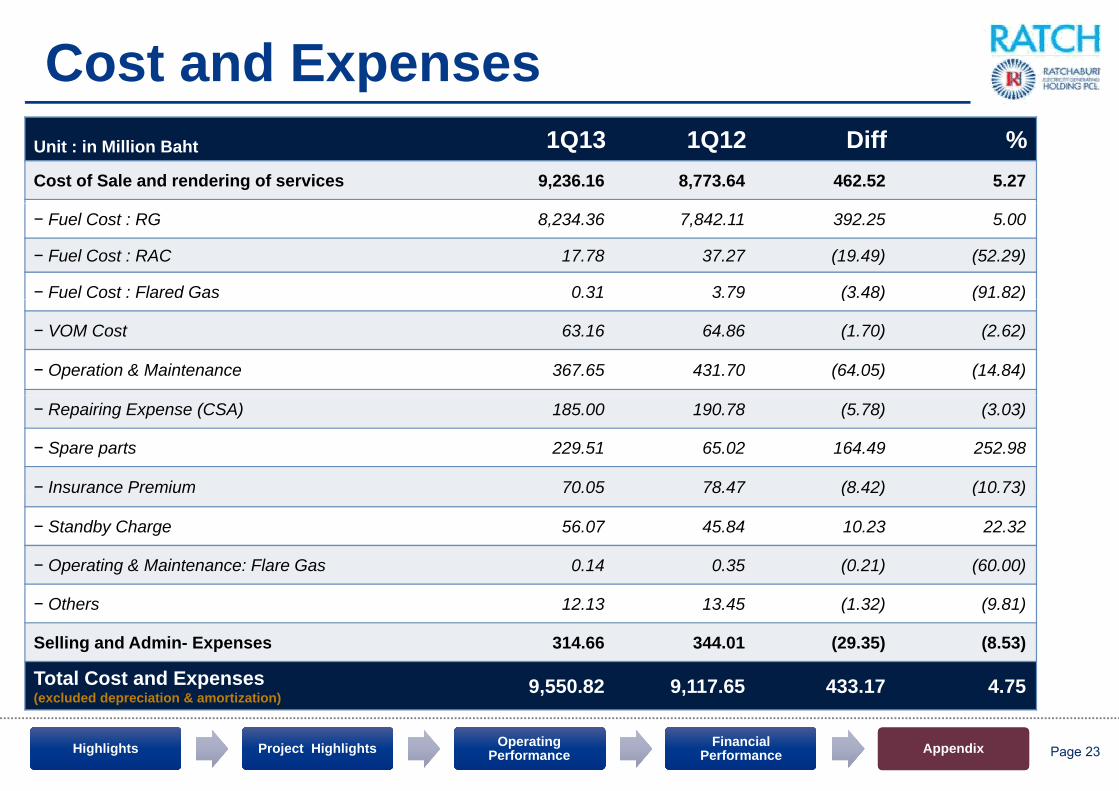
Cost and ExpensesUnit : in Million Baht 1Q13 1Q12 Diff %Cost of Sale and rendering of services 9,236.16 8,773.64 462.52 5.27
− Fuel Cost : RG 8,234.36 7,842.11 392.25 5.00
− Fuel Cost : RAC 17.78 37.27 (19.49) (52.29)
− Fuel Cost : Flared Gas 0.31 3.79 (3.48) (91.82)( ) ( )
− VOM Cost 63.16 64.86 (1.70) (2.62)
− Operation & Maintenance 367.65 431.70 (64.05) (14.84)
− Repairing Expense (CSA) 185.00 190.78 (5.78) (3.03)
− Spare parts 229.51 65.02 164.49 252.98
− Insurance Premium 70 05 78 47 (8 42) (10 73)Insurance Premium 70.05 78.47 (8.42) (10.73)
− Standby Charge 56.07 45.84 10.23 22.32
− Operating & Maintenance: Flare Gas 0.14 0.35 (0.21) (60.00)
− Others 12.13 13.45 (1.32) (9.81)
Selling and Admin- Expenses 314.66 344.01 (29.35) (8.53)
Total Cost and Expenses 9 550 82 9 117 65 433 17 4 75
HighlightsHighlights Project HighlightsProject Highlights Operating Performance
Operating Performance
Financial Performance
Financial Performance AppendixAppendix Page 23
Total Cost and Expenses (excluded depreciation & amortization)
9,550.82 9,117.65 433.17 4.75

Gain (Loss) From Foreign Exchange Rate Unit : in Million Baht 1Q13 1Q12
Gain (Loss) from Foreign Exchange Rate 765.80 414.81
The Company and Subsidiaries 447.60 446.18
- RH (59.36) (34.45)
- RE / RG 4.99 (3.57)
- RL 15.51 5.08
- RH Inter 486.46 479.12
Jointly-controlled entities and Associates 318.20 (31.37)
- RPCL (25%) 84.72 64.18
SEAN (33 33%) 63 97 41 44- SEAN (33.33%) 63.97 41.44
- HPC (40%) 148.64 (139.09)
- TECO (50%) 0.67 1.05
CRESCO (50%) 2 72 1 05- CRESCO (50%) 2.72 1.05
- RW COGEN (40%) 2.03 -
- FKW (20%) 2.56 - Foreign Exchange Rate
as at March 31 2013 = 29 4476 Baht/USD
HighlightsHighlights Project HighlightsProject Highlights Operating Performance
Operating Performance
Financial Performance
Financial Performance AppendixAppendix Page 24
- KR2 (20%) 12.89 - as at March 31, 2013 = 29.4476 Baht/USD as at March 31, 2012 = 30.9885 Baht/USDas at December 31, 2012 = 30.7775 Baht/USD

Appendixppe dOperating PerformanceOperating Performance

RATCHGEN Operating PerformanceNet Generation (GWh)
By Type of Power Plant 1Q13 1Q12By Type of Power Plant 1Q13 1Q12
Total Net Generation (GWh) 3,233.89 3,411.84
Net Generation (TP#1-2) (GWh) 742.44 470.15
- By Gas (GWh) 714 11 418 07By Gas (GWh) 714.11 418.07
- By Heavy Oil (GWh) 28.33 52.08
Net Generation (CCGT#1-3) (GWh) 2,491.45 2,941.69
- By Gas (GWh) 2,488.16 2,941.69
- By Diesel (GWh) 3.29 -
HighlightsHighlights Project HighlightsProject Highlights Operating Performance
Operating Performance
Financial Performance
Financial Performance AppendixAppendix Page 26

RATCHGEN Operating PerformanceFuel Consumption
By Fuel 1Q13 1Q12By Fuel 1Q13 1Q12Fuel Consumption (TH#1-2)
Gas Million MMBTU 7 27 4 37- Gas Million MMBTU 7.27 4.37
- Heavy Oil Million Liters 7.41 13.44
Fuel Consumption (CCGT#1-3)
- Gas Million MMBTU 18.07 21.33
- Diesel Million Liters 0.80 0.17
Gas Price (Average) Baht/MMBTU 318.14 293.48
Heavy Oil Price (Average) Baht/Liter 21.06 22.89
Diesel Oil Price (Average) Baht/Liter 22.80 20.40
HighlightsHighlights Project HighlightsProject Highlights Operating Performance
Operating Performance
Financial Performance
Financial Performance AppendixAppendix Page 27
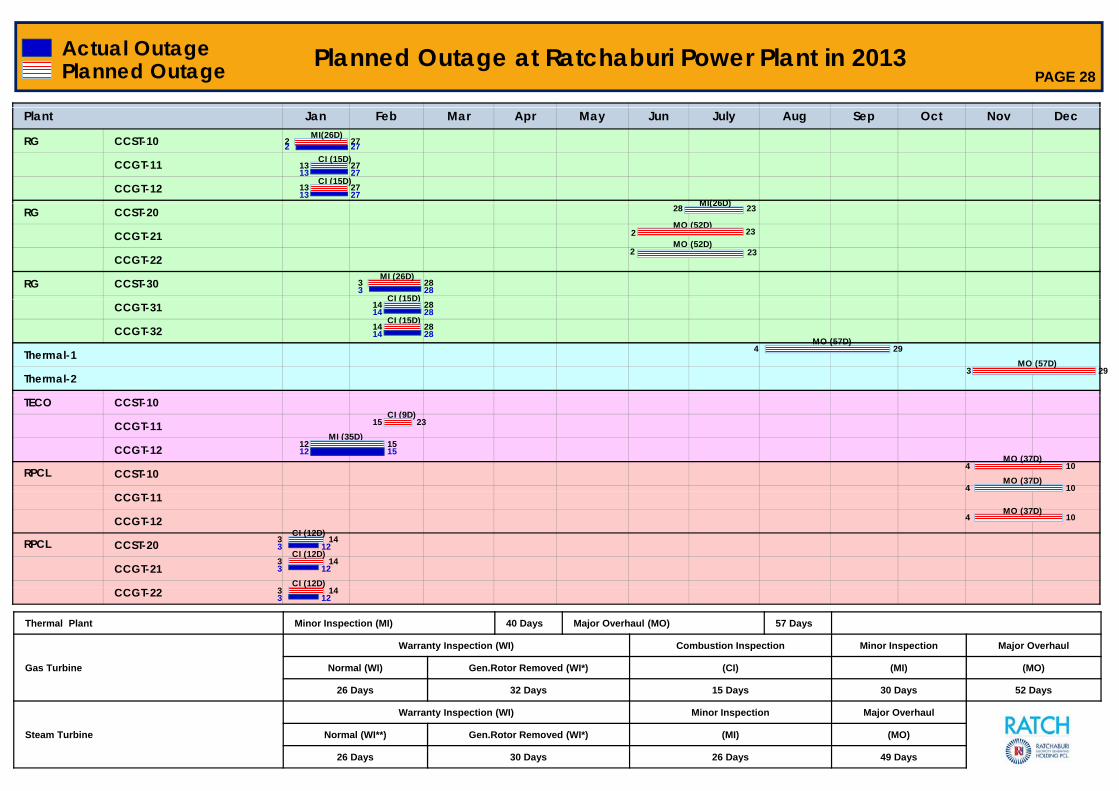
Planned Outage at Ratchaburi Power Plant in 2013Planned Outage PAGE 28
Actual Outage
Plant Jan Feb Mar Apr May Jun July Aug Sep Oct Nov Dec
RG CCST-10
CCGT-11
CCGT-12
13 27CI (15D)
13 27CI (15D)
MI(26D)2 27
MI(26D)
2 27
2713
13 27
RG CCST-20
CCGT-21
CCGT-22
RG CCST-30
28 23MI(26D)
MO (52D)2
MO (52D)
3 28MI (26D)
CI (15D)
23
2 23
3 28
CCGT-31
CCGT-32
Thermal-1
Thermal-2
4 29MO (57D)
MO (57D)3 29
14 28CI (15D)
14 28CI (15D)
14
14
28
28
TECO CCST-10
CCGT-11
CCGT-12
RPCL CCST-10
CI (9D)15 23
MI (35D)12 15
4 10MO (37D)
4 10MO (37D)
12 15
CCGT-11
CCGT-12
RPCL CCST-20
CCGT-21
3 14CI (12D)
3 14CI (12D)
CI (12D)
4 10MO (37D)
3
3
12
12
CCGT-22
Thermal Plant Minor Inspection (MI) 40 Days Major Overhaul (MO) 57 Days
Gas Turbine
Warranty Inspection (WI) Combustion Inspection Minor Inspection Major Overhaul
Normal (WI) Gen.Rotor Removed (WI*) (CI) (MI) (MO)
3 14( )
3 12
26 Days 32 Days 15 Days 30 Days 52 Days
Steam Turbine
Warranty Inspection (WI) Minor Inspection Major Overhaul
Normal (WI**) Gen.Rotor Removed (WI*) (MI) (MO)
26 Days 30 Days 26 Days 49 Days

Planned Outage at Ratchaburi Power Plant in 2012Planned Outage PAGE 29
Actual Outage
Plant Jan Feb Mar Apr May Jun July Aug Sep Oct Nov Dec
RG CCST-10
CCGT-11
CCGT-12
MO23 13
23 13
RG CCST-20
CCGT-21
CCGT-22
RG CCST-30
14 9CI
14 9CI
CI
2 16
2 11
CCGT-31
CCGT-32
RG Thermal-1
Thermal-2
1
CI1 10
10CI
1 24ID Fan
TECO CCST-10
CCGT-11
CCGT-12
RPCL CCST-10
CCGT 11CI
19 28
1
1
1
23
23
23
CCGT-11
CCGT-12
RPCL CCST-20
CCGT-21
CCGT 22
19 28
19 28
MI3
3
26
26MI
MI
3 12
3 26
CCGT-22
Thermal Plant Minor Inspection (MI) 40 Days Major Overhaul (MO) 57 Days
Gas Turbine
Warranty Inspection (WI) Combustion Inspection Minor Inspection Major Overhaul
Normal (WI) Gen.Rotor Removed (WI*) (CI) (MI) (MO)
3 26
26 Days 32 Days 15 Days 30 Days 52 Days
Steam Turbine
Warranty Inspection (WI) Minor Inspection Major Overhaul
Normal (WI**) Gen.Rotor Removed (WI*) (MI) (MO)
26 Days 30 Days 26 Days 49 Days

Appendixppe dRATCH ProjectsRATCH Projects

Power Generation IPP in Thailand
Ratchaburi Power Plant (RATCHGEN)
Location Ratchaburi Province
Technology Thermal & Combined Cycle
T t l C it 3 645 MW (h ld 100%)
Tri Energy Power Plant (TECO)
Location Ratchaburi Province
Technology Combined Cycle
T t l C it 700 MW (350 MW h ld 50 %)
Ratchaburi Power Power Plant (RPCL)
Location Ratchaburi Province
Technology Combined Cycle
T t l C it 1 400 MW (350 MW h ld 50 %)Total Capacity 3,645 MW (holds 100%)
PPA 25-Year
COD • TH#1-2 : 31 Oct 2000
• CCGT #1-2 : 18 Apr 2002
CCGT#3 : 1 Nov 2002
Total Capacity 700 MW (350 MW holds 50 %)
PPA 20-Year
COD In 2000
Partner Chevron Thailand Energy Company I holds 50 %
Total Capacity 1,400 MW (350 MW holds 50 %)
PPA 25-Year
COD In 2008
Partner • Ratchaburi Alliances Company Limited holds 25%• CCGT#3 : 1 Nov 2002
Partner RG holds 100%
Company I holds 50 % Limited holds 25%• Power Assets holds 25%• Chubu Electric Power
Company International B.V. holds 15%
• PTT PCL holds 15%• Union Energy Company Limited
h ld 10%holds 10%• Toyota Tsusho Corporation
holds 10%
HighlightsHighlights Project HighlightsProject Highlights Operating Performance
Operating Performance
Financial Performance
Financial Performance AppendixAppendix Page 31

Power Generation IPP in Laos
Num Ngum 2 Hydroelectric Power Plant (NN2)
Location Lao PDR
Technology Hydro Power Plant
Total Capacity 615 MW (153.75 MW holds 25%)
PPA 27-Year
IOD / COD In 2011 / In 2013
Remark: SEAN's shareholder consist of • RATCH holds 33.33% • Bangkok Expressway PCL holds 16.67%• CH. Karnchang holds 38%• P T Construction & Irrigation 5 33%
Partner • SEAN* holds 75%• GOL holds 25%
P.T. Construction & Irrigation 5.33%• Shlapak Development Company holds 5.33%• Team Consulting Engineering and Management 1.34%
SPP in ThailandSPP in Thailand
Huay Bong 3 Wind-Turbine Power Project
Location Nakorn Ratchasima Province
Technology Wind-Turbine
Huay Bong 2 Wind-Turbine Power Project
Location Nakorn Ratchasima Province
Technology Wind-Turbine
Total Capacity
103.5 MW (20.7 MW holds 20%)
PPA SPP Non-Firm 5-Year
COD November 2012
Total Capacity 103.5 MW (20.7 MW holds 20%)
PPA SPP Non-Firm 5-Year
Expected COD February 2013
Project Cost THB 6 100 MillionProject Cost THB 6,500 Million
Debt to Equity 70 : 30
Partner • RATCH holds 20%• Aeolus Power holds 60%• Chubu Electric Power Korat,
BV h ld 20%
Project Cost THB 6,100 Million
Debt to Equity 70 : 30
Partner • RATCH holds 20%• Aeolus Power holds 60%• Chubu Electric Power Korat,
BV holds 20%
HighlightsHighlights Project HighlightsProject Highlights Operating Performance
Operating Performance
Financial Performance
Financial Performance AppendixAppendix Page 32
BV holds 20% BV holds 20%

Power Generation VSPP in Thailand
Pratu Tao-A & Pratu Tao-A (Expansion) Sao Thian-A Project
Location Sukhothai Province
Technology Gas Engine
Total Capacity 2.65 MW (holds 100%)
PPA 5-Year (Automatic Renewal)
Location Sukhothai Province
Technology Gas Engine
Total Capacity 3.6 MW (holds 100%)
PPA 5-Year (Automatic Renewal)( )
COD In 2007 / 2010
Partner RE holds 100%
( )
COD In 2012
Partner RE holds 100%
Solar Power Project (Korat 3, Korat 4, Korat 7)
Location Nakorn Ratchasima Province
Technology Solar Power
Solarta Power Project
Location Ayutthaya Province
Technology Solar Power Generation
Total Capacity 18 MW (7.2 MW holds 40%)
PPA 5-Year (Automatic Renewal)
COD • Korat 3: 9 March 2012
• Korat 4: 14 May 2012
Total Capacity 34.25MW (16.78 MW holds 49%)
PPA 5-Year (Automatic Renewal)
COD • Ayutthaya Province : 7 April 2011
• Suphan Buri Province : In 2012y
• Korat 7: 30 May 2012
Partner • RATCH holds 40%• Solar Power holds 60%
p
• Nakon Pathom Province : In 2012
Partner • RATCH holds 49%• Yanhee Power holds 51%
HighlightsHighlights Project HighlightsProject Highlights Operating Performance
Operating Performance
Financial Performance
Financial Performance AppendixAppendix Page 33

Power Generation Power Plant in Australia : Gas
Townsville
Location North Queensland
Technology Combined Cycle Gas Turbine
Total Capacity 234 MW (187.20 MW holds 80%)
Kemerton
Location Western Australia
Technology Open Cycle Gas / Diesel Turbine
Total Capacity 300 MW (240 MW holds 80%)
BP Kwinana
Location Western Australia
Technology Co-generation
Total Capacity 35 MW (28.32 MW holds 80%)
All output sold under a 20 year PPA to AGL / Arrow, expiring in 2025
All capacity sold under a 25 Year PPA to Verve Energy, expiring in 2030
Energy and Services Agreement (ESA) with BP and a PPA (power only) with Verve Energy, both expiring in 2021
Power Plant in Australia : Coal
Collinsville*
Location Queensland
Technology Black coal fired
Total Capacity 180 MW (144 MW holds 80%)
All output sold under PPA to CS Energy, expiring in 2016
HighlightsHighlights Project HighlightsProject Highlights Operating Performance
Operating Performance
Financial Performance
Financial Performance AppendixAppendix Page 34
* - PPA Terminated on 14 Aug 2012- Under conducting new feasibility study
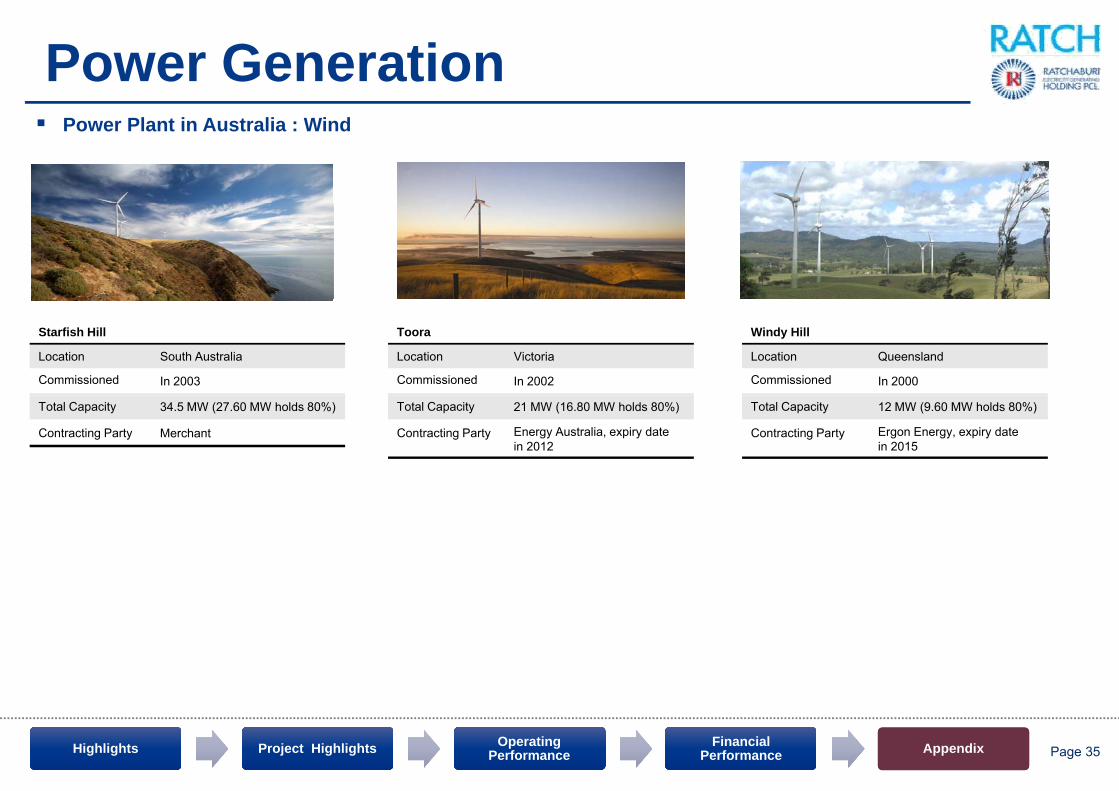
Power Generation Power Plant in Australia : Wind
Starfish Hill
Location South Australia
Commissioned In 2003
Toora
Location Victoria
Commissioned In 2002
Windy Hill
Location Queensland
Commissioned In 2000
Total Capacity 34.5 MW (27.60 MW holds 80%)
Contracting Party Merchant
Total Capacity 21 MW (16.80 MW holds 80%)
Contracting Party Energy Australia, expiry datein 2012
Total Capacity 12 MW (9.60 MW holds 80%)
Contracting Party Ergon Energy, expiry datein 2015
HighlightsHighlights Project HighlightsProject Highlights Operating Performance
Operating Performance
Financial Performance
Financial Performance AppendixAppendix Page 35

Projects under Construction SPP in Thailand
Ratchaburi World Cogeneration (RW Cogen)
Location Ratchaburi Province
IPP in Laos
Technology Cogeneration
Total Capacity 210 MW (84 MW holds 40%)
PPA 25-Year
Expected COD In 2014
Project Cost THB 10,620 Million
Debt to Equity 75 : 25
Partner • RATCH holds 40%• Majoe Sharholder Group of Thai Agri
Food PCL holds 60%
Hongsa Thermal Project
Location Lao PDR
Technology Lignite-Fired
VSPP in ThailandSongkhla Biomass Power Project
Location Songkhla Province
ec o ogy g
Total Capacity 1,878 MW (751.2 MW holds 40%)
PPA 25-Year
Progress 49.7%
Expected COD In 2015g
Technology Thermal Power Plant
Total Capacity 9.9 MW (3.96 MW holds 40%)
PPA 5-Year (Automatic Renewal)
Expected COD In 2014
Expected COD In 2015
Project Cost USD 3,710 Million
Debt to Equity 75 : 25
Partner(Power Plant )
• RATCH holds 40%• Banpu Power holds 40%Expected COD In 2014
Project Cost THB 820 Million
Debt to Equity 75 : 25
Partner • RATCH holds 40%• Precise Power Producer holds 40%
( ) p• Lao PDR holds 20%
Partner(Phu Fai Mining)
• RATCH holds 37.5%• Banpu Power holds 37.5%• Lao PDR holds 25%
HighlightsHighlights Project HighlightsProject Highlights Operating Performance
Operating Performance
Financial Performance
Financial Performance AppendixAppendix Page 36
• Assiddeek Saving Cooperative holds 20%
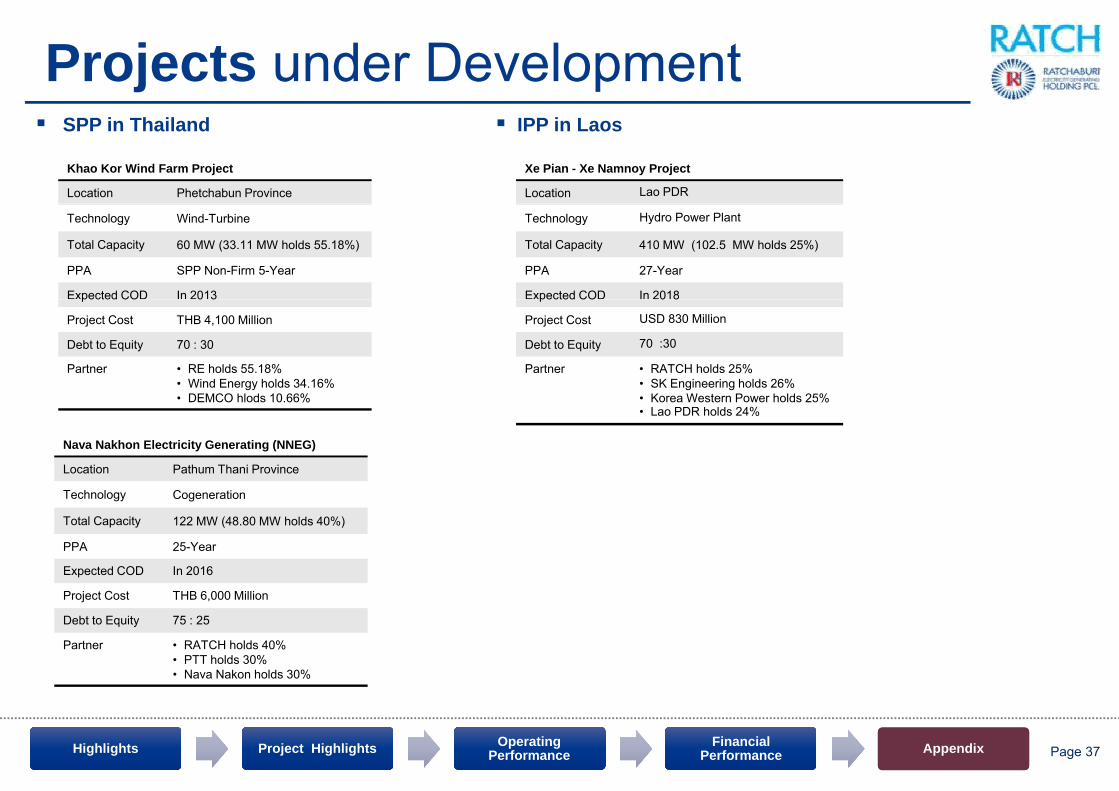
Projects under Development SPP in Thailand
Khao Kor Wind Farm Project
Location Phetchabun Province
IPP in Laos
Xe Pian - Xe Namnoy Project
Location Lao PDR
Technology Wind-Turbine
Total Capacity 60 MW (33.11 MW holds 55.18%)
PPA SPP Non-Firm 5-Year
Expected COD In 2013
Technology Hydro Power Plant
Total Capacity 410 MW (102.5 MW holds 25%)
PPA 27-Year
Expected COD In 2018pected CO 0 3
Project Cost THB 4,100 Million
Debt to Equity 70 : 30
Partner • RE holds 55.18%• Wind Energy holds 34.16%
DEMCO hl d 10 66%
pected CO 0 8
Project Cost USD 830 Million
Debt to Equity 70 :30
Partner • RATCH holds 25%• SK Engineering holds 26%
K W t P h ld 25%• DEMCO hlods 10.66%
Nava Nakhon Electricity Generating (NNEG)
Location Pathum Thani Province
T h l C ti
• Korea Western Power holds 25%• Lao PDR holds 24%
Technology Cogeneration
Total Capacity 122 MW (48.80 MW holds 40%)
PPA 25-Year
Expected COD In 2016
Project Cost THB 6,000 Million
Debt to Equity 75 : 25
Partner • RATCH holds 40%• PTT holds 30%• Nava Nakon holds 30%
HighlightsHighlights Project HighlightsProject Highlights Operating Performance
Operating Performance
Financial Performance
Financial Performance AppendixAppendix Page 37

Q&AQ&A

Thank youThank you
DisclaimerThe information contained in our presentation is intended solely for your personal reference only. In addition, such information contains projections and forward-
looking statements that reflect the Company's current views with respect to future events and financial performance. These views are based on assumptions
subject to various risks. No assurance is given that future events will occur, that projections will be achieved, or that the Company’s assumptions are correct.
Actual results may differ materially from those projected. Investors are, however, required to use their own discretion regarding the use of information contained
in this presentation for any purpose.
Recommended