RESEARCH ARTICLE
European Journal of Environment and Earth Sciences www.ej-geo.org
DOI: http://dx.doi.org/10.24018/ejgeo.2021.2.4.152 Vol 2 | Issue 4 | August 2021 54
I. INTRODUCTION
Urban growth/ expansion and agricultural development
have become global issues for decades. Developed and
developing countries are seeking sustainable solution to
manage the effects urban growth has on agricultural lands and
urban food security [1].
Most cities in developing countries are experiencing rapid
spatial expansion. People move to the city in search of better
employment and opportunities [2]. This leads to an increase
in size well beyond the limits of the city. Often, these growths
lead to other problems associated with decrease in available
agricultural lands around the cities [3]. Urban expansion as a
result of rapid urban growth is one of the foremost threat
facing agricultural lands in Nigeria [4]. It occurs in ever
widening bands surrounding large urban centres, it often
emanates from disconnected developments and single family
homes that are established outside urban areas well beyond
city limits, but usually within commuting distance to the
urban core [4]. Adesina noted that rapid urban expansion and
sprawl in Nigeria has affected 400,000 hectares of vegetation
annually [5]. While urban centres are growing in population
and extent, the surrounding agricultural lands are undergoing
rapid transformation. This is due to increasingly intense
pressure through construction to provide space for an array of
urban land uses. These have huge agricultural effects such as
low or reduced food production, low agricultural produce,
ecological degradation, as well as environmental and
socioeconomic challenge [6]. Calabar is one of the towns in
the mangrove swamp region where agricultural activities
have been threatened by urban growth and development. In
fact, there is no consensus on the relationship between the rate
of urban growth, agricultural activities and response
mechanisms of the farmers in the bid to ensure food security
in the area. Therefore, there is need for an investigation into
the implications that urban expansion might have brought on
food production and food security as well as land cover/use
change in Calabar.
The aim of the study therefore is to examine the impacts of
urban expansion on agricultural production in Calabar,
Nigeria between 1986 and 2018 using Remote Sensing data
and Geographic Information System (GIS) techniques with a
view to ensure sustainable balance between food production,
consumer demand, and population growth in the future. The
objectives of this study are therefore to:
Analysis of Urban Expansion on Agricultural Food
Production in Calabar, Nigeria
U. M. Ogban, M. A. Oyinloye, and O. S. Aboyeji
ABSTRACT
Urban growth appears to have direct effects on the available agricultural
land in and around urban area which in turn affects food production and
other agricultural activities in the city. Indiscriminate urban growth and
increasing losses of agricultural lands have become an issue in developing
countries. The aim of this study is to use Remote Sensing and GIS to
monitor the impact of urban expansion on agricultural food production in
Calabar, Nigeria. Landsat images of 1986, 2003 and 2018 of Calabar
municipal and Calabar South were obtained. The study employed
supervised digital image classification method using ILWIS 3.2 and
ArcGIS 10.2a software. GIS software was used to classify the landuse into
built-up area, natural vegetation, bare soil, agricultural land and water
bodies. Also, a set of structured questionnaire were administered using the
stratified random sampling technique to elicit information on the socio
economic and driven factors responsible for conversion of agricultural
landuse, effect of urban expansion on agricultural food production and
measures adopted to preserve agricultural land uses. The results revealed
increase in urban expansion on food production over the periods (1986–
2018). Recommendations were provided that will reduce the rate of urban
expansion on agricultural food production in the study area.
Keywords: agricultural food production, GIS, Supervised digital image.
Published Online: August 09, 2021
ISSN: 2684-446X
DOI :10.24018/ejgeo.2021.2.4.152
U. M. Ogban
Dept. of Geographical Information
System, African Regional Institute for Geospatial Information Science and
Technology (AFRIGIST), Obafemi
Awolowo University Campus, Ile-Ife, Nigeria.
(email: marcelogban yahoo.com)
M. A. Oyinloye*
Dept. of Urban of Urban and Regional
Planning, The Federal University of
Technology, Akure, Nigeria.
(e-mail: maoyinloye futa.edu.ng ) O. S. Aboyeji
Dept. of Geographical Information
System, African Regional Institute for Geospatial Information Science and
Technology (AFRIGIST), Obafemi
Awolowo University Campus, Ile-Ife, Nigeria.
(e-mail: aboyeji afrigist.org)
*Corresponding Author
@
@
@
RESEARCH ARTICLE
European Journal of Environment and Earth Sciences www.ej-geo.org
DOI: http://dx.doi.org/10.24018/ejgeo.2021.2.4.152 Vol 2 | Issue 4 | August 2021 55
i. identify the land use changes in remotely sensed data
sources;
ii. assess the rate of land use change on food production
between 1986 and 2018 using Remote sensing and GIS in
the study area
iii. examine the socio-economic factors that affect food
production and land use types in the study area.
II. LITERATURE REVIEW
The conversion of agricultural lands to urban development
is a phenomenon currently affecting countries as their
population grows. Although urban sprawl may not threaten
overall agricultural productivity of a country, it does result in
the alterations and declines in local agricultural activities and
to the loss of agricultural land as highlighted by literature.
Organisation for Economic Cooperation and Development,
OECD (1979) has documented the loss of peripheral
agricultural land to sprawl in some European countries such
as Netherlands and Norway which respectively lost 4.3
percent and 1.6 percent of their land annually to sprawl. Also,
the United States of America and Canada lose 4,800sqkm of
prime cropland annually to roads, buildings, reservoirs and
other non-agricultural uses [4].
Lopez et al. opined that, Urban Expansion and the Loss of
Prime Agricultural Lands in Puerto Rico’, shows that
between 1977 and 1994 the urban area of Puerto Rico
increased from 11.3 percent to 27.4 percent [7]. They
therefore asserted that if the pattern of encroachment by urban
growth into farmlands continues Puerto Rico’s potential for
production in the future will be dimmed.
The extent of dependable agricultural land available for
agriculture has been declining in recent decades, due to the
consumption of agricultural land for urban uses and other
non-agricultural uses [8]. This rapid loss of agricultural lands
as a result of urban expansion is prevalent throughout the
world and much more evident in developing countries [9].
Jiang, Deng and Seto stated that the urban expansion on
agricultural land is associated with both shrinking agricultural
land area and a higher level of urban development [10]. The
former triggers greater land pressure and the latter indicates
increasing off-farm employment opportunities. However,
expansion and economic development can lead to rise in the
agricultural land use intensity, off-farm opportunities and the
resulting labour shortage in the agricultural sector [11]. These
have posed additional challenges for the security of food
provision and the preservation of natural ecosystems.
The nature and magnitude of their relationship directly
influence agricultural production and food provision which
may have further outcomes on the patterns of a nation’s
agricultural land [10]. López studied agricultural censuses in
Puerto Rico shows rapid losses agricultural lands have
occurred since 1950, with the highest rate of change
occurring between 1964 and 1974 due to urban expansion [7].
This loss of potential agricultural lands to irreversible non-
agricultural uses reduces its capacity for the future.
Humphrey observed that urban sprawl has transformed the
landscape of Singapore and elevated the economy to almost
a developed country status over the past decade [12].
Correspondingly, in the face of this rapid urban and industrial
growth, agriculture has to make significant adjustments.
The first was the loss of agricultural land leading to
shortages in food productions. During the 1960s
approximately 250 hectares were required annually for public
housing and industrial development, often at the cost of fertile
agricultural land. Singapore, Japan, Indonesia, Thailand and
recently Malaysia exhibited this trend. The implication of this
is the importation of food as Asian countries lost their
diversified food production capabilities. This according to
Pernia is a reflection of a country’s loss of comparative
advantage in diversified farming practices as a country loss
its fertile land to urban sprawl and heads up the economic
ladder [13]. The same trend was found in a study carried out
by Yoveva et al. [14] in the city of Sofia, where land use is
shown to be in a state of transition. The peri urban villages to
the south of Sofia (Dragalevixi, Simeonovo and Pancharevo)
are no longer areas of agricultural production as the
agricultural land has been turned into housing complexes. For
example, the cities of Darvenitza and Mladost were built on
prior agricultural land. On the other hand, studies have
attributed the fast rate in which agricultural lands in the
peripheries of Taipa, South Korea, dwindle to sprawl [15];
[16]. Thus, the reductions of agricultural land and
biodiversity in the peripheries have been attributed to sprawl.
This is because sprawl encroachment into peripheral
agricultural lands results in the loss of fertile land. Farmers,
therefore, need to enhance the fertility of the land by adding
fertilizer, changing to new farm techniques or changing to
more productive crops. This change in prior farming
techniques will definitely change the constitution of
biodiversity that has adapted to the former farm management.
Before Nigeria’s independence in 1960, agriculture was
the most important sector of its economy, which accounted
for more than 50% of GDP and more than 75% of export
earnings [17]. However, with the rapid expansion of the
petroleum industry, agricultural development was neglected,
and the sector entered a relative decline [17]. Studies
indicated that Nigeria moved from a position of self-
sufficiency in basic foodstuffs to one of heavy dependence on
imports [17]-[19].
Under-investment, a steady drift away from the
agricultural practices to urban areas, increased consumer
preference for imported foodstuffs (particularly rice and
wheat) and outdated farming techniques are factors that have
threatened food security in Nigeria and other developing
countries [18], [20].
However, because of the persistence increase in population
and the need for population to be accommodated, and as well
carry out other human induced activities, most agricultural
land areas have been taken over by urban growth processes
[21]. Although, urbanization in itself is a positive
development to any area, such as increasing market size and
attracting basic modern amenities, but where rapid urban
growth does not take into account sustaining food production
from agricultural activities, could produce catastrophic
consequences in the long run.
III. THE STUDY AREA
Administratively, the city is divided into Calabar
municipal and Calabar South Local Government Area. It has
an area extend of 406 km2 (157 m2). The location lies between
RESEARCH ARTICLE
European Journal of Environment and Earth Sciences www.ej-geo.org
DOI: http://dx.doi.org/10.24018/ejgeo.2021.2.4.152 Vol 2 | Issue 4 | August 2021 56
Latitudes 4° 50′ N and 5° 50′ and Longitudes 8° 10′ E and 8°
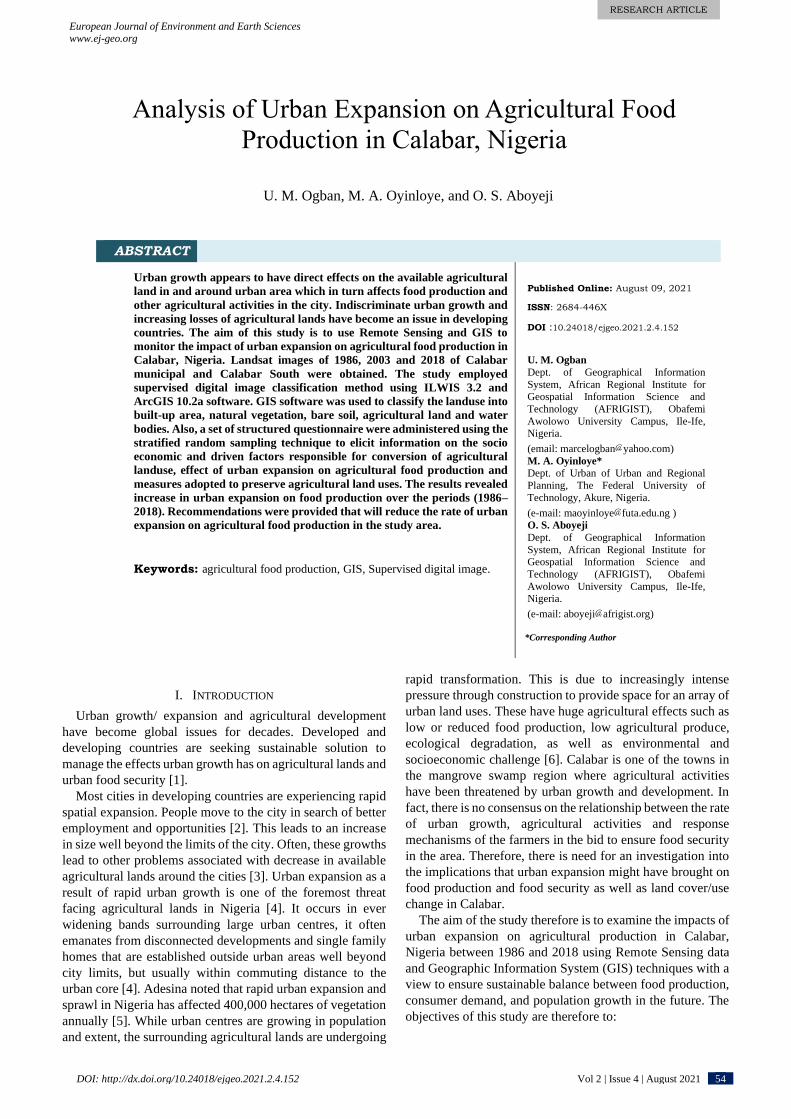
25′ E (see Fig. 1). Essentially, Calabar is an inter-fluvial
settlement, built on a high land between two adjacent river
valleys; it is bordered by the Great Kwa River on the east that
flows into an estuary (the Cross River Estuary) and the
Calabar River on the west. It stretches northwards to Ikot
Omin bordered by Odukpani Local Government Area, East
by Akpabuyo Local Government Area and South by the
swamps of the mangrove forest. Major growth and expansion
takes place northwards due to the existence of these two river
systems.
Fig. 1. The Study Area showing project location.
Source: (Digitized by the Author, 2018).
IV. DATA ACQUISITION AND METHOD
This study is interested in the analysis of urban expansion
on agricultural food production in Calabar, Nigeria. It also
seeks to use the capabilities of Geographical Information
System and remote sensing techniques to determine the rate
of urban expansion on agricultural food production in the
study area. To achieve this, Multi-temporal set of Remote
Sensing data of the study area was used to classify the study
area into different land uses. These datasets included mainly
Landsat images (TM 1986, ETM 2003 and OLI 2018) from
(USGS) with a spatial resolution of 30 meters. These images
were geometrically corrected and ground control points
obtained through intensive ground surveys permitted the co-
registration of all images to a Universal Transverse Mercator
(UTM). All the images were made to pass through processes
of image enhancement, georeferencing, re-sampling, image
classification and digitizing. Anderson Land use/Landcover
Classification Scheme was used to classify the study area into
five different land uses: Vegetation, Bare land, Built-up,
Agricultural land and water body. Digital image processing
software IDRISI was used to process, analyze and integrate
the spatial data. Geographic Information Software ArcGIS
10.4 was used to produce the map output. Structured
questionnaire was administered on the two Local
Governments in the study area. The socio-demographic
questions specifically focused on the age, educational,
income, type of food crop produced and severity level of land
use on food production.
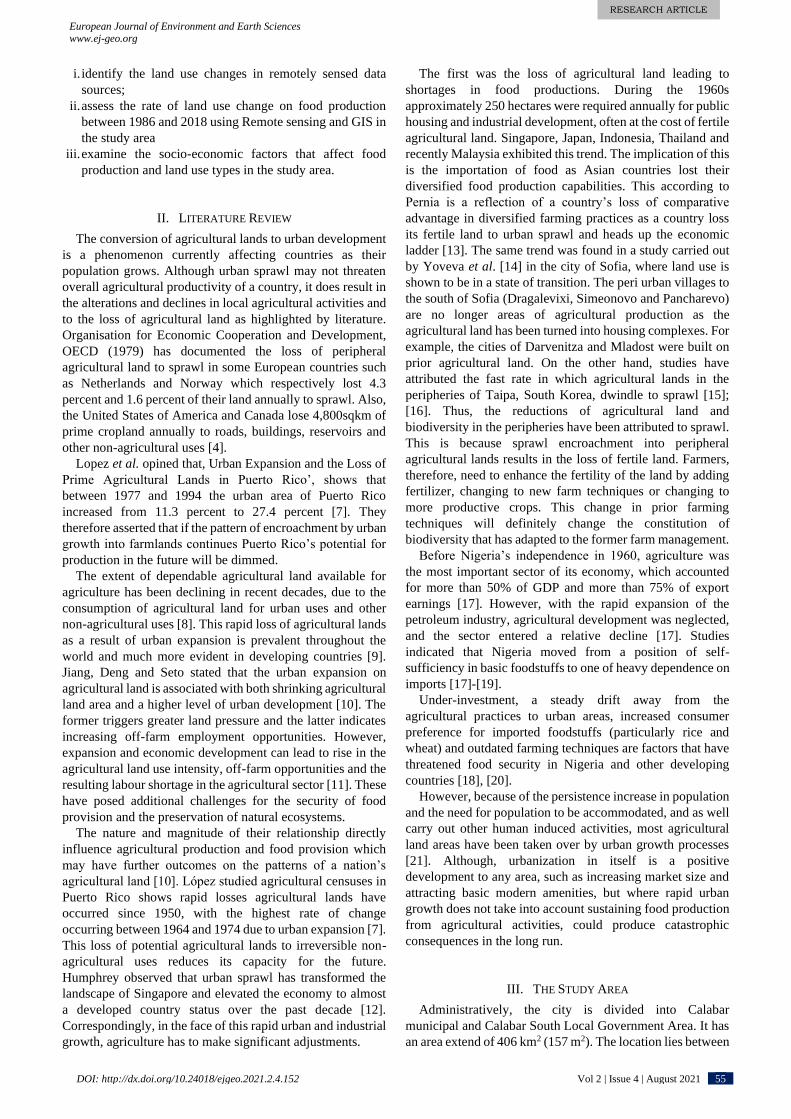
Also, the identification of the total number of farmers
within the study area was achieved from the register gotten
from the farmers association in the two LGAs of the study
area. Coordinates location of selected farmlands were
obtained using a handheld GPS device and were plotted on
the agricultural landuse to enhance navigation (see Fig. 2).
Fig. 2. LULC showing selected Farmlands plots, 2018.
Lastly, specific subject for questionnaire administration
was selected systematically- every 20th farmer, after the first
on the record for each LGA, this makes a total of 250 copies
of questionnaire in all. Table I shows that out of the 250
copies of questionnaires distributed, 220 were received back
and analysis. The address of the specific farmers on the list
was used to trace them. TABLE I: QUESTIONNAIRE ADMINISTERED IN EACH LOCAL GOVERNMENT
OF THE STUDY AREA
S/N Local
Government
Registered
farmers(Population)
5% of randomly
selected farmers
Questionnaire
retrieved
1 Calabar
municipal 2160 108 95
2 Calabar South 2840 142 125
Total 5000 250 220
Source: Field Survey, 2018.
V. RESULTS AND DISCUSSION
The impact of urban expansion on agricultural food
production between 1986, 2003 and 2018 using remote
sensing as shown by GIS output are discussed below.
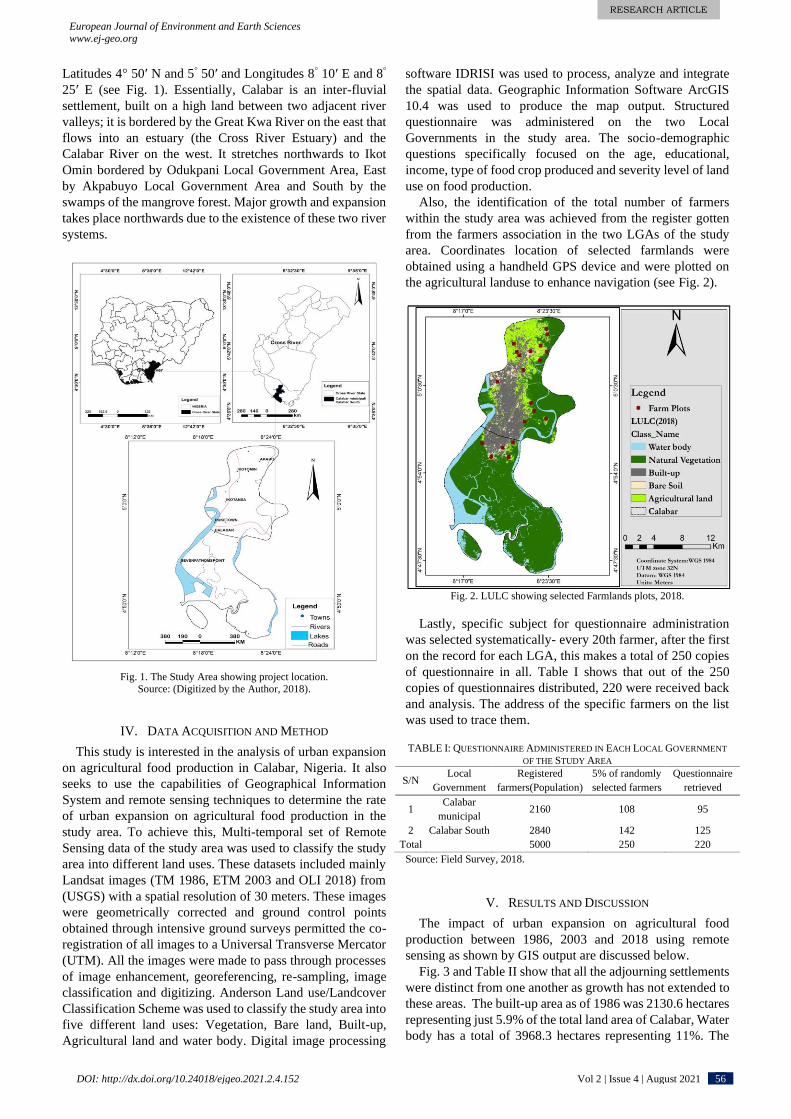
Fig. 3 and Table II show that all the adjourning settlements
were distinct from one another as growth has not extended to
these areas. The built-up area as of 1986 was 2130.6 hectares
representing just 5.9% of the total land area of Calabar, Water
body has a total of 3968.3 hectares representing 11%. The
RESEARCH ARTICLE
European Journal of Environment and Earth Sciences www.ej-geo.org
DOI: http://dx.doi.org/10.24018/ejgeo.2021.2.4.152 Vol 2 | Issue 4 | August 2021 57
major land use was natural vegetation with 21847.5 hectares
representing 60.6%, bare soil has 3572 hectares representing
9.9% of the total land area and agricultural land with
4559.1hectares representing 12.6% of the total land uses in
Calabar.
Fig. 3. Supervised Classification of Landuse Landcover Map of Calabar in
1986.
TABLE II: RESULT OF CLASSIFIED LANDSAT TM1986 OF CALABAR
LULC Classes Area(Hectares) Percentage (%)
Built-Up 2130.6 5.9
Bare Soil 3572 9.9
Natural Vegetation 21847.5 60.6
Agricultural Land 4559.1 12.6
Water Body 3968.3 11.0
TOTAL 36077.5 100
The classified Landsat image of 2003 shows that built-up
area covered 4565.5 hectares(12.7%) of the total area (Fig. 4
and Table III); natural vegetation occupied the major landuse
with 22445 hectares (62.2%); water body covered 3178.7
hectares (8.8%) of the total land area. Bare soil was 3596
hectares (10%) while Agricultural Land uses reduced from
4559.1hectares (12.6 %) in 1986 to 2192.2. (6.1%) in 2003 of
the land areas. It is observed that built up area increase
between the period of 1986 and 2003 as a result of increase
in population, urbanization as well as infrastructural
development to carter for the rising population. However,
Agricultural land reduced from 12.6% in 1986 to 6.1% in
2003.This may be as a result of oil boom that have had direct
effect on agricultural practices during that period. vegetation
and agricultural lands were now being found around the
fringes of Calabar. This might have accounted for the shift of
attention from agriculture to other sectors of the economy.
TABLE III: RESULT OF CLASSIFIED LANDSAT TM1986 OF CALABAR
LULC Classes Area(Hectares) Percentage (%)
Built-Up 4565.5 12.7
Bare Soil 3596 10.0
Natural Vegetation 22445 62.2
Agricultural Land 2192.2 6.1
Water Body 3178.7 8.8
Total 36077.5 100
Fig. 4. Supervised Classification of Landuse Landcover Map of Calabar in
2003.
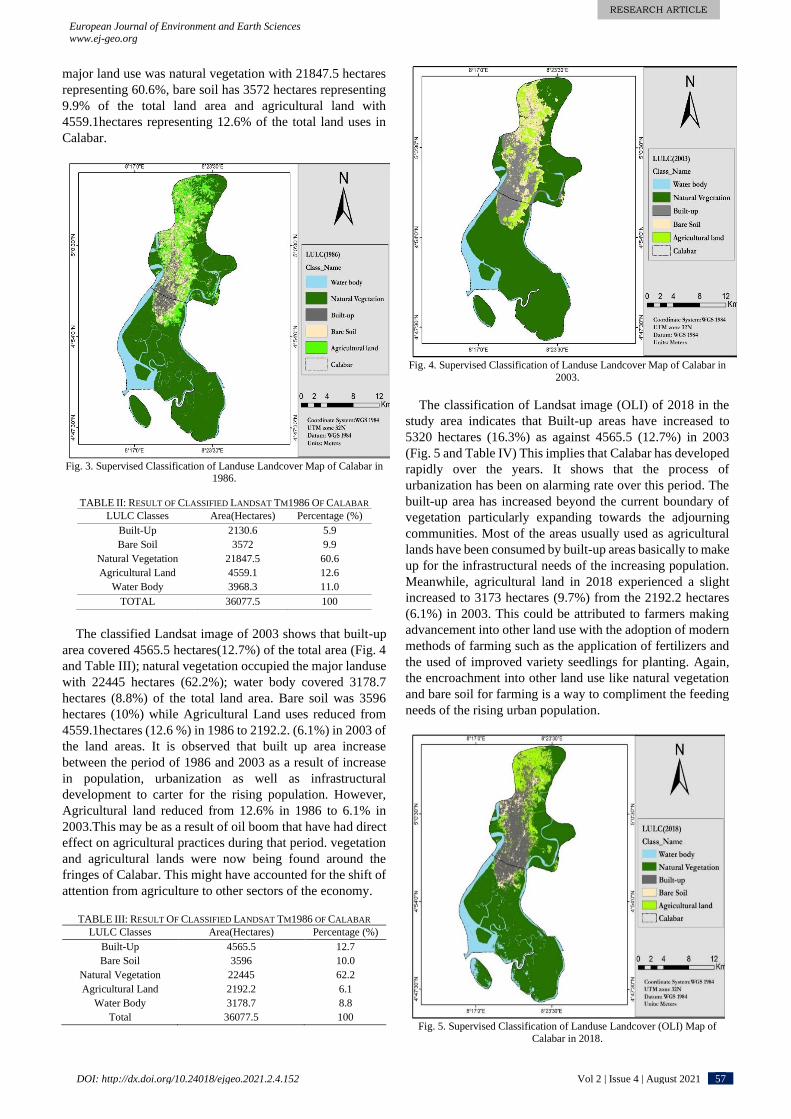
The classification of Landsat image (OLI) of 2018 in the
study area indicates that Built-up areas have increased to
5320 hectares (16.3%) as against 4565.5 (12.7%) in 2003
(Fig. 5 and Table IV) This implies that Calabar has developed
rapidly over the years. It shows that the process of
urbanization has been on alarming rate over this period. The
built-up area has increased beyond the current boundary of
vegetation particularly expanding towards the adjourning
communities. Most of the areas usually used as agricultural
lands have been consumed by built-up areas basically to make
up for the infrastructural needs of the increasing population.
Meanwhile, agricultural land in 2018 experienced a slight
increased to 3173 hectares (9.7%) from the 2192.2 hectares
(6.1%) in 2003. This could be attributed to farmers making
advancement into other land use with the adoption of modern
methods of farming such as the application of fertilizers and
the used of improved variety seedlings for planting. Again,
the encroachment into other land use like natural vegetation
and bare soil for farming is a way to compliment the feeding
needs of the rising urban population.
Fig. 5. Supervised Classification of Landuse Landcover (OLI) Map of
Calabar in 2018.

RESEARCH ARTICLE
European Journal of Environment and Earth Sciences www.ej-geo.org
DOI: http://dx.doi.org/10.24018/ejgeo.2021.2.4.152 Vol 2 | Issue 4 | August 2021 58
TABLE IV: RESULT OF CLASSIFIED LANDSAT(OLI) OF CALABAR
IN 2018
LULC Classes Area(Hectares) Percentage (%)
Built-Up 5320 16.3
Bare Soil 919.9 2.8
Natural Vegetation 18639 57.2
Agricultural Land 3173 9.7
Water Body 4512.5 13.6
Total 32564.4 100
Table V shows various phases of land use types between
1986 and 2018. Built-up Land use which occupied small
portion in 1986 increased significantly to almost double of
the initial size in 2003. Also, in 2018, built up was also
noticed to be on the increase to 5320 hectares (16.3%) against
4565 hectares (12.7%) in 2003. This increment can be
attributed to the influx of migrants in view of the fact that
Calabar is fast becoming a tourist destination in Nigeria. In
addition, industrial, transportation, commercial and physical
development of the area could also responsible to the
increasing land use type, locating and upgrading of new and
existing social amenities; and the accompanying rise in socio
economic indices of the area to reflect the new status of the
state capital (Study area). Influx of people was majorly due
to employment opportunities that contribute substantially to
population growth and sets off the process of urban
expansion. Natural vegetation and Agricultural Land has the
highest land coverage of the study area in 1986, 21847.5
hectares (60.6%) and 4559.1hectares (12.6%) respectively.
This is not surprising as farming is one of the major
occupations in the study area as at that time (1986). But in
2003, Agricultural land decreased significantly almost by
half, 2192.2 hectares (6.1%). This was as a result of rapid
physical development (such as construction of road, buildings
etc.) and urban expansion which tend to absorb more
farmland to accommodate the growing population at the cost
of the agricultural land. Natural Vegetation which occupied
60.6% of the study area in 1986 witnessed increasing trend
between 1986 and 2003 but decreased in 2018.
Logically, as built up areas increases, agricultural land
decreases, so also natural Vegetation. As population
increases, more surrounding land which is basically
agricultural land are encroached for urban uses such as
constructions of building and roads, farmers are likely to open
up new forest land for agricultural activities. This is what
probably gave rise to the increased noticed in agricultural
land from 2192.2hectares (6.1%) in 2003 to 3173 hectares
(9.7%) in 2018, as well as the accompanying population
pressure on forest resources and biodiversity. However, a
different scenario played out for Natural vegetation which
was seen to increase in 2003 because of the fact that more
agricultural Lands were taken up by built up and the natural
vegetation that is left were allowed to fallow. Many youths
and young graduates see farming as worthless occupation due
to civilization, thus neglected it in search of white-collar jobs.
Also, more concentration was given to oil and gas at the
expense of agricultural activities. However, by 2018,
agricultural Land records some appreciable increased as
many farmers are seen to be returning to farming and making
encroachment into natural vegetation to cultivate food crops
in order to cope with current economic reality and urban
pressure which accounts for the reduction in natural
Vegetation as recorded in the classified OLI land sat image
of 2018 which compelled more lands to be exposed for
development.
Bare Surface which was noticeable in 1986 and 2003
reduced greatly in 2018, this could also be attributed to the
facts that the process of urbanisation involves the taking up
of bare lands, natural vegetation and agricultural lands in
most cases to accommodate the rising population. Water body
also recorded slight rise and fall changes over the decades
under review; this could also be linked to climatic changes
among other factors.
Fig. 6 shows the overall Land use change within the study
periods indicates that Built-up and water body recorded
increase of 8.8% and 1.5% respectively. While other Land
use; agricultural land, Natural vegetation and Bare-soil
recorded a decline of -3.8%, -8.9% and -7.4%, respectively.
TABLE V: LANDUSE CHANGE IN (HA/YEAR) AND (%/YEAR) OF CALABAR
BETWEEN 1986 AND 2018
LULCC
Classes
1986 2003 2018 Change
(%) Area
(Ha)
Perc
(%)
Area
(Ha)
Perc
(%)
Area
(Ha)
Perc
(%)
Built-up 2130.6 5.9 4565.5 12.7 5320 16.3 8.8
Bare soil 3572 9.9 3596 10.0 919.9 2.8 -7.4
Natural vegetation
21847.5 60.6 22445 62.2 18639 57.2 -8.9
Agricultural
Land 4559.1 12.6 2192.2 6.1 3173 9.7 -3.8
Water Body 3968.3 11.0 3178.7 8.8 4512.5 13.6 1.5
Total 36077.5 100 36077.5 100 36077.5 100
Fig. 6. Bar graph showing landuse change of Calabar between 1986 and
2018.
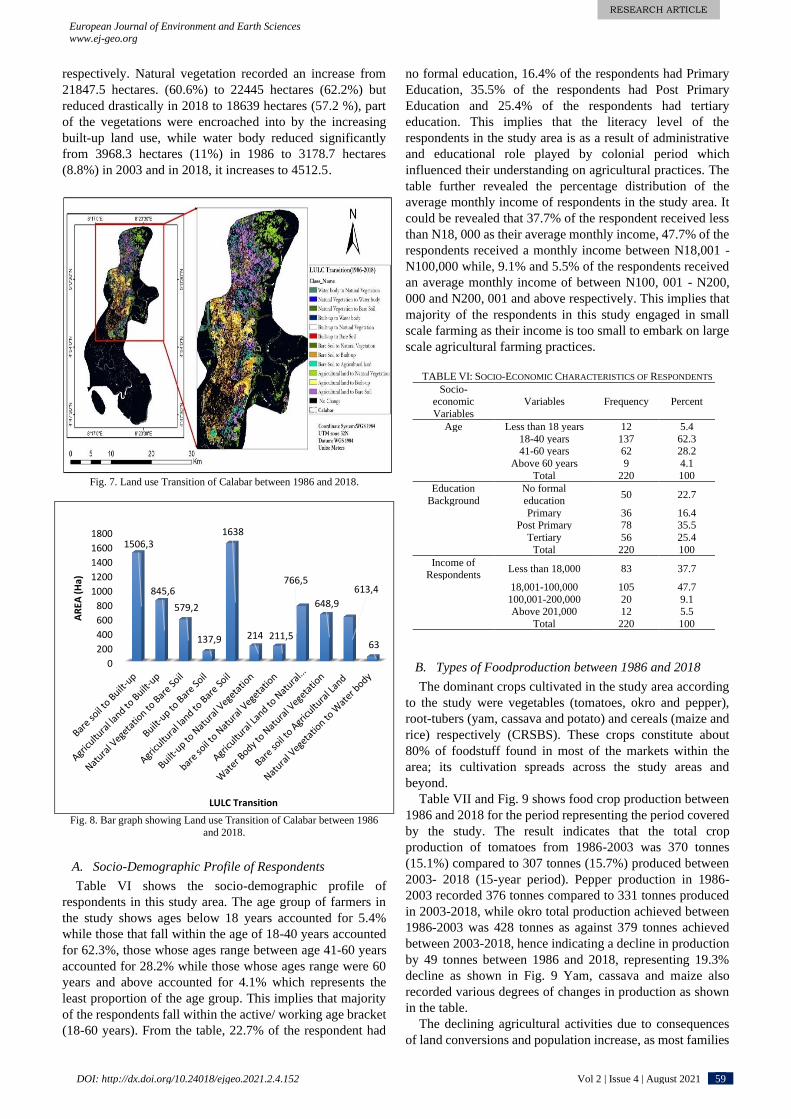
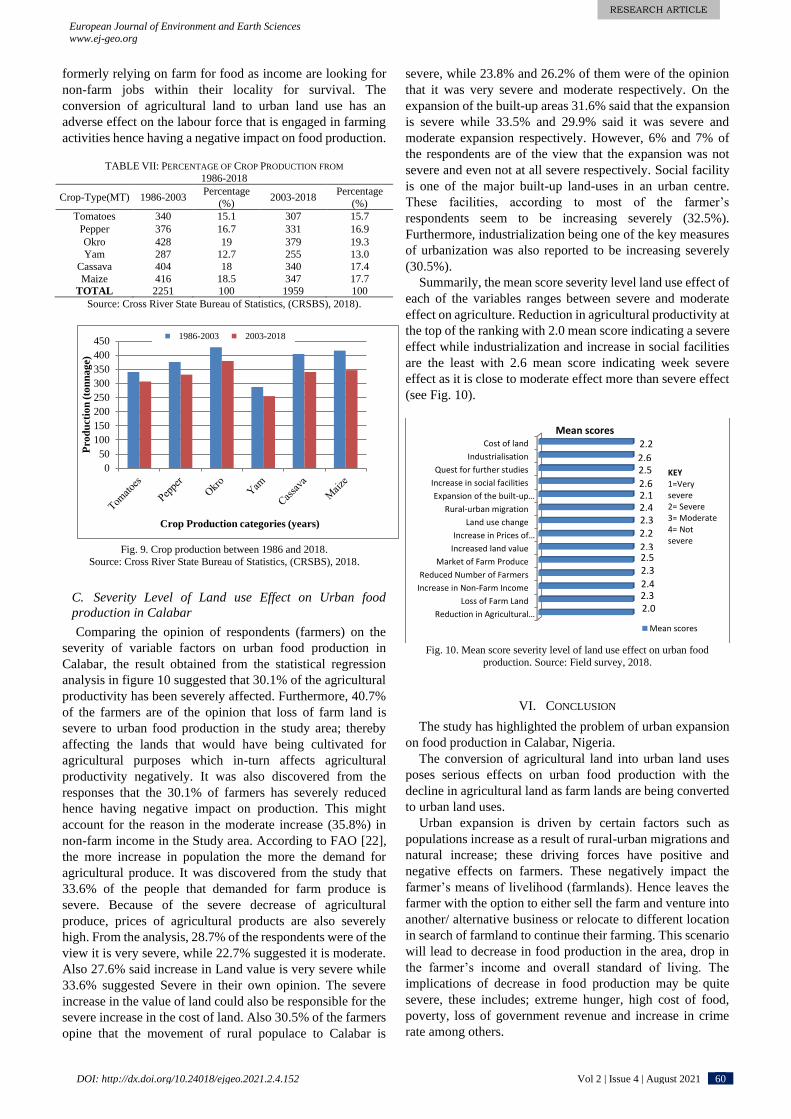
Fig. 7 and Fig. 8 show the landuse transition in Calabar
between 1986 and 2018. It is observed that between 1986 and
2003, the area of Calabar occupied by agricultural Land
decreased from 4559.1 hectares (12.6%) to 2192.2 hectares
(6.1%) in 2003 and then increased to 3173 hectares (9.7%) in
2018. This implies that although agricultural land which was
seen to have dropped in 2003, records appreciable increased
in 2018. This is so because, as the urban population and built-
up area is increasing, farmers move further inwards into Bare-
lands to sustained farming activities to scale up food
production for the rising urban population. Urbanization is
majorly the reason for the conversion of agricultural Lands to
other Land uses as seen in the change detection of classified
Landsat TM of 1986 and ETM of 2003, But between 2003
and 2018, agricultural land was seen to have increased by
3173 hectares (9.7%) against 2192.2 hectares (6.1%) in 2003.
A contrast was recorded for built-up as it increased by more
than 50% (from 2130.6 hectares (5.9%) in 1986 to 4565.5
hectares (12.7%) in 2003 and 5320 hectares (16.3%) in 2018
-10 -5 0 5 10
8,8
-7,4
-8,9
-3,8
1,5
Observed Change (%)
LULC
Cla
sses
Built-up Bare soil Natural vegetation Agricultural Land Water Body
RESEARCH ARTICLE
European Journal of Environment and Earth Sciences www.ej-geo.org
DOI: http://dx.doi.org/10.24018/ejgeo.2021.2.4.152 Vol 2 | Issue 4 | August 2021 59
respectively. Natural vegetation recorded an increase from
21847.5 hectares. (60.6%) to 22445 hectares (62.2%) but
reduced drastically in 2018 to 18639 hectares (57.2 %), part
of the vegetations were encroached into by the increasing
built-up land use, while water body reduced significantly
from 3968.3 hectares (11%) in 1986 to 3178.7 hectares
(8.8%) in 2003 and in 2018, it increases to 4512.5.
Fig. 7. Land use Transition of Calabar between 1986 and 2018.
Fig. 8. Bar graph showing Land use Transition of Calabar between 1986
and 2018.
A. Socio-Demographic Profile of Respondents
Table VI shows the socio-demographic profile of
respondents in this study area. The age group of farmers in
the study shows ages below 18 years accounted for 5.4%
while those that fall within the age of 18-40 years accounted
for 62.3%, those whose ages range between age 41-60 years
accounted for 28.2% while those whose ages range were 60
years and above accounted for 4.1% which represents the
least proportion of the age group. This implies that majority
of the respondents fall within the active/ working age bracket
(18-60 years). From the table, 22.7% of the respondent had
no formal education, 16.4% of the respondents had Primary
Education, 35.5% of the respondents had Post Primary
Education and 25.4% of the respondents had tertiary
education. This implies that the literacy level of the
respondents in the study area is as a result of administrative
and educational role played by colonial period which
influenced their understanding on agricultural practices. The
table further revealed the percentage distribution of the
average monthly income of respondents in the study area. It
could be revealed that 37.7% of the respondent received less
than N18, 000 as their average monthly income, 47.7% of the
respondents received a monthly income between N18,001 -
N100,000 while, 9.1% and 5.5% of the respondents received
an average monthly income of between N100, 001 - N200,
000 and N200, 001 and above respectively. This implies that
majority of the respondents in this study engaged in small
scale farming as their income is too small to embark on large
scale agricultural farming practices.
TABLE VI: SOCIO-ECONOMIC CHARACTERISTICS OF RESPONDENTS
Socio-economic
Variables
Variables Frequency Percent
Age Less than 18 years 12 5.4 18-40 years 137 62.3 41-60 years 62 28.2 Above 60 years 9 4.1 Total 220 100
Education
Background
No formal
education 50 22.7
Primary 36 16.4 Post Primary 78 35.5 Tertiary 56 25.4 Total 220 100
Income of Respondents
Less than 18,000 83 37.7
18,001-100,000 105 47.7 100,001-200,000 20 9.1 Above 201,000 12 5.5 Total 220 100
B. Types of Foodproduction between 1986 and 2018
The dominant crops cultivated in the study area according
to the study were vegetables (tomatoes, okro and pepper),
root-tubers (yam, cassava and potato) and cereals (maize and
rice) respectively (CRSBS). These crops constitute about
80% of foodstuff found in most of the markets within the
area; its cultivation spreads across the study areas and
beyond.
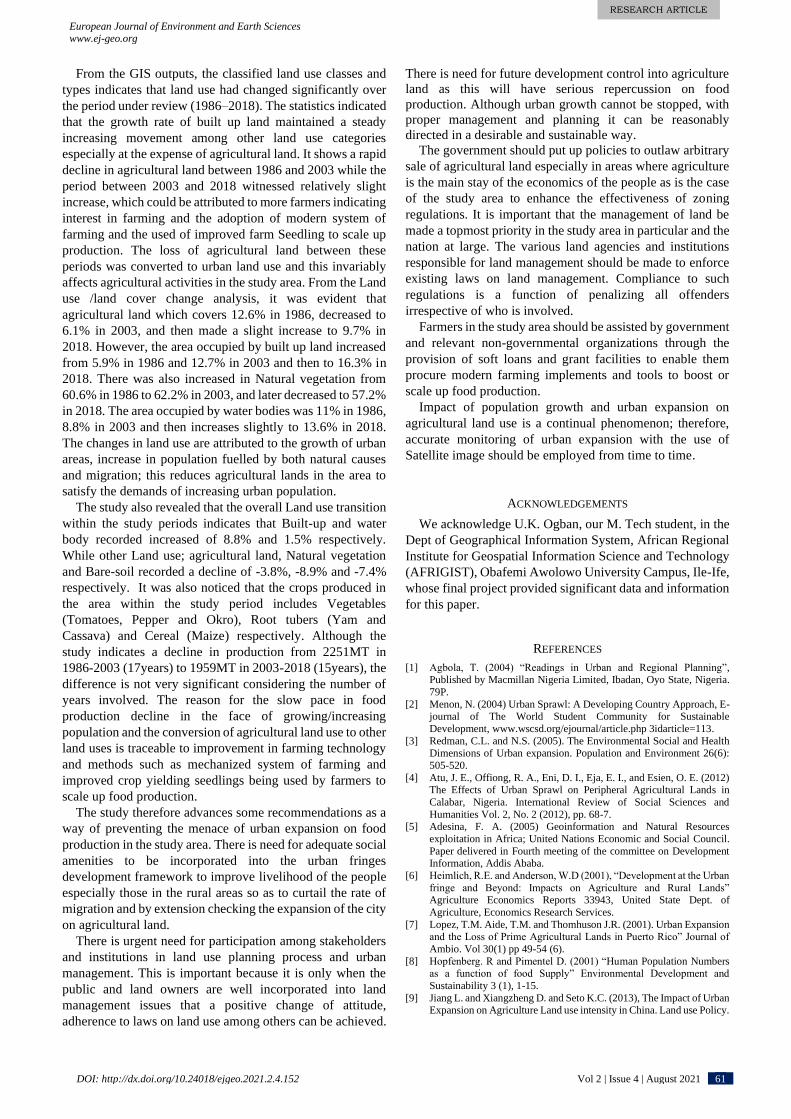
Table VII and Fig. 9 shows food crop production between
1986 and 2018 for the period representing the period covered
by the study. The result indicates that the total crop
production of tomatoes from 1986-2003 was 370 tonnes
(15.1%) compared to 307 tonnes (15.7%) produced between
2003- 2018 (15-year period). Pepper production in 1986-
2003 recorded 376 tonnes compared to 331 tonnes produced
in 2003-2018, while okro total production achieved between
1986-2003 was 428 tonnes as against 379 tonnes achieved
between 2003-2018, hence indicating a decline in production
by 49 tonnes between 1986 and 2018, representing 19.3%
decline as shown in Fig. 9 Yam, cassava and maize also
recorded various degrees of changes in production as shown
in the table.
The declining agricultural activities due to consequences
of land conversions and population increase, as most families
0
200
400
600
800
1000
1200
1400
1600
18001506,3
845,6
579,2
137,9
1638
214 211,5
766,5
648,9
613,4
63
AR
EA (
Ha)
LULC Transition
RESEARCH ARTICLE
European Journal of Environment and Earth Sciences www.ej-geo.org
DOI: http://dx.doi.org/10.24018/ejgeo.2021.2.4.152 Vol 2 | Issue 4 | August 2021 60
formerly relying on farm for food as income are looking for
non-farm jobs within their locality for survival. The
conversion of agricultural land to urban land use has an
adverse effect on the labour force that is engaged in farming
activities hence having a negative impact on food production.
TABLE VII: PERCENTAGE OF CROP PRODUCTION FROM
1986-2018
Crop-Type(MT) 1986-2003 Percentage
(%) 2003-2018
Percentage
(%)
Tomatoes 340 15.1 307 15.7
Pepper 376 16.7 331 16.9
Okro 428 19 379 19.3
Yam 287 12.7 255 13.0
Cassava 404 18 340 17.4
Maize 416 18.5 347 17.7 TOTAL 2251 100 1959 100
Source: Cross River State Bureau of Statistics, (CRSBS), 2018).
Fig. 9. Crop production between 1986 and 2018.
Source: Cross River State Bureau of Statistics, (CRSBS), 2018.
C. Severity Level of Land use Effect on Urban food
production in Calabar
Comparing the opinion of respondents (farmers) on the
severity of variable factors on urban food production in
Calabar, the result obtained from the statistical regression
analysis in figure 10 suggested that 30.1% of the agricultural
productivity has been severely affected. Furthermore, 40.7%
of the farmers are of the opinion that loss of farm land is
severe to urban food production in the study area; thereby
affecting the lands that would have being cultivated for
agricultural purposes which in-turn affects agricultural
productivity negatively. It was also discovered from the
responses that the 30.1% of farmers has severely reduced
hence having negative impact on production. This might
account for the reason in the moderate increase (35.8%) in
non-farm income in the Study area. According to FAO [22],
the more increase in population the more the demand for
agricultural produce. It was discovered from the study that
33.6% of the people that demanded for farm produce is
severe. Because of the severe decrease of agricultural
produce, prices of agricultural products are also severely
high. From the analysis, 28.7% of the respondents were of the
view it is very severe, while 22.7% suggested it is moderate.
Also 27.6% said increase in Land value is very severe while
33.6% suggested Severe in their own opinion. The severe
increase in the value of land could also be responsible for the
severe increase in the cost of land. Also 30.5% of the farmers
opine that the movement of rural populace to Calabar is
severe, while 23.8% and 26.2% of them were of the opinion
that it was very severe and moderate respectively. On the
expansion of the built-up areas 31.6% said that the expansion
is severe while 33.5% and 29.9% said it was severe and
moderate expansion respectively. However, 6% and 7% of
the respondents are of the view that the expansion was not
severe and even not at all severe respectively. Social facility
is one of the major built-up land-uses in an urban centre.
These facilities, according to most of the farmer’s
respondents seem to be increasing severely (32.5%).
Furthermore, industrialization being one of the key measures
of urbanization was also reported to be increasing severely
(30.5%).
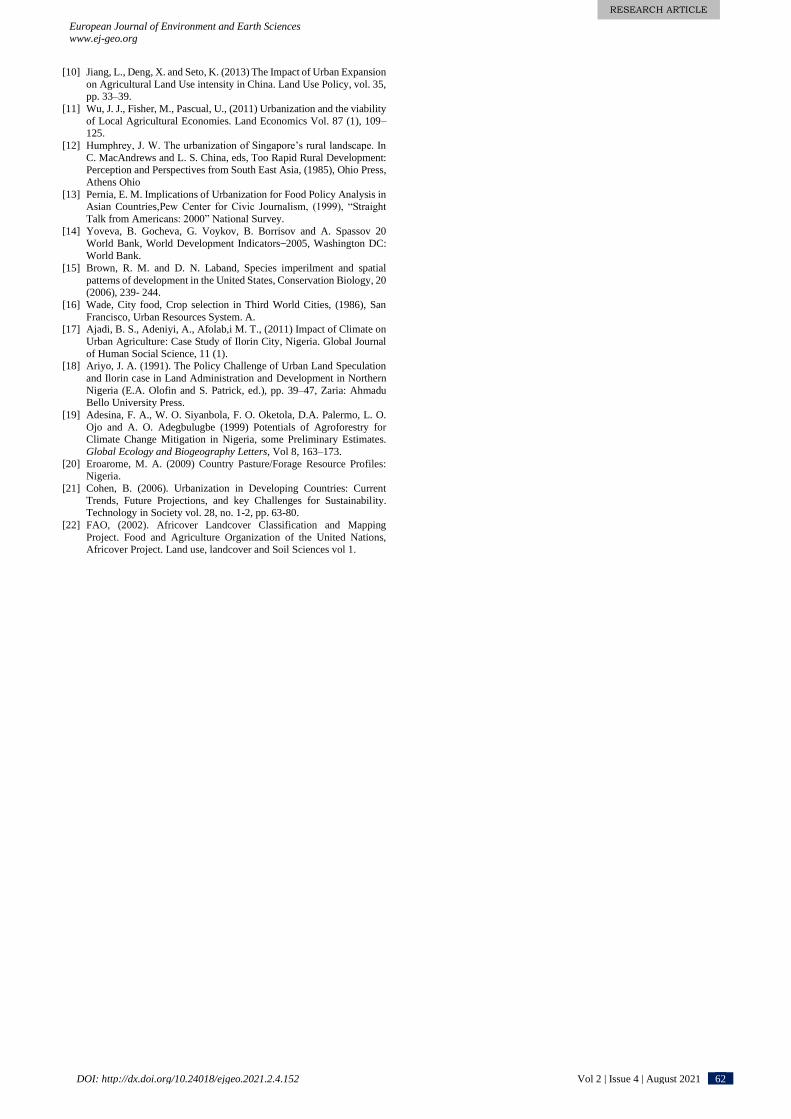
Summarily, the mean score severity level land use effect of
each of the variables ranges between severe and moderate
effect on agriculture. Reduction in agricultural productivity at
the top of the ranking with 2.0 mean score indicating a severe
effect while industrialization and increase in social facilities
are the least with 2.6 mean score indicating week severe
effect as it is close to moderate effect more than severe effect
(see Fig. 10).
Fig. 10. Mean score severity level of land use effect on urban food
production. Source: Field survey, 2018.
VI. CONCLUSION
The study has highlighted the problem of urban expansion
on food production in Calabar, Nigeria.
The conversion of agricultural land into urban land uses
poses serious effects on urban food production with the
decline in agricultural land as farm lands are being converted
to urban land uses.
Urban expansion is driven by certain factors such as
populations increase as a result of rural-urban migrations and
natural increase; these driving forces have positive and
negative effects on farmers. These negatively impact the
farmer’s means of livelihood (farmlands). Hence leaves the
farmer with the option to either sell the farm and venture into
another/ alternative business or relocate to different location
in search of farmland to continue their farming. This scenario
will lead to decrease in food production in the area, drop in
the farmer’s income and overall standard of living. The
implications of decrease in food production may be quite
severe, these includes; extreme hunger, high cost of food,
poverty, loss of government revenue and increase in crime
rate among others.
Reduction in Agricultural…
Loss of Farm Land
Increase in Non-Farm Income
Reduced Number of Farmers
Market of Farm Produce
Increased land value
Increase in Prices of…
Land use change
Rural-urban migration
Expansion of the built-up…
Increase in social facilities
Quest for further studies
Industrialisation
Cost of land
Mean scores
Mean scores
2.62.5
2.62.12.42.32.2
2.32.52.3
2.42.32.0
2.2
KEY1=Very severe2= Severe3= Moderate4= Not severe
0
50
100
150
200
250
300
350
400
450
Pro
du
ctio
n (
ton
na
ge)
Crop Production categories (years)
1986-2003 2003-2018
RESEARCH ARTICLE
European Journal of Environment and Earth Sciences www.ej-geo.org
DOI: http://dx.doi.org/10.24018/ejgeo.2021.2.4.152 Vol 2 | Issue 4 | August 2021 61
From the GIS outputs, the classified land use classes and
types indicates that land use had changed significantly over
the period under review (1986–2018). The statistics indicated
that the growth rate of built up land maintained a steady
increasing movement among other land use categories
especially at the expense of agricultural land. It shows a rapid
decline in agricultural land between 1986 and 2003 while the
period between 2003 and 2018 witnessed relatively slight
increase, which could be attributed to more farmers indicating
interest in farming and the adoption of modern system of
farming and the used of improved farm Seedling to scale up
production. The loss of agricultural land between these
periods was converted to urban land use and this invariably
affects agricultural activities in the study area. From the Land
use /land cover change analysis, it was evident that
agricultural land which covers 12.6% in 1986, decreased to
6.1% in 2003, and then made a slight increase to 9.7% in
2018. However, the area occupied by built up land increased
from 5.9% in 1986 and 12.7% in 2003 and then to 16.3% in
2018. There was also increased in Natural vegetation from
60.6% in 1986 to 62.2% in 2003, and later decreased to 57.2%
in 2018. The area occupied by water bodies was 11% in 1986,
8.8% in 2003 and then increases slightly to 13.6% in 2018.
The changes in land use are attributed to the growth of urban
areas, increase in population fuelled by both natural causes
and migration; this reduces agricultural lands in the area to
satisfy the demands of increasing urban population.
The study also revealed that the overall Land use transition
within the study periods indicates that Built-up and water
body recorded increased of 8.8% and 1.5% respectively.
While other Land use; agricultural land, Natural vegetation
and Bare-soil recorded a decline of -3.8%, -8.9% and -7.4%
respectively. It was also noticed that the crops produced in
the area within the study period includes Vegetables
(Tomatoes, Pepper and Okro), Root tubers (Yam and
Cassava) and Cereal (Maize) respectively. Although the
study indicates a decline in production from 2251MT in
1986-2003 (17years) to 1959MT in 2003-2018 (15years), the
difference is not very significant considering the number of
years involved. The reason for the slow pace in food
production decline in the face of growing/increasing
population and the conversion of agricultural land use to other
land uses is traceable to improvement in farming technology
and methods such as mechanized system of farming and
improved crop yielding seedlings being used by farmers to
scale up food production.
The study therefore advances some recommendations as a
way of preventing the menace of urban expansion on food
production in the study area. There is need for adequate social
amenities to be incorporated into the urban fringes
development framework to improve livelihood of the people
especially those in the rural areas so as to curtail the rate of
migration and by extension checking the expansion of the city
on agricultural land.
There is urgent need for participation among stakeholders
and institutions in land use planning process and urban
management. This is important because it is only when the
public and land owners are well incorporated into land
management issues that a positive change of attitude,
adherence to laws on land use among others can be achieved.
There is need for future development control into agriculture
land as this will have serious repercussion on food
production. Although urban growth cannot be stopped, with
proper management and planning it can be reasonably
directed in a desirable and sustainable way.
The government should put up policies to outlaw arbitrary
sale of agricultural land especially in areas where agriculture
is the main stay of the economics of the people as is the case
of the study area to enhance the effectiveness of zoning
regulations. It is important that the management of land be
made a topmost priority in the study area in particular and the
nation at large. The various land agencies and institutions
responsible for land management should be made to enforce
existing laws on land management. Compliance to such
regulations is a function of penalizing all offenders
irrespective of who is involved.
Farmers in the study area should be assisted by government
and relevant non-governmental organizations through the
provision of soft loans and grant facilities to enable them
procure modern farming implements and tools to boost or
scale up food production.
Impact of population growth and urban expansion on
agricultural land use is a continual phenomenon; therefore,
accurate monitoring of urban expansion with the use of
Satellite image should be employed from time to time.
ACKNOWLEDGEMENTS
We acknowledge U.K. Ogban, our M. Tech student, in the
Dept of Geographical Information System, African Regional
Institute for Geospatial Information Science and Technology
(AFRIGIST), Obafemi Awolowo University Campus, Ile-Ife,
whose final project provided significant data and information
for this paper.
REFERENCES
[1] Agbola, T. (2004) “Readings in Urban and Regional Planning”, Published by Macmillan Nigeria Limited, Ibadan, Oyo State, Nigeria.
79P.
[2] Menon, N. (2004) Urban Sprawl: A Developing Country Approach, E-journal of The World Student Community for Sustainable
Development, www.wscsd.org/ejournal/article.php 3idarticle=113.
[3] Redman, C.L. and N.S. (2005). The Environmental Social and Health
Dimensions of Urban expansion. Population and Environment 26(6):
505-520.
[4] Atu, J. E., Offiong, R. A., Eni, D. I., Eja, E. I., and Esien, O. E. (2012) The Effects of Urban Sprawl on Peripheral Agricultural Lands in
Calabar, Nigeria. International Review of Social Sciences and
Humanities Vol. 2, No. 2 (2012), pp. 68-7. [5] Adesina, F. A. (2005) Geoinformation and Natural Resources
exploitation in Africa; United Nations Economic and Social Council.
Paper delivered in Fourth meeting of the committee on Development Information, Addis Ababa.
[6] Heimlich, R.E. and Anderson, W.D (2001), “Development at the Urban
fringe and Beyond: Impacts on Agriculture and Rural Lands” Agriculture Economics Reports 33943, United State Dept. of
Agriculture, Economics Research Services.
[7] Lopez, T.M. Aide, T.M. and Thomhuson J.R. (2001). Urban Expansion and the Loss of Prime Agricultural Lands in Puerto Rico” Journal of
Ambio. Vol 30(1) pp 49-54 (6).
[8] Hopfenberg. R and Pimentel D. (2001) “Human Population Numbers
as a function of food Supply” Environmental Development and
Sustainability 3 (1), 1-15.
[9] Jiang L. and Xiangzheng D. and Seto K.C. (2013), The Impact of Urban Expansion on Agriculture Land use intensity in China. Land use Policy.
RESEARCH ARTICLE
European Journal of Environment and Earth Sciences www.ej-geo.org
DOI: http://dx.doi.org/10.24018/ejgeo.2021.2.4.152 Vol 2 | Issue 4 | August 2021 62
[10] Jiang, L., Deng, X. and Seto, K. (2013) The Impact of Urban Expansion
on Agricultural Land Use intensity in China. Land Use Policy, vol. 35, pp. 33–39.
[11] Wu, J. J., Fisher, M., Pascual, U., (2011) Urbanization and the viability
of Local Agricultural Economies. Land Economics Vol. 87 (1), 109–125.
[12] Humphrey, J. W. The urbanization of Singapore’s rural landscape. In
C. MacAndrews and L. S. China, eds, Too Rapid Rural Development: Perception and Perspectives from South East Asia, (1985), Ohio Press,
Athens Ohio
[13] Pernia, E. M. Implications of Urbanization for Food Policy Analysis in Asian Countries,Pew Center for Civic Journalism, (1999), “Straight
Talk from Americans: 2000” National Survey.
[14] Yoveva, B. Gocheva, G. Voykov, B. Borrisov and A. Spassov 20
World Bank, World Development Indicators⎯2005, Washington DC:
World Bank.
[15] Brown, R. M. and D. N. Laband, Species imperilment and spatial
patterns of development in the United States, Conservation Biology, 20 (2006), 239- 244.
[16] Wade, City food, Crop selection in Third World Cities, (1986), San
Francisco, Urban Resources System. A. [17] Ajadi, B. S., Adeniyi, A., Afolab,i M. T., (2011) Impact of Climate on
Urban Agriculture: Case Study of Ilorin City, Nigeria. Global Journal
of Human Social Science, 11 (1). [18] Ariyo, J. A. (1991). The Policy Challenge of Urban Land Speculation
and Ilorin case in Land Administration and Development in Northern
Nigeria (E.A. Olofin and S. Patrick, ed.), pp. 39–47, Zaria: Ahmadu Bello University Press.
[19] Adesina, F. A., W. O. Siyanbola, F. O. Oketola, D.A. Palermo, L. O.
Ojo and A. O. Adegbulugbe (1999) Potentials of Agroforestry for Climate Change Mitigation in Nigeria, some Preliminary Estimates.
Global Ecology and Biogeography Letters, Vol 8, 163–173.
[20] Eroarome, M. A. (2009) Country Pasture/Forage Resource Profiles: Nigeria.
[21] Cohen, B. (2006). Urbanization in Developing Countries: Current
Trends, Future Projections, and key Challenges for Sustainability. Technology in Society vol. 28, no. 1-2, pp. 63-80.
[22] FAO, (2002). Africover Landcover Classification and Mapping
Project. Food and Agriculture Organization of the United Nations, Africover Project. Land use, landcover and Soil Sciences vol 1.
Recommended