Embed Size (px)
Citation preview

87
Determination of Urban Spatial Expansion of Thika Municipality Using Land Use/Cover Change and Shannon’s Entropy
Oscar Mbugua Muiruri1
Patroba Achola Odera2
AbstractSpatial urban expansion forms an integral part of urban planning. This study assesses spatial expansion of Thika Municipality, in terms of land use/cover (LUC) change and Shannon’s entropy over a period of 34 years. Thika Municipality is one of the fastest growing industrial and socio-economic towns in Kenya. It is characterized by rapid and less dense urban growth evidenced by unplanned incremental urban development. Remote sensing and GIS techniques were used to determine urban expansion. Landsat images acquired in 1976, 1988, 2000 and 2010 were classified to determine LUC change and Relative Shannon’s Entropy. The study found significant changes in land use/cover in Thika Municipality. With built-up area expanding at a rate of 0.91% (of the total area) per year, which translates into urban expansion of +31% in 34 years, bare-land expanded at 0.21% per year (+7% in 34 years), while agricultural/vegetation decreased at 1.12% per year (-38% in 34 years). No urban sprawl was detected in 1976. However, instances of urban sprawl were observed from 1988 to 2010, in an incremental manner.
Key words: urban expansion, urban sprawl, land use/cover, Relative Shannon’s Entropy
1Department of Geomatic Engineering and Geospatial Information Systems, Jomo Kenyatta University of Agriculture and Technology.
2Division of Geomatics, School of Architecture, Planning and Geomatics, University of Cape Town,
*Corresponding author’s email address: [email protected]
Ghana Journal of Geography Vol. 10(2), 2018 pages 87 – 95 DOI: https://dx.doi.org/10.4314/gjg.v10i2.6

88
IntroductionTraditionally, most of the human populations have lived in rural areas. However, this trend has changed over time due to rural-urban migration of people and expansion of urban centres. This makes the urban areas grow in terms of population and spatial size, resulting in loss of open spaces, low-quality services and goods, high population density and related insecurity. Urban sprawl refers to the spreading out of a city and its suburbs over more and more rural land at the periphery of the urban area, especially when such spread is characterized by unplanned incremental urban development and a low density mix of land uses (European Environmental Agency, 2000). Several authors have discussed urban sprawl, but they have focused mainly on its spatial, temporal and socio-economic aspects (e.g., Osborn, 1946; Samuel, 1998; Barnes et al., 2002; Sutton, 2003; Bengston et al., 2004; Nechyba & Walsh, 2004; Yu & Ng, 2007; Wassmer, 2008; Bhatta, 2010; Bhatta et al., 2010; Jaeger et al., 2010; Cabral et al., 2013; Yue et al., 2013, Ozturk, 2017; Zambon et al., 2017).
Several techniques for determining urban sprawl exist today. They include shape index, Shannon’s entropy and fractal analysis, just to mention a few. Shannon’s entropy and fractal analysis are among the recent techniques for urban sprawl determination and characterisation respectively. The current study has adopted Shannon’s entropy technique to evaluate the degree of spatial concentration or dispersion of built-up area in Thika Municipality over a period of 34 years, due to the robustness and straightforward application of this technique (Verzosa & Gonzalez 2010; Sarvestani et al., 2011). Spatial variables applied in the determination of Shannon’s entropy values are readily available from processed remote-sensed datasets (both current and historical). This allows for a long-term monitoring of urban sprawl to facilitate projection(s) of future spatial dynamics of an urban centre.
There is a substantial body of literature on urban sprawl, but most of it is about developed countries. Urban spatial expansion is often ignored in developing countries such as Kenya. Where it is taken into consideration, attention is usually on the major cities (capital cities); the subsidiary towns such as Thika in Kenya are, to a large extent, ignored. However, urban sprawl is by no means a phenomenon restricted to developed countries, as shown by recent studies based in both developing and under developed countries (Jaeger et al., 2010; Yue et al., 2013). For instance, according to Nabutola (2012), urban development in Kenya has largely been taking place without a comprehensive national urban development framework, which has led to problems of segregated conceptions of urban development. UN-HABITAT (2006) noted that the latest master plan for Nairobi city was developed in 1973 and has since been out-paced by the impact of urban growth. It is only recently that the Nairobi City (now Nairobi City County) developed a vision 2020/2030 development plan. Thus, the growth of Nairobi City has been without a commensurate service infrastructure plan, and as such, existing infrastructure has been overburdened by the hyper growth of the city in both formal and informal directions (Adebayo, 2012).
Thika is considered one of the fastest growing towns in Kenya due to the numerous industries, learning institutions and well laid transport and communication systems. This has led to improved economic growth of the area, which in turn has led to increased population in the area. The result is that there are instances of unplanned urban spatial expansion as evidenced by the recent land use change development around the area and its environs through land use conversion from agricultural activities to commercial and residential
Ghana Journal of Geography Vol. 10(2), 2018 pages 87–95

89
buildings (Musa & Odera, 2015). Thika town is an industrial town in Kiambu County, Kenya. The town lies on Thika road, 40 kilometers north east of Nairobi, near the confluence of the Thika and Chania Rivers. It lies between latitudes 0°58′00″ S and 1°08′00″ S and longitudes 36°56′00″ E and 37°12′00″ E. Thika Municipality covers an estimated area of 327.1 km2 and has an estimated population of about 220,000 people (KNBS, 2014). The general study area is shown in Figure 1.
This paper carried out a determination of urban spatial expansion in Thika Municipality over a period of 34 years. Geospatial technologies were used to carry out mapping and analysis of spatial data in Thika Municipality to determine urban growth patterns and related spatial sprawl. Landsat images were obtained freely from the USGS website.
Figure 1: Study area (Thika Municipality image obtained from Google Earth)Source: Google Earth 2018
Materials and Methods Description of Data Landsat images for the years 1976 (August), 1988 (September), 2000 (October) and 2010 (October) were used. The imageries were downloaded from the United States Geological Survey Earth-Explorer (USGS EE) website. The other datasets used comprised a shapefile of administrative boundaries in Kenya, detailing the boundaries of the various municipalities in the country, obtained from the International Livestock Research Institute, Kenya (ILRI). The datasets and their sources are summarized in Table 1. The initial intention was to use an exact epoch interval of 10 years. However, the significant presence of cloud cover and striping in some images resulted in a-not-so exact interval, but one that was still good enough to achieve the objectives of the research.
Table 1: Datasets and their sources
Determination of Urban Spatial Expansion

90
Dataset Source Purpose
Landsat imagery (1976,1988, 2000 and 2010) USGS EE website Monitoring land use/cover changes
for time series analysis
Administrative boundary ILRI Preparation of study area Map
Google Earth mapsGoogle Earth Reference points for accuracy
assessment for recent imagery
Topographic/thematic maps Survey of Kenya Reference points for accuracy assessment for earlier imagery
Source: Authors’ representation 2018
Image classification and re-classificationFor the 1976 imagery, all the bands were used in layer stacking; however, for the images for years 1988 and 2000, band 6 was omitted because it comprises the thermal band not applied during classification. For the 2010 image, band 1 was omitted, as it comprises the coastal aerosols and the area of study is not within the coastal boundary. Bands 9, 10 and 11 of the Landsat 8 were also omitted as they comprise cirrus and thermal bands respectively and are not required for classification in the current study.
Unsupervised classification (applying K-means algorithm) was first carried out and subsequently supervised classification was done (applying the maximum likelihood technique). This was necessary since the area of study was relatively small as compared to the whole size of the image. For this reason, unsupervised classification was carried out for the whole image, then the area of study was subset to the municipal boundary. Supervised classification was carried out for the subset image to refine the classification results for the area of study. Classification was done onto four major categories, namely built-up area, agricultural/vegetation, bare land and water body.
Determination of Urban SprawlJust as there are many ways to define urban sprawl, there are also many ways to measure the phenomenon. Many attempts have been made to measure sprawl (Theil, 1967; Thomas, 1981; Lata et al., 2001; Yeh & Li, 2001; Sun et al., 2007). One of the most commonly used measures of urban sprawl is the Relative Shannon’s Entropy method because of its simplicity, measure of diversity and evenness for spatial-related issues in fields such as landscape ecology and urban studies. The method uses the ratio of built-up area and total area of a zone to determine a probability parameter (Thomas, 1981). It is expressed as,
where 'nH is Relative Shannon’s Entropy, ip is a probability parameter, ix is the ratio of the built-up area
( ) and the total area ( ) of land in the ith zone and n is the total number of zones.
Ghana Journal of Geography Vol. 10(2), 2018 pages 87–95

91
Equation 1 is executed by first reclassifying land use/cover maps into two classes (built-up and non-built-up). Multiple buffer rings of 1 km from the town’s Central Business District (CBD) were established and a total of thirteen zones obtained. Both zone and epoch Relative Shannon’s Entropy (RSE) values were computed. Relative Shannon’s Entropy values range from 0 to 1 and any value above 0.5 may indicate the presence of urban sprawl, depending on the distance from the CBD.
Results and DiscussionSpatial distribution of land use/cover for 1976, 1988, 2000 and 2010 is shown in Figure 2, while Figure 3 shows spatial distribution of Relative Shannon’s Entropy (RSE) values for 13 zones (1 km each) for the years 1976, 1988, 2000 and 2010. Figure 4 gives percentage land use/cover and Relative Shannon’s Entropy (RSE) values for 1976, 1988, 2000 and 2010. The overall accuracy for the classification was 0.8, with a kappa coefficient of 0.7 for all classified images.
Figure 2: Land use/cover in Thika Municipality – a 1976, b 1988, c 2000 and d 2010Source: Authors’ computation and representation 2018
The agricultural/vegetation had the highest area coverage at 67% in 1976, followed by built-up area (18%), then bare land (15%), as shown in Figures 2a and 4. Water body had an approximate area coverage of less than 0.1%, and hence was not plottable in Figure 4. Land use/cover for 1988 (Figures 2b and 4) shows that bare-land had the highest area coverage at 38%, followed by built-up area (34%), then agricultural/
Determination of Urban Spatial Expansion
92
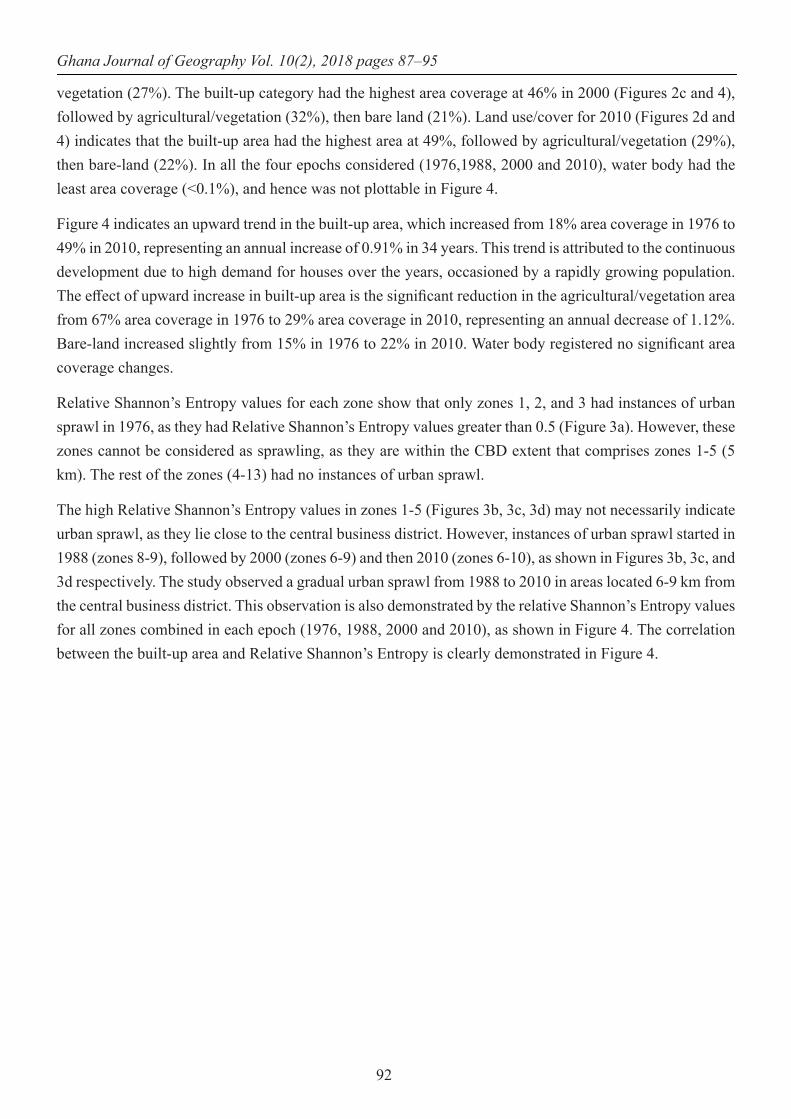
vegetation (27%). The built-up category had the highest area coverage at 46% in 2000 (Figures 2c and 4), followed by agricultural/vegetation (32%), then bare land (21%). Land use/cover for 2010 (Figures 2d and 4) indicates that the built-up area had the highest area at 49%, followed by agricultural/vegetation (29%), then bare-land (22%). In all the four epochs considered (1976,1988, 2000 and 2010), water body had the least area coverage (<0.1%), and hence was not plottable in Figure 4.
Figure 4 indicates an upward trend in the built-up area, which increased from 18% area coverage in 1976 to 49% in 2010, representing an annual increase of 0.91% in 34 years. This trend is attributed to the continuous development due to high demand for houses over the years, occasioned by a rapidly growing population. The effect of upward increase in built-up area is the significant reduction in the agricultural/vegetation area from 67% area coverage in 1976 to 29% area coverage in 2010, representing an annual decrease of 1.12%. Bare-land increased slightly from 15% in 1976 to 22% in 2010. Water body registered no significant area coverage changes.
Relative Shannon’s Entropy values for each zone show that only zones 1, 2, and 3 had instances of urban sprawl in 1976, as they had Relative Shannon’s Entropy values greater than 0.5 (Figure 3a). However, these zones cannot be considered as sprawling, as they are within the CBD extent that comprises zones 1-5 (5 km). The rest of the zones (4-13) had no instances of urban sprawl.
The high Relative Shannon’s Entropy values in zones 1-5 (Figures 3b, 3c, 3d) may not necessarily indicate urban sprawl, as they lie close to the central business district. However, instances of urban sprawl started in 1988 (zones 8-9), followed by 2000 (zones 6-9) and then 2010 (zones 6-10), as shown in Figures 3b, 3c, and 3d respectively. The study observed a gradual urban sprawl from 1988 to 2010 in areas located 6-9 km from the central business district. This observation is also demonstrated by the relative Shannon’s Entropy values for all zones combined in each epoch (1976, 1988, 2000 and 2010), as shown in Figure 4. The correlation between the built-up area and Relative Shannon’s Entropy is clearly demonstrated in Figure 4.
Ghana Journal of Geography Vol. 10(2), 2018 pages 87–95

93
Figure 3: Relative Shannon’s Entropy (RSE) for 13 zones (1 km each) in Thika Municipality – a 1976, b 1988, c 2000 and d 2010Source: Authors’ computation and representation 2018
Figure 4: Percentage land use/cover and Relative Shannon’s Entropy (RSE) values in Thika Municipality for 1976, 1988, 2000 and 2010Source: Authors’ computation and representation 2018
ConclusionThis study has determined land use/cover changes in Thika municipality over a period of 34 years (1976-2010), indicating spatial urban expansion. The study found that there is an immense decline in the area
Determination of Urban Spatial Expansion

94
coverage of the agricultural/vegetation (-38%) and bare land (-7%), characterized by an increase in area coverage of the built-up areas (+31%). Out of the 13 zones of the study area, zones 6-10 had Relative Shannon’s Entropy values above 0.5 in 2010, zones 6-9 in 2000 and zones 8-9 in 1988, indicating the existence of urban sprawl in areas lying 6-10 km from the central business district. The overall Relative Shannon’s Entropy values for the years 1988, 2000 and 2010 indicate existence of urban sprawl, increasing from 1988 to 2010. However, there was no urban sprawl detected in 1976.
Urban expansion being experienced in Thika municipality can be described as Omni-directional (scattered and leapfrog) since the urban spread occurs in all directions (admittedly, constrained by the municipality boundary in the current study), spreading farther from the town centre, but mostly biased on the eastward side of the town centre. This could be mainly because the eastward side has more space and the westward side is an upcoming leafy suburb with controlled development schemes. From the urban expansion trend(s), it can be deduced that zones 6-12 are likely to experience more instances of urban sprawl in the future, hence there is a need for urban planning interventions.
Acknowledgements We are grateful to the Survey of Kenya, USGS, ILRI and Google Earth for making their data freely available for this research. We thank Jomo Kenyatta University of Agriculture and Technology for the support granted to us to carry out the study. Finally, we are grateful for the constructive comments and recommendations by the anonymous reviewer that have improved the quality of our paper.
ReferencesAdebayo, A.A. (2012). A Tale of Two African Cities: Hyper Growth, Sprawl and Compact City
Development: Towards the Development of a Sustainable Future City. 48th ISOCARP Congress, 10-13 September 2012, Perm, Russia.
Barnes, K.B., Morgan, J.M., Roberge, M.C. & Lowe, S. (2002). Sprawl development: its patterns, consequences, and measurement. Technical Report-January 2002, Geospatial Research and Education Laboratory, Department of Geography and Environmental Planning, Towson University, Baltimore, Maryland, USA.
Bengston, D.N., Fletcher, J.O. & Nelson, K.C. (2004). Public policies for mananging urban growth and protecting open space: policy mechanisms and lessons learned in the United States. Landscape & Urban Planning, 69(2-3), 271–286.
Bhatta, B. (2010). Analysis of urban growth and sprawl from remote sensing data. Chapter 4. Heidelberg, Springer-Verlag, 49–64.
Bhatta, B., Saraswati, S. & Bandyopadhyay, D. (2010). Urban sprawl measurement from remote sensing data. Applied Geography, 30(4), 731–740.Cabral, P., Augusto, G., Tewolde, M. & Araya, Y. (2013). Entropy in Urban Systems, Entropy, 15(12),
5223–5236.European Environmental Agency. (2000). CORINE Land cover technical guidelines.Jaeger, J. A. G., Bertiller, R., Schwick, C. & Kienast, F. (2010). Suitability criteria for measures of urban
sprawl. Ecological Indicators, 10(2), 397–406. Kenya National Bureau of Statistics. (2014). KNBS - Statistical Abstract (2014).
Ghana Journal of Geography Vol. 10(2), 2018 pages 87–95

95
Lata, K.M., Sankar, R.C.H., Krishna, P.V., Badrinath, K.V.S. & Raghavaswamy, V. (2001). Measuring urban sprawl: a case study of Hyderabad, GIS Development, 5, 8–13.
Musa, M.K. & Odera, P.A. (2015). Land use land cover changes and their effects on agricultural land: A Case study of Kiambu County – Kenya. Kabarak Journal of Research & Innovation, 3(1), 74–86.
Nabutola, W.L. (2012). National Urban Development Policy (NUDP) making process: the Kenyan way: big challenges and some opportunities, TS02J - Planning Policies and Procedures I, 5828, FIG Working Week, 6-10 May 2012, Rome, Italy,
Nechyba, T.J. & Walsh, R.P. (2004). Urban Sprawl. Journal of Economic Perspectives,18(4), 177–200.Osborn, F J. (1946). The Garden City Movement: Reaffirmation of the validity of Ebenezer Howard’s
idea. Landscape Architecture, 36 (2), 43–54.Ozturk, D. (2017). Assessment of urban sprawl using Shannon’s entropy and fractal analysis: a case study
of Atakum, Ilkadim and Canik (Samsun, Turkey). Journal of Environmental Engineering and Landscape Management, 25(3), 264–276.
Samuel, T. (1998). Urban Sprawl is Hot-Botton (sic) Issue in Many Cities Across the Nation. St. Louis Post-Dispatch. December 20, p. B7.
Sarvestani, M.S., Ibrahim, L.A. & Kanaroglou, P. (2011). Three decades of urban growth in the city of Shiraz, Iran: A remote sensing and geographic information systems application. Cities, 28(4), 320–329.
Sun, H., Forsythe, W. & Waters, N. (2007). Modeling Urban Land Use Change and Urban Sprawl: Calgary, Alberta, Canada. Network & Spatial Economics, 7, 353–376.
Sutton, P.C. (2003). A scale-adjusted measure of “Urban Sprawl” using nighttime satellite imagery. Remote Sensing of Environment, 86(3): 353–369.
Theil, H. (1967). Economics and information theory. Amsterdam: North-Holland publishing.Thomas, R. W. (1981). Information statistics in geography, Geo abstracts. Norwich: University of East
Anglia.UN-HABITAT. (2006). Nairobi Urban Sector Profile. Nairobi, Kenya.Verzosa, L.C.O. & Gonzalez, R.M. (2010). Remote sensing, geo-graphic information systems and
Shannon’s entropy: measuring urban sprawl in a mountainous environment. In; Wagner, W. & Székely, B. (eds.). ISPRS TC VII Symposium, 100 Years ISPRS, 5-7 July 2010, Vienna, Austria, ISPRS, XXXVIII, Part 7A, 269–274.
Wassmer, R.W. (2008). Causes of Urban Sprawl in the United States: Auto reliance as compared to natural evolution, flight from blight, and local revenue reliance. Journal of Policy Analysis & Management, 27(3), 536–555.
Yeh, A.G.O. & Li, X. (2001). Measurement and monitoring of urban sprawl in a rapidly growing region using entropy. Photogrammetric Engineering & Remote Sensing, 67 (1), 83–90.
Yu, X.-J. & Ng, C.-N. (2007). Spatial and temporal dynamics of urban sprawl along two urban–rural transects: a case study of Guangzhou, China. Landscape & Urban Planning, 79(1), 96–109
Yue, W., Liu, Y. & Fan, P. (2013). Measuring urban sprawl and its drivers in large Chinese cities: The case of Hangzhou. Land Use Policy, 31, 358–370.
Zambon, I., Serra, P., Sauri, D., Carlucci, M. & Salvati, L. (2017). Beyond the ‘Mediterranean city’: socioeconomic disparities and urban sprawl in three Southern European cities. Geografiska Annaler: Series B, Human Geography, 99 (3), 319–337.
Determination of Urban Spatial Expansion