INTEGRATED MASTER IN ENVIRONMENTAL ENGINEERING
Anaerobic digestion of sludge from marine
recirculation aquaculture systems
Rui Carlos Barata Ferreira
Thesis submitted for the obtainment of the degree:
MASTER IN ENVIRONMENTAL ENGINEERING FROM FACULTY OF ENGINEERING OF
UNIVERSITY OF PORTO
___________________________________________________________
President of Jury: Associate Professor Miguel Madeira
(Department of Chemistry Engineering of Faculty of Engineering of University of Porto)
___________________________________________________________
Supervisors: Professor Mark van Loosdrecht, Associate Professor Henri Spanjers, PhD
Candidate Xuedong Zhang
(Delft University of Technology)
Porto, July 2012

Integrated Master in Environmental Engineering 2011/2012
Edited by:
FACULTY OF ENGINEERING OF UNIVERSITY OF PORTO
Rua Dr. Roberto Frias
4200-465 PORTO
Portugal
Phone: +351-22-508 1400
Fax: +351-22-508 1440
E-mail: [email protected]
Website: http://www.fe.up.pt
Partial reproductions of this document will be authorized in the condition of being mentioned
the Author and referred the Integrated Master in Environmental Engineering – 2011/2012 –
Faculty of Engineering of University of Porto, Porto, Portugal, 2012.
The opinions and information included in this document represent only the point of view of
the respective Author, the Editor cannot accept any legal responsibility or other related with
mistakes or omissions that might exist.

Anaerobic digestion of sludge from marine recirculation aquaculture systems
1
Abstract
Marine recirculation aquaculture systems (marine RAS) are considered as the most
economical and sustainable solution to meet the increasing seafood demand. However, a
considerable amount of organic-rich and salty sludge is produced and needs to be managed.
The emission minimization of marine aquaculture recirculation systems (EM-MARES)
project aims to minimize the emission of marine RAS and also to achieve recuperation of bio-
energy (methane) and phosphorus (struvite). This project includes three phases: coagulation of
the sludge from marine RAS; anaerobic digestion in continuously stirred tank reactor (CSTR);
and struvite recovery from the digested.
This research was part of the second phase of the EM-MARES project – anaerobic digestion
of sludge from marine RAS in CSTR. The aim was twofold: first, to investigate the performance
of CSTR inoculated with microorganisms already adapted to saline conditions and to compare
the results with previous investigations about anaerobic digestion of sludge from marine RAS
and typical values from anaerobic digestion of sewage sludge; second, to study the effect of
salinity, potassium, compatible solutes and ferric chloride (FeCl3) on specific methanogenic
activity (SMA), phosphatase activity (PA), phosphate (PO43-) release and extracellular polymeric
substances (EPS).
A steady state operation of CSTR inoculated with microorganisms already adapted to saline
conditions has been achieved. COD and VS removal efficiencies were 39.7-62.1% and 45.2-
70.9%, respectively, and methane percentage in the biogas and production were 46.1-65.6%
and 0.142-0.244 l methane/g COD added, respectively. The results of the present study were
better than those reported by previous investigations, in terms of the obtainment of a stable
operation and higher methane yields. Moreover, the volumetric methane production rate was
higher than that typically found for anaerobic digestion of sewage sludge.
Batch studies showed that an increase of salinity decreased SMA, PA and PO43- release and
also affected EPS production. The two compatible solutes tested, betaine and trehalose,
improved SMA, PA and PO43- release and decreased the amount of bound EPS (bEPS) produced
by the cells. Potassium did not show apparent effect on SMA, however, it improved PA and
PO43- release and increased the amount of bEPS. FeCl3, already tested as coagulant in the first
part of the EM-MARES project, did not present any negative effect on PA and EPS, and
increased PO43- release.
This research demonstrates the anaerobic digestion in CSTR as a feasible solution for the
management of sludge from marine RAS, increasing the sustainability of these systems which
are the major solution to keep satisfying the increasing demand of seafood.
Keywords: marine recirculation aquaculture systems; sludge; salinity; anaerobic digestion;
methane; phosphorus; ferric chloride; potassium; compatible solutes; specific methanogenic
activity; phosphatase; phosphate; extracellular polymeric substances.

Anaerobic digestion of sludge from marine recirculation aquaculture systems
2
Anaerobic digestion of sludge from marine recirculation aquaculture systems
3
Resumo
Os sistemas de aquacultura marinha com recirculação (marine recirculation aquaculture
systems (marine RAS)) são considerados a solução mais económica e sustentável para
satisfazer o crescente consumo de espécies marinhas. Porém, uma quantidade considerável de
lamas salgadas e ricas em matéria orgânica é produzida e deve ser gerida.
O projeto “minimização da emissão dos sistemas de aquacultura marinha com recirculação”
(emission minimization of marine aquaculture recirculation systems (EM-MARES)) tem como
objetivo minimizar as emissões dos marine RAS mas também recuperar bio-energia (metano) e
fósforo (estruvite). Este projeto inclui três fases: coagulação das lamas provenientes dos
marine RAS; digestão anaeróbia num reator perfeitamente agitado (continuously stirred tank
reactor (CSTR)); e recuperação de estruvite das lamas digeridas.
Este trabalho insere-se na segunda fase do projeto EM-MARES – digestão anaeróbia das
lamas provenientes dos marine RAS num CSTR. Os objetivos foram: primeiro, investigar o
desempenho de CSTR inoculado com microrganismos adaptados a elevada salinidade e
comparar os resultados com investigações anteriores relacionadas com a digestão anaeróbia
de lamas dos marine RAS e valores típicos da digestão anaeróbia de lamas de esgotos
municipais; segundo, estudar o efeito da salinidade, do potássio, de solutos compatíveis e do
cloreto de ferro (FeCl3), na atividade metanogénica específica (specific methanogenic activity
(SMA)), na atividade da fosfatase (phosphatase activity (PA)), na libertação de fosfato (PO43-) e
nas substâncias poliméricas extracelulares (extracellular polymeric substances (EPS)).
Na digestão anaeróbia das lamas dos marine RAS em dois CSTRs inoculados com
microrganismos adaptados a elevada salinidade, uma operação estável foi conseguida. As
reduções da carência química de oxigénio (chemical oxygen demand (COD)) e dos sólidos
voláteis (volatile solids (VS)) foram 39.7-62.1% e 45.2-70.9%, respetivamente. A percentagem
de metano no biogás e a sua produção foram 46.1-65.6% e 0.142-0.244 l metano/g COD
introduzido, respetivamente. Os resultados do presente trabalho superaram os de
investigações anteriores, principalmente devido à obtenção de uma operação estável e uma
maior produção de metano. A taxa de produção volumétrica de metano foi superior à
tipicamente observada na digestão anaeróbia de lamas de esgotos municipais.
Estudos “bacth” mostraram que um aumento na salinidade diminuiu a SMA, a PA e a
libertação de PO43-, e também afetou a produção de EPS. Os dois solutos compatíveis testados
(betaína e trealose) aumentaram a SMA, a PA e a libertação de PO43-, e diminuíram a
quantidade produzida de EPS ligadas às células (bound EPS (bEPS)). A adição de potássio não
afetou a SMA, mas aumentou a PA, a libertação de PO43- e a produção de bEPS. O FeCl3,
testado como coagulante na primeira fase do projeto EM-MARES, não mostrou nenhum efeito
negativo na PA e na produção de EPS, e aumentou a libertação de PO43-.
Esta investigação demonstra a digestão anaeróbia usando um CSTR como uma solução
viável para a gestão de lamas provenientes dos marine RAS, contribuindo para o aumento da
sustentabilidade destes sistemas que são considerados como a melhor solução para satisfazer
o crescente consumo de espécies marinhas.
Palavras-chave: Sistemas de aquacultura marinha com recirculação; lamas; salinidade;
digestão anaeróbia; metano; fósforo; cloreto de ferro; potássio; solutos compatíveis; atividade
metanogénica especifica; fosfatase; fosfato; substâncias poliméricas extracelulares.

Anaerobic digestion of sludge from marine recirculation aquaculture systems
4

Anaerobic digestion of sludge from marine recirculation aquaculture systems
5
Acknowledgments
My biggest “thank you” goes to my colleague Xuedong Zhang. You were a great support not
only for my research, where you were essential, but you also were a friend who was always
present for all that I needed. It was really a pleasure to meet you and to work with you!
Professor Henri Spanjers, thank you for your always present supervision, for sharing your
experience and knowledge, and for all the corrections and suggestions during your supervision.
Thank you, Professor Mark van Loosdrecht, for being responsible for my exchange to the
Delft University of Technology, for helping me find this project and for the suggestions.
Finally, I would like to thank my family, girlfriend and friends for all the support.

Anaerobic digestion of sludge from marine recirculation aquaculture systems
6
Anaerobic digestion of sludge from marine recirculation aquaculture systems
7
Table of contents
1. Introduction ........................................................................................................................ 19
1.1. Marine recirculation aquaculture systems (marine RAS) and environmental threats .. 19
1.2. Emission minimization of marine aquaculture recirculation systems (EM-MARES)
project ..................................................................................................................................... 21
1.3. Anaerobic digestion ........................................................................................................ 22
1.3.1. Reasons for anaerobic digestion ............................................................................ 22
1.3.2. Chemistry and microbiology ................................................................................... 24
1.3.3. Affecting parameters ............................................................................................. 26
1.3.4. Types of anaerobic reactors ................................................................................... 29
1.3.5. Feasibility of anaerobic digestion to treat sludge from marine RAS in CSTR, to
recover phosphorus as struvite, and its bigger challenge ................................................... 31
1.4. Adaptation of anaerobic biomass to saline conditions .................................................. 32
1.5. Extracellular polymeric substances (EPS) ....................................................................... 33
1.6. Phosphatase ................................................................................................................... 34
1.7. State of the art ............................................................................................................... 35
1.7.1. Anaerobic digestion of sludge from marine RAS in CSTR ....................................... 35
1.7.2. Potassium and compatible solutes in the improvement of anaerobic digestion
under saline conditions ....................................................................................................... 36
1.7.3. EPS in the anaerobic digestion under saline conditions ......................................... 38
1.7.4. Phosphatase activity (PA) in the anaerobic digestion ............................................ 38
1.8. Incentives ....................................................................................................................... 39
1.8.1. Use of an inoculum already adapted to saline conditions to overcome the toxicity
caused by the high salinity of sludge from marine RAS ...................................................... 39
1.8.2. Study on effect of salinity, potassium, compatible solutes and ferric chloride
(FeCl3) on the anaerobic digestion of sludge from marine RAS .......................................... 39
1.8.3. SMA, PA, PO43- release and EPS as the key parameters to study the effect of
salinity, potassium, compatible solutes and FeCl3 on the anaerobic digestion of sludge
from marine RAS, according to the goals of the EM-MARES project .................................. 40
Anaerobic digestion of sludge from marine recirculation aquaculture systems
8
1.9. Objectives ....................................................................................................................... 41
1.10. Thesis Structure .............................................................................................................. 41
2. Materials and Methods ....................................................................................................... 43
2.1. Analyses .......................................................................................................................... 43
2.1.1. PA assay .................................................................................................................. 43
2.1.2. Specific methanogenic activity (SMA) assay ........................................................... 44
2.1.3. EPS assay ................................................................................................................. 47
2.1.4. Other analyses ........................................................................................................ 48
2.2. Anaerobic digestion of sludge from marine RAS in CSTR ............................................... 49
2.2.1. Inoculum and substrate sources ............................................................................. 49
2.2.2. Experimental setup ................................................................................................. 49
2.2.3. Operational conditions ........................................................................................... 52
2.3. Batch studies .................................................................................................................. 53
2.3.1. Effect of salinity on SMA, PA, PO43- release and EPS .............................................. 53
2.3.2. Effect of potassium and compatible solutes on SMA, PA, PO43- release and EPS . 53
2.3.3. Effect of FeCl3 on SMA, PA, PO43- release and EPS ................................................. 54
2.4. Processing of data .......................................................................................................... 54
3. Results and Discussion ........................................................................................................ 55
3.1. Anaerobic digestion of sludge from marine RAS in CSTR ............................................... 55
3.2. Batch Studies .................................................................................................................. 58
3.2.1. Effect of salinity on SMA, PA, PO43- release and EPS .............................................. 58
3.2.2. Effect of potassium and compatible solutes on SMA, PA, PO43- release and EPS .. 62
3.2.3. Effect of FeCl3 on SMA, PA, PO43- release and EPS ................................................. 71
4. Conclusions ......................................................................................................................... 75
4.1. Anaerobic digestion of sludge from marine RAS in CSTR ............................................... 75
4.2. Batch studies .................................................................................................................. 75
4.2.1. Effect of salinity on SMA, PA, PO43- release and EPS .............................................. 75
4.2.2. Effect of potassium and compatible solutes on SMA, PA, PO43- release and EPS .. 75
Anaerobic digestion of sludge from marine recirculation aquaculture systems
9
4.2.3. Effect of FeCl3 on SMA, PA, PO43- release and EPS ................................................. 76
4.3. Scientific and social relevance ........................................................................................ 76
4.4. Recommendations for further research ......................................................................... 76
5. References ........................................................................................................................... 77
Annex A. Calibration curve for PA determination. ...................................................................... 81
Annex B. Calibrations curves for EPS determination. ................................................................. 83
Annex C. Characterization of substrate....................................................................................... 85
Annex D. Characterization of the sludge from the reactors. ...................................................... 87
Annex E. Results of the SMA tests - Cumulative methane production used to calculate SMA. . 89

Anaerobic digestion of sludge from marine recirculation aquaculture systems
10
Anaerobic digestion of sludge from marine recirculation aquaculture systems
11
List of figures
Figure 1. World fish utilization and supply. ................................................................................. 19
Figure 2. Scheme of a marine RAS. ............................................................................................. 20
Figure 3. Scheme of marine RAS and proposed treatment method for the backwash water and
sludge in the EM-MARES project. ............................................................................................... 21
Figure 4. Stages of anaerobic digestion.. .................................................................................... 24
Figure 5. General effect of salts on biological reactions. ............................................................ 28
Figure 6. Schemes of CSTR with (B) and without (A) settler. ...................................................... 29
Figure 7. Scheme of a UASB reactor............................................................................................ 30
Figure 8. Schemes of AnMBR with submerge membrane (A) and with external membrane (B).
..................................................................................................................................................... 30
Figure 9. Four steps of a ASBR operation. ................................................................................... 31
Figure 10. Strategies used for microorganisms to survive under high osmotic pressure. .......... 32
Figure 11. Different forms of EPS ................................................................................................ 33
Figure 12. Scheme evidencing the relation between phosphatase and struvite formation. ..... 34
Figure 13. Mechanism of the method used for PA determination ............................................. 43
Figure 14. Scheme of PA assay. ................................................................................................... 44
Figure 15. Instrument setup for the SMA assay. ......................................................................... 45
Figure 16. Procedure for bEPS and SMP extraction. ................................................................... 47
Figure 17. Scheme of the experimental setup of the reactor R1. ............................................... 50
Figure 18. Scheme of the experimental setup of the reactor R2. ............................................... 51
Figure 19. Photo of the experimental setup used in this research. ............................................ 51
Figure 20. Photo of the reactor R1 (left) and reactor R2 (right). ................................................ 52
Figure 21. Chemical structures of the two compatible solutes tested. ...................................... 53
Figure 22. OLR and SRT of the two anaerobic CSTRs used to treat the sludge from marine RAS
during the experimental period. ................................................................................................. 55
Anaerobic digestion of sludge from marine recirculation aquaculture systems
12
Figure 23. pH of the two anaerobic CSTRs used to treat the sludge from marine RAS during the
experimental period. ................................................................................................................... 55
Figure 24. COD removal efficiency of the two anaerobic CSTRs used to treat the sludge from
marine RAS during the experimental period. ............................................................................. 56
Figure 25. Solids removal efficiency of the two anaerobic CSTRs used to treat the sludge from
marine RAS during the experimental period. ............................................................................. 56
Figure 26. Methane percentage in biogas and production of the two anaerobic CSTRs used to
treat the sludge from marine RAS during the experimental period. .......................................... 56
Figure 27. Effect of salinity of SMA. ............................................................................................ 58
Figure 28. Effect of salinity on PA. .............................................................................................. 59
Figure 29. Effect of salinity on PO43- release. .............................................................................. 60
Figure 30. Effect of salinity on SMP............................................................................................. 61
Figure 31. Effect of salinity on bEPS. ........................................................................................... 61
Figure 32. Effect of potassium and betaine on SMA. .................................................................. 62
Figure 33. Effect of potassium and betaine on SMA. .................................................................. 62
Figure 34. Effect of betaine on PA. .............................................................................................. 64
Figure 35. Effect of trehalose on PA. ........................................................................................... 64
Figure 36. Effect of potassium on PA. ......................................................................................... 65
Figure 37. Effect of betaine on PO43- release. ............................................................................. 66
Figure 38. Effect of trehalose on PO43- release. .......................................................................... 66
Figure 39. Effect of potassium on PO43- release. ......................................................................... 67
Figure 40. Effect of betaine on SMP. ........................................................................................... 68
Figure 41. Effect of trehalose on SMP. ........................................................................................ 68
Figure 42. Effect of potassium on SMP. ...................................................................................... 69
Figure 43. Effect of betaine on bEPS. .......................................................................................... 69
Figure 44. Effect of trehalose on bEPS. ....................................................................................... 70
Figure 45. Effect of potassium on bEPS. ...................................................................................... 70
Anaerobic digestion of sludge from marine recirculation aquaculture systems
13
Figure 46. Effect of FeCl3 on SMA. ............................................................................................... 71
Figure 47. Effect of FeCl3 on PA. .................................................................................................. 72
Figure 48. Effect of FeCl3 on PO43- release. ................................................................................. 73
Figure 49. Effect of FeCl3 on SMP. ............................................................................................... 74
Figure 50. Effect of FeCl3 on bEPS. .............................................................................................. 74
Figure 51. Calibration curve used for PA determination. ........................................................... 81
Figure 52. Calibration curve used for proteins determination. .................................................. 83
Figure 53. Calibration curve used for proteins determination. .................................................. 83
Figure 54. Cumulative methane production from the effect of salinity on SMA.. ...................... 89
Figure 55. Cumulative methane production from the effect of betaine and/or potassium on
SMA. ............................................................................................................................................ 89
Figure 56. Cumulative methane production from the effect of trehalose and/or potassium on
SMA. ............................................................................................................................................ 90
Figure 57. Cumulative methane production from the effect of FeCl3 on SMA. .......................... 90

Anaerobic digestion of sludge from marine recirculation aquaculture systems
14
Anaerobic digestion of sludge from marine recirculation aquaculture systems
15
List of tables
Table 1. Energy balance for aerobic and anaerobic processes for the treatment of a wastewater
..................................................................................................................................................... 23
Table 2. Advantages and disadvantages of anaerobic digestion compared to aerobic digestion.
..................................................................................................................................................... 23
Table 3. Temperature regimes practiced in the anaerobic digestion ......................................... 26
Table 4. Toxic inorganic compounds for the anaerobic digestion .............................................. 28
Table 5. Toxic organic compounds for the anaerobic digestion ................................................ 29
Table 6. Operational conditions of anaerobic digestion systems used to treat sludge from
marine RAS in CSTR. .................................................................................................................... 35
Table 7. Performance the CSTRs on the anaerobic digestion to treat sludge from marine RAS. 35
Table 8. Characteristics of the anaerobic reactors used for PA study ........................................ 39
Table 9. Dosages and constituents of phosphate buffer, macronutrients and trace elements
used on the SMA assay. .............................................................................................................. 46
Table 10. Reagent used for proteins and humic susbtances determination. ............................. 48
Table 11. Characteristics of the substrate used in this research. ............................................... 49
Table 12. Operational conditions of the two lab-scale reactors. ................................................ 52
Table 13. Concentration and combination of the different compounds tested to study the
effect of potassium and compatible solutes on SMA, PO43- release, PA and EPS. ...................... 54
Table 14. Operational conditions and performance of the reactors in the present study
together with values from previous studies dealing with anaerobic digestion of sludge from
marine RAS in CSTR and typical values for anaerobic digestion of sewage sludge in CSTR. ...... 57
Table 15. Characterization of the substrate in each time it was collect at the fish farm, the
period when it was utilized and the reactor(s) where it was used. ............................................ 85
Table 16. Results of all the characterization of the sludge from reactor R1. .............................. 87
Table 17. Results of all the characterization of the sludge from reactor R2. .............................. 88

Anaerobic digestion of sludge from marine recirculation aquaculture systems
16
Anaerobic digestion of sludge from marine recirculation aquaculture systems
17
List of abbreviations
AMPTS II - Automatic Methane Potential Test System II
AnMBR - Anaerobic Membrane Bioreactor
ASBR - Anaerobic Sequential Batch Reactor
bEPS - bound Extracellular Polymeric Substances
BFBR - Buoyant Filter Bio-Reactor
BSA - Bovine Serum Albumin
COD - Chemical Oxygen Demand
CSTR - Continuous Stirred Tank Reactor
DIRB - Dissimilatory Iron-Reducing Bacteria
EC - Electrical Conductivity
EM-MARES - Emission Minimization of Marine Aquaculture Systems
EPS - Extracellular Polymeric Substances
FBR - Fed Batch Reactor
LCFA - Long Chain Fatty Acids
MLSS - Mixed Liquor Suspend Solids
OLR - Organic Loading Rate
PA - Phosphatase Activity
p-NP - p-nitrophenol
p-NPP - p-nitrophenylphosphate
RAS - Recirculation Aquaculture Systems
SAMBR - Submerged Anaerobic Membrane Bioreactor
sCOD - soluble Chemical Oxygen Demand
sEPS - soluble Extracellular Polymeric Substances
SMA - Specific Methanogenic Activity
Anaerobic digestion of sludge from marine recirculation aquaculture systems
18
SMP - Soluble Microbial Products
SRB - Sulfate Reducing Bacteria
SRT - Solids Retention Time
STP - Standard conditions of Temperature and Pressure
tCOD - total Chemical Oxygen Demand
TN - Total Nitrogen
TP - Total Phosphorus
TS - Total Solids
TSS - Total Suspended Solids
UASB - Upflow Anaerobic Sludge Blanket
VFA - Volatile Fatty Acids
VS - Volatile Solids
VSS - Volatile Suspended Solids
WSP - Water Stabilization pound
WWTP - Wastewater Treatment Plant
Anaerobic digestion of sludge from marine recirculation aquaculture systems
19
1. Introduction
1.1. Marine recirculation aquaculture systems (marine RAS) and
environmental threats
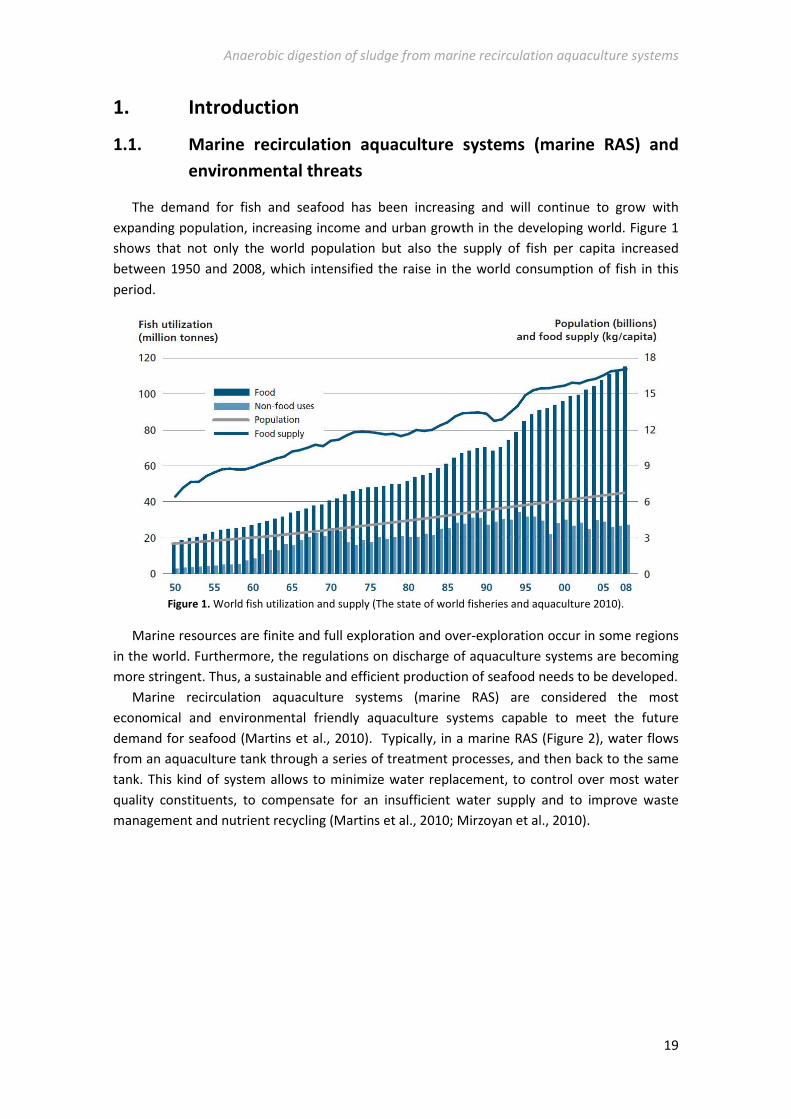
The demand for fish and seafood has been increasing and will continue to grow with
expanding population, increasing income and urban growth in the developing world. Figure 1
shows that not only the world population but also the supply of fish per capita increased
between 1950 and 2008, which intensified the raise in the world consumption of fish in this
period.
Figure 1. World fish utilization and supply (The state of world fisheries and aquaculture 2010).
Marine resources are finite and full exploration and over-exploration occur in some regions
in the world. Furthermore, the regulations on discharge of aquaculture systems are becoming
more stringent. Thus, a sustainable and efficient production of seafood needs to be developed.
Marine recirculation aquaculture systems (marine RAS) are considered the most
economical and environmental friendly aquaculture systems capable to meet the future
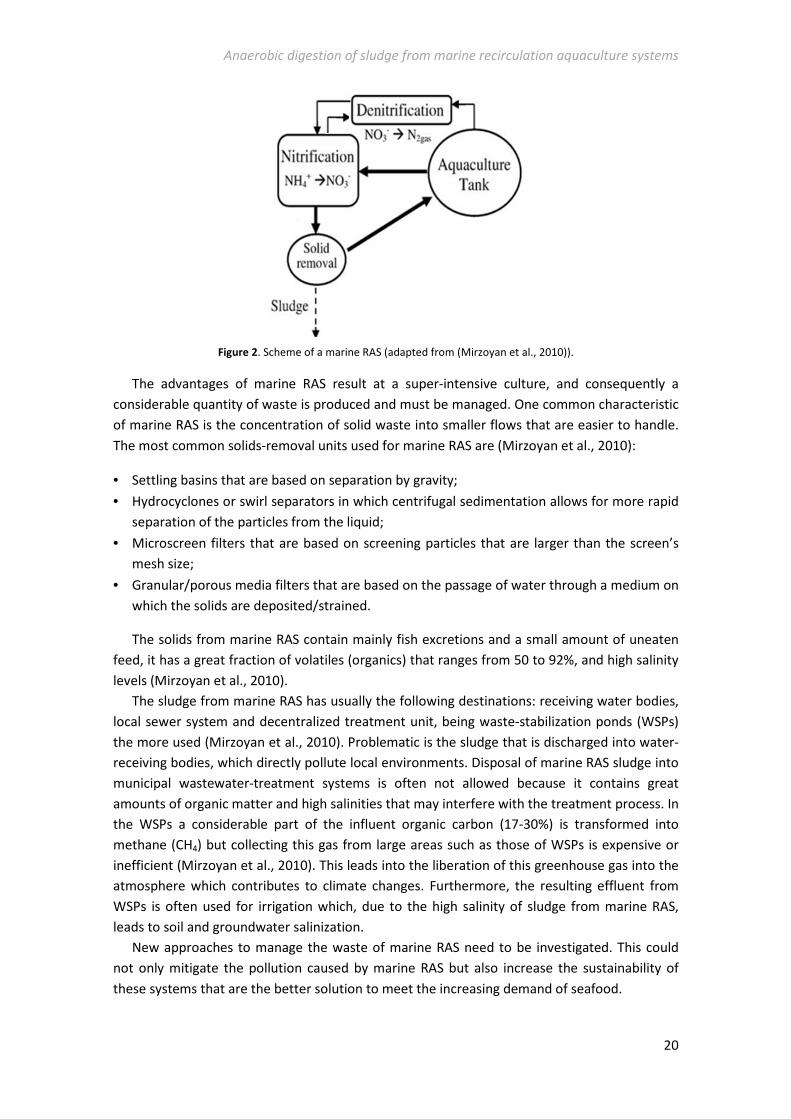
demand for seafood (Martins et al., 2010). Typically, in a marine RAS (Figure 2), water flows
from an aquaculture tank through a series of treatment processes, and then back to the same
tank. This kind of system allows to minimize water replacement, to control over most water
quality constituents, to compensate for an insufficient water supply and to improve waste
management and nutrient recycling (Martins et al., 2010; Mirzoyan et al., 2010).
Anaerobic digestion of sludge from marine recirculation aquaculture systems
20
Figure 2. Scheme of a marine RAS (adapted from (Mirzoyan et al., 2010)).
The advantages of marine RAS result at a super-intensive culture, and consequently a
considerable quantity of waste is produced and must be managed. One common characteristic
of marine RAS is the concentration of solid waste into smaller flows that are easier to handle.
The most common solids-removal units used for marine RAS are (Mirzoyan et al., 2010):
• Settling basins that are based on separation by gravity;
• Hydrocyclones or swirl separators in which centrifugal sedimentation allows for more rapid
separation of the particles from the liquid;
• Microscreen filters that are based on screening particles that are larger than the screen’s
mesh size;
• Granular/porous media filters that are based on the passage of water through a medium on
which the solids are deposited/strained.
The solids from marine RAS contain mainly fish excretions and a small amount of uneaten
feed, it has a great fraction of volatiles (organics) that ranges from 50 to 92%, and high salinity
levels (Mirzoyan et al., 2010).
The sludge from marine RAS has usually the following destinations: receiving water bodies,
local sewer system and decentralized treatment unit, being waste-stabilization ponds (WSPs)
the more used (Mirzoyan et al., 2010). Problematic is the sludge that is discharged into water-
receiving bodies, which directly pollute local environments. Disposal of marine RAS sludge into
municipal wastewater-treatment systems is often not allowed because it contains great
amounts of organic matter and high salinities that may interfere with the treatment process. In
the WSPs a considerable part of the influent organic carbon (17-30%) is transformed into
methane (CH4) but collecting this gas from large areas such as those of WSPs is expensive or
inefficient (Mirzoyan et al., 2010). This leads into the liberation of this greenhouse gas into the
atmosphere which contributes to climate changes. Furthermore, the resulting effluent from
WSPs is often used for irrigation which, due to the high salinity of sludge from marine RAS,
leads to soil and groundwater salinization.
New approaches to manage the waste of marine RAS need to be investigated. This could
not only mitigate the pollution caused by marine RAS but also increase the sustainability of
these systems that are the better solution to meet the increasing demand of seafood.
Anaerobic digestion of sludge from marine recirculation aquaculture systems
21
1.2. Emission minimization of marine aquaculture recirculation
systems (EM-MARES) project
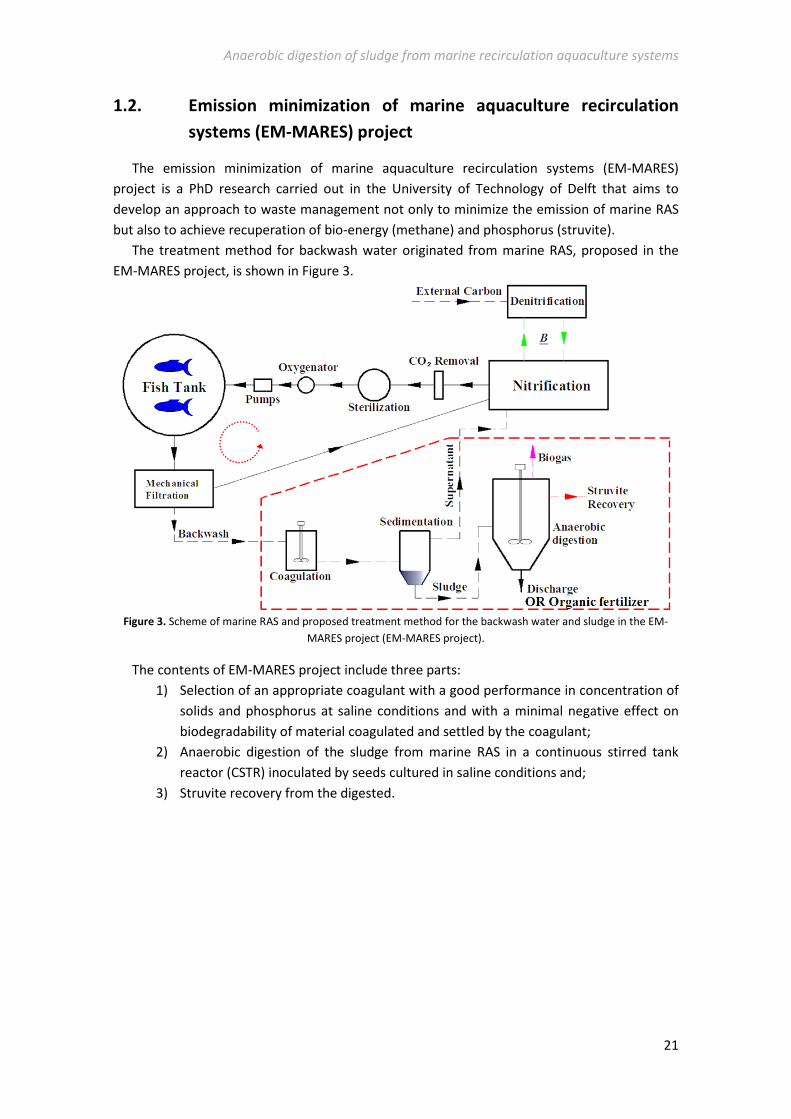
The emission minimization of marine aquaculture recirculation systems (EM-MARES)
project is a PhD research carried out in the University of Technology of Delft that aims to
develop an approach to waste management not only to minimize the emission of marine RAS
but also to achieve recuperation of bio-energy (methane) and phosphorus (struvite).
The treatment method for backwash water originated from marine RAS, proposed in the
EM-MARES project, is shown in Figure 3.
Figure 3. Scheme of marine RAS and proposed treatment method for the backwash water and sludge in the EM-
MARES project (EM-MARES project).
The contents of EM-MARES project include three parts:
1) Selection of an appropriate coagulant with a good performance in concentration of
solids and phosphorus at saline conditions and with a minimal negative effect on
biodegradability of material coagulated and settled by the coagulant;
2) Anaerobic digestion of the sludge from marine RAS in a continuous stirred tank
reactor (CSTR) inoculated by seeds cultured in saline conditions and;
3) Struvite recovery from the digested.
Anaerobic digestion of sludge from marine recirculation aquaculture systems
22
1.3. Anaerobic digestion
1.3.1. Reasons for anaerobic digestion
The interest on anaerobic digestion can be explained by considering its advantages and
disadvantages, and it can be best indicated by comparing this process with aerobic digestion.
In the aerobic digestion the waste is mixed with large quantities of microorganisms and air.
Microorganisms use the organic matter for substrate, and use the oxygen in the air to oxidize a
portion of this substrate to carbon dioxide and water for energy (McCarty, 1964a). In
anaerobic digestion, the waste is also mixed with large quantities of microorganisms but
without addition of air. Under these conditions, bacteria grow which are capable of converting
the organic waste into carbon dioxide (CO2) and methane gases (biogas).
In the aerobic digestion, since the microorganisms obtain more energy from the use of
oxygen, their growth is fast and a great portion of the organic waste is converted into new
cells. The waste converted into cells is not fully stabilized, but is only changed in form
(McCarty, 1964a). These cells can be removed from the waste stream but the biological sludge
still presents a significant disposal problem. In fact, anaerobic digestion is one of the most used
disposal routes for the biological sludge produced by the aerobic digestion in municipal
wastewater treatment plants (WWTPs) (Appels et al., 2008). In anaerobic digestion, conversion
to methane gas requires relatively little energy to the microorganisms. Thus their rate of
growth is slow and only a small portion of the waste is converted into new cells, being the
major portion of the degradable waste converted into methane and, since this gas is insoluble
and escapes from the waste, this conversion really represents waste stabilization. As much as
80 to 90% of the degradable organic matter for the waste can be removed in anaerobic
digestion in contrast to aerobic digestion, where only about 50% is actually removed (McCarty,
1964a).
Due to the slow growth of the cells in the anaerobic digestion, the sludge produced in the
anaerobic digestion is 6 to 8 times less than that produced in the aerobic digestion, which
greatly reduces its processing and disposal costs (Metcalf & Eddy, 2003). In addition, since less
biomass is produced, less nutrients are needed for the anaerobic digestion (Metcalf & Eddy,
2003). This is especially important in the treatment of industrial wastes which lack sufficient
nutrients.
Since anaerobic digestion does not require oxygen, treatment rates are not limited by
oxygen transfer. This reduces power requirements for digestion because there is no need for
aeration. Besides that, the methane produced can be collected and burned to carbon dioxide
and water for heat. This fuel is frequently used for heating buildings, running engines and
producing electricity (McCarty, 1964a). The no need of oxygen and methane production
outweigh the need of relatively high temperatures (at least 30 °C) for optimum operation in
the anaerobic digestion, as indicated in Table 1.
Anaerobic digestion of sludge from marine recirculation aquaculture systems
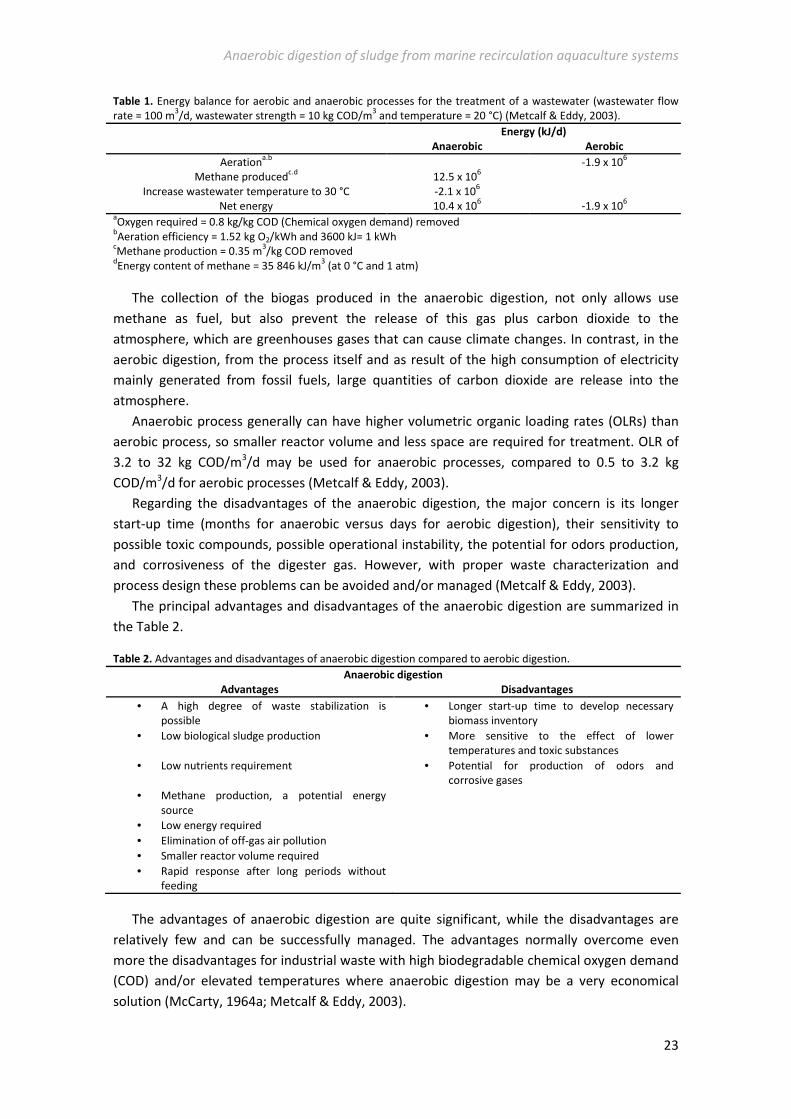
23
Table 1. Energy balance for aerobic and anaerobic processes for the treatment of a wastewater (wastewater flow
rate = 100 m3/d, wastewater strength = 10 kg COD/m
3 and temperature = 20 °C) (Metcalf & Eddy, 2003).
Energy (kJ/d)
Anaerobic Aerobic
Aerationa.b
-1.9 x 10⁶
Methane producedc.d
12.5 x 10⁶
Increase wastewater temperature to 30 °C -2.1 x 10⁶
Net energy 10.4 x 10⁶ -1.9 x 10
6
aOxygen required = 0.8 kg/kg COD (Chemical oxygen demand) removed
bAeration efficiency = 1.52 kg O2/kWh and 3600 kJ= 1 kWh
cMethane production = 0.35 m
3/kg COD removed
dEnergy content of methane = 35 846 kJ/m
3 (at 0 °C and 1 atm)
The collection of the biogas produced in the anaerobic digestion, not only allows use
methane as fuel, but also prevent the release of this gas plus carbon dioxide to the
atmosphere, which are greenhouses gases that can cause climate changes. In contrast, in the
aerobic digestion, from the process itself and as result of the high consumption of electricity
mainly generated from fossil fuels, large quantities of carbon dioxide are release into the
atmosphere.
Anaerobic process generally can have higher volumetric organic loading rates (OLRs) than
aerobic process, so smaller reactor volume and less space are required for treatment. OLR of
3.2 to 32 kg COD/m3/d may be used for anaerobic processes, compared to 0.5 to 3.2 kg
COD/m3/d for aerobic processes (Metcalf & Eddy, 2003).
Regarding the disadvantages of the anaerobic digestion, the major concern is its longer
start-up time (months for anaerobic versus days for aerobic digestion), their sensitivity to
possible toxic compounds, possible operational instability, the potential for odors production,
and corrosiveness of the digester gas. However, with proper waste characterization and
process design these problems can be avoided and/or managed (Metcalf & Eddy, 2003).
The principal advantages and disadvantages of the anaerobic digestion are summarized in
the Table 2.
Table 2. Advantages and disadvantages of anaerobic digestion compared to aerobic digestion.
Anaerobic digestion
Advantages Disadvantages
• A high degree of waste stabilization is
possible
• Longer start-up time to develop necessary
biomass inventory
• Low biological sludge production • More sensitive to the effect of lower
temperatures and toxic substances
• Low nutrients requirement • Potential for production of odors and
corrosive gases
• Methane production, a potential energy
source
• Low energy required
• Elimination of off-gas air pollution
• Smaller reactor volume required
• Rapid response after long periods without
feeding
The advantages of anaerobic digestion are quite significant, while the disadvantages are
relatively few and can be successfully managed. The advantages normally overcome even
more the disadvantages for industrial waste with high biodegradable chemical oxygen demand
(COD) and/or elevated temperatures where anaerobic digestion may be a very economical
solution (McCarty, 1964a; Metcalf & Eddy, 2003).
Anaerobic digestion of sludge from marine recirculation aquaculture systems
24
1.3.2. Chemistry and microbiology
Anaerobic digestion is a complex process which requires strict anaerobic conditions to
proceed, and depends on the coordinated activity of a complex microbial association to
transform organic material into methane. The chemical and microbiological aspects of
anaerobic digestion are dealt with more deeply with in specialized literature (Gerardi, 2003;
Gujer and Zehnder, 1983; Khanal, 2008; McCarty, 1964a).
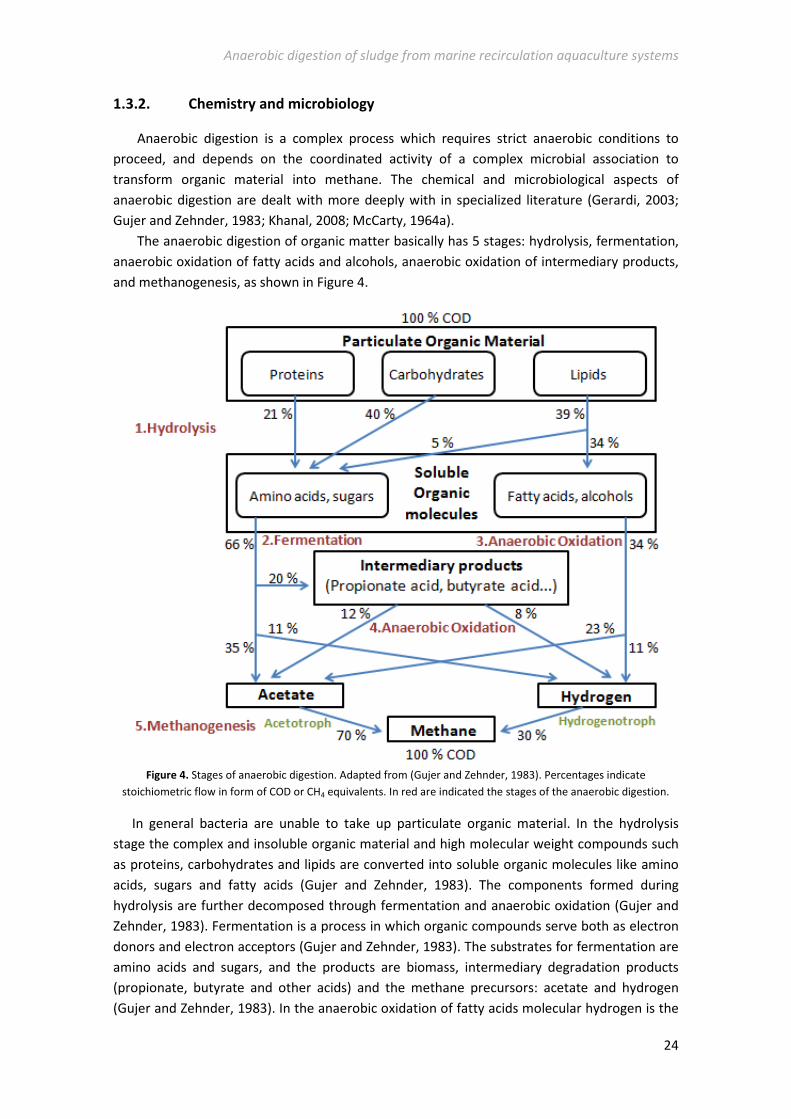
The anaerobic digestion of organic matter basically has 5 stages: hydrolysis, fermentation,
anaerobic oxidation of fatty acids and alcohols, anaerobic oxidation of intermediary products,
and methanogenesis, as shown in Figure 4.
Figure 4. Stages of anaerobic digestion. Adapted from (Gujer and Zehnder, 1983). Percentages indicate
stoichiometric flow in form of COD or CH4 equivalents. In red are indicated the stages of the anaerobic digestion.
In general bacteria are unable to take up particulate organic material. In the hydrolysis
stage the complex and insoluble organic material and high molecular weight compounds such
as proteins, carbohydrates and lipids are converted into soluble organic molecules like amino
acids, sugars and fatty acids (Gujer and Zehnder, 1983). The components formed during
hydrolysis are further decomposed through fermentation and anaerobic oxidation (Gujer and
Zehnder, 1983). Fermentation is a process in which organic compounds serve both as electron
donors and electron acceptors (Gujer and Zehnder, 1983). The substrates for fermentation are
amino acids and sugars, and the products are biomass, intermediary degradation products
(propionate, butyrate and other acids) and the methane precursors: acetate and hydrogen
(Gujer and Zehnder, 1983). In the anaerobic oxidation of fatty acids molecular hydrogen is the
Anaerobic digestion of sludge from marine recirculation aquaculture systems
25
main sink for electrons. In this process fatty acids are converted into hydrogen and, in contrast
to the fermentation, elevated partial pressures of it can inhibit this process. The fourth stage
of anaerobic digestion is the anaerobic oxidation of the intermediary products into acetate and
hydrogen. No waste stabilization occurs during the firsts four stages of the anaerobic digestion
but they are required to convert the organic matter into a form suitable for the last stage of
digestion. Because the main products of these first stages are acids, the group of bacteria
responsible for these processes are commonly called “acid formers” (McCarty, 1964a). It is in
last stage of the anaerobic digestion, methanogenesis, that real waste stabilization occurs, and
it is directly related to methane production. Acetate and hydrogen are used by a special group
of bacteria termed “methanogens” to produce methane. The methanogenesis from acetate,
which is responsible for about 70% of the methane produced, called acetotrophic
methanogenesis, and from hydrogen, which is called hydrogenotrophic methanogenesis,
follow the reactions, respectively (Gerardi, 2003):
������� →��� + ��(1) �� + 4� →��� + 2��(2)
The most important methanogens, those which use acetate as substrate, grow quite slowly.
Their slow growth and low rate of acid utilization normally represents the limiting step of the
anaerobic digestion (McCarty, 1964a). The rate at which these methanogens utilize their
substrates to produce methane is called specific methanogenic activity (SMA) (Isa et al., 1993).
The assessment of SMA can be used to investigate the anaerobic reactors performance and
the effect of different variables like stimulants/toxicants and environmental conditions on
anaerobic bacteria, and to test the biodegradability and adaptability of particular wastes (Isa et
al., 1993).
The quantity of methane produced in the anaerobic digestion can be predicted through two
different ways. If the composition of the substrate is known and the entire substrate is
converted to gas, the theoretical methane yield can be calculated from the following equation
(Gujer and Zehnder, 1983):
������ +�� −�4 −�2��� →��2 −�8 −�4� ��� +��2 −�8 −�4���(3)
From this formula, it can be shown that the ultimate oxygen demand of the waste being
degraded is equal to the ultimate oxygen demand of the methane gas produced. This fact
allows prediction of methane production in another way, that is, from an estimate of waste
stabilization (COD removal). The ultimate oxygen demand of methane gas is as follows
(McCarty, 1964a):
��� + 2� → �� + 2��(4) This equation shows that one mol of methane is equivalent with two moles of oxygen.
Converting to liters of methane per gram of oxygen, the relationship between waste
stabilization and methane production, in the standard conditions of temperature and pressure
(STP), is:
1�������� �! = 0.35&��'ℎ���()*+)(5)
Anaerobic digestion of sludge from marine recirculation aquaculture systems
26
The prediction of the methane production it is very important for the analysis of the feasibility
of anaerobic digestion. It can also be used to give a rapid measurement of actual waste
stabilization and to permit closely following the efficiency of digestion and the collection of
biogas (McCarty, 1964a).
1.3.3. Affecting parameters
The methanogens, which are responsible for the waste stabilization in the anaerobic
digestion, grow quite slowly compared to aerobic organisms and so a longer time is required
for them to adjust to changes in their environmental. For this reason, there are some
environmental requirements for optimum operation of anaerobic digestion in order to obtain
a more efficient process. The most important affecting parameters to the anaerobic digestion
are discussed below.
1.3.3.1. Temperature
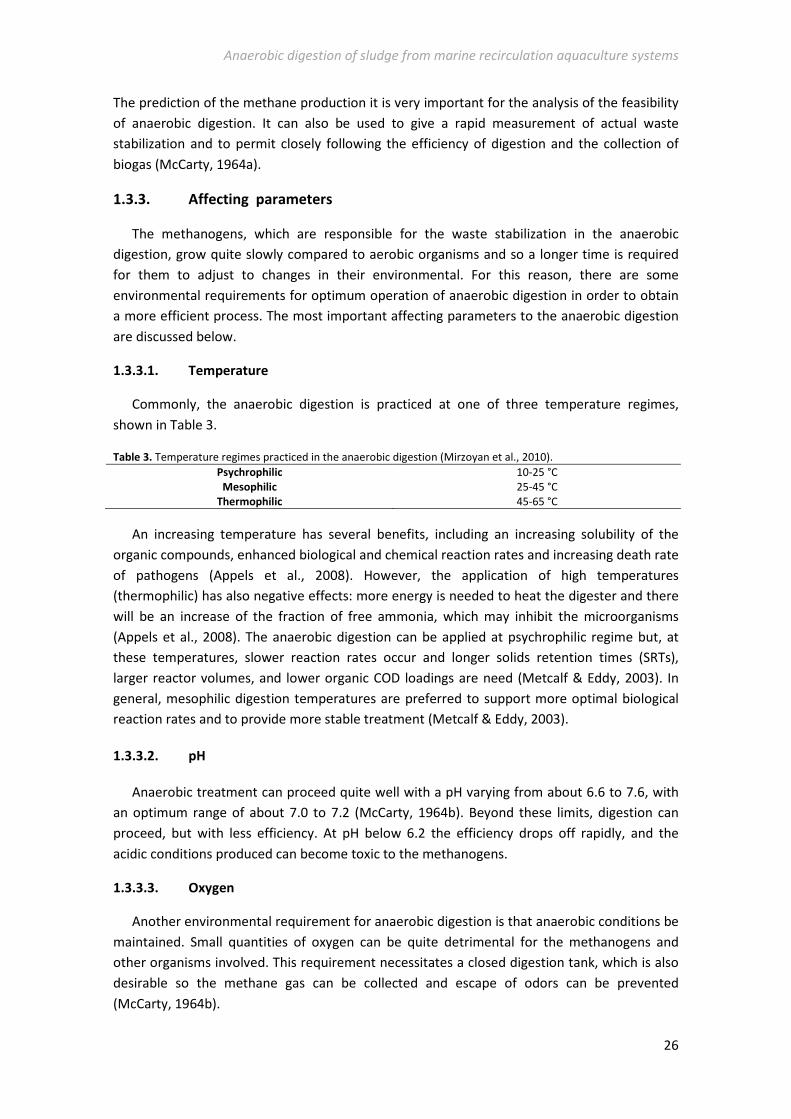
Commonly, the anaerobic digestion is practiced at one of three temperature regimes,
shown in Table 3.
Table 3. Temperature regimes practiced in the anaerobic digestion (Mirzoyan et al., 2010).
Psychrophilic 10-25 °C
Mesophilic 25-45 °C
Thermophilic 45-65 °C
An increasing temperature has several benefits, including an increasing solubility of the
organic compounds, enhanced biological and chemical reaction rates and increasing death rate
of pathogens (Appels et al., 2008). However, the application of high temperatures
(thermophilic) has also negative effects: more energy is needed to heat the digester and there
will be an increase of the fraction of free ammonia, which may inhibit the microorganisms
(Appels et al., 2008). The anaerobic digestion can be applied at psychrophilic regime but, at
these temperatures, slower reaction rates occur and longer solids retention times (SRTs),
larger reactor volumes, and lower organic COD loadings are need (Metcalf & Eddy, 2003). In
general, mesophilic digestion temperatures are preferred to support more optimal biological
reaction rates and to provide more stable treatment (Metcalf & Eddy, 2003).
1.3.3.2. pH
Anaerobic treatment can proceed quite well with a pH varying from about 6.6 to 7.6, with
an optimum range of about 7.0 to 7.2 (McCarty, 1964b). Beyond these limits, digestion can
proceed, but with less efficiency. At pH below 6.2 the efficiency drops off rapidly, and the
acidic conditions produced can become toxic to the methanogens.
1.3.3.3. Oxygen
Another environmental requirement for anaerobic digestion is that anaerobic conditions be
maintained. Small quantities of oxygen can be quite detrimental for the methanogens and
other organisms involved. This requirement necessitates a closed digestion tank, which is also
desirable so the methane gas can be collected and escape of odors can be prevented
(McCarty, 1964b).
Anaerobic digestion of sludge from marine recirculation aquaculture systems
27
1.3.3.4. Nutrients
The anaerobic process is dependent upon bacteria, which require nitrogen, phosphorus and
other materials in trace quantities for optimum growth. Domestic waste normally contains a
variety of these materials, and thus usually provides an ideal environment for the
microorganisms. However, some industrial wastes are frequently more specific on composition
and biological nutrients may lack, thus nutrients must be added for the optimum operation.
1.3.3.5. Solids retention time (SRT)
The solids retention time (SRT) is the average time the solids spend in the digester. The
subsequent stages of the digestion process are directly related to the SRT. A decrease in the
SRT decreases the extent of the reactions, and vice versa. Each time the sludge is discharged, a
fraction of the bacterial population is removed thus implying that the cell growth must at least
compensate the cell removal to ensure steady state and avoid process failure (Appels et al.,
2008). In general, SRT range for effective anaerobic digestion is 10 to 60 days, being the higher
SRTs required for lower temperatures (Appels et al., 2008).
1.3.3.6. Organic loading rate (OLR)
Organic loading rate (OLR) is defined as the application of soluble and particulate organic
matter. It is typically expressed in mass of COD per volume of the reactor and per day. With
very high ORLs the methanogens in the digester may not be able to degrade all the acids
formed in the previous stages of anaerobic digestion, the acids formed will accumulate and the
pH will drop to lower levels which cause a failure of the process. With very low ORLs only a
small volume of methane per volume of reactor is produced making the process economically
not feasible. OLRs of 3.2 to 32 kg COD/m3.d may be used for anaerobic process (Metcalf &
Eddy, 2003).
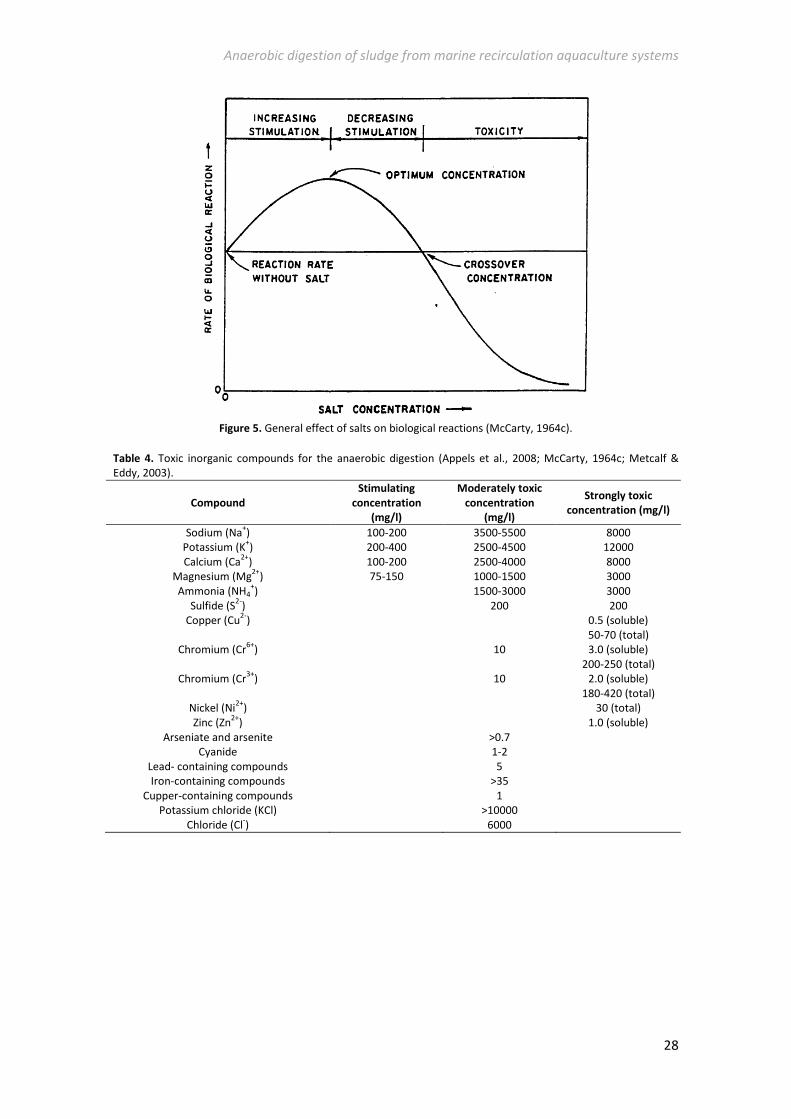
1.3.3.7. Toxic materials
There are many materials, both organic and inorganic, which may be toxic to the anaerobic
digestion. The concentration at which a material becomes toxic may vary from a fraction of
mg/l to several thousand mg/l. Some of these materials, as salts, at some very low
concentration stimulate the biological activity, but at very high concentrations are toxic for the
microorganisms (Figure 5). Tables 4 and 5 present some toxic inorganic and organic
compounds of concern for anaerobic digestion, respectively.
Anaerobic digestion of sludge from marine recirculation aquaculture systems
28
Figure 5. General effect of salts on biological reactions (McCarty, 1964c).
Table 4. Toxic inorganic compounds for the anaerobic digestion (Appels et al., 2008; McCarty, 1964c; Metcalf &
Eddy, 2003).
Compound
Stimulating
concentration
(mg/l)
Moderately toxic
concentration
(mg/l)
Strongly toxic
concentration (mg/l)
Sodium (Na+) 100-200 3500-5500 8000
Potassium (K+) 200-400 2500-4500 12000
Calcium (Ca2+
) 100-200 2500-4000 8000
Magnesium (Mg2+
) 75-150 1000-1500 3000
Ammonia (NH4+) 1500-3000 3000
Sulfide (S2-
) 200 200
Copper (Cu2-
) 0.5 (soluble)
50-70 (total)
Chromium (Cr6+
) 10 3.0 (soluble)
200-250 (total)
Chromium (Cr3+
) 10 2.0 (soluble)
180-420 (total)
Nickel (Ni2+
) 30 (total)
Zinc (Zn2+
) 1.0 (soluble)
Arseniate and arsenite >0.7
Cyanide 1-2
Lead- containing compounds 5
Iron-containing compounds >35
Cupper-containing compounds 1
Potassium chloride (KCl) >10000
Chloride (Cl-) 6000
Anaerobic digestion of sludge from marine recirculation aquaculture systems
29
Table 5. Toxic organic compounds for the anaerobic digestion (Appels et al., 2008).
Compound Concentration resulting in 50 % reduction in activity
(mM)
1-Chloropropene 0.1
Nitrobenzene 0.1
Acrolei 0.2
1-Chloroporpane 1.9
Formaldehyde 2.4
Lauric acid 2.6
Ethyl Benzene 3.2
Acrylanitrile 4
3-Chlorol-1,2-propanedial 6
Crotonaldehyde 6.5
2-Chloropropionic acid 8
Vinyl acetate 8
Acetaldehyde 10
Ethyl acetate 11
Acrylic acid 12
Catechol 24
Phenol 26
Aniline 26
Resorcinol 29
Propanol 90
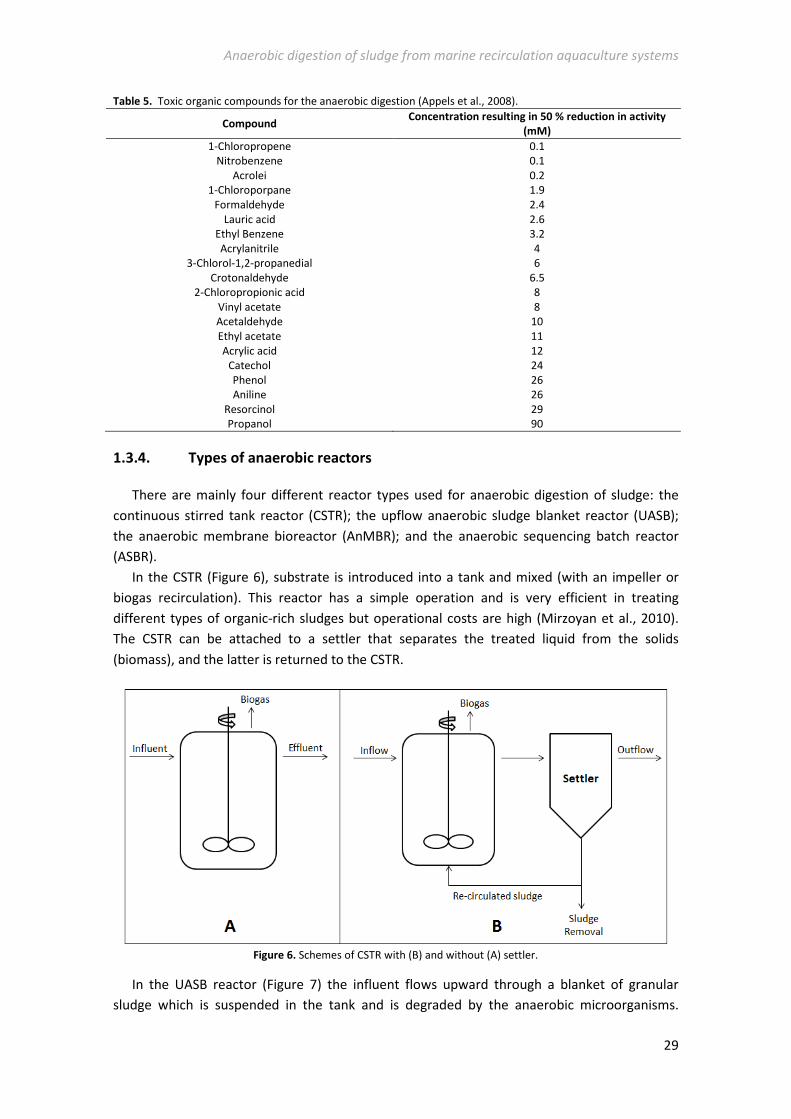
1.3.4. Types of anaerobic reactors
There are mainly four different reactor types used for anaerobic digestion of sludge: the
continuous stirred tank reactor (CSTR); the upflow anaerobic sludge blanket reactor (UASB);
the anaerobic membrane bioreactor (AnMBR); and the anaerobic sequencing batch reactor
(ASBR).
In the CSTR (Figure 6), substrate is introduced into a tank and mixed (with an impeller or
biogas recirculation). This reactor has a simple operation and is very efficient in treating
different types of organic-rich sludges but operational costs are high (Mirzoyan et al., 2010).
The CSTR can be attached to a settler that separates the treated liquid from the solids
(biomass), and the latter is returned to the CSTR.
Figure 6. Schemes of CSTR with (B) and without (A) settler.
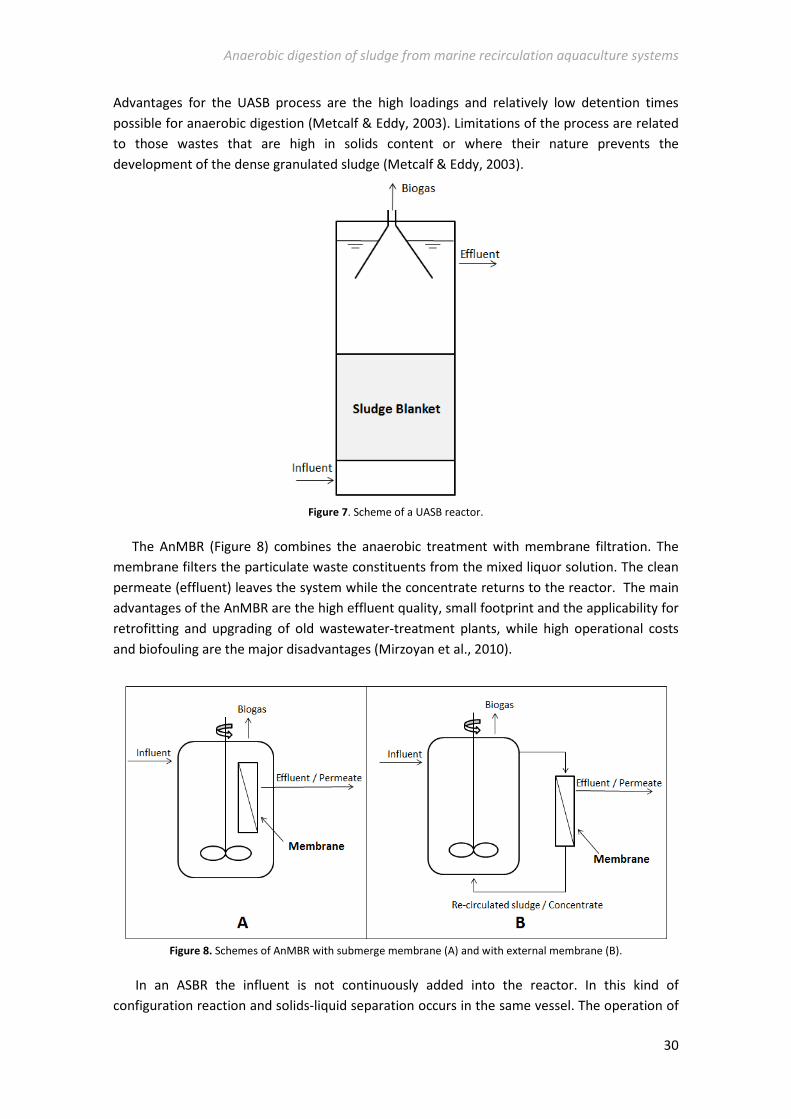
In the UASB reactor (Figure 7) the influent flows upward through a blanket of granular
sludge which is suspended in the tank and is degraded by the anaerobic microorganisms.
Anaerobic digestion of sludge from marine recirculation aquaculture systems
30
Advantages for the UASB process are the high loadings and relatively low detention times
possible for anaerobic digestion (Metcalf & Eddy, 2003). Limitations of the process are related
to those wastes that are high in solids content or where their nature prevents the
development of the dense granulated sludge (Metcalf & Eddy, 2003).
Figure 7. Scheme of a UASB reactor.
The AnMBR (Figure 8) combines the anaerobic treatment with membrane filtration. The
membrane filters the particulate waste constituents from the mixed liquor solution. The clean
permeate (effluent) leaves the system while the concentrate returns to the reactor. The main
advantages of the AnMBR are the high effluent quality, small footprint and the applicability for
retrofitting and upgrading of old wastewater-treatment plants, while high operational costs
and biofouling are the major disadvantages (Mirzoyan et al., 2010).
Figure 8. Schemes of AnMBR with submerge membrane (A) and with external membrane (B).
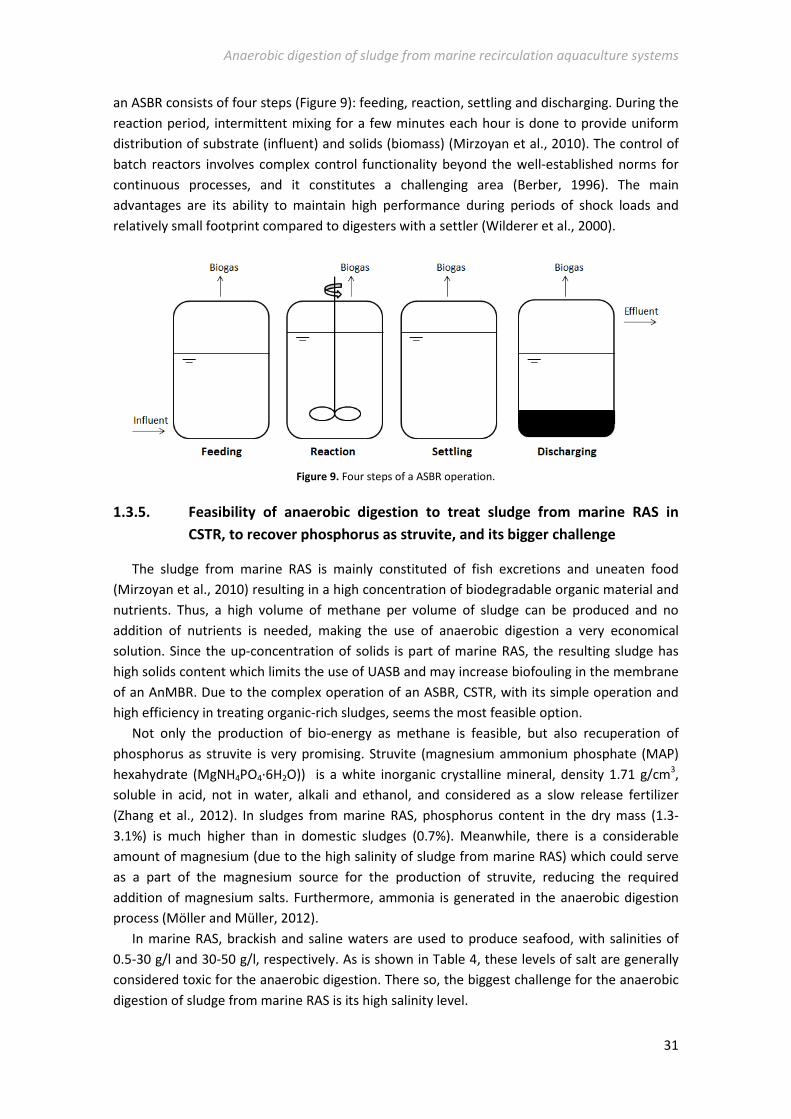
In an ASBR the influent is not continuously added into the reactor. In this kind of
configuration reaction and solids-liquid separation occurs in the same vessel. The operation of
Anaerobic digestion of sludge from marine recirculation aquaculture systems
31
an ASBR consists of four steps (Figure 9): feeding, reaction, settling and discharging. During the
reaction period, intermittent mixing for a few minutes each hour is done to provide uniform
distribution of substrate (influent) and solids (biomass) (Mirzoyan et al., 2010). The control of
batch reactors involves complex control functionality beyond the well-established norms for
continuous processes, and it constitutes a challenging area (Berber, 1996). The main
advantages are its ability to maintain high performance during periods of shock loads and
relatively small footprint compared to digesters with a settler (Wilderer et al., 2000).
Figure 9. Four steps of a ASBR operation.
1.3.5. Feasibility of anaerobic digestion to treat sludge from marine RAS in
CSTR, to recover phosphorus as struvite, and its bigger challenge
The sludge from marine RAS is mainly constituted of fish excretions and uneaten food
(Mirzoyan et al., 2010) resulting in a high concentration of biodegradable organic material and
nutrients. Thus, a high volume of methane per volume of sludge can be produced and no
addition of nutrients is needed, making the use of anaerobic digestion a very economical
solution. Since the up-concentration of solids is part of marine RAS, the resulting sludge has
high solids content which limits the use of UASB and may increase biofouling in the membrane
of an AnMBR. Due to the complex operation of an ASBR, CSTR, with its simple operation and
high efficiency in treating organic-rich sludges, seems the most feasible option.
Not only the production of bio-energy as methane is feasible, but also recuperation of
phosphorus as struvite is very promising. Struvite (magnesium ammonium phosphate (MAP)
hexahydrate (MgNH4PO4·6H2O)) is a white inorganic crystalline mineral, density 1.71 g/cm3,
soluble in acid, not in water, alkali and ethanol, and considered as a slow release fertilizer
(Zhang et al., 2012). In sludges from marine RAS, phosphorus content in the dry mass (1.3-
3.1%) is much higher than in domestic sludges (0.7%). Meanwhile, there is a considerable
amount of magnesium (due to the high salinity of sludge from marine RAS) which could serve
as a part of the magnesium source for the production of struvite, reducing the required
addition of magnesium salts. Furthermore, ammonia is generated in the anaerobic digestion
process (Möller and Müller, 2012).
In marine RAS, brackish and saline waters are used to produce seafood, with salinities of
0.5-30 g/l and 30-50 g/l, respectively. As is shown in Table 4, these levels of salt are generally
considered toxic for the anaerobic digestion. There so, the biggest challenge for the anaerobic
digestion of sludge from marine RAS is its high salinity level.
Anaerobic digestion of sludge from marine recirculation aquaculture systems
32
1.4. Adaptation of anaerobic biomass to saline conditions
Although the cations of salts in solution must be associated with the anions, the toxicity of
salts was found to be predominantly determined by the cation. They are required for microbial
growth and, consequently, affect specific growth rate like any other nutrient (Chen et al.,
2008). The problem of high salt level is that it causes bacterial cells to dehydrate due to
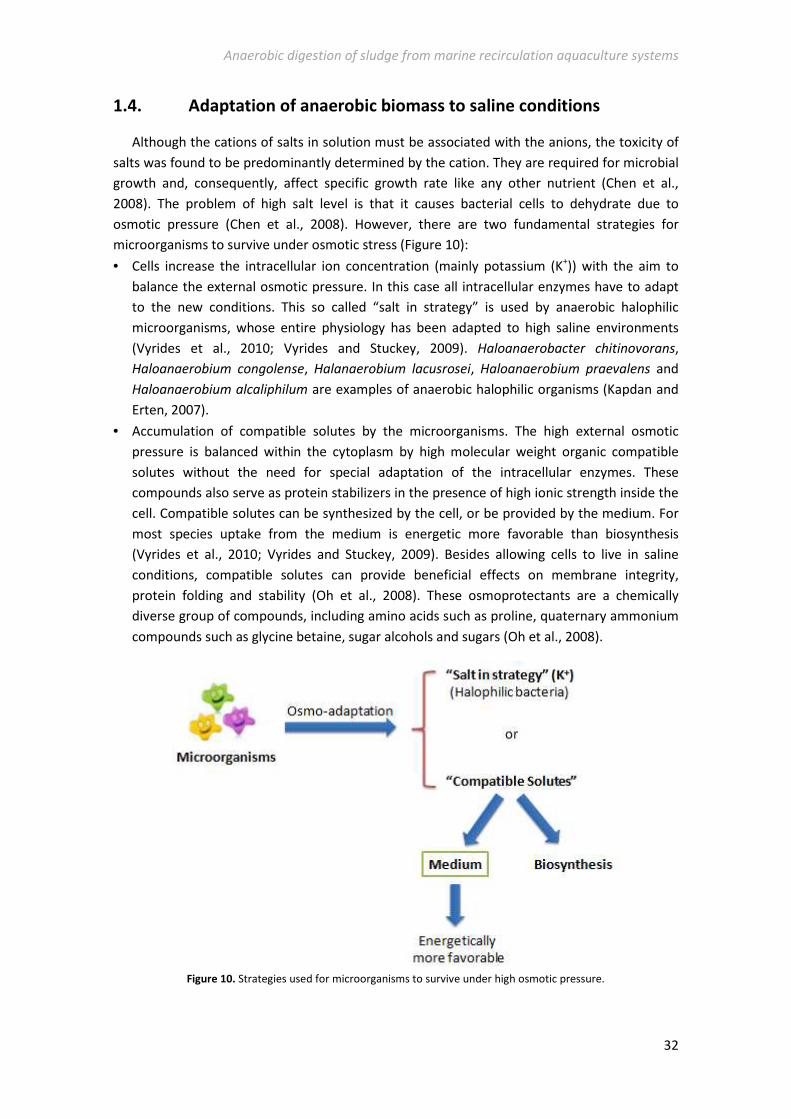
osmotic pressure (Chen et al., 2008). However, there are two fundamental strategies for
microorganisms to survive under osmotic stress (Figure 10):
• Cells increase the intracellular ion concentration (mainly potassium (K+)) with the aim to
balance the external osmotic pressure. In this case all intracellular enzymes have to adapt
to the new conditions. This so called “salt in strategy” is used by anaerobic halophilic
microorganisms, whose entire physiology has been adapted to high saline environments
(Vyrides et al., 2010; Vyrides and Stuckey, 2009). Haloanaerobacter chitinovorans,
Haloanaerobium congolense, Halanaerobium lacusrosei, Haloanaerobium praevalens and
Haloanaerobium alcaliphilum are examples of anaerobic halophilic organisms (Kapdan and
Erten, 2007).
• Accumulation of compatible solutes by the microorganisms. The high external osmotic
pressure is balanced within the cytoplasm by high molecular weight organic compatible
solutes without the need for special adaptation of the intracellular enzymes. These
compounds also serve as protein stabilizers in the presence of high ionic strength inside the
cell. Compatible solutes can be synthesized by the cell, or be provided by the medium. For
most species uptake from the medium is energetic more favorable than biosynthesis
(Vyrides et al., 2010; Vyrides and Stuckey, 2009). Besides allowing cells to live in saline
conditions, compatible solutes can provide beneficial effects on membrane integrity,
protein folding and stability (Oh et al., 2008). These osmoprotectants are a chemically
diverse group of compounds, including amino acids such as proline, quaternary ammonium
compounds such as glycine betaine, sugar alcohols and sugars (Oh et al., 2008).
Figure 10. Strategies used for microorganisms to survive under high osmotic pressure.
Anaerobic digestion of sludge from marine recirculation aquaculture systems
33
1.5. Extracellular polymeric substances (EPS)
Apart from compatible solutes, it was also reported that cells produce extracellular
polymeric substances (EPS) to cope with high salinity (Vyrides et al., 2010). EPS are compounds
produced by the microorganisms which protect them against dewatering and extreme
conditions. They can be products of cellular lyses and hydrolysis of macromolecules (Sheng et
al., 2010). These substances can also be used as a carbon and energy source during starvation
(Liu and H.P. Fang, 2002).
Proteins and carbohydrates are usually found to be the major components of EPS (Sheng et
al., 2010). Humic substances may also be a key component of the EPS, accounting for
approximately 20% of the total amount (Sheng et al., 2010). Lipids, uronic acid and DNA have
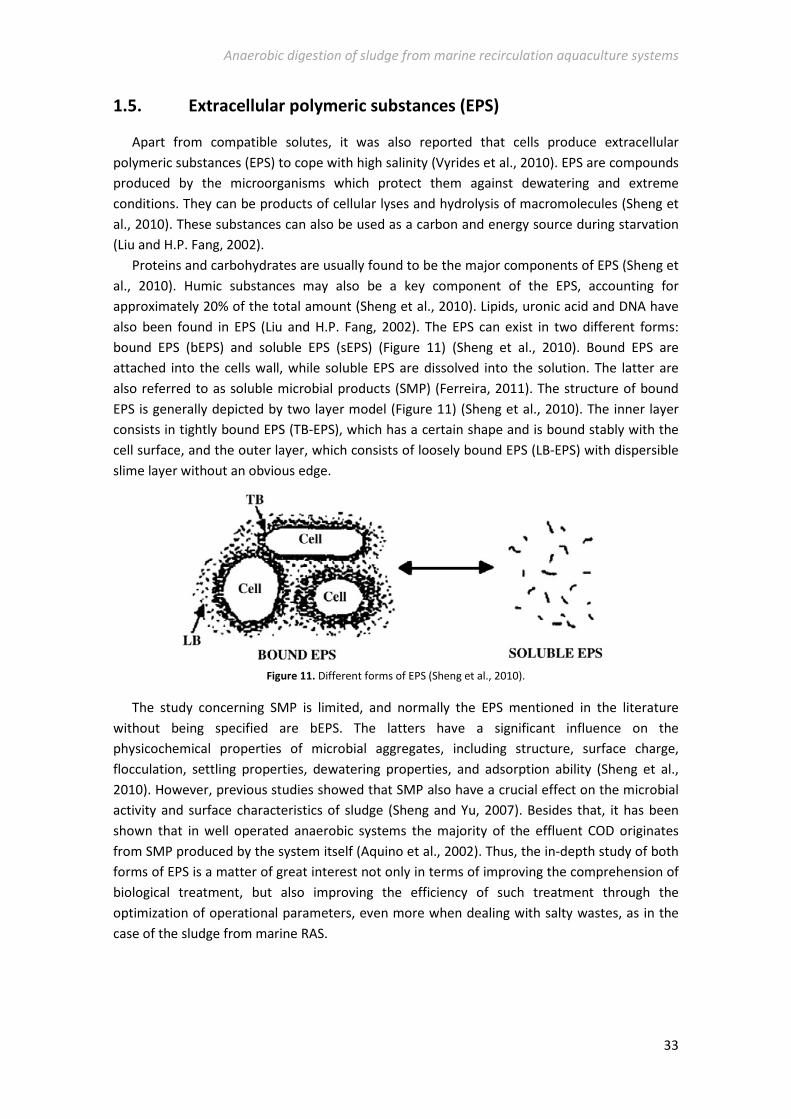
also been found in EPS (Liu and H.P. Fang, 2002). The EPS can exist in two different forms:
bound EPS (bEPS) and soluble EPS (sEPS) (Figure 11) (Sheng et al., 2010). Bound EPS are
attached into the cells wall, while soluble EPS are dissolved into the solution. The latter are
also referred to as soluble microbial products (SMP) (Ferreira, 2011). The structure of bound
EPS is generally depicted by two layer model (Figure 11) (Sheng et al., 2010). The inner layer
consists in tightly bound EPS (TB-EPS), which has a certain shape and is bound stably with the
cell surface, and the outer layer, which consists of loosely bound EPS (LB-EPS) with dispersible
slime layer without an obvious edge.
Figure 11. Different forms of EPS (Sheng et al., 2010).
The study concerning SMP is limited, and normally the EPS mentioned in the literature
without being specified are bEPS. The latters have a significant influence on the
physicochemical properties of microbial aggregates, including structure, surface charge,
flocculation, settling properties, dewatering properties, and adsorption ability (Sheng et al.,
2010). However, previous studies showed that SMP also have a crucial effect on the microbial
activity and surface characteristics of sludge (Sheng and Yu, 2007). Besides that, it has been
shown that in well operated anaerobic systems the majority of the effluent COD originates
from SMP produced by the system itself (Aquino et al., 2002). Thus, the in-depth study of both
forms of EPS is a matter of great interest not only in terms of improving the comprehension of
biological treatment, but also improving the efficiency of such treatment through the
optimization of operational parameters, even more when dealing with salty wastes, as in the
case of the sludge from marine RAS.
Anaerobic digestion of sludge from marine recirculation aquaculture systems
34
1.6. Phosphatase
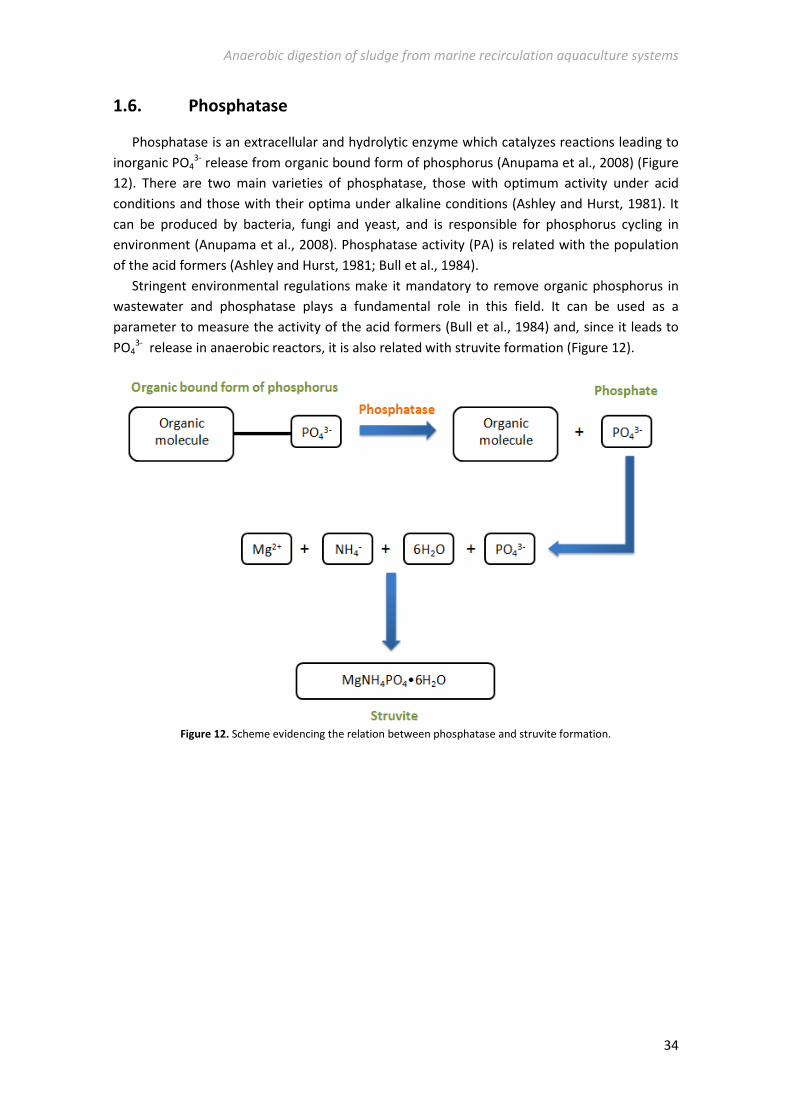
Phosphatase is an extracellular and hydrolytic enzyme which catalyzes reactions leading to
inorganic PO43- release from organic bound form of phosphorus (Anupama et al., 2008) (Figure
12). There are two main varieties of phosphatase, those with optimum activity under acid
conditions and those with their optima under alkaline conditions (Ashley and Hurst, 1981). It
can be produced by bacteria, fungi and yeast, and is responsible for phosphorus cycling in
environment (Anupama et al., 2008). Phosphatase activity (PA) is related with the population
of the acid formers (Ashley and Hurst, 1981; Bull et al., 1984).
Stringent environmental regulations make it mandatory to remove organic phosphorus in
wastewater and phosphatase plays a fundamental role in this field. It can be used as a
parameter to measure the activity of the acid formers (Bull et al., 1984) and, since it leads to
PO43- release in anaerobic reactors, it is also related with struvite formation (Figure 12).
Figure 12. Scheme evidencing the relation between phosphatase and struvite formation.
Anaerobic digestion of sludge from marine recirculation aquaculture systems
35
1.7. State of the art
1.7.1. Anaerobic digestion of sludge from marine RAS in CSTR
The results of a literature review on the anaerobic digestion of sludge from marine RAS in
CSTR are presented in Table 6.
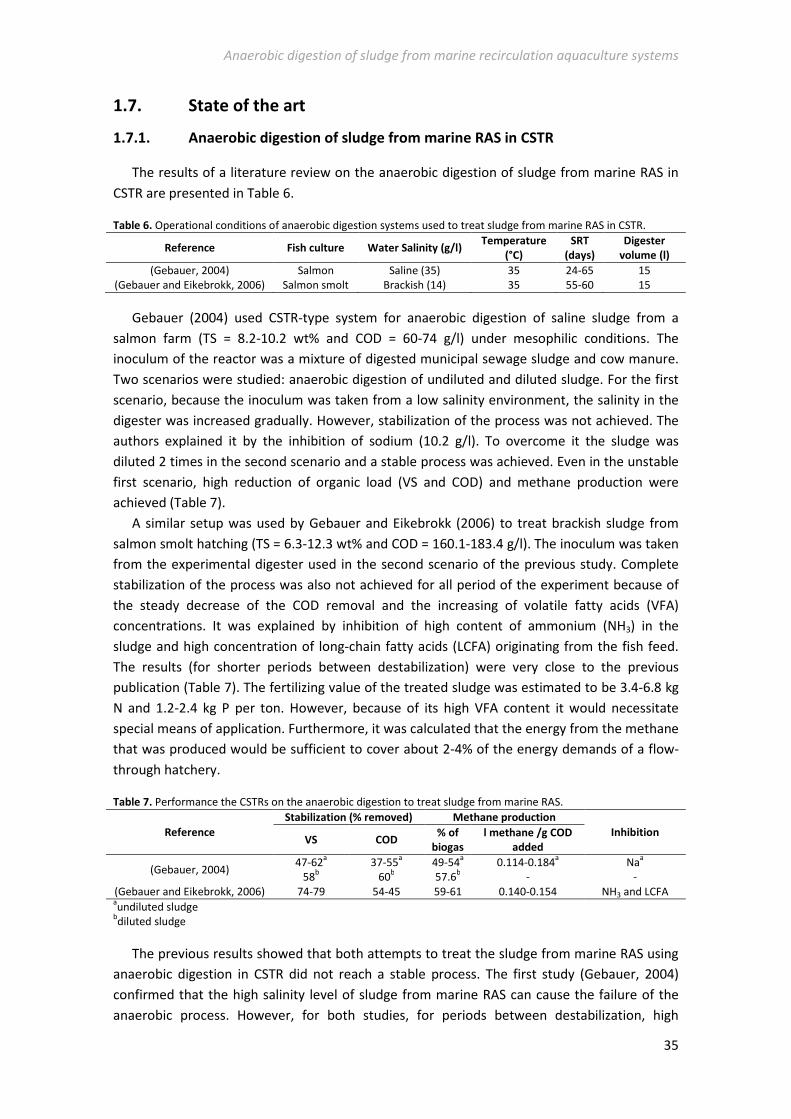
Table 6. Operational conditions of anaerobic digestion systems used to treat sludge from marine RAS in CSTR.
Reference Fish culture Water Salinity (g/l) Temperature
(°C)
SRT
(days)
Digester
volume (l)
(Gebauer, 2004) Salmon Saline (35) 35 24-65 15
(Gebauer and Eikebrokk, 2006) Salmon smolt Brackish (14) 35 55-60 15
Gebauer (2004) used CSTR-type system for anaerobic digestion of saline sludge from a
salmon farm (TS = 8.2-10.2 wt% and COD = 60-74 g/l) under mesophilic conditions. The
inoculum of the reactor was a mixture of digested municipal sewage sludge and cow manure.
Two scenarios were studied: anaerobic digestion of undiluted and diluted sludge. For the first
scenario, because the inoculum was taken from a low salinity environment, the salinity in the
digester was increased gradually. However, stabilization of the process was not achieved. The
authors explained it by the inhibition of sodium (10.2 g/l). To overcome it the sludge was
diluted 2 times in the second scenario and a stable process was achieved. Even in the unstable
first scenario, high reduction of organic load (VS and COD) and methane production were
achieved (Table 7).
A similar setup was used by Gebauer and Eikebrokk (2006) to treat brackish sludge from
salmon smolt hatching (TS = 6.3-12.3 wt% and COD = 160.1-183.4 g/l). The inoculum was taken
from the experimental digester used in the second scenario of the previous study. Complete
stabilization of the process was also not achieved for all period of the experiment because of
the steady decrease of the COD removal and the increasing of volatile fatty acids (VFA)
concentrations. It was explained by inhibition of high content of ammonium (NH3) in the
sludge and high concentration of long-chain fatty acids (LCFA) originating from the fish feed.
The results (for shorter periods between destabilization) were very close to the previous
publication (Table 7). The fertilizing value of the treated sludge was estimated to be 3.4-6.8 kg
N and 1.2-2.4 kg P per ton. However, because of its high VFA content it would necessitate
special means of application. Furthermore, it was calculated that the energy from the methane
that was produced would be sufficient to cover about 2-4% of the energy demands of a flow-
through hatchery.
Table 7. Performance the CSTRs on the anaerobic digestion to treat sludge from marine RAS.
Reference
Stabilization (% removed) Methane production
Inhibition VS COD
% of
biogas
l methane /g COD
added
(Gebauer, 2004) 47-62
a 37-55
a 49-54
a 0.114-0.184
a Na
a
58b 60
b 57.6
b - -
(Gebauer and Eikebrokk, 2006) 74-79 54-45 59-61 0.140-0.154 NH3 and LCFA aundiluted sludge
bdiluted sludge
The previous results showed that both attempts to treat the sludge from marine RAS using
anaerobic digestion in CSTR did not reach a stable process. The first study (Gebauer, 2004)
confirmed that the high salinity level of sludge from marine RAS can cause the failure of the
anaerobic process. However, for both studies, for periods between destabilization, high
Anaerobic digestion of sludge from marine recirculation aquaculture systems
36
reduction of organic load (COD and VS) and methane production were achieved which makes
promising the use anaerobic digestion in CSTR to treat sludge from marine RAS, case the
toxicity caused by the high salinity of the sludge could be overcome.
1.7.2. Potassium and compatible solutes in the improvement of anaerobic
digestion under saline conditions
Compatible solutes were tested by Oh et al. (2008), Vyrides and Stuckey (2009) and Vyrides
et al. (2010) to enhance the anaerobic digestion at high salinity, being potassium only
addressed in the latter study.
Oh et al. (2008), using batch tests, studied the effect of compatibles solutes (glycine
betaine, choline, carnitine and trehalose) on the anaerobic digestion of salt-containing food
wastes (17.5 g sodium chloride (NaCl)/l). The anaerobic seed sludge used was taken from an
anaerobic digester in a municipal wastewater treatment plant. First, to test the inhibition of
anaerobic digestion by NaCl, the sludge was washed with distilled water and the NaCl
concentration was adjusted to 10, 35, 60, 75 and 100 g/L. The methane production decreased
50% with 10 g/l NaCl, 80% with 35 g/L NaCl and for higher concentrations no methane was
produced. To overcome NaCl inhibition, 1 g/l of compatible solutes was added separately to
the washed sludge with 10 and 35 g/L NaCl and to the non-washed sludge with 11.6 g/L NaCl
(original salt-containing food waste diluted 80:20 (distilled water:food waste)). For the sludge
with 10 g/l NaCl, glycine betaine and choline increased the methane about twofold compared
to the control. The same result was achieved for the sludge with 35 g/l NaCl but only with the
addition of glycine betaine. For the non-washed sludge, betaine and choline increased
methanogenic activity about five to sixfold. For glycine betaine, it was found that the optimal
concentration was 1.5 g/l. It was also observed that the addition of betaine in the beginning of
the batch tests and only after 7 days increased the methane production in the same
proportion. The addition of betaine after only 14 days of incubation did not improve the
methane production, which could not be explained. Finally, the accumulation of intracellular
glycine betaine in the anaerobic biomass was reported, and it started to occur after 5 days of
incubation.
Vyrides and Stuckey (2009) used two batch reactors (5 l) inoculated with anaerobic sludge
from a wastewater treatment plant and operated under stable OLR of 2 g COD/l day. The
substrate was glucose and nutrients according to (Owen et al., 1979). One of the reactors was
operated for 6 months under the conditions above mentioned while the other, after 5 month
of operation as above, was subjected for about 1 month to 30 g NaCl/l. Addition of 1 mM of
Glycine betaine, α-glutamate and β-glutamate, on batch tests with a medium with 35 g NaCl/l,
using the anaerobic biomass not acclimated to sodium, resulted in an increase in cumulative
methane production, being the glycine betaine the most effective. Under no salinity,
compatible solutes did not result in any excess production of methane. The study showed that
the methanogens were severely affected by sodium toxicity and that glycine betaine was
found to be more beneficial for the methanogens than for the propionic acid utilisers. When
comparing the addition of 1 mM of glycine betaine to non-adapted biomass and biomass
previously expose to salinity, both in a medium with 35 g NaCl/l, the authors found that the
methane production by the biomass previously exposed to salinity was only slightly higher
compared to the biomass that was not exposed to salinity. Different feeding strategies
Anaerobic digestion of sludge from marine recirculation aquaculture systems
37
revealed that the no replacement of the medium, instead of removing and adding a new
medium with the same concentration of substrate, was more beneficial to the biomass. It was
explained by the removal of compatible solutes which are used as a strategy to regulate solute
concentrations. According to this, the authors suggested that this is the reason why continuous
reactors have better performance than batch reactors, because in the continuous reactors the
equilibrium between cells and compatible solutes is not changing as abruptly as in the case of
batch reactors.
Batch and continuous studies related to the enhancement of saline waste treatment using
anaerobic digestion were made by Vyrides et al. (2010). The inoculum used on both batch and
continuous tests was taken from the batch reactor from the previous study. Batch tests
showed that trehalose was the dominant solute that accumulated during expose to a salt
stress environmental (20 and 40 g NaCl/l) with concentrations in the range of 0.027-0.175
µmol/mg dry weight. 1 mM of compatible solutes (trehalose, glycine betaine and N-acetyl-β-
lysine) and potassium were separately added to batch tests under 35 g NaCl/l. Trehalose, N-
acetyl-β-lysine and potassium slightly decreased sodium inhibition while betaine dramatically
improved the adaptation of the anaerobic biomass. It was found that the methane production
with a concentration as low as 0.1 mM was very close to that obtain with 1 mM of glycine
betaine, 41.2 ml and 45.6 ml after 360 hours, respectively. The prolonged effect of glycine
betaine on anaerobic biomass was also shown. After the first batch containing 0.1 and 1 mM
of glycine betaine, the medium was removed and no addition of glycine betaine was done for
the following four batch feedings. The results showed that the activity of the biomass
continued to increase even when glycine betaine was not added continuously. This was
explained by the fact that the cells maintained the betaine in their inside so they can act as
osmoprotectants over time. Also no significant shift in the archaeal microbial community with
high salinity was also reported. Two submerged anaerobic membrane bioreactors (SAMBRs)
(volume of 3 L and HRT of 12 h) were used in order to investigate different strategies of
addition of glycine betaine under high fluctuations in salinity (0 and 35 g NaCl/l) during
continuous operation. The results showed that the addition of 1 mM glycine betaine slightly
alleviates sodium inhibition, and the strategy of adding 0.1 mM glycine betaine for 10 days
slightly improved the performance of a continuous SAMBR. On the other hand, the addition of
5 mM glycine betaine and operation in batch mode for 2 days significantly enhanced organic
degradation in the SAMBRs. Another strategy that resulted in high performance was the
injection of 1 mM glycine betaine for 5 days. Despite the positive effects of adding glycine
betaine to anaerobic biomass under batch saline conditions, several betaine addition
strategies were not so effective under continuous operation. The authors explained it by the
time required for the glycine betaine to be taken up by the anaerobic biomass because some
of the glycine betaine may be biodegraded by anaerobic bacteria.
The results of the latter studies showed that potassium and compatible solutes can
enhance the anaerobic digestion at high salinity, being compatible solutes more efficient.
Between the compatible solutes tested, for all the studies glycine betaine presented the best
results. The use of potassium and compatible solutes was mainly focused in the acclimatization
of biomass non-adapted to saline conditions to a medium with high salinity. However, no
studies were found where these compounds are added into a system where the biomass is
already acclimated to a high salinity level in order to test if the process can be improved.
Anaerobic digestion of sludge from marine recirculation aquaculture systems
38
1.7.3. EPS in the anaerobic digestion under saline conditions
Vyrides and Stuckey (2009) investigated the production of EPS by anaerobic biomass under
high salinity (20 g NaCl/l and 40 g NaCl/l). Through batch tests, it was found that the higher the
salinity, the higher the amount of EPS produced. It was also observed that the composition of
EPS changed under high salinities and over time. At high levels of salt, the main constituents of
the EPS were low molecular weight compounds, while in low levels were high molecular
weight compounds. The levels of EPS at 20 g NaCl/l decreased over time (between 24 and 72h
of incubation), while at 40 g NaCl/l the levels increased. The increase of the concentration of
EPS with high salinity was explained as a response of biomass to counteract the sodium
toxicity. The decrease of EPS levels at 20 g NaCl/l over time was justified by the acclimatization
of the cells to the initial stress conditions, so after 72h less EPS was produced than in 24h,
being part of EPS released into the medium, while part of it was biodegraded. In the biomass
exposed to 40 g NaCl/l the cells could not acclimatize and continued to produce EPS. The
analysis of particle size distribution at biomass exposed to normal conditions and 40 g NaCl/l
showed higher mean flock size at high salinity and it was attributed to the higher production of
bound EPS that forms the outer surface of the cell, and as a result cells attached more easily to
each other.
Comparing the production of EPS of two SAMBRs operating at high salinity levels with and
without addition of glycine betaine, Vyrides et al. (2010) reported that the concentration of
EPS in the SAMBR where glycine betaine was added was almost 2 times less than that from the
SAMBR without glycine betaine. It was explained that the presence of glycine betaine allowed
the rapid adaptation of anaerobic biomass to saline conditions.
These studies showed that EPS have an important role in the adaptation of biomass into
environments with high salinity. The research on EPS in the anaerobic digestion at saline
conditions is quite limited and more research is needed to better understand its role in the
process.
1.7.4. Phosphatase activity (PA) in the anaerobic digestion
The first studies of PA specifically related with anaerobic digestion were on using it as a
predictor of digester failure (Ashley and Hurst, 1981; Wang et al., 1990). In both studies, an
increase in acid and alkaline PA was found in anaerobic digesters overfed 10 days before
higher concentrations of VFAs and lower pH values were detected. Apart from that, Ashley and
Hurst (1981) also reported four groups of PA, with optimum pH of 4.2, 6.6, 9.4 and 11.4. Both
studies also reported that PA was related to the population of the acid forming bacteria. This
was addressed by Bull et al. (1984), which used alkaline PA as a parameter to investigate the
activity of the acid formers in an anaerobic reactor.
An overall analysis of PA in four different anaerobic reactors (Table 8) was made by
Anupama et al. (2008). PA was higher in continuously fed reactors (880-2632 µM/h), compared
to a fed-batch reactor (FBR) (540-1249 µM/h). The higher PA was explained by the higher
biomass concentration (MLSS) in the continuous reactors. The PA was found in all the reactors,
but exhibited a 10-30% variation even at steady state reactor conditions. Alkaline phosphatase
dominated in BFBR and UASB-1 while acid phosphatase showed higher activity in FBR and
UASB-2, which indicated that the composition of the substrate seems to determine the kind of
phosphatase (either alkaline or acid) in the reactor. The PA could not be related with the
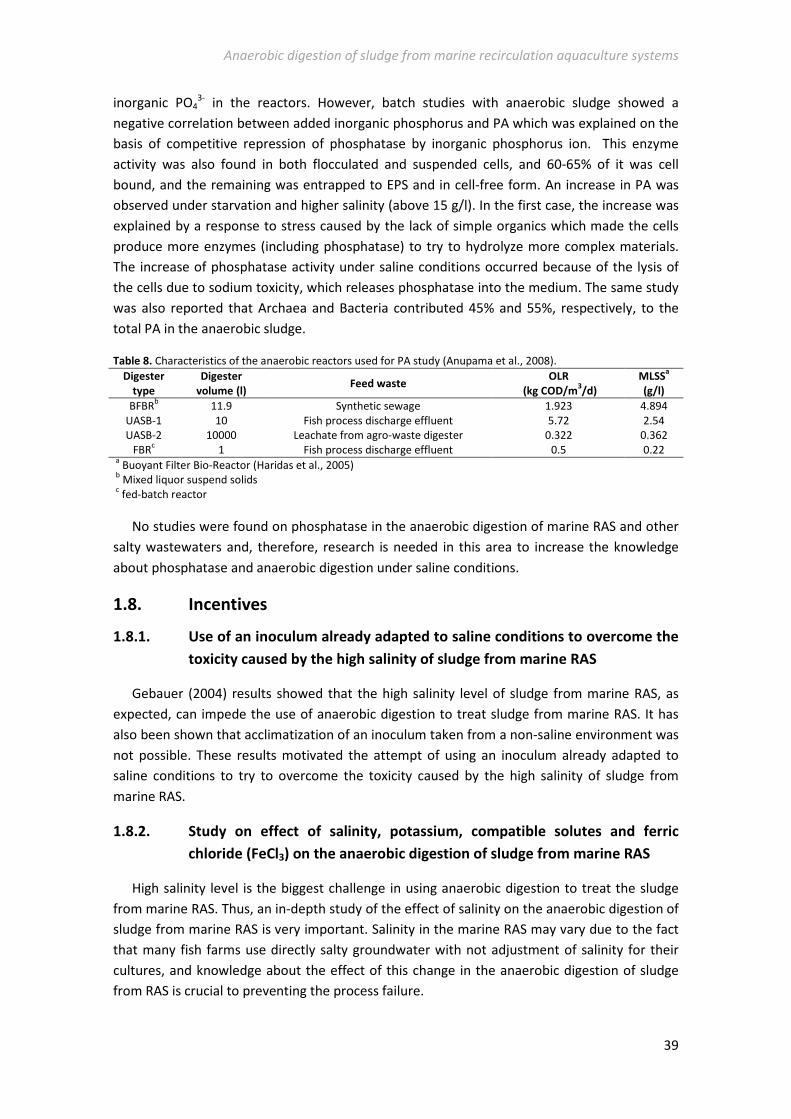
Anaerobic digestion of sludge from marine recirculation aquaculture systems
39
inorganic PO43- in the reactors. However, batch studies with anaerobic sludge showed a
negative correlation between added inorganic phosphorus and PA which was explained on the
basis of competitive repression of phosphatase by inorganic phosphorus ion. This enzyme
activity was also found in both flocculated and suspended cells, and 60-65% of it was cell
bound, and the remaining was entrapped to EPS and in cell-free form. An increase in PA was
observed under starvation and higher salinity (above 15 g/l). In the first case, the increase was
explained by a response to stress caused by the lack of simple organics which made the cells
produce more enzymes (including phosphatase) to try to hydrolyze more complex materials.
The increase of phosphatase activity under saline conditions occurred because of the lysis of
the cells due to sodium toxicity, which releases phosphatase into the medium. The same study
was also reported that Archaea and Bacteria contributed 45% and 55%, respectively, to the
total PA in the anaerobic sludge.
Table 8. Characteristics of the anaerobic reactors used for PA study (Anupama et al., 2008).
Digester
type
Digester
volume (l) Feed waste
OLR
(kg COD/m3/d)
MLSSa
(g/l)
BFBRb 11.9 Synthetic sewage 1.923 4.894
UASB-1 10 Fish process discharge effluent 5.72 2.54
UASB-2 10000 Leachate from agro-waste digester 0.322 0.362
FBRc 1 Fish process discharge effluent 0.5 0.22
a Buoyant Filter Bio-Reactor (Haridas et al., 2005)
b Mixed liquor suspend solids
c fed-batch reactor
No studies were found on phosphatase in the anaerobic digestion of marine RAS and other
salty wastewaters and, therefore, research is needed in this area to increase the knowledge
about phosphatase and anaerobic digestion under saline conditions.
1.8. Incentives
1.8.1. Use of an inoculum already adapted to saline conditions to overcome the
toxicity caused by the high salinity of sludge from marine RAS
Gebauer (2004) results showed that the high salinity level of sludge from marine RAS, as
expected, can impede the use of anaerobic digestion to treat sludge from marine RAS. It has
also been shown that acclimatization of an inoculum taken from a non-saline environment was
not possible. These results motivated the attempt of using an inoculum already adapted to
saline conditions to try to overcome the toxicity caused by the high salinity of sludge from
marine RAS.
1.8.2. Study on effect of salinity, potassium, compatible solutes and ferric
chloride (FeCl3) on the anaerobic digestion of sludge from marine RAS
High salinity level is the biggest challenge in using anaerobic digestion to treat the sludge
from marine RAS. Thus, an in-depth study of the effect of salinity on the anaerobic digestion of
sludge from marine RAS is very important. Salinity in the marine RAS may vary due to the fact
that many fish farms use directly salty groundwater with not adjustment of salinity for their
cultures, and knowledge about the effect of this change in the anaerobic digestion of sludge
from RAS is crucial to preventing the process failure.
Anaerobic digestion of sludge from marine recirculation aquaculture systems
40
The literature review on the use of potassium and compatibles solutes to enhance the
anaerobic digestion under saline conditions showed that the use of potassium and compatible
solutes can improve the process. This was an incentive to test whether these compounds can
enhance the anaerobic digestion of the salty sludge from marine RAS.
In the first part of the EM-MARES project, ferric chloride (FeCl3) presented a good
performance as a coagulant in the up-concentration of solids and phosphorus from the
backwash water from marine RAS. However, it is important to investigate what is the effect of
this chemical on the anaerobic digestion of sludge from marine RAS in order to assess the
feasibility of using coagulation using FeCl3 before anaerobic digestion, as proposed by the EM-
MARES project.
1.8.3. SMA, PA, PO43-
release and EPS as the key parameters to study the effect
of salinity, potassium, compatible solutes and FeCl3 on the anaerobic
digestion of sludge from marine RAS, according to the goals of the EM-
MARES project
The EM-MARES project aims at recovering energy in the form of methane and phosphorus
in the form of struvite from the anaerobic digestion of sludge from marine RAS. As was already
discussed, the SMA assessment can be used to study the effect of toxicants/stimulants in
methane production. PA and PO43- release are related with the aim of the EM-MARES project of
recovering phosphorus as struvite from the digested. The literature review showed that EPS
play an important role on the anaerobic digestion under saline conditions. This was an
incentive to study EPS, since these substances might also have an important role in the
anaerobic digestion of sludge from marine RAS.
Based on the discussion in the previous paragraph, it was considered that SMA, PA, PO43-
release and EPS are the key parameters to study the effect of salinity, FeCl3, potassium and
compatible solutes in the anaerobic digestion of sludge from marine RAS, taking into account
the objectives of the EM-MARES project.
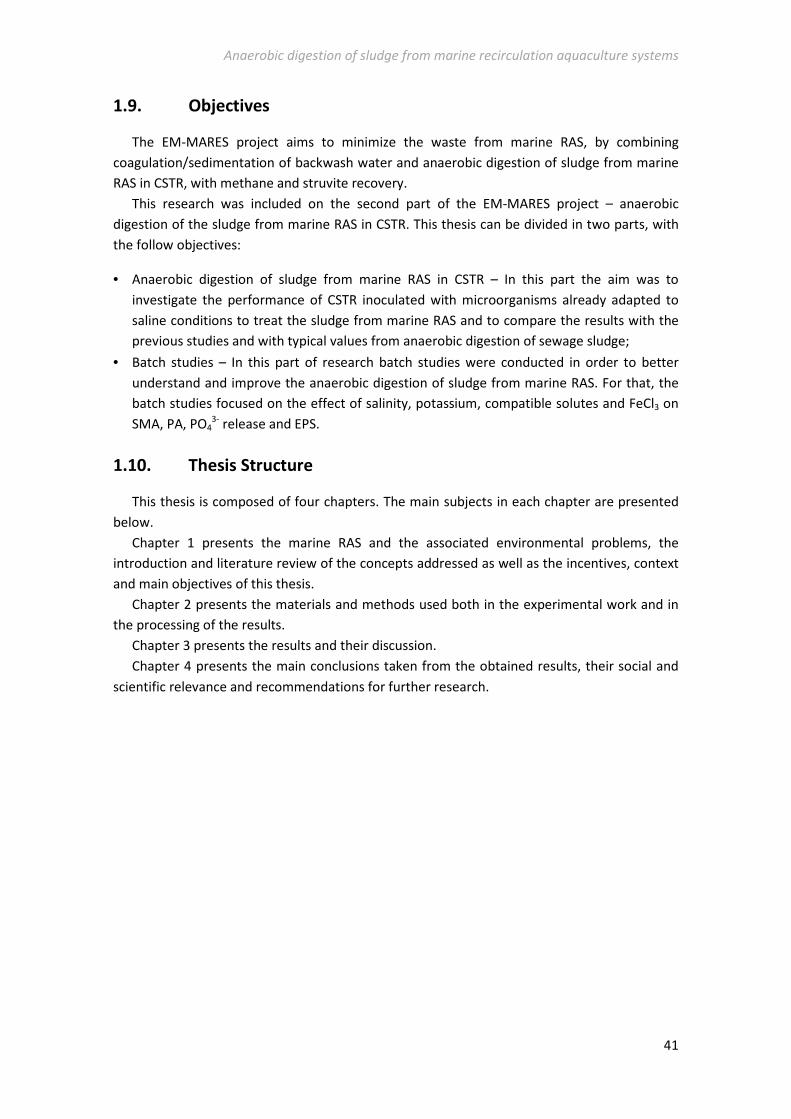
Anaerobic digestion of sludge from marine recirculation aquaculture systems
41
1.9. Objectives
The EM-MARES project aims to minimize the waste from marine RAS, by combining
coagulation/sedimentation of backwash water and anaerobic digestion of sludge from marine
RAS in CSTR, with methane and struvite recovery.
This research was included on the second part of the EM-MARES project – anaerobic
digestion of the sludge from marine RAS in CSTR. This thesis can be divided in two parts, with
the follow objectives:
• Anaerobic digestion of sludge from marine RAS in CSTR – In this part the aim was to
investigate the performance of CSTR inoculated with microorganisms already adapted to
saline conditions to treat the sludge from marine RAS and to compare the results with the
previous studies and with typical values from anaerobic digestion of sewage sludge;
• Batch studies – In this part of research batch studies were conducted in order to better
understand and improve the anaerobic digestion of sludge from marine RAS. For that, the
batch studies focused on the effect of salinity, potassium, compatible solutes and FeCl3 on
SMA, PA, PO43- release and EPS.
1.10. Thesis Structure
This thesis is composed of four chapters. The main subjects in each chapter are presented
below.
Chapter 1 presents the marine RAS and the associated environmental problems, the
introduction and literature review of the concepts addressed as well as the incentives, context
and main objectives of this thesis.
Chapter 2 presents the materials and methods used both in the experimental work and in
the processing of the results.
Chapter 3 presents the results and their discussion.
Chapter 4 presents the main conclusions taken from the obtained results, their social and
scientific relevance and recommendations for further research.

Anaerobic digestion of sludge from marine recirculation aquaculture systems
42
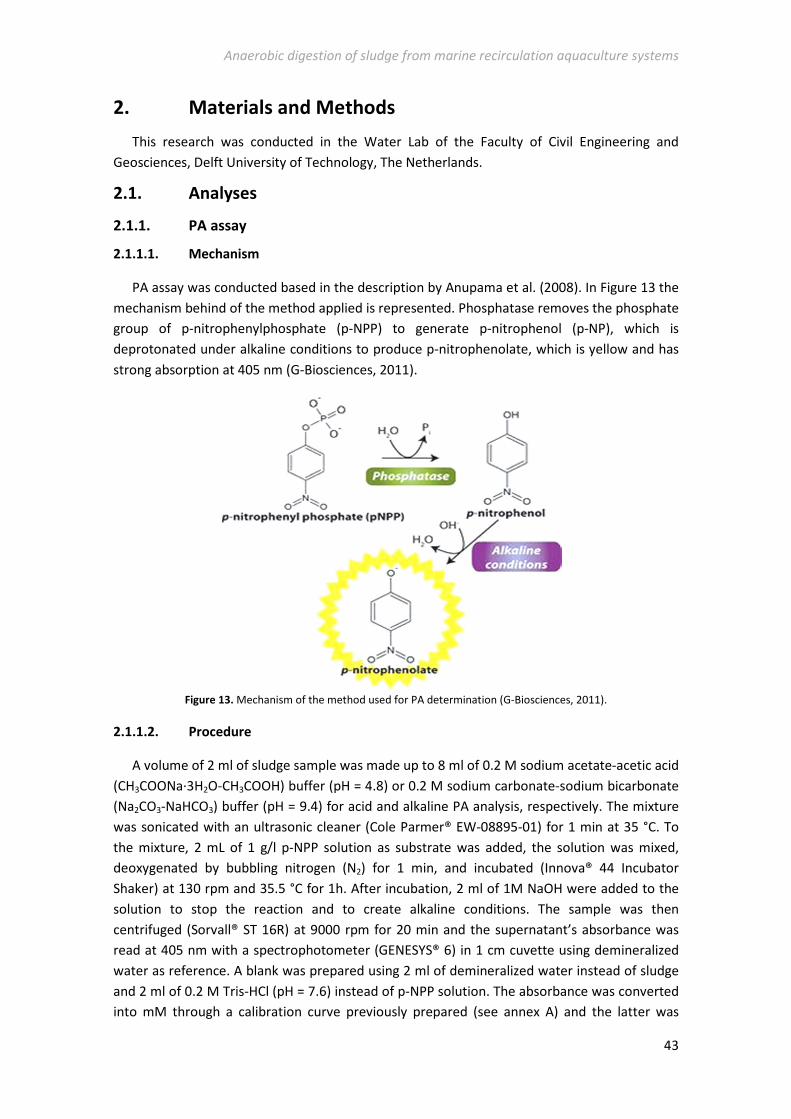
Anaerobic digestion of sludge from marine recirculation aquaculture systems
43
2. Materials and Methods
This research was conducted in the Water Lab of the Faculty of Civil Engineering and
Geosciences, Delft University of Technology, The Netherlands.
2.1. Analyses
2.1.1. PA assay
2.1.1.1. Mechanism
PA assay was conducted based in the description by Anupama et al. (2008). In Figure 13 the
mechanism behind of the method applied is represented. Phosphatase removes the phosphate
group of p-nitrophenylphosphate (p-NPP) to generate p-nitrophenol (p-NP), which is
deprotonated under alkaline conditions to produce p-nitrophenolate, which is yellow and has
strong absorption at 405 nm (G-Biosciences, 2011).
Figure 13. Mechanism of the method used for PA determination (G-Biosciences, 2011).
2.1.1.2. Procedure
A volume of 2 ml of sludge sample was made up to 8 ml of 0.2 M sodium acetate-acetic acid
(CH3COONa·3H2O-CH3COOH) buffer (pH = 4.8) or 0.2 M sodium carbonate-sodium bicarbonate
(Na2CO3-NaHCO3) buffer (pH = 9.4) for acid and alkaline PA analysis, respectively. The mixture
was sonicated with an ultrasonic cleaner (Cole Parmer® EW-08895-01) for 1 min at 35 °C. To
the mixture, 2 mL of 1 g/l p-NPP solution as substrate was added, the solution was mixed,
deoxygenated by bubbling nitrogen (N2) for 1 min, and incubated (Innova® 44 Incubator
Shaker) at 130 rpm and 35.5 °C for 1h. After incubation, 2 ml of 1M NaOH were added to the
solution to stop the reaction and to create alkaline conditions. The sample was then
centrifuged (Sorvall® ST 16R) at 9000 rpm for 20 min and the supernatant’s absorbance was
read at 405 nm with a spectrophotometer (GENESYS® 6) in 1 cm cuvette using demineralized
water as reference. A blank was prepared using 2 ml of demineralized water instead of sludge
and 2 ml of 0.2 M Tris-HCl (pH = 7.6) instead of p-NPP solution. The absorbance was converted
into mM through a calibration curve previously prepared (see annex A) and the latter was
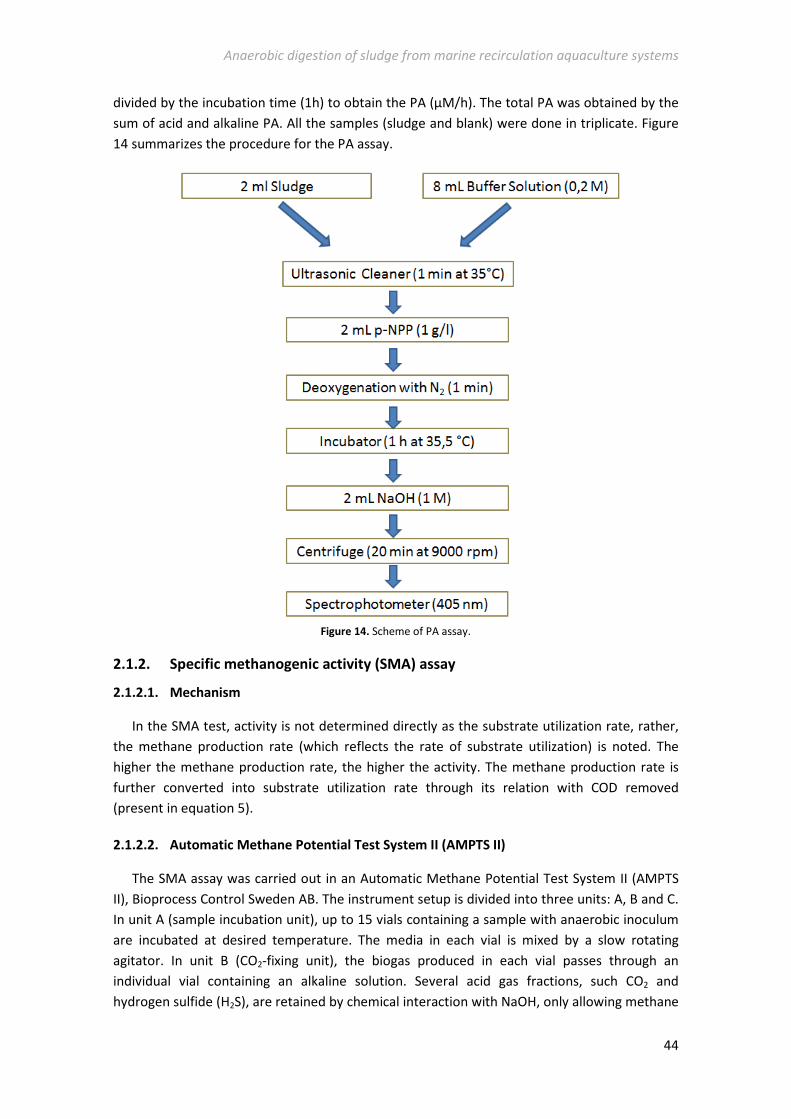
Anaerobic digestion of sludge from marine recirculation aquaculture systems
44
divided by the incubation time (1h) to obtain the PA (µM/h). The total PA was obtained by the
sum of acid and alkaline PA. All the samples (sludge and blank) were done in triplicate. Figure
14 summarizes the procedure for the PA assay.
Figure 14. Scheme of PA assay.
2.1.2. Specific methanogenic activity (SMA) assay
2.1.2.1. Mechanism
In the SMA test, activity is not determined directly as the substrate utilization rate, rather,
the methane production rate (which reflects the rate of substrate utilization) is noted. The
higher the methane production rate, the higher the activity. The methane production rate is
further converted into substrate utilization rate through its relation with COD removed
(present in equation 5).
2.1.2.2. Automatic Methane Potential Test System II (AMPTS II)
The SMA assay was carried out in an Automatic Methane Potential Test System II (AMPTS
II), Bioprocess Control Sweden AB. The instrument setup is divided into three units: A, B and C.
In unit A (sample incubation unit), up to 15 vials containing a sample with anaerobic inoculum
are incubated at desired temperature. The media in each vial is mixed by a slow rotating
agitator. In unit B (CO2-fixing unit), the biogas produced in each vial passes through an
individual vial containing an alkaline solution. Several acid gas fractions, such CO2 and
hydrogen sulfide (H2S), are retained by chemical interaction with NaOH, only allowing methane
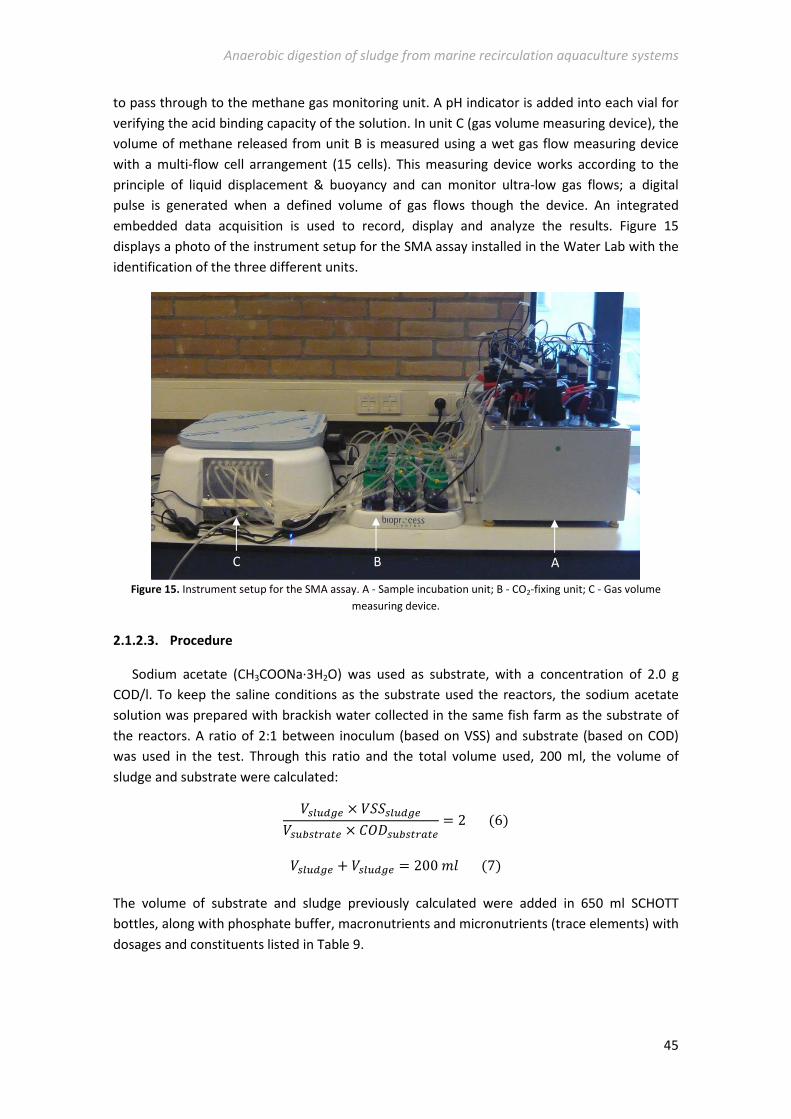
Anaerobic digestion of sludge from marine recirculation aquaculture systems
45
to pass through to the methane gas monitoring unit. A pH indicator is added into each vial for
verifying the acid binding capacity of the solution. In unit C (gas volume measuring device), the
volume of methane released from unit B is measured using a wet gas flow measuring device
with a multi-flow cell arrangement (15 cells). This measuring device works according to the
principle of liquid displacement & buoyancy and can monitor ultra-low gas flows; a digital
pulse is generated when a defined volume of gas flows though the device. An integrated
embedded data acquisition is used to record, display and analyze the results. Figure 15
displays a photo of the instrument setup for the SMA assay installed in the Water Lab with the
identification of the three different units.
Figure 15. Instrument setup for the SMA assay. A - Sample incubation unit; B - CO2-fixing unit; C - Gas volume
measuring device.
2.1.2.3. Procedure
Sodium acetate (CH3COONa·3H2O) was used as substrate, with a concentration of 2.0 g
COD/l. To keep the saline conditions as the substrate used the reactors, the sodium acetate
solution was prepared with brackish water collected in the same fish farm as the substrate of
the reactors. A ratio of 2:1 between inoculum (based on VSS) and substrate (based on COD)
was used in the test. Through this ratio and the total volume used, 200 ml, the volume of
sludge and substrate were calculated:
,-./012 × ,))-./012,-/�-45�42 × ���-/�-45�42
= 2(6)
,-./012+,-./012 = 200�&(7)
The volume of substrate and sludge previously calculated were added in 650 ml SCHOTT
bottles, along with phosphate buffer, macronutrients and micronutrients (trace elements) with
dosages and constituents listed in Table 9.
A B C
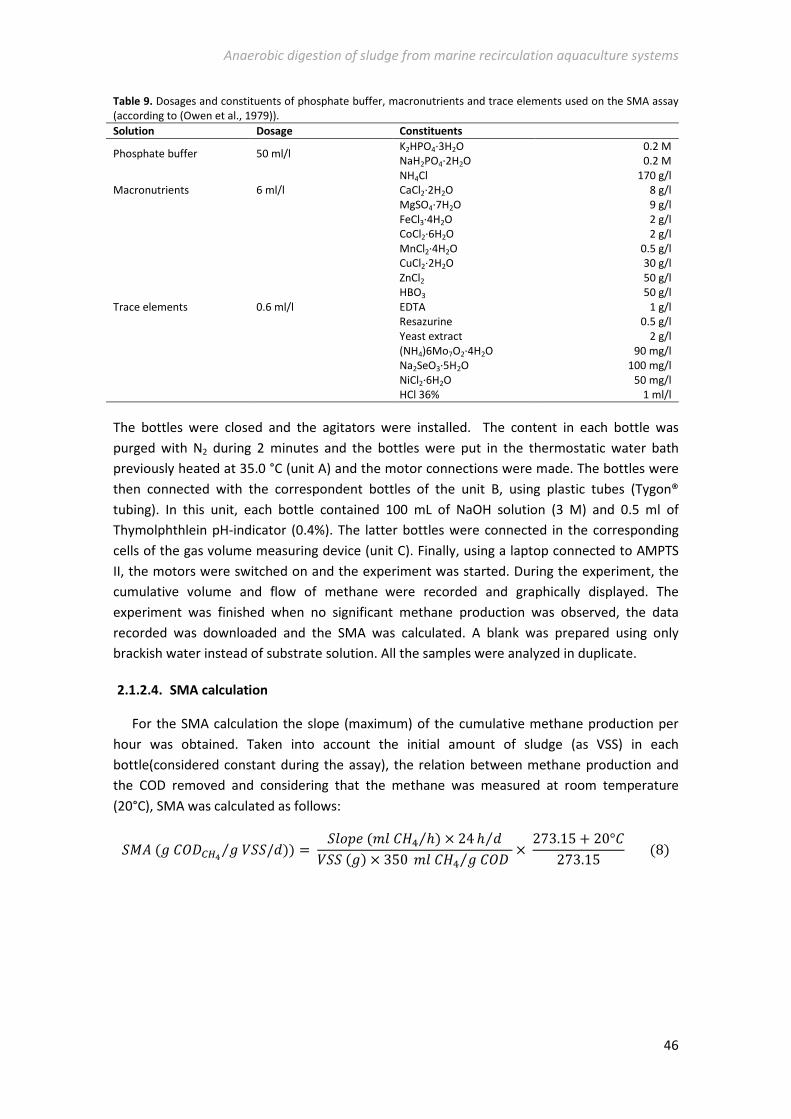
Anaerobic digestion of sludge from marine recirculation aquaculture systems
46
Table 9. Dosages and constituents of phosphate buffer, macronutrients and trace elements used on the SMA assay
(according to (Owen et al., 1979)).
Solution Dosage Constituents
Phosphate buffer 50 ml/l K2HPO4·3H2O 0.2 M
NaH2PO4·2H2O 0.2 M
Macronutrients 6 ml/l
NH4Cl 170 g/l
CaCl2·2H2O 8 g/l
MgSO4·7H2O 9 g/l
Trace elements 0.6 ml/l
FeCl3·4H2O 2 g/l
CoCl2·6H2O 2 g/l
MnCl2·4H2O 0.5 g/l
CuCl2·2H2O 30 g/l
ZnCl2 50 g/l
HBO3 50 g/l
EDTA 1 g/l
Resazurine 0.5 g/l
Yeast extract 2 g/l
(NH4)6Mo7O2·4H2O 90 mg/l
Na2SeO3·5H2O 100 mg/l
NiCl2·6H2O 50 mg/l
HCl 36% 1 ml/l
The bottles were closed and the agitators were installed. The content in each bottle was
purged with N2 during 2 minutes and the bottles were put in the thermostatic water bath
previously heated at 35.0 °C (unit A) and the motor connections were made. The bottles were
then connected with the correspondent bottles of the unit B, using plastic tubes (Tygon®
tubing). In this unit, each bottle contained 100 mL of NaOH solution (3 M) and 0.5 ml of
Thymolphthlein pH-indicator (0.4%). The latter bottles were connected in the corresponding
cells of the gas volume measuring device (unit C). Finally, using a laptop connected to AMPTS
II, the motors were switched on and the experiment was started. During the experiment, the
cumulative volume and flow of methane were recorded and graphically displayed. The
experiment was finished when no significant methane production was observed, the data
recorded was downloaded and the SMA was calculated. A blank was prepared using only
brackish water instead of substrate solution. All the samples were analyzed in duplicate.
2.1.2.4. SMA calculation
For the SMA calculation the slope (maximum) of the cumulative methane production per
hour was obtained. Taken into account the initial amount of sludge (as VSS) in each
bottle(considered constant during the assay), the relation between methane production and
the COD removed and considering that the methane was measured at room temperature
(20°C), SMA was calculated as follows:
)89(����:;< �,))/!))⁄ = )&�?�(�&��� ℎ) × 24ℎ !⁄⁄,))(�) × 350�&��� ����⁄ ×273.15 + 20°�
273.15 (8)
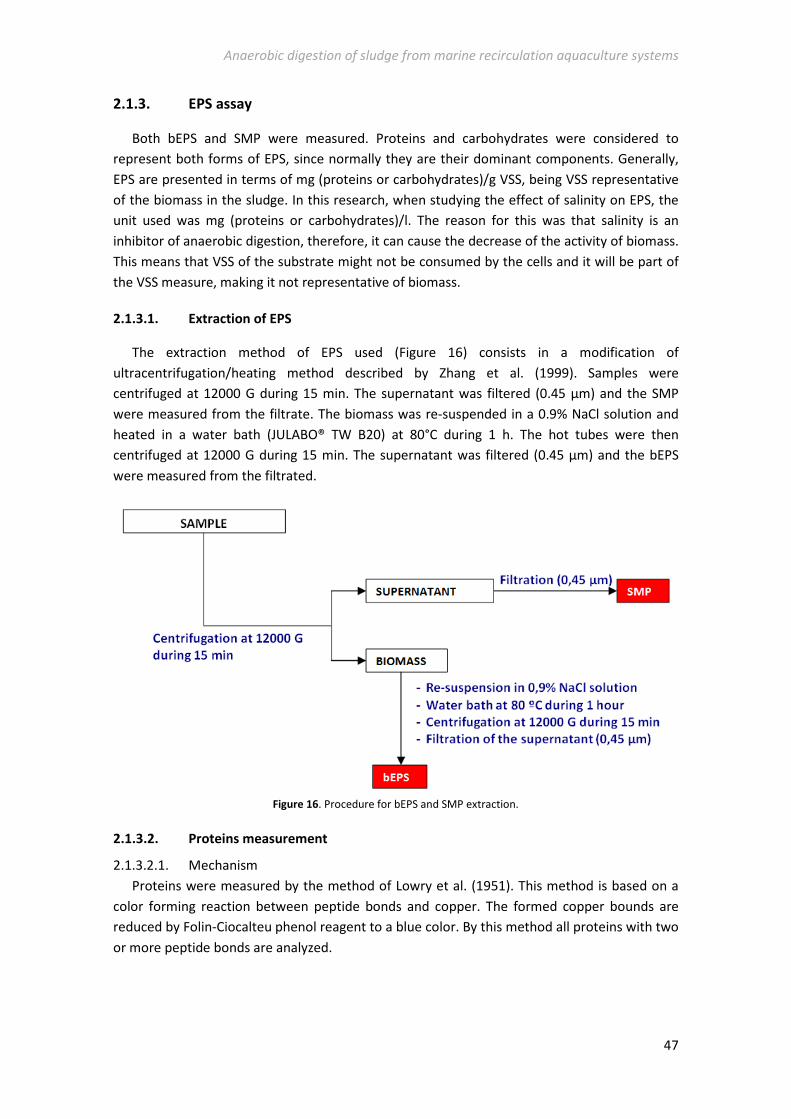
Anaerobic digestion of sludge from marine recirculation aquaculture systems
47
2.1.3. EPS assay
Both bEPS and SMP were measured. Proteins and carbohydrates were considered to
represent both forms of EPS, since normally they are their dominant components. Generally,
EPS are presented in terms of mg (proteins or carbohydrates)/g VSS, being VSS representative
of the biomass in the sludge. In this research, when studying the effect of salinity on EPS, the
unit used was mg (proteins or carbohydrates)/l. The reason for this was that salinity is an
inhibitor of anaerobic digestion, therefore, it can cause the decrease of the activity of biomass.
This means that VSS of the substrate might not be consumed by the cells and it will be part of
the VSS measure, making it not representative of biomass.
2.1.3.1. Extraction of EPS
The extraction method of EPS used (Figure 16) consists in a modification of
ultracentrifugation/heating method described by Zhang et al. (1999). Samples were
centrifuged at 12000 G during 15 min. The supernatant was filtered (0.45 µm) and the SMP
were measured from the filtrate. The biomass was re-suspended in a 0.9% NaCl solution and
heated in a water bath (JULABO® TW B20) at 80°C during 1 h. The hot tubes were then
centrifuged at 12000 G during 15 min. The supernatant was filtered (0.45 µm) and the bEPS
were measured from the filtrated.
Figure 16. Procedure for bEPS and SMP extraction.
2.1.3.2. Proteins measurement
2.1.3.2.1. Mechanism
Proteins were measured by the method of Lowry et al. (1951). This method is based on a
color forming reaction between peptide bonds and copper. The formed copper bounds are
reduced by Folin-Ciocalteu phenol reagent to a blue color. By this method all proteins with two
or more peptide bonds are analyzed.
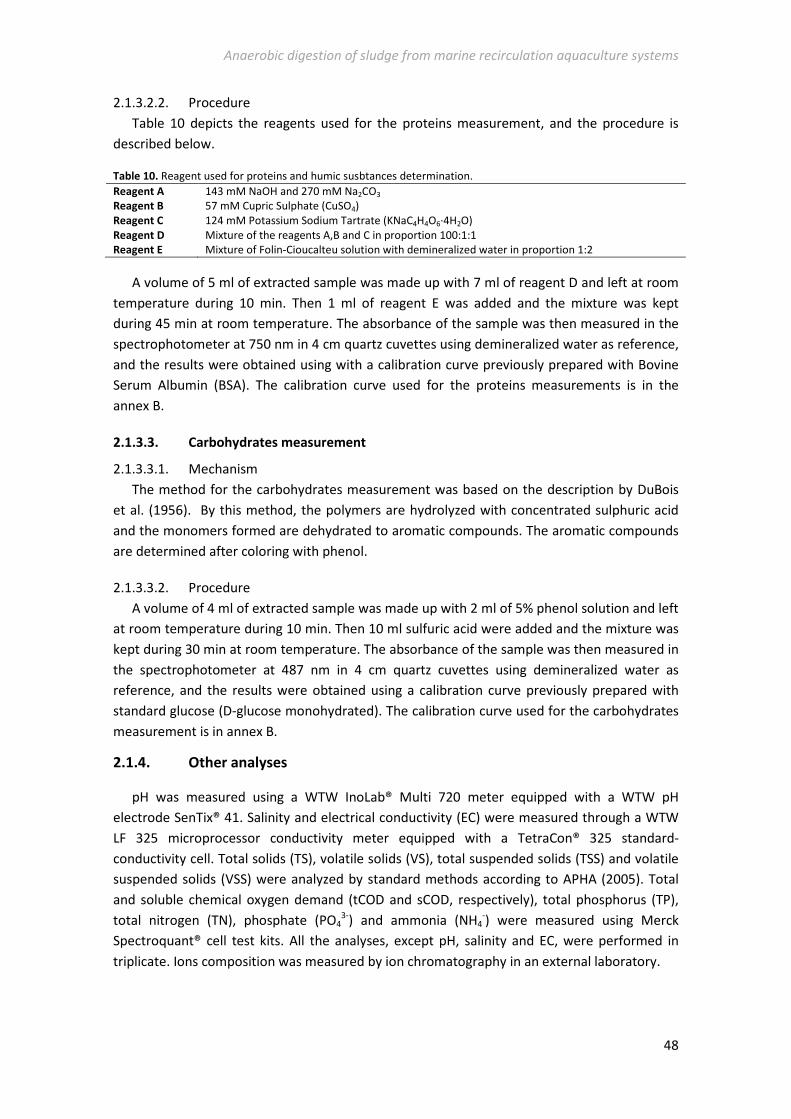
Anaerobic digestion of sludge from marine recirculation aquaculture systems
48
2.1.3.2.2. Procedure
Table 10 depicts the reagents used for the proteins measurement, and the procedure is
described below.
Table 10. Reagent used for proteins and humic susbtances determination.
Reagent A 143 mM NaOH and 270 mM Na2CO3
Reagent B 57 mM Cupric Sulphate (CuSO4)
Reagent C 124 mM Potassium Sodium Tartrate (KNaC4H4O6·4H2O)
Reagent D Mixture of the reagents A,B and C in proportion 100:1:1
Reagent E Mixture of Folin-Cioucalteu solution with demineralized water in proportion 1:2
A volume of 5 ml of extracted sample was made up with 7 ml of reagent D and left at room
temperature during 10 min. Then 1 ml of reagent E was added and the mixture was kept
during 45 min at room temperature. The absorbance of the sample was then measured in the
spectrophotometer at 750 nm in 4 cm quartz cuvettes using demineralized water as reference,
and the results were obtained using with a calibration curve previously prepared with Bovine
Serum Albumin (BSA). The calibration curve used for the proteins measurements is in the
annex B.
2.1.3.3. Carbohydrates measurement
2.1.3.3.1. Mechanism
The method for the carbohydrates measurement was based on the description by DuBois
et al. (1956). By this method, the polymers are hydrolyzed with concentrated sulphuric acid
and the monomers formed are dehydrated to aromatic compounds. The aromatic compounds
are determined after coloring with phenol.
2.1.3.3.2. Procedure
A volume of 4 ml of extracted sample was made up with 2 ml of 5% phenol solution and left
at room temperature during 10 min. Then 10 ml sulfuric acid were added and the mixture was
kept during 30 min at room temperature. The absorbance of the sample was then measured in
the spectrophotometer at 487 nm in 4 cm quartz cuvettes using demineralized water as
reference, and the results were obtained using a calibration curve previously prepared with
standard glucose (D-glucose monohydrated). The calibration curve used for the carbohydrates
measurement is in annex B.
2.1.4. Other analyses
pH was measured using a WTW InoLab® Multi 720 meter equipped with a WTW pH
electrode SenTix® 41. Salinity and electrical conductivity (EC) were measured through a WTW
LF 325 microprocessor conductivity meter equipped with a TetraCon® 325 standard-
conductivity cell. Total solids (TS), volatile solids (VS), total suspended solids (TSS) and volatile
suspended solids (VSS) were analyzed by standard methods according to APHA (2005). Total
and soluble chemical oxygen demand (tCOD and sCOD, respectively), total phosphorus (TP),
total nitrogen (TN), phosphate (PO43-) and ammonia (NH4
-) were measured using Merck
Spectroquant® cell test kits. All the analyses, except pH, salinity and EC, were performed in
triplicate. Ions composition was measured by ion chromatography in an external laboratory.
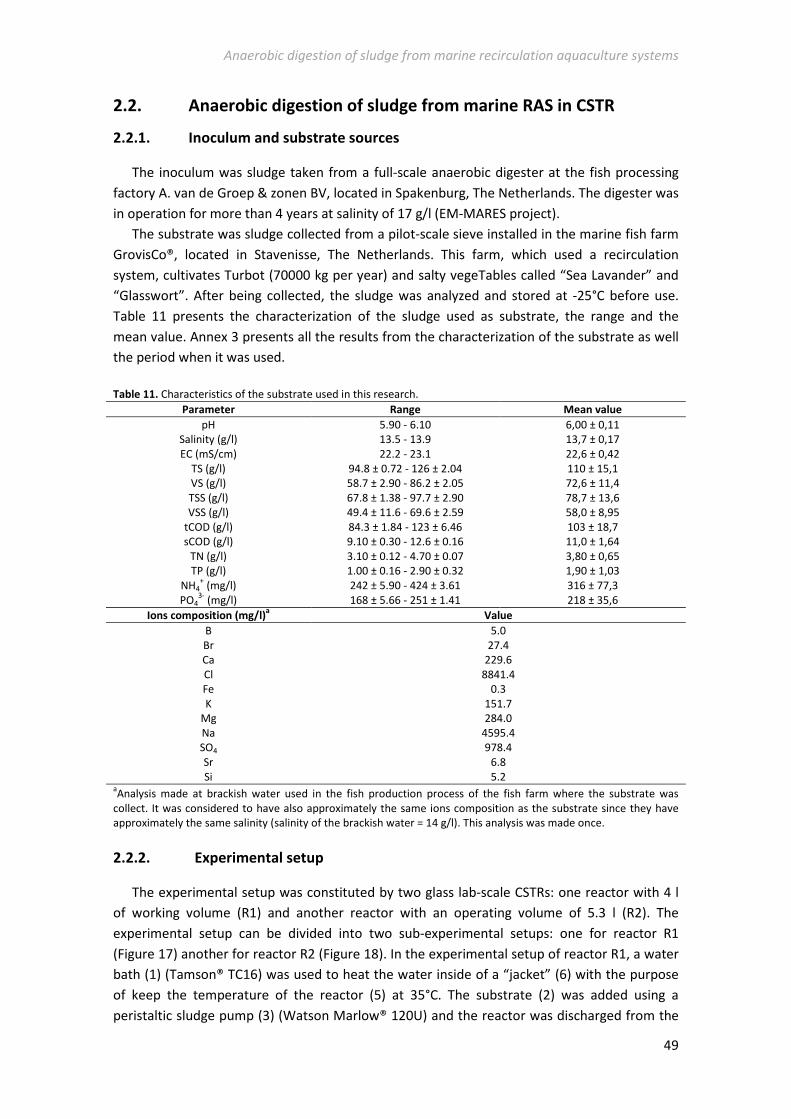
Anaerobic digestion of sludge from marine recirculation aquaculture systems
49
2.2. Anaerobic digestion of sludge from marine RAS in CSTR
2.2.1. Inoculum and substrate sources
The inoculum was sludge taken from a full-scale anaerobic digester at the fish processing
factory A. van de Groep & zonen BV, located in Spakenburg, The Netherlands. The digester was
in operation for more than 4 years at salinity of 17 g/l (EM-MARES project).
The substrate was sludge collected from a pilot-scale sieve installed in the marine fish farm
GrovisCo®, located in Stavenisse, The Netherlands. This farm, which used a recirculation
system, cultivates Turbot (70000 kg per year) and salty vegeTables called “Sea Lavander” and
“Glasswort”. After being collected, the sludge was analyzed and stored at -25°C before use.
Table 11 presents the characterization of the sludge used as substrate, the range and the
mean value. Annex 3 presents all the results from the characterization of the substrate as well
the period when it was used.
Table 11. Characteristics of the substrate used in this research.
Parameter Range Mean value
pH 5.90 - 6.10 6,00 ± 0,11
Salinity (g/l) 13.5 - 13.9 13,7 ± 0,17
EC (mS/cm) 22.2 - 23.1 22,6 ± 0,42
TS (g/l) 94.8 ± 0.72 - 126 ± 2.04 110 ± 15,1
VS (g/l) 58.7 ± 2.90 - 86.2 ± 2.05 72,6 ± 11,4
TSS (g/l) 67.8 ± 1.38 - 97.7 ± 2.90 78,7 ± 13,6
VSS (g/l) 49.4 ± 11.6 - 69.6 ± 2.59 58,0 ± 8,95
tCOD (g/l) 84.3 ± 1.84 - 123 ± 6.46 103 ± 18,7
sCOD (g/l) 9.10 ± 0.30 - 12.6 ± 0.16 11,0 ± 1,64
TN (g/l) 3.10 ± 0.12 - 4.70 ± 0.07 3,80 ± 0,65
TP (g/l) 1.00 ± 0.16 - 2.90 ± 0.32 1,90 ± 1,03
NH4+ (mg/l) 242 ± 5.90 - 424 ± 3.61 316 ± 77,3
PO43-
(mg/l) 168 ± 5.66 - 251 ± 1.41 218 ± 35,6
Ions composition (mg/l)a Value
B 5.0
27.4
229.6
8841.4
0.3
151.7
284.0
4595.4
978.4
6.8
5.2
Br
Ca
Cl
Fe
K
Mg
Na
SO4
Sr
Si aAnalysis made at brackish water used in the fish production process of the fish farm where the substrate was
collect. It was considered to have also approximately the same ions composition as the substrate since they have
approximately the same salinity (salinity of the brackish water = 14 g/l). This analysis was made once.
2.2.2. Experimental setup
The experimental setup was constituted by two glass lab-scale CSTRs: one reactor with 4 l
of working volume (R1) and another reactor with an operating volume of 5.3 l (R2). The
experimental setup can be divided into two sub-experimental setups: one for reactor R1
(Figure 17) another for reactor R2 (Figure 18). In the experimental setup of reactor R1, a water
bath (1) (Tamson® TC16) was used to heat the water inside of a “jacket” (6) with the purpose
of keep the temperature of the reactor (5) at 35°C. The substrate (2) was added using a
peristaltic sludge pump (3) (Watson Marlow® 120U) and the reactor was discharged from the
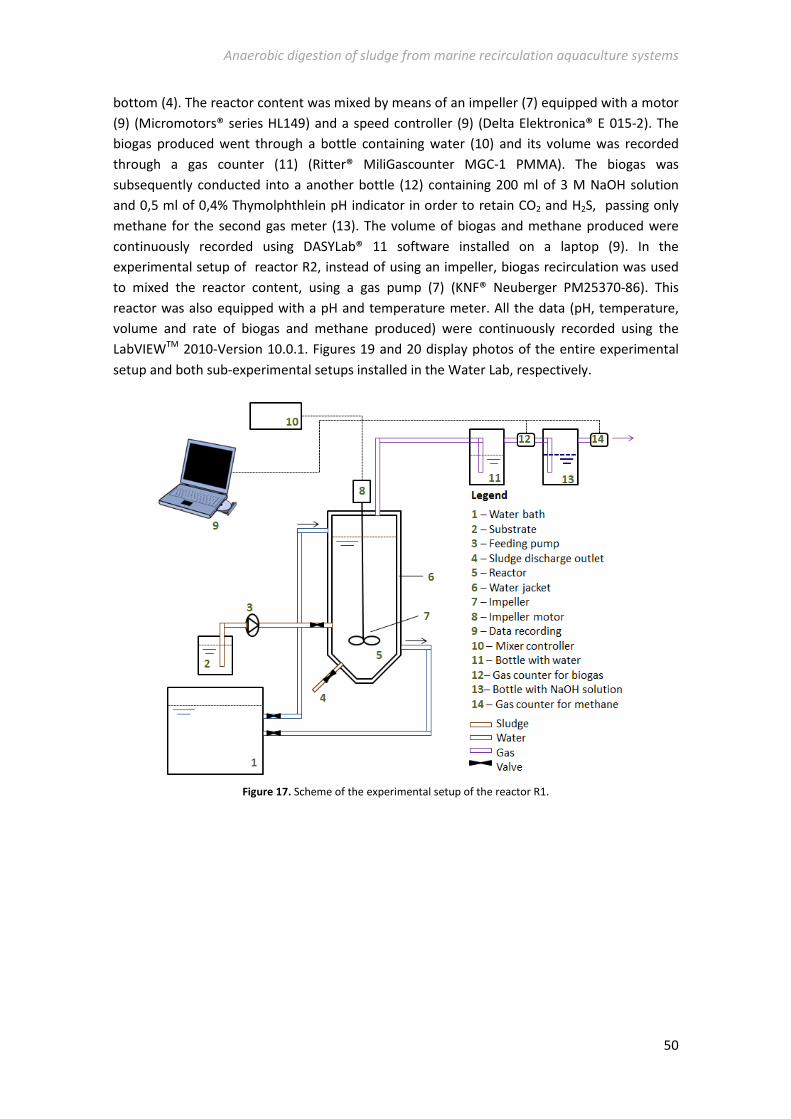
Anaerobic digestion of sludge from marine recirculation aquaculture systems
50
bottom (4). The reactor content was mixed by means of an impeller (7) equipped with a motor
(9) (Micromotors® series HL149) and a speed controller (9) (Delta Elektronica® E 015-2). The
biogas produced went through a bottle containing water (10) and its volume was recorded
through a gas counter (11) (Ritter® MiliGascounter MGC-1 PMMA). The biogas was
subsequently conducted into a another bottle (12) containing 200 ml of 3 M NaOH solution
and 0,5 ml of 0,4% Thymolphthlein pH indicator in order to retain CO2 and H2S, passing only
methane for the second gas meter (13). The volume of biogas and methane produced were
continuously recorded using DASYLab® 11 software installed on a laptop (9). In the
experimental setup of reactor R2, instead of using an impeller, biogas recirculation was used
to mixed the reactor content, using a gas pump (7) (KNF® Neuberger PM25370-86). This
reactor was also equipped with a pH and temperature meter. All the data (pH, temperature,
volume and rate of biogas and methane produced) were continuously recorded using the
LabVIEWTM 2010-Version 10.0.1. Figures 19 and 20 display photos of the entire experimental
setup and both sub-experimental setups installed in the Water Lab, respectively.
Figure 17. Scheme of the experimental setup of the reactor R1.
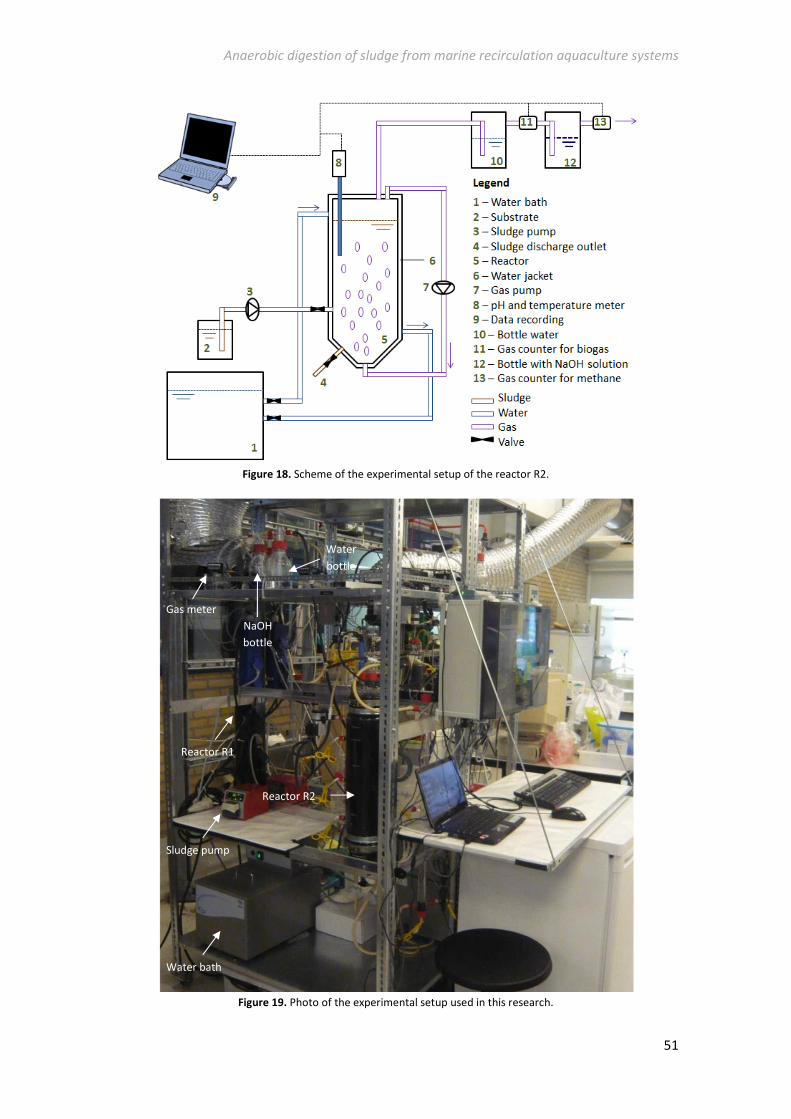
Anaerobic digestion of sludge from marine recirculation aquaculture systems
51
Figure 18. Scheme of the experimental setup of the reactor R2.
Figure 19. Photo of the experimental setup used in this research.
Gas meter
Reactor R2
Water bath
Sludge pump
Reactor R1
NaOH
bottle
Water
bottle
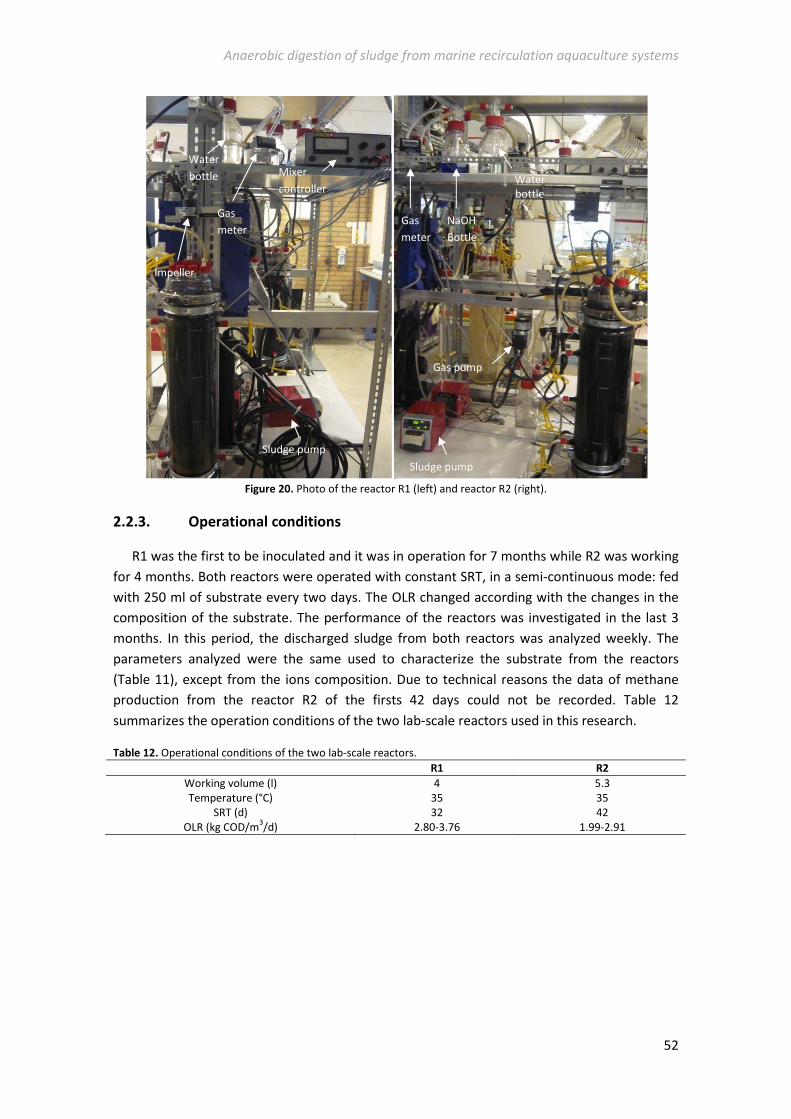
Anaerobic digestion of sludge from marine recirculation aquaculture systems
52
Figure 20. Photo of the reactor R1 (left) and reactor R2 (right).
2.2.3. Operational conditions
R1 was the first to be inoculated and it was in operation for 7 months while R2 was working
for 4 months. Both reactors were operated with constant SRT, in a semi-continuous mode: fed
with 250 ml of substrate every two days. The OLR changed according with the changes in the
composition of the substrate. The performance of the reactors was investigated in the last 3
months. In this period, the discharged sludge from both reactors was analyzed weekly. The
parameters analyzed were the same used to characterize the substrate from the reactors
(Table 11), except from the ions composition. Due to technical reasons the data of methane
production from the reactor R2 of the firsts 42 days could not be recorded. Table 12
summarizes the operation conditions of the two lab-scale reactors used in this research.
Table 12. Operational conditions of the two lab-scale reactors.
R1 R2
Working volume (l) 4 5.3
Temperature (°C) 35 35
SRT (d) 32 42
OLR (kg COD/m3/d) 2.80-3.76 1.99-2.91
Sludge pump
Gas pump
Gas
meter
NaOH
Bottle
Water
bottle
Sludge pump
Gas
meter
Impeller
Water
bottle Mixer
controller
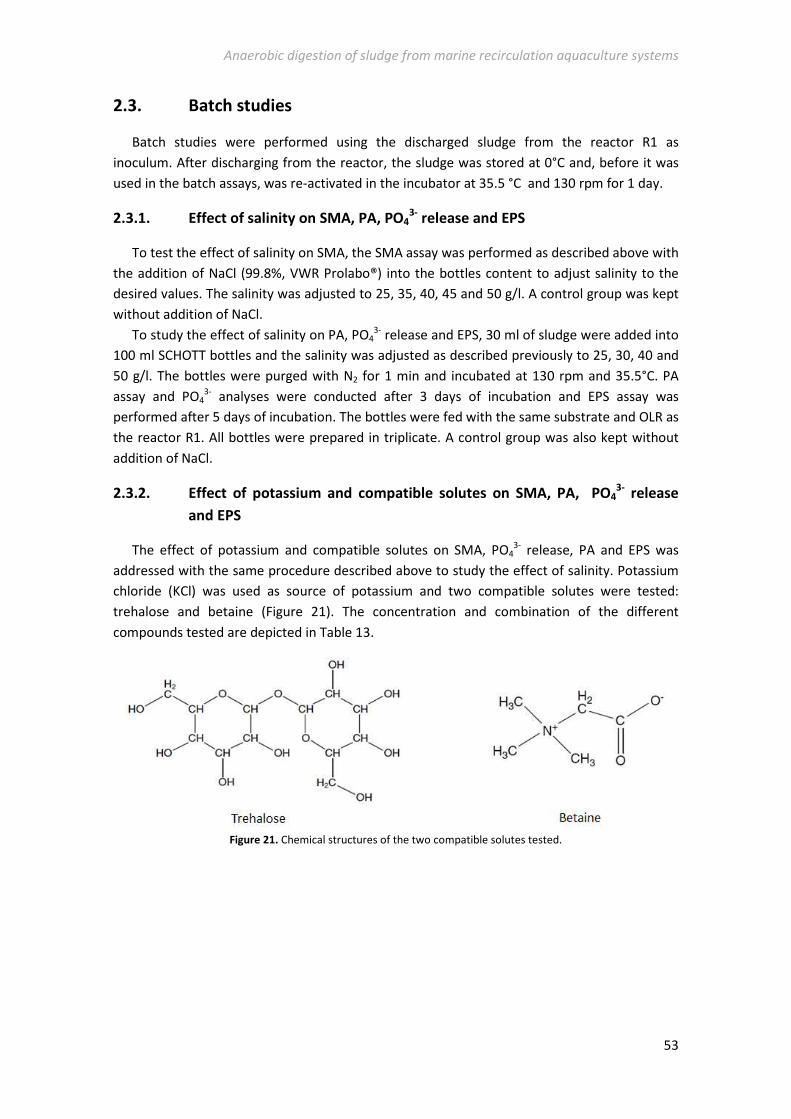
Anaerobic digestion of sludge from marine recirculation aquaculture systems
53
2.3. Batch studies
Batch studies were performed using the discharged sludge from the reactor R1 as
inoculum. After discharging from the reactor, the sludge was stored at 0°C and, before it was
used in the batch assays, was re-activated in the incubator at 35.5 °C and 130 rpm for 1 day.
2.3.1. Effect of salinity on SMA, PA, PO43-
release and EPS
To test the effect of salinity on SMA, the SMA assay was performed as described above with
the addition of NaCl (99.8%, VWR Prolabo®) into the bottles content to adjust salinity to the
desired values. The salinity was adjusted to 25, 35, 40, 45 and 50 g/l. A control group was kept
without addition of NaCl.
To study the effect of salinity on PA, PO43- release and EPS, 30 ml of sludge were added into
100 ml SCHOTT bottles and the salinity was adjusted as described previously to 25, 30, 40 and
50 g/l. The bottles were purged with N2 for 1 min and incubated at 130 rpm and 35.5°C. PA
assay and PO43- analyses were conducted after 3 days of incubation and EPS assay was
performed after 5 days of incubation. The bottles were fed with the same substrate and OLR as
the reactor R1. All bottles were prepared in triplicate. A control group was also kept without
addition of NaCl.
2.3.2. Effect of potassium and compatible solutes on SMA, PA, PO43-
release
and EPS
The effect of potassium and compatible solutes on SMA, PO43- release, PA and EPS was
addressed with the same procedure described above to study the effect of salinity. Potassium
chloride (KCl) was used as source of potassium and two compatible solutes were tested:
trehalose and betaine (Figure 21). The concentration and combination of the different
compounds tested are depicted in Table 13.
Figure 21. Chemical structures of the two compatible solutes tested.
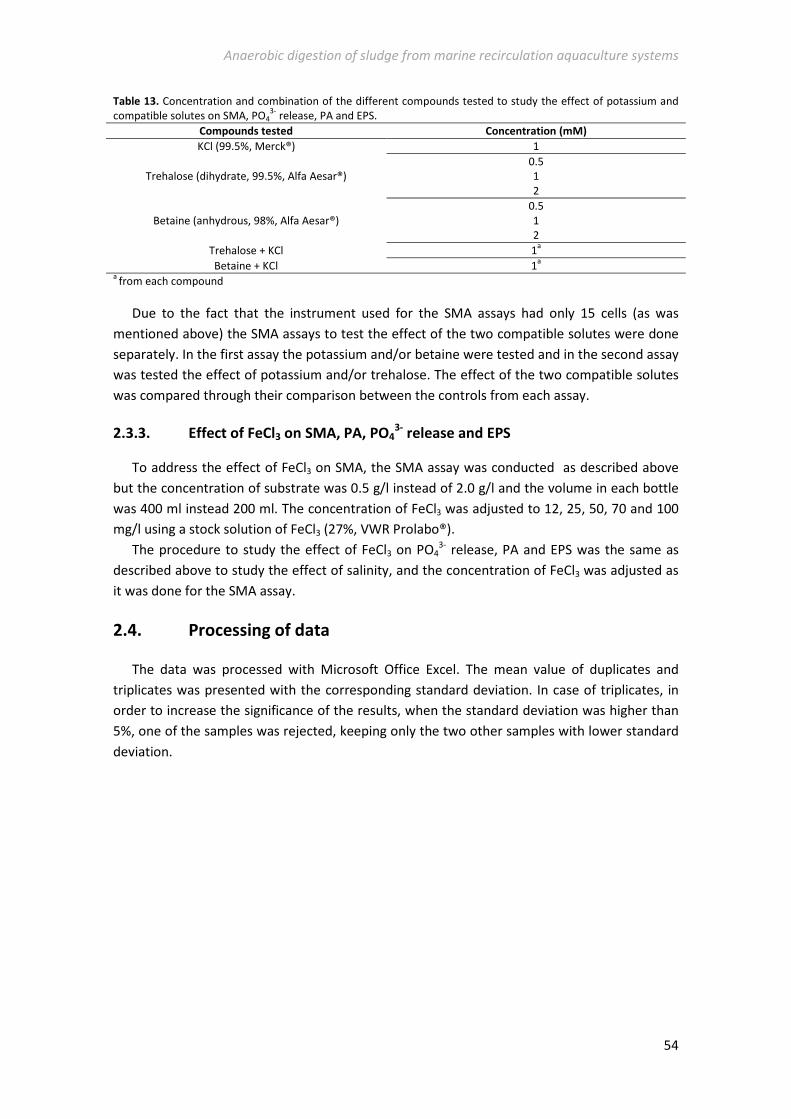
Anaerobic digestion of sludge from marine recirculation aquaculture systems
54
Table 13. Concentration and combination of the different compounds tested to study the effect of potassium and
compatible solutes on SMA, PO43-
release, PA and EPS.
Compounds tested Concentration (mM)
KCl (99.5%, Merck®) 1
Trehalose (dihydrate, 99.5%, Alfa Aesar®)
0.5
1
2
Betaine (anhydrous, 98%, Alfa Aesar®)
0.5
1
2
Trehalose + KCl 1a
Betaine + KCl 1a
a from each compound
Due to the fact that the instrument used for the SMA assays had only 15 cells (as was
mentioned above) the SMA assays to test the effect of the two compatible solutes were done
separately. In the first assay the potassium and/or betaine were tested and in the second assay
was tested the effect of potassium and/or trehalose. The effect of the two compatible solutes
was compared through their comparison between the controls from each assay.
2.3.3. Effect of FeCl3 on SMA, PA, PO43-
release and EPS
To address the effect of FeCl3 on SMA, the SMA assay was conducted as described above
but the concentration of substrate was 0.5 g/l instead of 2.0 g/l and the volume in each bottle
was 400 ml instead 200 ml. The concentration of FeCl3 was adjusted to 12, 25, 50, 70 and 100
mg/l using a stock solution of FeCl3 (27%, VWR Prolabo®).
The procedure to study the effect of FeCl3 on PO43- release, PA and EPS was the same as
described above to study the effect of salinity, and the concentration of FeCl3 was adjusted as
it was done for the SMA assay.
2.4. Processing of data
The data was processed with Microsoft Office Excel. The mean value of duplicates and
triplicates was presented with the corresponding standard deviation. In case of triplicates, in
order to increase the significance of the results, when the standard deviation was higher than
5%, one of the samples was rejected, keeping only the two other samples with lower standard
deviation.
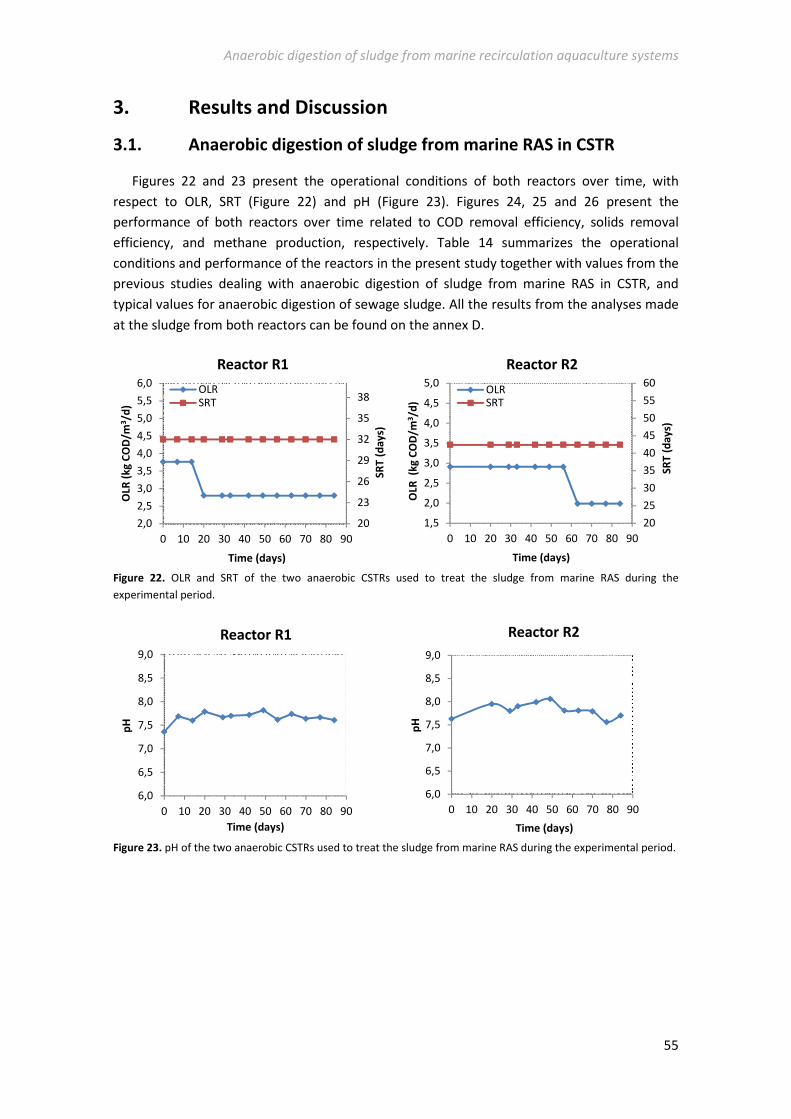
Anaerobic digestion of sludge from marine recirculation aquaculture systems
55
3. Results and Discussion
3.1. Anaerobic digestion of sludge from marine RAS in CSTR
Figures 22 and 23 present the operational conditions of both reactors over time, with
respect to OLR, SRT (Figure 22) and pH (Figure 23). Figures 24, 25 and 26 present the
performance of both reactors over time related to COD removal efficiency, solids removal
efficiency, and methane production, respectively. Table 14 summarizes the operational
conditions and performance of the reactors in the present study together with values from the
previous studies dealing with anaerobic digestion of sludge from marine RAS in CSTR, and
typical values for anaerobic digestion of sewage sludge. All the results from the analyses made
at the sludge from both reactors can be found on the annex D.
Figure 22. OLR and SRT of the two anaerobic CSTRs used to treat the sludge from marine RAS during the
experimental period.
Figure 23. pH of the two anaerobic CSTRs used to treat the sludge from marine RAS during the experimental period.
20
23
26
29
32
35
38
2,0
2,5
3,0
3,5
4,0
4,5
5,0
5,5
6,0
0 10 20 30 40 50 60 70 80 90
SR
T (
da
ys)
OLR
(k
g C
OD
/m3/d
)
Time (days)
Reactor R1
OLRSRT
20
25
30
35
40
45
50
55
60
1,5
2,0
2,5
3,0
3,5
4,0
4,5
5,0
0 10 20 30 40 50 60 70 80 90
SR
T (
da
ys)
OLR
(k
g C
OD
/m3/d
)
Time (days)
Reactor R2
OLRSRT
6,0
6,5
7,0
7,5
8,0
8,5
9,0
0 10 20 30 40 50 60 70 80 90
pH
Time (days)
Reactor R1
6,0
6,5
7,0
7,5
8,0
8,5
9,0
0 10 20 30 40 50 60 70 80 90
pH
Time (days)
Reactor R2
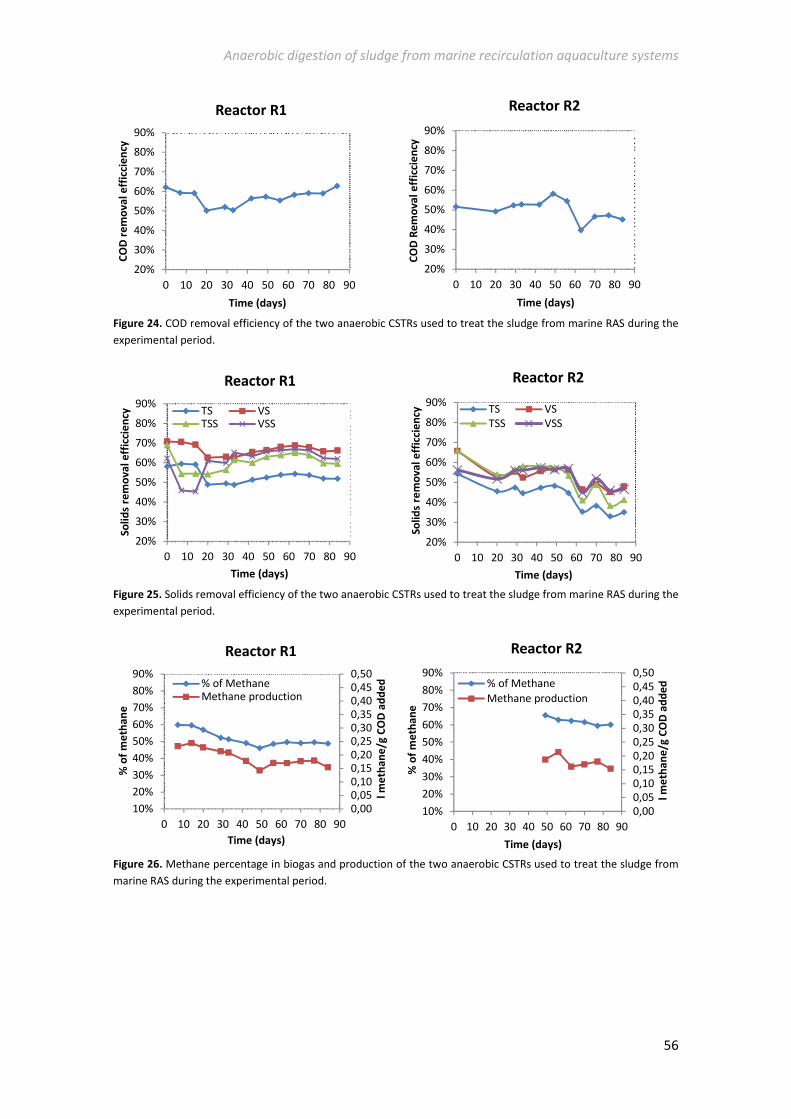
Anaerobic digestion of sludge from marine recirculation aquaculture systems
56
Figure 24. COD removal efficiency of the two anaerobic CSTRs used to treat the sludge from marine RAS during the
experimental period.
Figure 25. Solids removal efficiency of the two anaerobic CSTRs used to treat the sludge from marine RAS during the
experimental period.
Figure 26. Methane percentage in biogas and production of the two anaerobic CSTRs used to treat the sludge from
marine RAS during the experimental period.
20%
30%
40%
50%
60%
70%
80%
90%
0 10 20 30 40 50 60 70 80 90
CO
D r
em
ov
al
eff
icci
en
cy
Time (days)
Reactor R1
20%
30%
40%
50%
60%
70%
80%
90%
0 10 20 30 40 50 60 70 80 90
CO
D R
em
ov
al
eff
icci
en
cy
Time (days)
Reactor R2
20%
30%
40%
50%
60%
70%
80%
90%
0 10 20 30 40 50 60 70 80 90
So
lid
s re
mo
va
l e
ffic
cie
ncy
Time (days)
Reactor R1
TS VSTSS VSS
20%
30%
40%
50%
60%
70%
80%
90%
0 10 20 30 40 50 60 70 80 90
So
lid
s re
mo
va
l e
ffic
cie
ncy
Time (days)
Reactor R2
TS VS
TSS VSS
0,000,050,100,150,200,250,300,350,400,450,50
10%
20%
30%
40%
50%
60%
70%
80%
90%
0 10 20 30 40 50 60 70 80 90
l m
eth
an
e/g
CO
D a
dd
ed
% o
f m
eth
an
e
Time (days)
Reactor R1
% of MethaneMethane production
0,00
0,05
0,10
0,15
0,20
0,25
0,30
0,35
0,40
0,45
0,50
10%
20%
30%
40%
50%
60%
70%
80%
90%
0 10 20 30 40 50 60 70 80 90
l m
eth
an
e/g
CO
D a
dd
ed
% o
f m
eth
an
e
Time (days)
Reactor R2
% of Methane
Methane production
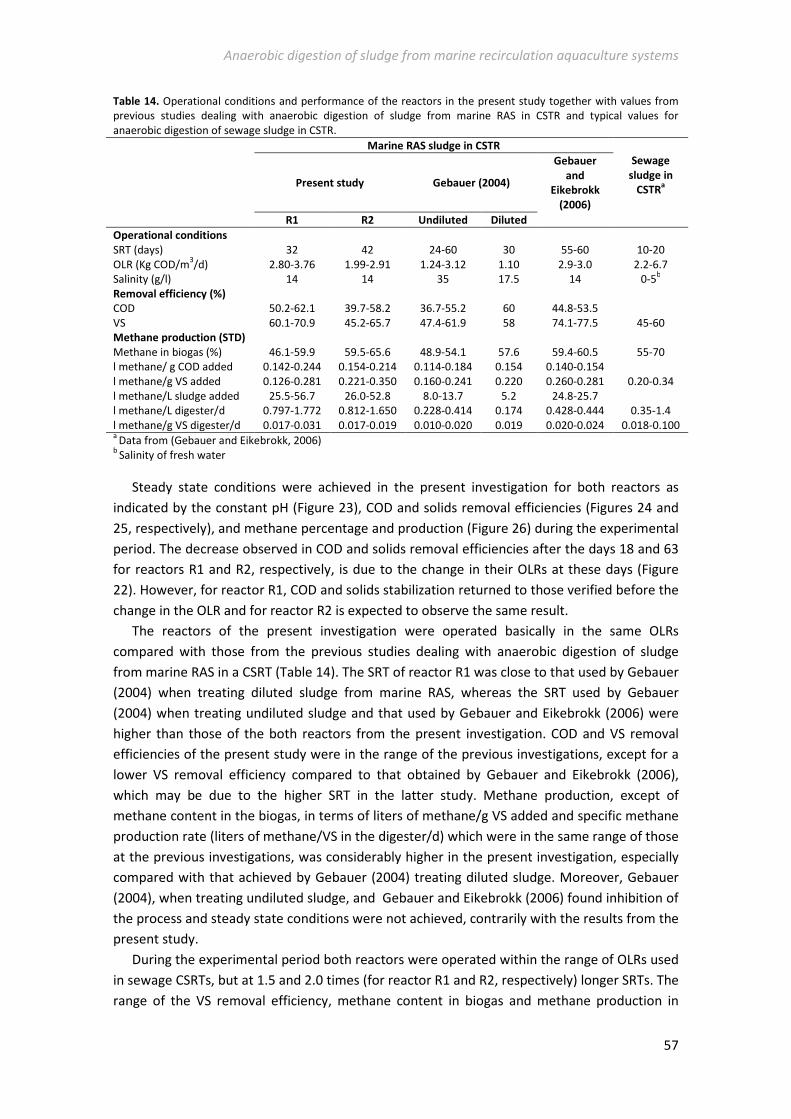
Anaerobic digestion of sludge from marine recirculation aquaculture systems
57
Table 14. Operational conditions and performance of the reactors in the present study together with values from
previous studies dealing with anaerobic digestion of sludge from marine RAS in CSTR and typical values for
anaerobic digestion of sewage sludge in CSTR.
Marine RAS sludge in CSTR
Sewage
sludge in
CSTRa
Present study Gebauer (2004)
Gebauer
and
Eikebrokk
(2006)
R1 R2 Undiluted Diluted
Operational conditions
SRT (days) 32 42 24-60 30 55-60 10-20
OLR (Kg COD/m3/d) 2.80-3.76 1.99-2.91 1.24-3.12 1.10 2.9-3.0 2.2-6.7
Salinity (g/l) 14 14 35 17.5 14 0-5b
Removal efficiency (%)
COD 50.2-62.1 39.7-58.2 36.7-55.2 60 44.8-53.5
VS 60.1-70.9 45.2-65.7 47.4-61.9 58 74.1-77.5 45-60
Methane production (STD)
Methane in biogas (%) 46.1-59.9 59.5-65.6 48.9-54.1 57.6 59.4-60.5 55-70
l methane/ g COD added 0.142-0.244 0.154-0.214 0.114-0.184 0.154 0.140-0.154
l methane/g VS added 0.126-0.281 0.221-0.350 0.160-0.241 0.220 0.260-0.281 0.20-0.34
l methane/L sludge added 25.5-56.7 26.0-52.8 8.0-13.7 5.2 24.8-25.7
l methane/L digester/d 0.797-1.772 0.812-1.650 0.228-0.414 0.174 0.428-0.444 0.35-1.4
l methane/g VS digester/d 0.017-0.031 0.017-0.019 0.010-0.020 0.019 0.020-0.024 0.018-0.100 a
Data from (Gebauer and Eikebrokk, 2006) b
Salinity of fresh water
Steady state conditions were achieved in the present investigation for both reactors as
indicated by the constant pH (Figure 23), COD and solids removal efficiencies (Figures 24 and
25, respectively), and methane percentage and production (Figure 26) during the experimental
period. The decrease observed in COD and solids removal efficiencies after the days 18 and 63
for reactors R1 and R2, respectively, is due to the change in their OLRs at these days (Figure
22). However, for reactor R1, COD and solids stabilization returned to those verified before the
change in the OLR and for reactor R2 is expected to observe the same result.
The reactors of the present investigation were operated basically in the same OLRs
compared with those from the previous studies dealing with anaerobic digestion of sludge
from marine RAS in a CSRT (Table 14). The SRT of reactor R1 was close to that used by Gebauer
(2004) when treating diluted sludge from marine RAS, whereas the SRT used by Gebauer
(2004) when treating undiluted sludge and that used by Gebauer and Eikebrokk (2006) were
higher than those of the both reactors from the present investigation. COD and VS removal
efficiencies of the present study were in the range of the previous investigations, except for a
lower VS removal efficiency compared to that obtained by Gebauer and Eikebrokk (2006),
which may be due to the higher SRT in the latter study. Methane production, except of
methane content in the biogas, in terms of liters of methane/g VS added and specific methane
production rate (liters of methane/VS in the digester/d) which were in the same range of those
at the previous investigations, was considerably higher in the present investigation, especially
compared with that achieved by Gebauer (2004) treating diluted sludge. Moreover, Gebauer
(2004), when treating undiluted sludge, and Gebauer and Eikebrokk (2006) found inhibition of
the process and steady state conditions were not achieved, contrarily with the results from the
present study.
During the experimental period both reactors were operated within the range of OLRs used
in sewage CSRTs, but at 1.5 and 2.0 times (for reactor R1 and R2, respectively) longer SRTs. The
range of the VS removal efficiency, methane content in biogas and methane production in
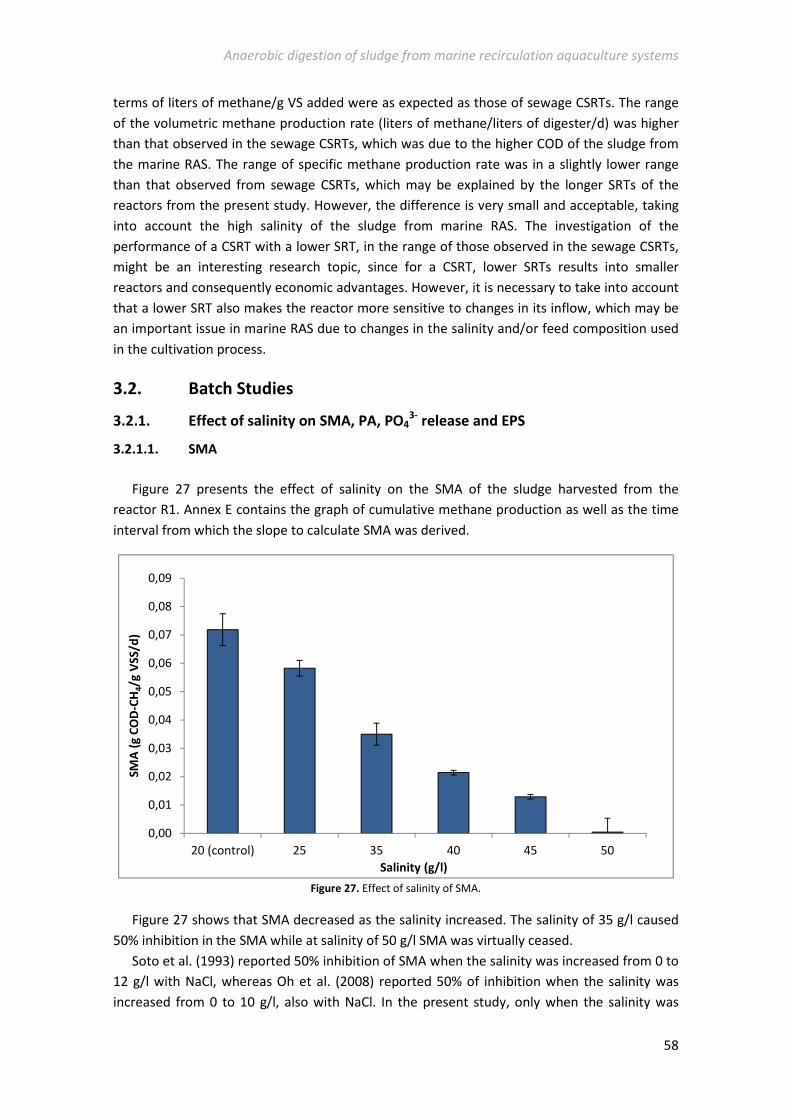
Anaerobic digestion of sludge from marine recirculation aquaculture systems
58
terms of liters of methane/g VS added were as expected as those of sewage CSRTs. The range
of the volumetric methane production rate (liters of methane/liters of digester/d) was higher
than that observed in the sewage CSRTs, which was due to the higher COD of the sludge from
the marine RAS. The range of specific methane production rate was in a slightly lower range
than that observed from sewage CSRTs, which may be explained by the longer SRTs of the
reactors from the present study. However, the difference is very small and acceptable, taking
into account the high salinity of the sludge from marine RAS. The investigation of the
performance of a CSRT with a lower SRT, in the range of those observed in the sewage CSRTs,
might be an interesting research topic, since for a CSRT, lower SRTs results into smaller
reactors and consequently economic advantages. However, it is necessary to take into account
that a lower SRT also makes the reactor more sensitive to changes in its inflow, which may be
an important issue in marine RAS due to changes in the salinity and/or feed composition used
in the cultivation process.
3.2. Batch Studies
3.2.1. Effect of salinity on SMA, PA, PO43-
release and EPS
3.2.1.1. SMA
Figure 27 presents the effect of salinity on the SMA of the sludge harvested from the
reactor R1. Annex E contains the graph of cumulative methane production as well as the time
interval from which the slope to calculate SMA was derived.
Figure 27. Effect of salinity of SMA.
Figure 27 shows that SMA decreased as the salinity increased. The salinity of 35 g/l caused
50% inhibition in the SMA while at salinity of 50 g/l SMA was virtually ceased.
Soto et al. (1993) reported 50% inhibition of SMA when the salinity was increased from 0 to
12 g/l with NaCl, whereas Oh et al. (2008) reported 50% of inhibition when the salinity was
increased from 0 to 10 g/l, also with NaCl. In the present study, only when the salinity was
0,00
0,01
0,02
0,03
0,04
0,05
0,06
0,07
0,08
0,09
20 (control) 25 35 40 45 50
SM
A (
g C
OD
-CH
4/g
VS
S/d
)
Salinity (g/l)
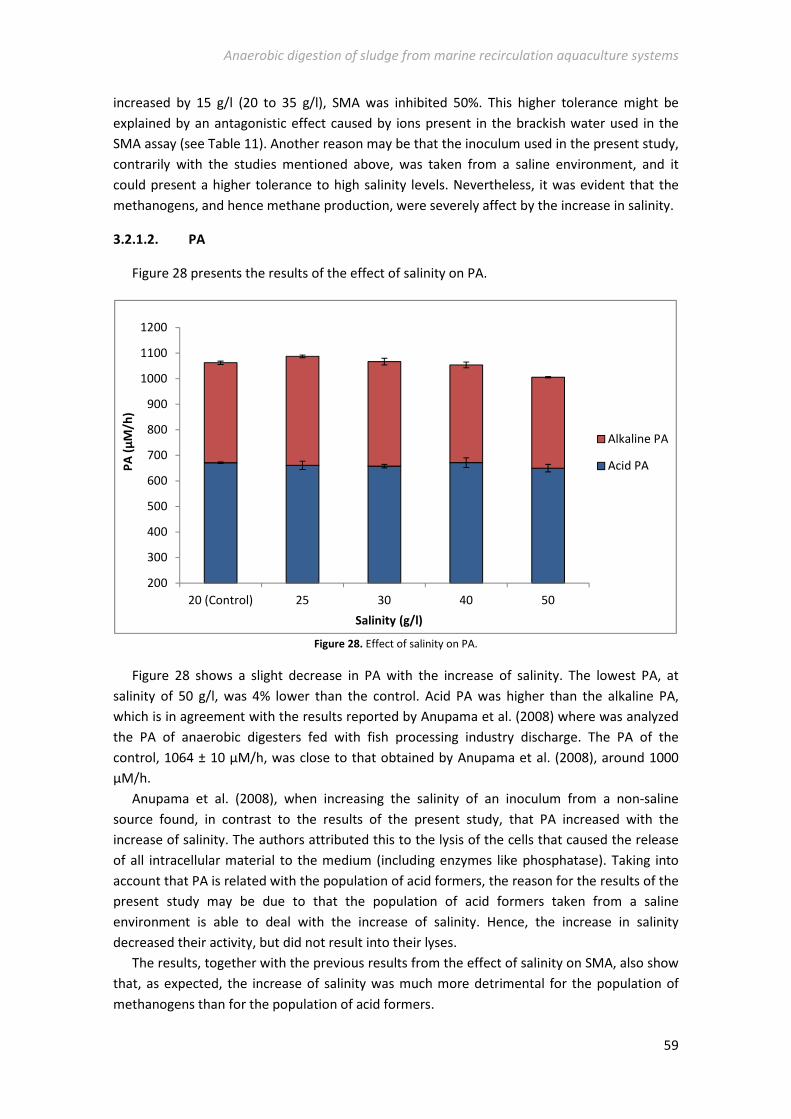
Anaerobic digestion of sludge from marine recirculation aquaculture systems
59
increased by 15 g/l (20 to 35 g/l), SMA was inhibited 50%. This higher tolerance might be
explained by an antagonistic effect caused by ions present in the brackish water used in the
SMA assay (see Table 11). Another reason may be that the inoculum used in the present study,
contrarily with the studies mentioned above, was taken from a saline environment, and it
could present a higher tolerance to high salinity levels. Nevertheless, it was evident that the
methanogens, and hence methane production, were severely affect by the increase in salinity.
3.2.1.2. PA
Figure 28 presents the results of the effect of salinity on PA.
Figure 28. Effect of salinity on PA.
Figure 28 shows a slight decrease in PA with the increase of salinity. The lowest PA, at
salinity of 50 g/l, was 4% lower than the control. Acid PA was higher than the alkaline PA,
which is in agreement with the results reported by Anupama et al. (2008) where was analyzed
the PA of anaerobic digesters fed with fish processing industry discharge. The PA of the
control, 1064 ± 10 µM/h, was close to that obtained by Anupama et al. (2008), around 1000
µM/h.
Anupama et al. (2008), when increasing the salinity of an inoculum from a non-saline
source found, in contrast to the results of the present study, that PA increased with the
increase of salinity. The authors attributed this to the lysis of the cells that caused the release
of all intracellular material to the medium (including enzymes like phosphatase). Taking into
account that PA is related with the population of acid formers, the reason for the results of the
present study may be due to that the population of acid formers taken from a saline
environment is able to deal with the increase of salinity. Hence, the increase in salinity
decreased their activity, but did not result into their lyses.
The results, together with the previous results from the effect of salinity on SMA, also show
that, as expected, the increase of salinity was much more detrimental for the population of
methanogens than for the population of acid formers.
200
300
400
500
600
700
800
900
1000
1100
1200
20 (Control) 25 30 40 50
PA
(µ
M/h
)
Salinity (g/l)
Alkaline PA
Acid PA
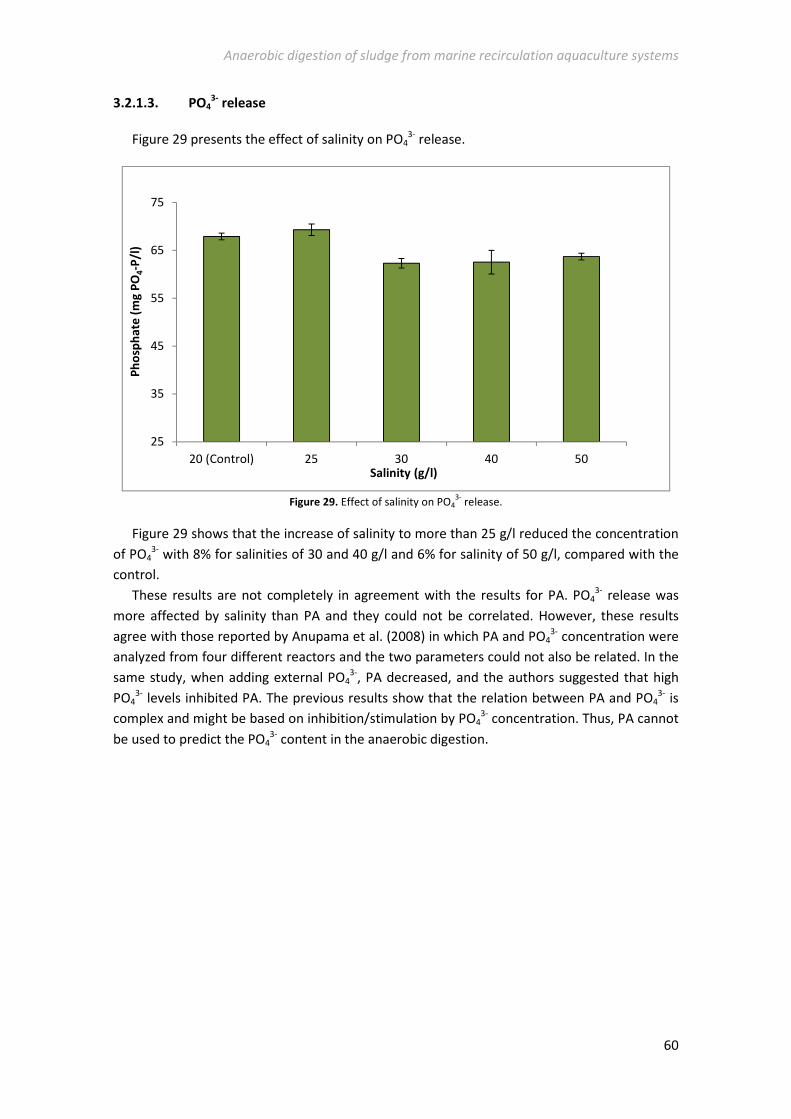
Anaerobic digestion of sludge from marine recirculation aquaculture systems
60
3.2.1.3. PO43-
release
Figure 29 presents the effect of salinity on PO43- release.
Figure 29. Effect of salinity on PO4
3- release.
Figure 29 shows that the increase of salinity to more than 25 g/l reduced the concentration
of PO43- with 8% for salinities of 30 and 40 g/l and 6% for salinity of 50 g/l, compared with the
control.
These results are not completely in agreement with the results for PA. PO43- release was
more affected by salinity than PA and they could not be correlated. However, these results
agree with those reported by Anupama et al. (2008) in which PA and PO43- concentration were
analyzed from four different reactors and the two parameters could not also be related. In the
same study, when adding external PO43-, PA decreased, and the authors suggested that high
PO43- levels inhibited PA. The previous results show that the relation between PA and PO4
3- is
complex and might be based on inhibition/stimulation by PO43- concentration. Thus, PA cannot
be used to predict the PO43- content in the anaerobic digestion.
25
35
45
55
65
75
20 (Control) 25 30 40 50
Ph
osp
ha
te (
mg
PO
4-P
/l)
Salinity (g/l)
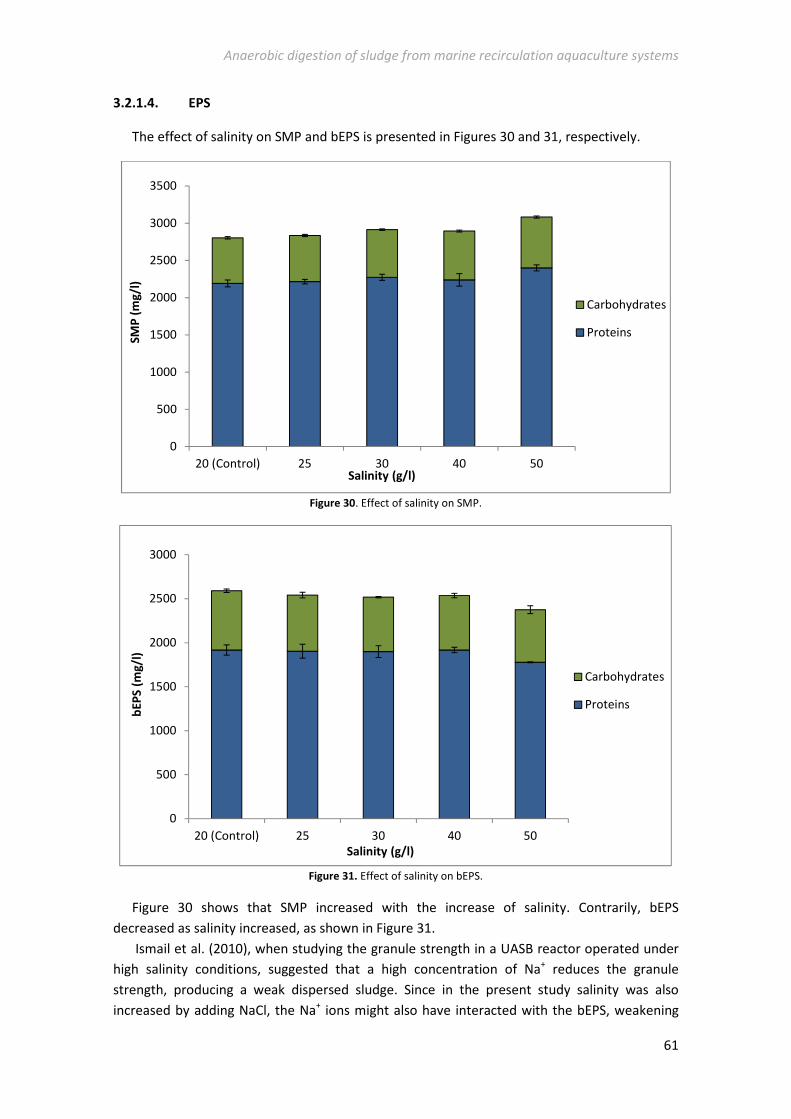
Anaerobic digestion of sludge from marine recirculation aquaculture systems
61
3.2.1.4. EPS
The effect of salinity on SMP and bEPS is presented in Figures 30 and 31, respectively.
Figure 30. Effect of salinity on SMP.
Figure 31. Effect of salinity on bEPS.
Figure 30 shows that SMP increased with the increase of salinity. Contrarily, bEPS
decreased as salinity increased, as shown in Figure 31.
Ismail et al. (2010), when studying the granule strength in a UASB reactor operated under
high salinity conditions, suggested that a high concentration of Na+ reduces the granule
strength, producing a weak dispersed sludge. Since in the present study salinity was also
increased by adding NaCl, the Na+ ions might also have interacted with the bEPS, weakening
0
500
1000
1500
2000
2500
3000
3500
20 (Control) 25 30 40 50
SM
P (
mg
/l)
Salinity (g/l)
Carbohydrates
Proteins
0
500
1000
1500
2000
2500
3000
20 (Control) 25 30 40 50
bE
PS
(m
g/l
)
Salinity (g/l)
Carbohydrates
Proteins
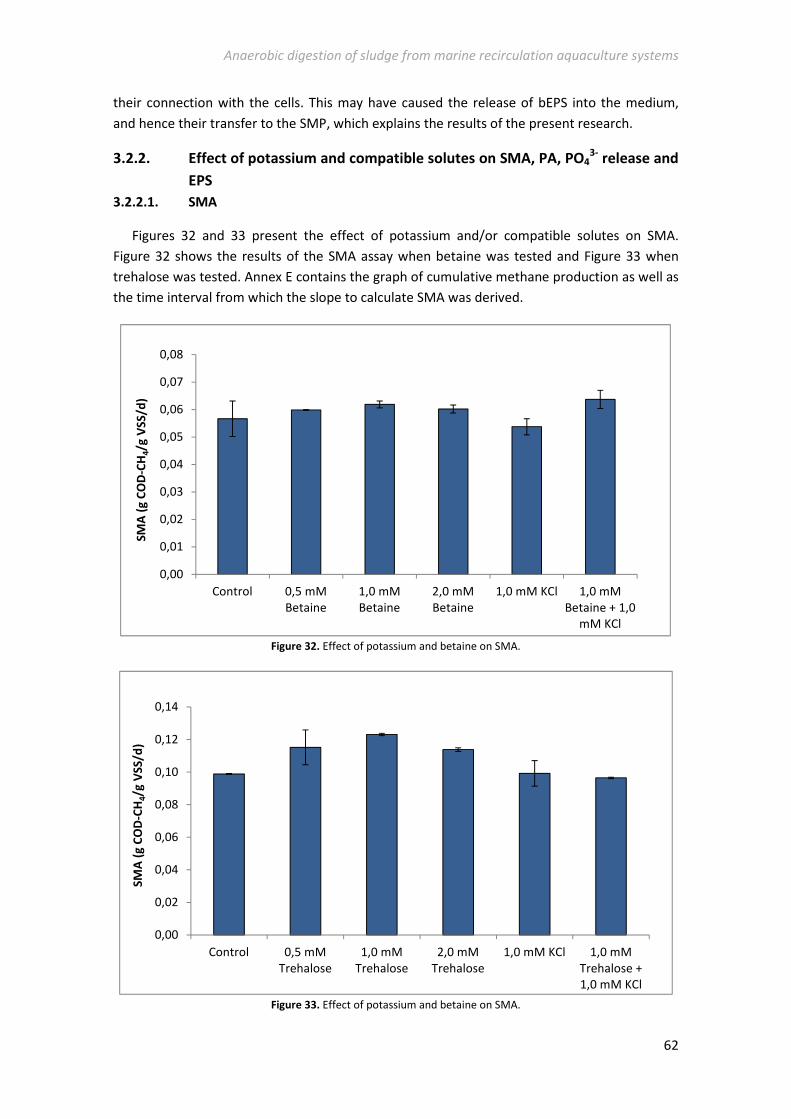
Anaerobic digestion of sludge from marine recirculation aquaculture systems
62
their connection with the cells. This may have caused the release of bEPS into the medium,
and hence their transfer to the SMP, which explains the results of the present research.
3.2.2. Effect of potassium and compatible solutes on SMA, PA, PO43-
release and
EPS
3.2.2.1. SMA
Figures 32 and 33 present the effect of potassium and/or compatible solutes on SMA.
Figure 32 shows the results of the SMA assay when betaine was tested and Figure 33 when
trehalose was tested. Annex E contains the graph of cumulative methane production as well as
the time interval from which the slope to calculate SMA was derived.
Figure 32. Effect of potassium and betaine on SMA.
Figure 33. Effect of potassium and betaine on SMA.
0,00
0,01
0,02
0,03
0,04
0,05
0,06
0,07
0,08
Control 0,5 mM
Betaine
1,0 mM
Betaine
2,0 mM
Betaine
1,0 mM KCl 1,0 mM
Betaine + 1,0
mM KCl
SM
A (
g C
OD
-CH
4/g
VS
S/d
)
0,00
0,02
0,04
0,06
0,08
0,10
0,12
0,14
Control 0,5 mM
Trehalose
1,0 mM
Trehalose
2,0 mM
Trehalose
1,0 mM KCl 1,0 mM
Trehalose +
1,0 mM KCl
SM
A (
g C
OD
-CH
4/g
VS
S/d
)
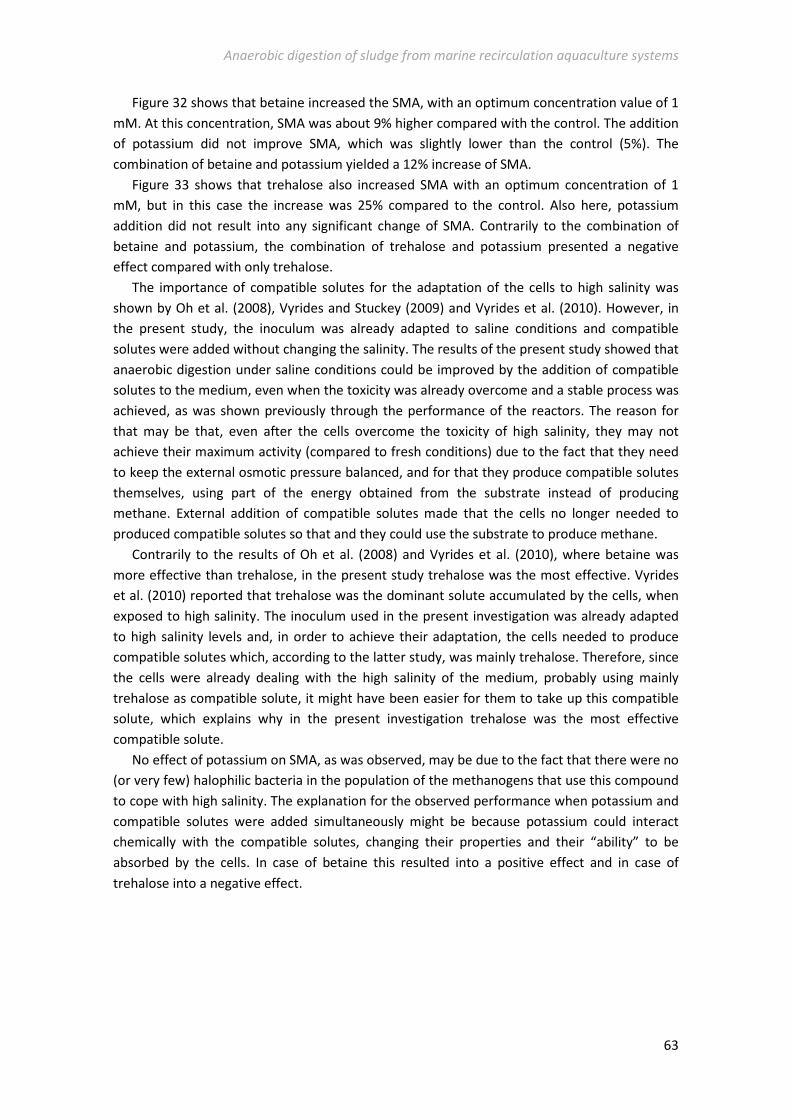
Anaerobic digestion of sludge from marine recirculation aquaculture systems
63
Figure 32 shows that betaine increased the SMA, with an optimum concentration value of 1
mM. At this concentration, SMA was about 9% higher compared with the control. The addition
of potassium did not improve SMA, which was slightly lower than the control (5%). The
combination of betaine and potassium yielded a 12% increase of SMA.
Figure 33 shows that trehalose also increased SMA with an optimum concentration of 1
mM, but in this case the increase was 25% compared to the control. Also here, potassium
addition did not result into any significant change of SMA. Contrarily to the combination of
betaine and potassium, the combination of trehalose and potassium presented a negative
effect compared with only trehalose.
The importance of compatible solutes for the adaptation of the cells to high salinity was
shown by Oh et al. (2008), Vyrides and Stuckey (2009) and Vyrides et al. (2010). However, in
the present study, the inoculum was already adapted to saline conditions and compatible
solutes were added without changing the salinity. The results of the present study showed that
anaerobic digestion under saline conditions could be improved by the addition of compatible
solutes to the medium, even when the toxicity was already overcome and a stable process was
achieved, as was shown previously through the performance of the reactors. The reason for
that may be that, even after the cells overcome the toxicity of high salinity, they may not
achieve their maximum activity (compared to fresh conditions) due to the fact that they need
to keep the external osmotic pressure balanced, and for that they produce compatible solutes
themselves, using part of the energy obtained from the substrate instead of producing
methane. External addition of compatible solutes made that the cells no longer needed to
produced compatible solutes so that and they could use the substrate to produce methane.
Contrarily to the results of Oh et al. (2008) and Vyrides et al. (2010), where betaine was
more effective than trehalose, in the present study trehalose was the most effective. Vyrides
et al. (2010) reported that trehalose was the dominant solute accumulated by the cells, when
exposed to high salinity. The inoculum used in the present investigation was already adapted
to high salinity levels and, in order to achieve their adaptation, the cells needed to produce
compatible solutes which, according to the latter study, was mainly trehalose. Therefore, since
the cells were already dealing with the high salinity of the medium, probably using mainly
trehalose as compatible solute, it might have been easier for them to take up this compatible
solute, which explains why in the present investigation trehalose was the most effective
compatible solute.
No effect of potassium on SMA, as was observed, may be due to the fact that there were no
(or very few) halophilic bacteria in the population of the methanogens that use this compound
to cope with high salinity. The explanation for the observed performance when potassium and
compatible solutes were added simultaneously might be because potassium could interact
chemically with the compatible solutes, changing their properties and their “ability” to be
absorbed by the cells. In case of betaine this resulted into a positive effect and in case of
trehalose into a negative effect.
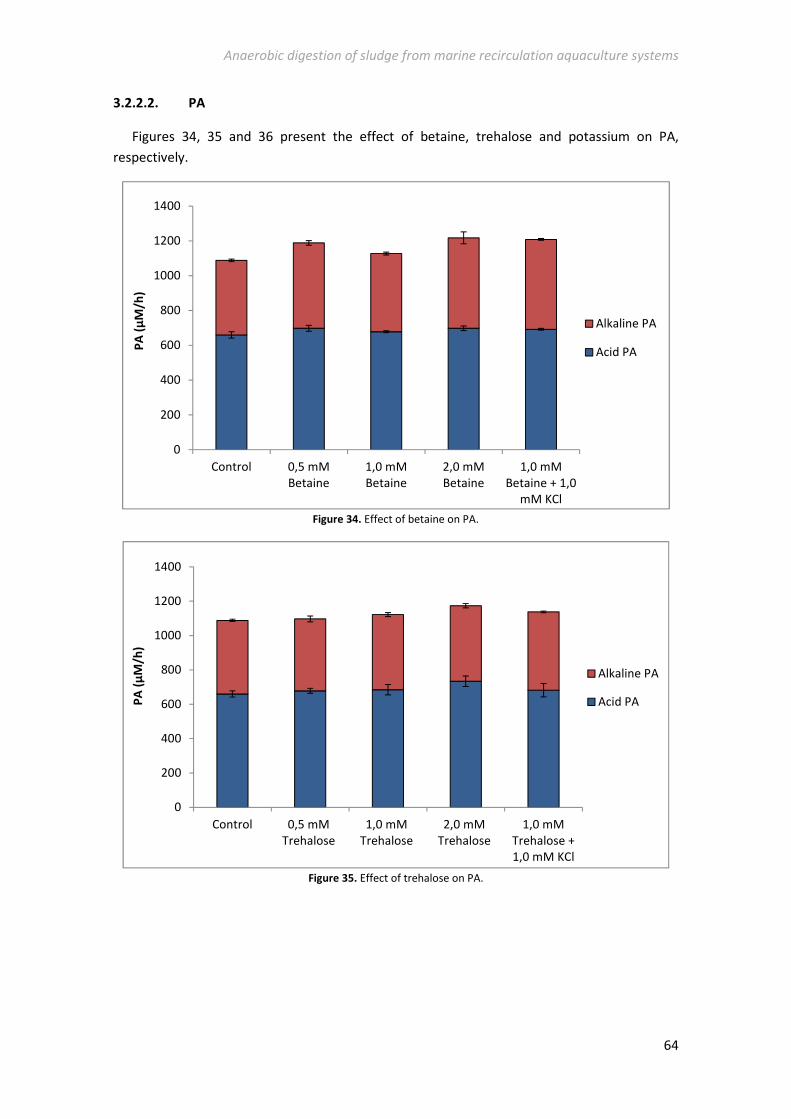
Anaerobic digestion of sludge from marine recirculation aquaculture systems
64
3.2.2.2. PA
Figures 34, 35 and 36 present the effect of betaine, trehalose and potassium on PA,
respectively.
Figure 34. Effect of betaine on PA.
Figure 35. Effect of trehalose on PA.
0
200
400
600
800
1000
1200
1400
Control 0,5 mM
Betaine
1,0 mM
Betaine
2,0 mM
Betaine
1,0 mM
Betaine + 1,0
mM KCl
PA
(µ
M/h
)
Alkaline PA
Acid PA
0
200
400
600
800
1000
1200
1400
Control 0,5 mM
Trehalose
1,0 mM
Trehalose
2,0 mM
Trehalose
1,0 mM
Trehalose +
1,0 mM KCl
PA
(µ
M/h
)
Alkaline PA
Acid PA
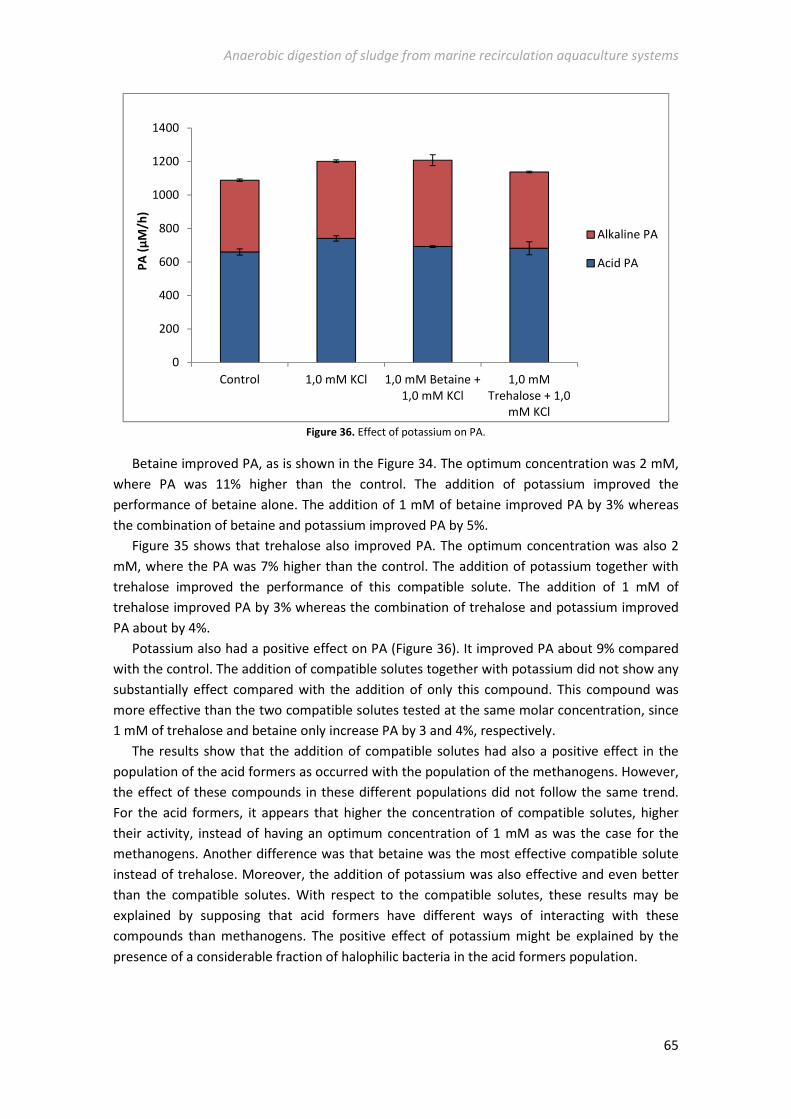
Anaerobic digestion of sludge from marine recirculation aquaculture systems
65
Figure 36. Effect of potassium on PA.
Betaine improved PA, as is shown in the Figure 34. The optimum concentration was 2 mM,
where PA was 11% higher than the control. The addition of potassium improved the
performance of betaine alone. The addition of 1 mM of betaine improved PA by 3% whereas
the combination of betaine and potassium improved PA by 5%.
Figure 35 shows that trehalose also improved PA. The optimum concentration was also 2
mM, where the PA was 7% higher than the control. The addition of potassium together with
trehalose improved the performance of this compatible solute. The addition of 1 mM of
trehalose improved PA by 3% whereas the combination of trehalose and potassium improved
PA about by 4%.
Potassium also had a positive effect on PA (Figure 36). It improved PA about 9% compared
with the control. The addition of compatible solutes together with potassium did not show any
substantially effect compared with the addition of only this compound. This compound was
more effective than the two compatible solutes tested at the same molar concentration, since
1 mM of trehalose and betaine only increase PA by 3 and 4%, respectively.
The results show that the addition of compatible solutes had also a positive effect in the
population of the acid formers as occurred with the population of the methanogens. However,
the effect of these compounds in these different populations did not follow the same trend.
For the acid formers, it appears that higher the concentration of compatible solutes, higher
their activity, instead of having an optimum concentration of 1 mM as was the case for the
methanogens. Another difference was that betaine was the most effective compatible solute
instead of trehalose. Moreover, the addition of potassium was also effective and even better
than the compatible solutes. With respect to the compatible solutes, these results may be
explained by supposing that acid formers have different ways of interacting with these
compounds than methanogens. The positive effect of potassium might be explained by the
presence of a considerable fraction of halophilic bacteria in the acid formers population.
0
200
400
600
800
1000
1200
1400
Control 1,0 mM KCl 1,0 mM Betaine +
1,0 mM KCl
1,0 mM
Trehalose + 1,0
mM KCl
PA
(µ
M/h
)
Alkaline PA
Acid PA
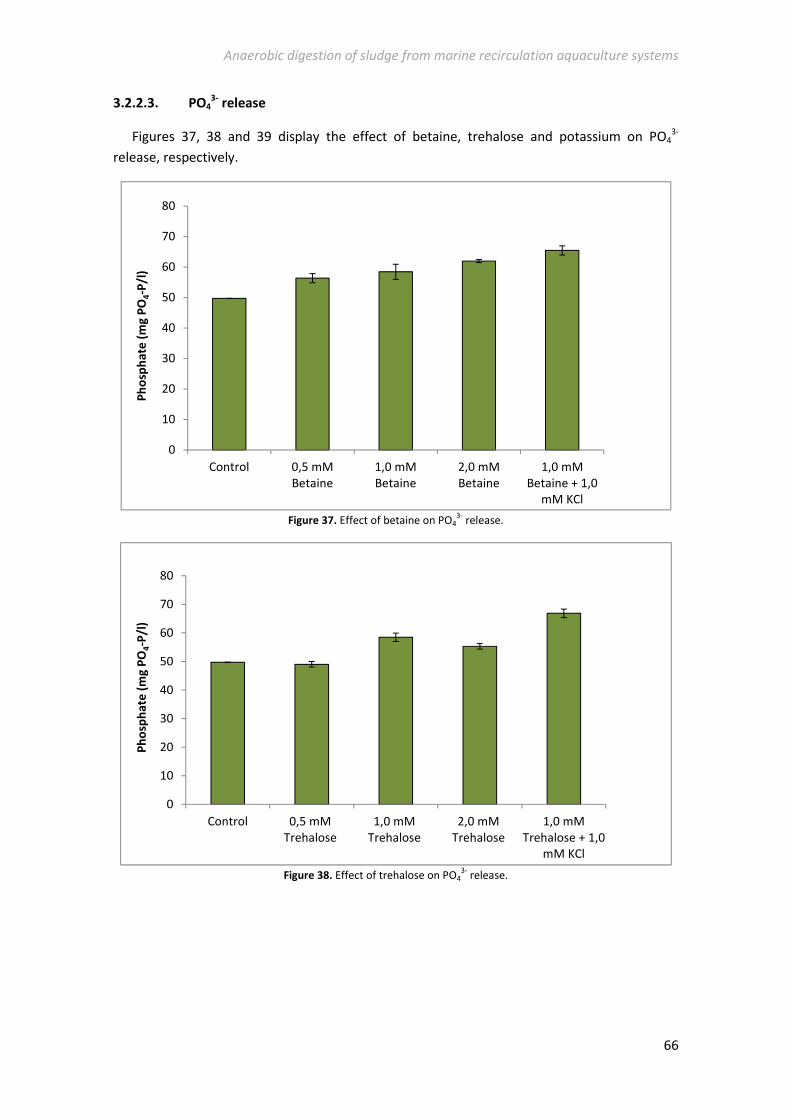
Anaerobic digestion of sludge from marine recirculation aquaculture systems
66
3.2.2.3. PO43-
release
Figures 37, 38 and 39 display the effect of betaine, trehalose and potassium on PO43-
release, respectively.
Figure 37. Effect of betaine on PO4
3- release.
Figure 38. Effect of trehalose on PO4
3- release.
0
10
20
30
40
50
60
70
80
Control 0,5 mM
Betaine
1,0 mM
Betaine
2,0 mM
Betaine
1,0 mM
Betaine + 1,0
mM KCl
Ph
osp
ha
te (
mg
PO
4-P
/l)
0
10
20
30
40
50
60
70
80
Control 0,5 mM
Trehalose
1,0 mM
Trehalose
2,0 mM
Trehalose
1,0 mM
Trehalose + 1,0
mM KCl
Ph
osp
ha
te (
mg
PO
4-P
/l)
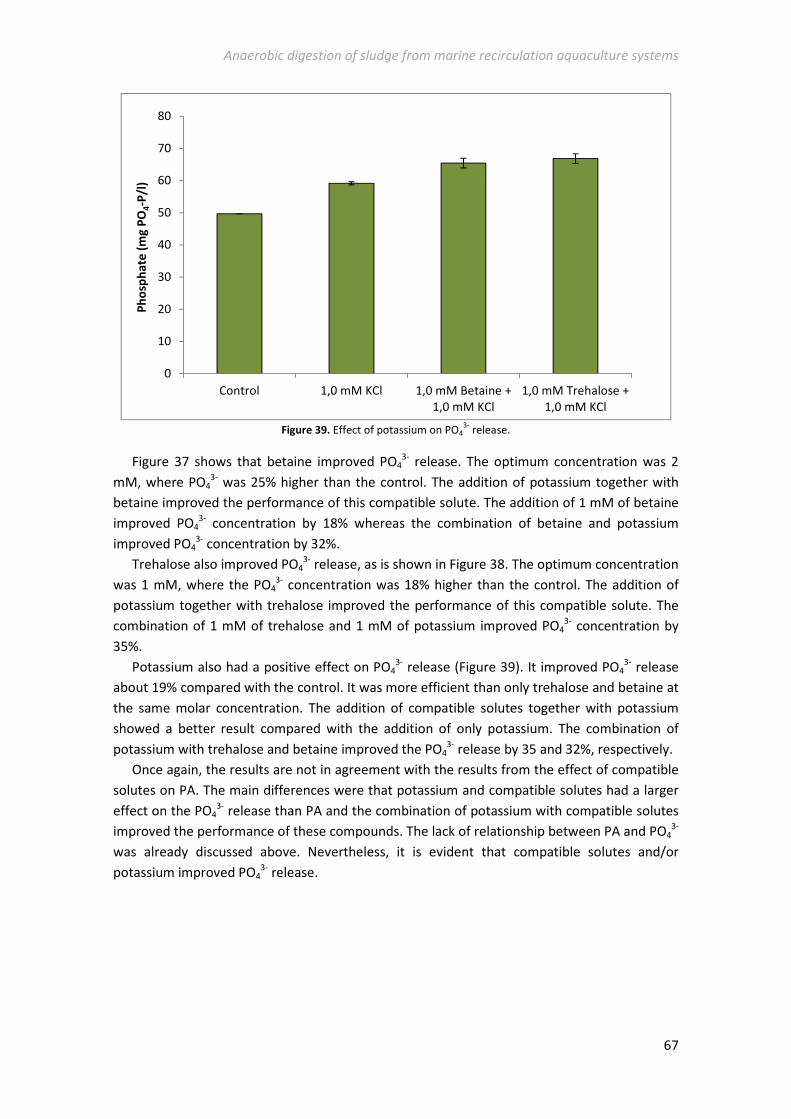
Anaerobic digestion of sludge from marine recirculation aquaculture systems
67
Figure 39. Effect of potassium on PO4
3- release.
Figure 37 shows that betaine improved PO43- release. The optimum concentration was 2
mM, where PO43- was 25% higher than the control. The addition of potassium together with
betaine improved the performance of this compatible solute. The addition of 1 mM of betaine
improved PO43- concentration by 18% whereas the combination of betaine and potassium
improved PO43- concentration by 32%.
Trehalose also improved PO43- release, as is shown in Figure 38. The optimum concentration
was 1 mM, where the PO43- concentration was 18% higher than the control. The addition of
potassium together with trehalose improved the performance of this compatible solute. The
combination of 1 mM of trehalose and 1 mM of potassium improved PO43- concentration by
35%.
Potassium also had a positive effect on PO43- release (Figure 39). It improved PO4
3- release
about 19% compared with the control. It was more efficient than only trehalose and betaine at
the same molar concentration. The addition of compatible solutes together with potassium
showed a better result compared with the addition of only potassium. The combination of
potassium with trehalose and betaine improved the PO43- release by 35 and 32%, respectively.
Once again, the results are not in agreement with the results from the effect of compatible
solutes on PA. The main differences were that potassium and compatible solutes had a larger
effect on the PO43- release than PA and the combination of potassium with compatible solutes
improved the performance of these compounds. The lack of relationship between PA and PO43-
was already discussed above. Nevertheless, it is evident that compatible solutes and/or
potassium improved PO43- release.
0
10
20
30
40
50
60
70
80
Control 1,0 mM KCl 1,0 mM Betaine +
1,0 mM KCl
1,0 mM Trehalose +
1,0 mM KCl
Ph
osp
ha
te (
mg
PO
4-P
/l)
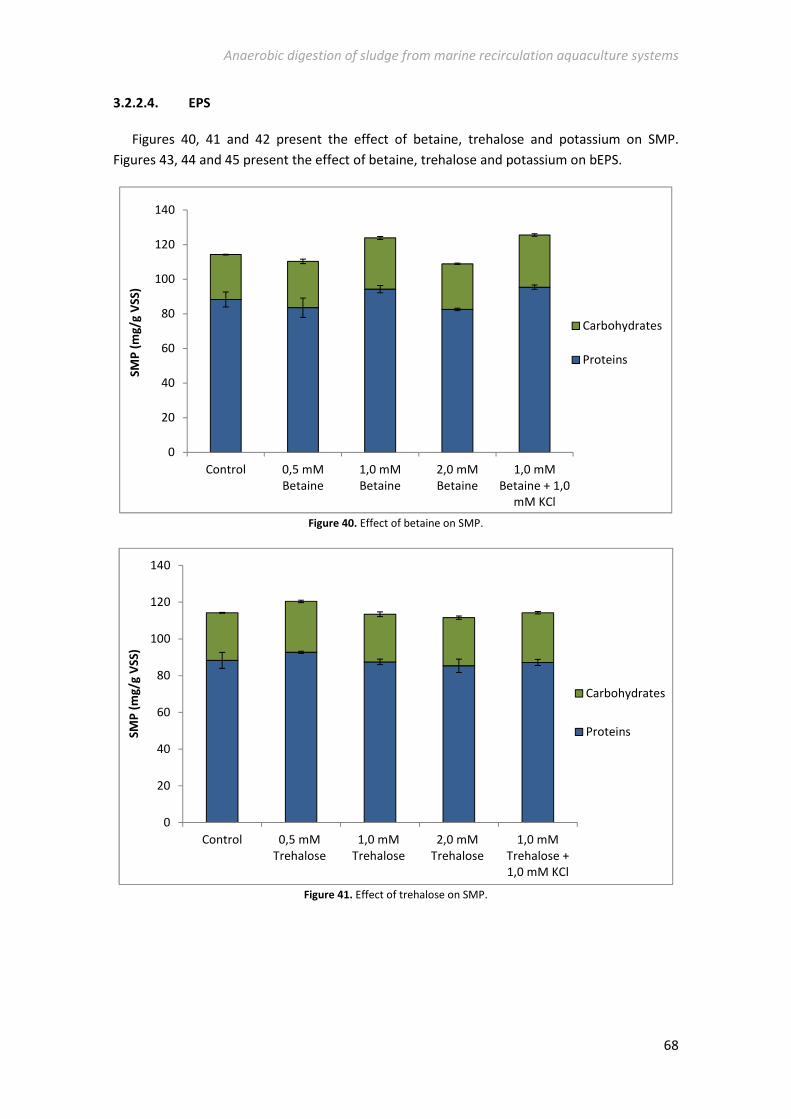
Anaerobic digestion of sludge from marine recirculation aquaculture systems
68
3.2.2.4. EPS
Figures 40, 41 and 42 present the effect of betaine, trehalose and potassium on SMP.
Figures 43, 44 and 45 present the effect of betaine, trehalose and potassium on bEPS.
Figure 40. Effect of betaine on SMP.
Figure 41. Effect of trehalose on SMP.
0
20
40
60
80
100
120
140
Control 0,5 mM
Betaine
1,0 mM
Betaine
2,0 mM
Betaine
1,0 mM
Betaine + 1,0
mM KCl
SM
P (
mg
/g V
SS
)
Carbohydrates
Proteins
0
20
40
60
80
100
120
140
Control 0,5 mM
Trehalose
1,0 mM
Trehalose
2,0 mM
Trehalose
1,0 mM
Trehalose +
1,0 mM KCl
SM
P (
mg
/g V
SS
)
Carbohydrates
Proteins
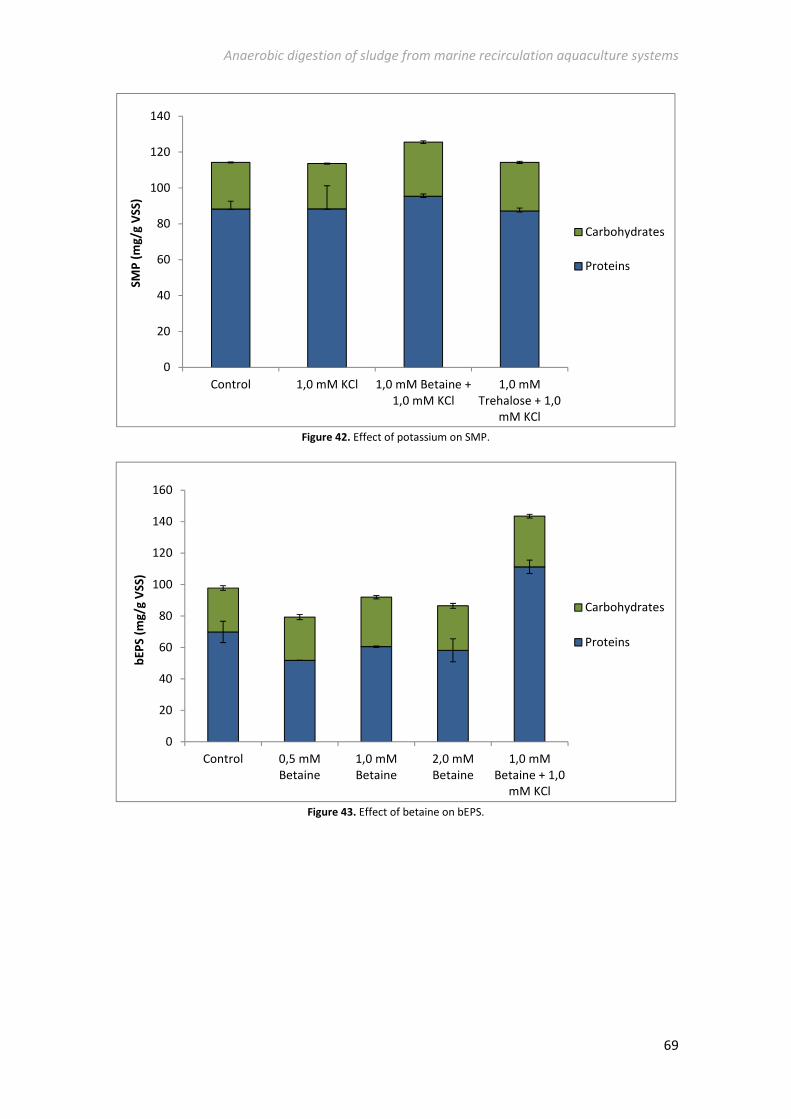
Anaerobic digestion of sludge from marine recirculation aquaculture systems
69
Figure 42. Effect of potassium on SMP.
Figure 43. Effect of betaine on bEPS.
0
20
40
60
80
100
120
140
Control 1,0 mM KCl 1,0 mM Betaine +
1,0 mM KCl
1,0 mM
Trehalose + 1,0
mM KCl
SM
P (
mg
/g V
SS
)
Carbohydrates
Proteins
0
20
40
60
80
100
120
140
160
Control 0,5 mM
Betaine
1,0 mM
Betaine
2,0 mM
Betaine
1,0 mM
Betaine + 1,0
mM KCl
bE
PS
(m
g/g
VS
S)
Carbohydrates
Proteins
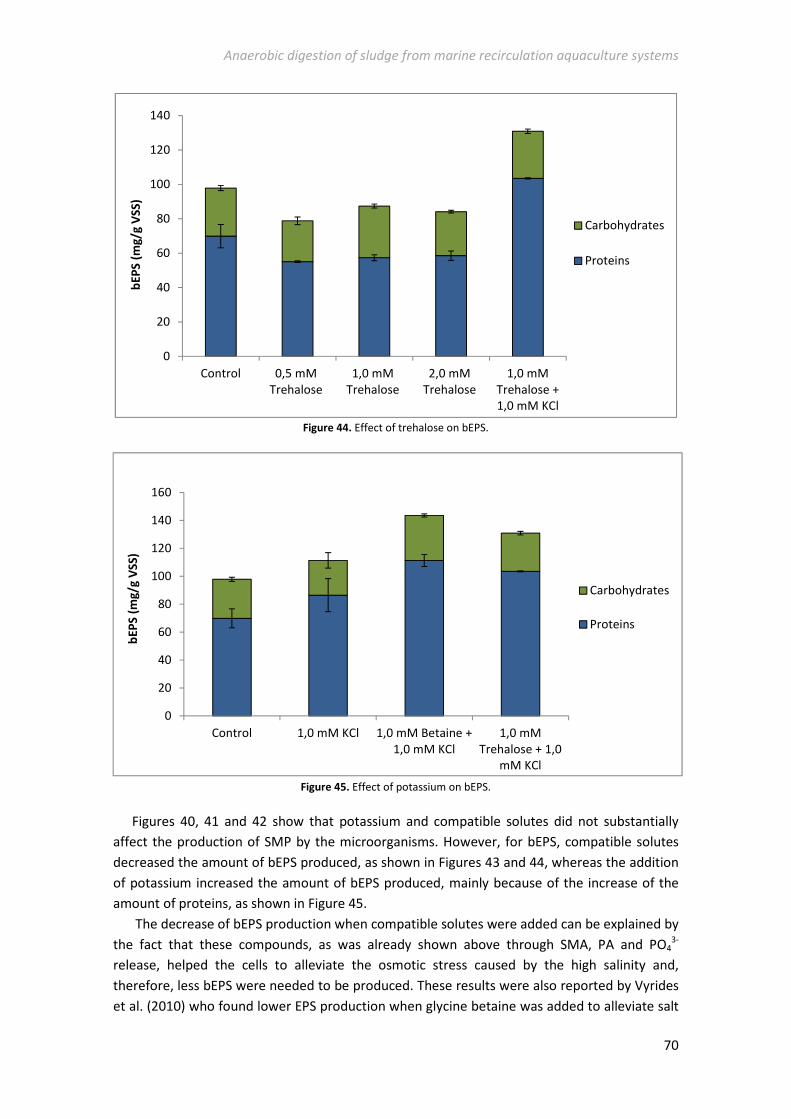
Anaerobic digestion of sludge from marine recirculation aquaculture systems
70
Figure 44. Effect of trehalose on bEPS.
Figure 45. Effect of potassium on bEPS.
Figures 40, 41 and 42 show that potassium and compatible solutes did not substantially
affect the production of SMP by the microorganisms. However, for bEPS, compatible solutes
decreased the amount of bEPS produced, as shown in Figures 43 and 44, whereas the addition
of potassium increased the amount of bEPS produced, mainly because of the increase of the
amount of proteins, as shown in Figure 45.
The decrease of bEPS production when compatible solutes were added can be explained by
the fact that these compounds, as was already shown above through SMA, PA and PO43-
release, helped the cells to alleviate the osmotic stress caused by the high salinity and,
therefore, less bEPS were needed to be produced. These results were also reported by Vyrides
et al. (2010) who found lower EPS production when glycine betaine was added to alleviate salt
0
20
40
60
80
100
120
140
Control 0,5 mM
Trehalose
1,0 mM
Trehalose
2,0 mM
Trehalose
1,0 mM
Trehalose +
1,0 mM KCl
bE
PS
(m
g/g
VS
S)
Carbohydrates
Proteins
0
20
40
60
80
100
120
140
160
Control 1,0 mM KCl 1,0 mM Betaine +
1,0 mM KCl
1,0 mM
Trehalose + 1,0
mM KCl
bE
PS
(m
g/g
VS
S)
Carbohydrates
Proteins
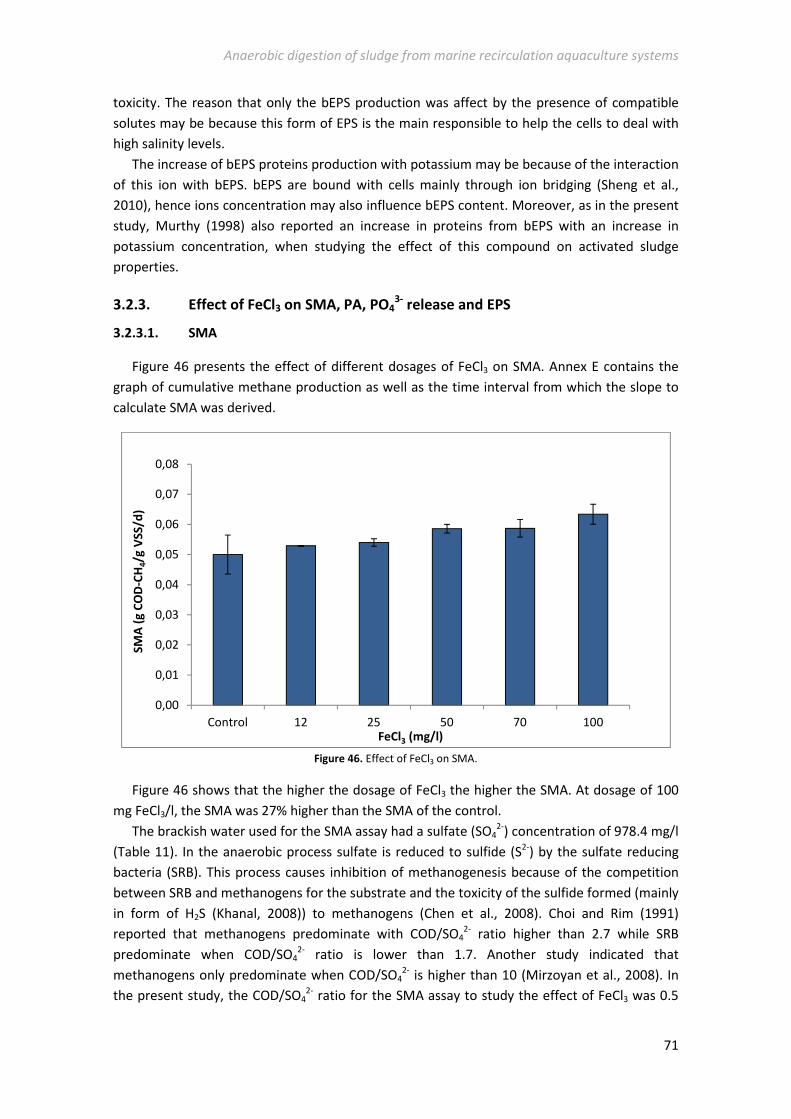
Anaerobic digestion of sludge from marine recirculation aquaculture systems
71
toxicity. The reason that only the bEPS production was affect by the presence of compatible
solutes may be because this form of EPS is the main responsible to help the cells to deal with
high salinity levels.
The increase of bEPS proteins production with potassium may be because of the interaction
of this ion with bEPS. bEPS are bound with cells mainly through ion bridging (Sheng et al.,
2010), hence ions concentration may also influence bEPS content. Moreover, as in the present
study, Murthy (1998) also reported an increase in proteins from bEPS with an increase in
potassium concentration, when studying the effect of this compound on activated sludge
properties.
3.2.3. Effect of FeCl3 on SMA, PA, PO43-
release and EPS
3.2.3.1. SMA
Figure 46 presents the effect of different dosages of FeCl3 on SMA. Annex E contains the
graph of cumulative methane production as well as the time interval from which the slope to
calculate SMA was derived.
Figure 46. Effect of FeCl3 on SMA.
Figure 46 shows that the higher the dosage of FeCl3 the higher the SMA. At dosage of 100
mg FeCl3/l, the SMA was 27% higher than the SMA of the control.
The brackish water used for the SMA assay had a sulfate (SO42-) concentration of 978.4 mg/l
(Table 11). In the anaerobic process sulfate is reduced to sulfide (S2-) by the sulfate reducing
bacteria (SRB). This process causes inhibition of methanogenesis because of the competition
between SRB and methanogens for the substrate and the toxicity of the sulfide formed (mainly
in form of H2S (Khanal, 2008)) to methanogens (Chen et al., 2008). Choi and Rim (1991)
reported that methanogens predominate with COD/SO42- ratio higher than 2.7 while SRB
predominate when COD/SO42- ratio is lower than 1.7. Another study indicated that
methanogens only predominate when COD/SO42- is higher than 10 (Mirzoyan et al., 2008). In
the present study, the COD/SO42- ratio for the SMA assay to study the effect of FeCl3 was 0.5
0,00
0,01
0,02
0,03
0,04
0,05
0,06
0,07
0,08
Control 12 25 50 70 100
SM
A (
g C
OD
-CH
4/g
VS
S/d
)
FeCl3 (mg/l)
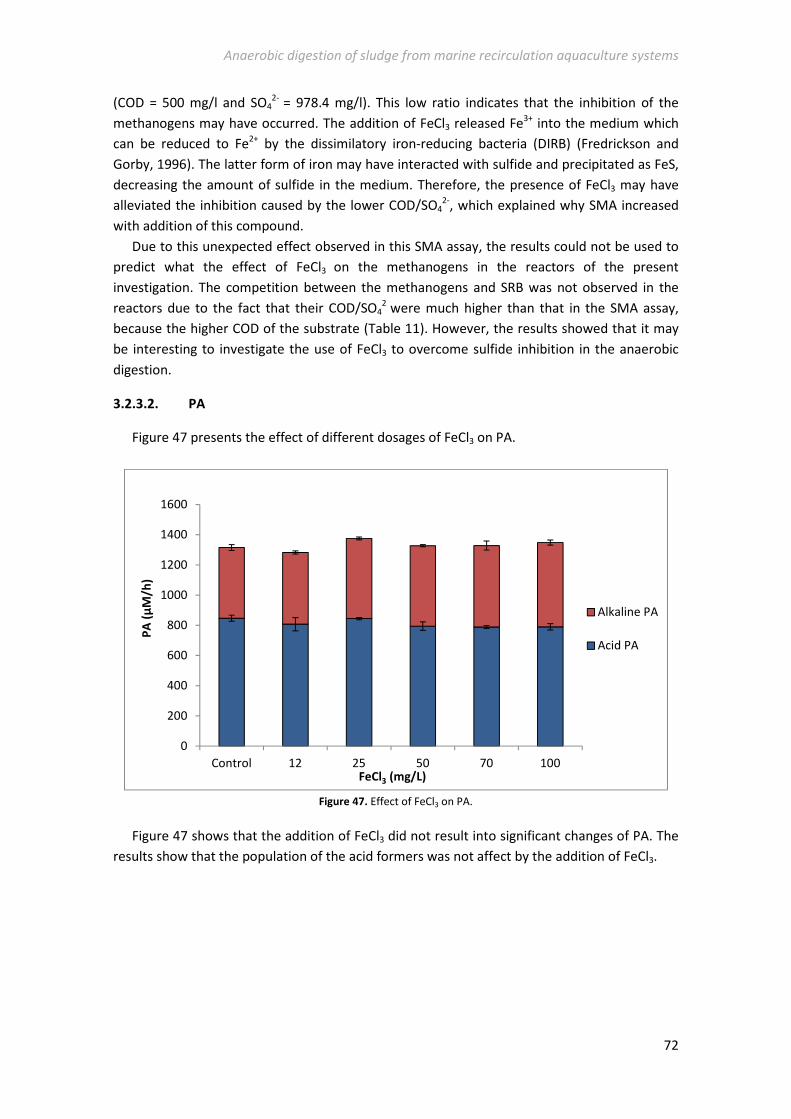
Anaerobic digestion of sludge from marine recirculation aquaculture systems
72
(COD = 500 mg/l and SO42- = 978.4 mg/l). This low ratio indicates that the inhibition of the
methanogens may have occurred. The addition of FeCl3 released Fe3+ into the medium which
can be reduced to Fe2+ by the dissimilatory iron-reducing bacteria (DIRB) (Fredrickson and
Gorby, 1996). The latter form of iron may have interacted with sulfide and precipitated as FeS,
decreasing the amount of sulfide in the medium. Therefore, the presence of FeCl3 may have
alleviated the inhibition caused by the lower COD/SO42-, which explained why SMA increased
with addition of this compound.
Due to this unexpected effect observed in this SMA assay, the results could not be used to
predict what the effect of FeCl3 on the methanogens in the reactors of the present
investigation. The competition between the methanogens and SRB was not observed in the
reactors due to the fact that their COD/SO42 were much higher than that in the SMA assay,
because the higher COD of the substrate (Table 11). However, the results showed that it may
be interesting to investigate the use of FeCl3 to overcome sulfide inhibition in the anaerobic
digestion.
3.2.3.2. PA
Figure 47 presents the effect of different dosages of FeCl3 on PA.
Figure 47. Effect of FeCl3 on PA.
Figure 47 shows that the addition of FeCl3 did not result into significant changes of PA. The
results show that the population of the acid formers was not affect by the addition of FeCl3.
0
200
400
600
800
1000
1200
1400
1600
Control 12 25 50 70 100
PA
(µ
M/h
)
FeCl3 (mg/L)
Alkaline PA
Acid PA
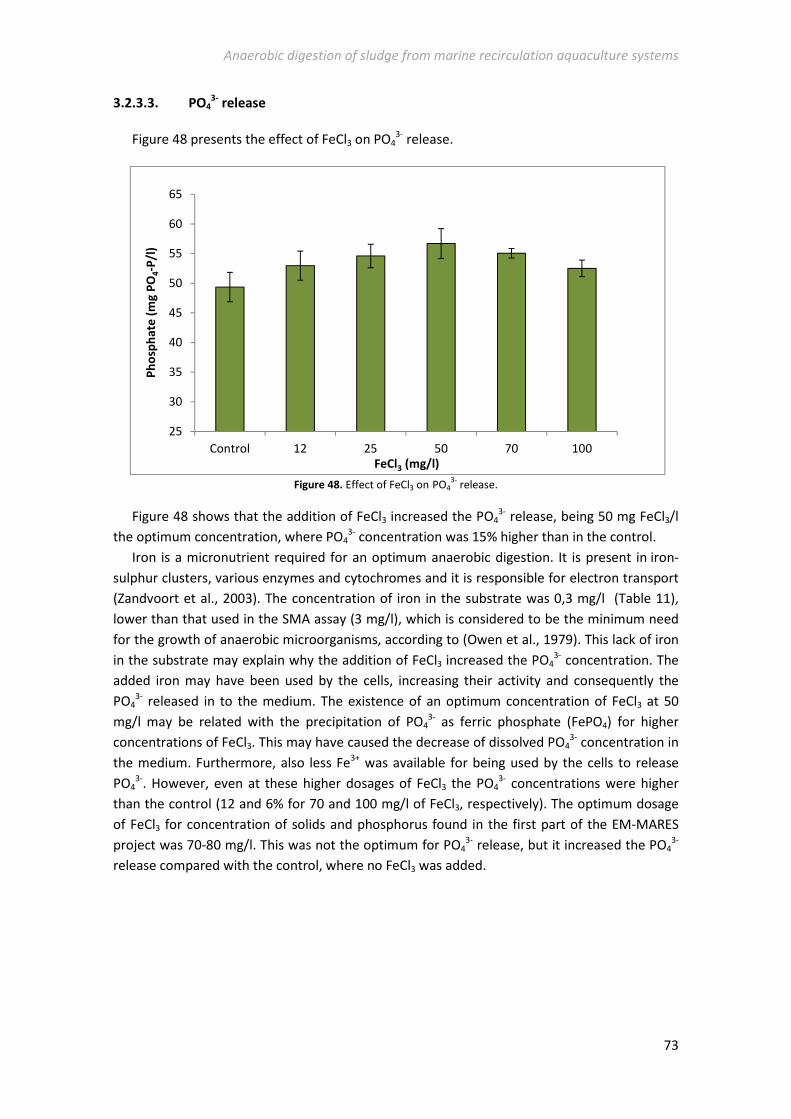
Anaerobic digestion of sludge from marine recirculation aquaculture systems
73
3.2.3.3. PO43-
release
Figure 48 presents the effect of FeCl3 on PO43- release.
Figure 48. Effect of FeCl3 on PO4
3- release.
Figure 48 shows that the addition of FeCl3 increased the PO43- release, being 50 mg FeCl3/l
the optimum concentration, where PO43- concentration was 15% higher than in the control.
Iron is a micronutrient required for an optimum anaerobic digestion. It is present in iron-
sulphur clusters, various enzymes and cytochromes and it is responsible for electron transport
(Zandvoort et al., 2003). The concentration of iron in the substrate was 0,3 mg/l (Table 11),
lower than that used in the SMA assay (3 mg/l), which is considered to be the minimum need
for the growth of anaerobic microorganisms, according to (Owen et al., 1979). This lack of iron
in the substrate may explain why the addition of FeCl3 increased the PO43- concentration. The
added iron may have been used by the cells, increasing their activity and consequently the
PO43- released in to the medium. The existence of an optimum concentration of FeCl3 at 50
mg/l may be related with the precipitation of PO43- as ferric phosphate (FePO4) for higher
concentrations of FeCl3. This may have caused the decrease of dissolved PO43- concentration in
the medium. Furthermore, also less Fe3+ was available for being used by the cells to release
PO43-. However, even at these higher dosages of FeCl3 the PO4
3- concentrations were higher
than the control (12 and 6% for 70 and 100 mg/l of FeCl3, respectively). The optimum dosage
of FeCl3 for concentration of solids and phosphorus found in the first part of the EM-MARES
project was 70-80 mg/l. This was not the optimum for PO43- release, but it increased the PO4
3-
release compared with the control, where no FeCl3 was added.
25
30
35
40
45
50
55
60
65
Control 12 25 50 70 100
Ph
osp
ha
te (
mg
PO
4-P
/l)
FeCl3 (mg/l)
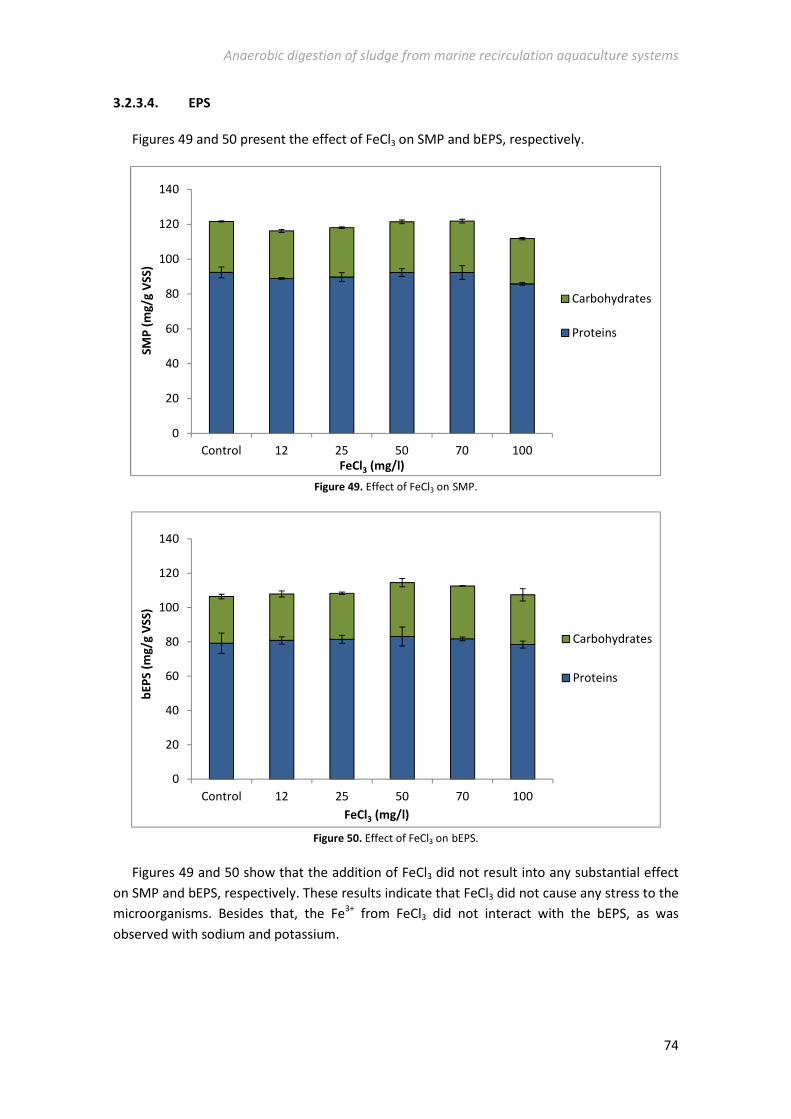
Anaerobic digestion of sludge from marine recirculation aquaculture systems
74
3.2.3.4. EPS
Figures 49 and 50 present the effect of FeCl3 on SMP and bEPS, respectively.
Figure 49. Effect of FeCl3 on SMP.
Figure 50. Effect of FeCl3 on bEPS.
Figures 49 and 50 show that the addition of FeCl3 did not result into any substantial effect
on SMP and bEPS, respectively. These results indicate that FeCl3 did not cause any stress to the
microorganisms. Besides that, the Fe3+ from FeCl3 did not interact with the bEPS, as was
observed with sodium and potassium.
0
20
40
60
80
100
120
140
Control 12 25 50 70 100
SM
P (
mg
/g V
SS
)
FeCl3 (mg/l)
Carbohydrates
Proteins
0
20
40
60
80
100
120
140
Control 12 25 50 70 100
bE
PS
(m
g/g
VS
S)
FeCl3 (mg/l)
Carbohydrates
Proteins
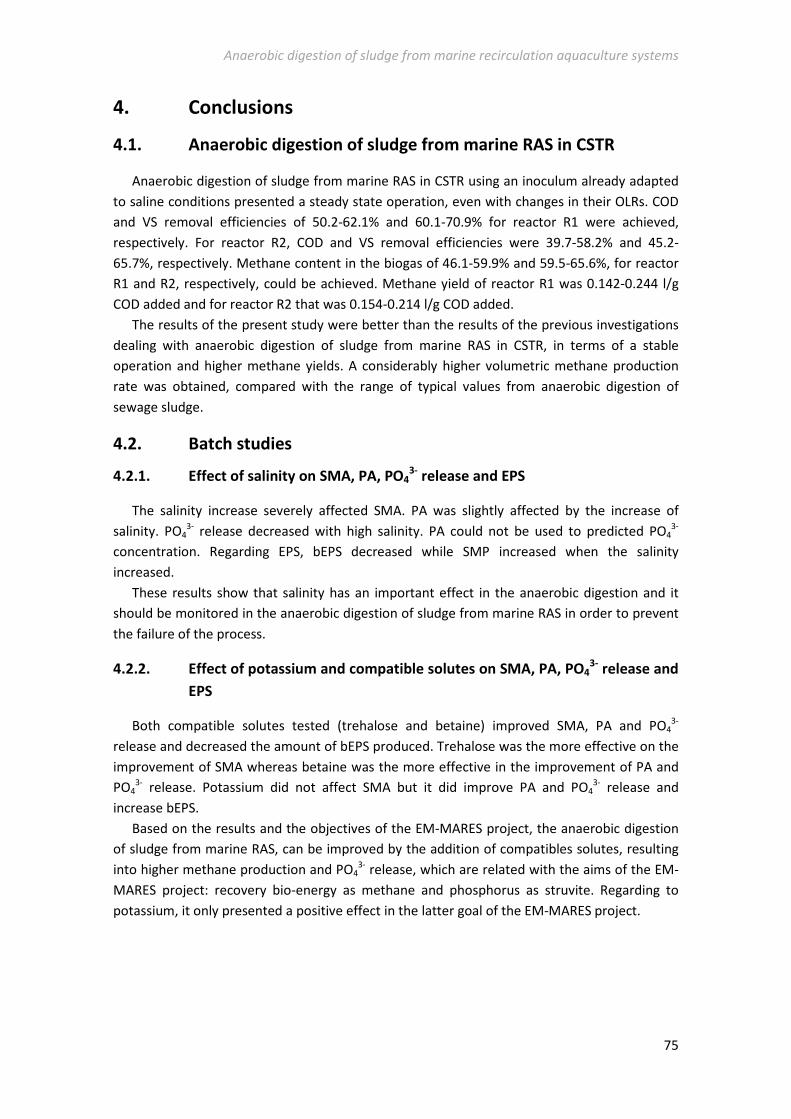
Anaerobic digestion of sludge from marine recirculation aquaculture systems
75
4. Conclusions
4.1. Anaerobic digestion of sludge from marine RAS in CSTR
Anaerobic digestion of sludge from marine RAS in CSTR using an inoculum already adapted
to saline conditions presented a steady state operation, even with changes in their OLRs. COD
and VS removal efficiencies of 50.2-62.1% and 60.1-70.9% for reactor R1 were achieved,
respectively. For reactor R2, COD and VS removal efficiencies were 39.7-58.2% and 45.2-
65.7%, respectively. Methane content in the biogas of 46.1-59.9% and 59.5-65.6%, for reactor
R1 and R2, respectively, could be achieved. Methane yield of reactor R1 was 0.142-0.244 l/g
COD added and for reactor R2 that was 0.154-0.214 l/g COD added.
The results of the present study were better than the results of the previous investigations
dealing with anaerobic digestion of sludge from marine RAS in CSTR, in terms of a stable
operation and higher methane yields. A considerably higher volumetric methane production
rate was obtained, compared with the range of typical values from anaerobic digestion of
sewage sludge.
4.2. Batch studies
4.2.1. Effect of salinity on SMA, PA, PO43-
release and EPS
The salinity increase severely affected SMA. PA was slightly affected by the increase of
salinity. PO43- release decreased with high salinity. PA could not be used to predicted PO4
3-
concentration. Regarding EPS, bEPS decreased while SMP increased when the salinity
increased.
These results show that salinity has an important effect in the anaerobic digestion and it
should be monitored in the anaerobic digestion of sludge from marine RAS in order to prevent
the failure of the process.
4.2.2. Effect of potassium and compatible solutes on SMA, PA, PO43-
release and
EPS
Both compatible solutes tested (trehalose and betaine) improved SMA, PA and PO43-
release and decreased the amount of bEPS produced. Trehalose was the more effective on the
improvement of SMA whereas betaine was the more effective in the improvement of PA and
PO43- release. Potassium did not affect SMA but it did improve PA and PO4
3- release and
increase bEPS.
Based on the results and the objectives of the EM-MARES project, the anaerobic digestion
of sludge from marine RAS, can be improved by the addition of compatibles solutes, resulting
into higher methane production and PO43- release, which are related with the aims of the EM-
MARES project: recovery bio-energy as methane and phosphorus as struvite. Regarding to
potassium, it only presented a positive effect in the latter goal of the EM-MARES project.
Anaerobic digestion of sludge from marine recirculation aquaculture systems
76
4.2.3. Effect of FeCl3 on SMA, PA, PO43-
release and EPS
SMA increased with the increase of FeCl3 dosage. This result could not be used to predict
FeCl3 effect on SMA due to the probable and unexpected sulfide inhibition observed in the
SMA assay, and not observed in the reactors. However, PO43- release was improved with the
addition of FeCl3. FeCl3 did not present any significant effect on PA and in the production of
both forms of EPS.
According to the results of the present investigation, FeCl3 did not show any negative effect
in the anaerobic digestion of sludge from marine RAS in CSTR. It supports the feasibility of
using FeCl3 as a coagulant for the concentration of solids and phosphorus from backwash
water from marine RAS before anaerobic digestion of sludge in CSTR, as suggested in the EM-
MARES project. Due to the improvement of PO43- release, FeCl3 may actually have a positive
effect in the recovery of phosphorus as struvite which is another aim of the EM-MARES
project.
4.3. Scientific and social relevance
In the first part of this research, anaerobic digestion of sludge from marine RAS in CSTR
inoculated with microorganisms already adapted to saline conditions was shown as a feasible
solution to treat the sludge from marine RAS. This contributes to the increase of the
sustainability of marine RAS as a major solution to meet the increasing demand of seafood.
Batch studies, conducted in the second part of this research, are a great contribution for the
EM-MARES project as well for the knowledge related with the anaerobic digestion at saline
conditions.
4.4. Recommendations for further research
Investigation about the performance of CSTR for the anaerobic digestion of sludge from
marine RAS with lower STRs of those used in this research, in the range of those typically used
in the anaerobic digestion of sewage sludge, may be an interesting topic of research since it
leads a smaller reactors and consequently economic advantages.
As was shown in the results from the effect of FeCl3 on SMA, FeCl3 might be very efficient in
alleviating sulfide inhibition and, therefore, it may be attractive to study the use of FeCl3 to
mitigate sulfide inhibition in the anaerobic digestion.
Anaerobic digestion of sludge from marine recirculation aquaculture systems
77
5. References
Anupama, V. N., Amrutha, P. N., Chitra, G. S., and Krishnakumar, B. (2008). Phosphatase
activity in anaerobic bioreactors for wastewater treatment. Water Research 42, 2796-
802.
APHA (2005). Standard Methods for the Examination of Water & Wastewater (21st ed.).
American Public Health Association, American Water Works Association and Water
Environment Federation, Washington, DC, USA.
Appels, L., Baeyens, J., Degrève, J., and Dewil, R. (2008). Principles and potential of the
anaerobic digestion of waste-activated sludge. Progress in Energy and Combustion
Science 34, 755-781.
Aquino, F., S., Stuckey, and C., D. (2002). Characterization of soluble microbial products (SMP)
in effluents from anaerobic reactors. International Water Association 45, IX, 385 p.
Ashley, N. V., and Hurst, T. J. (1981). Acid and alkaline phosphatase activity in anaerobic
digested sludge: A biochemical predictor of digester failure. Water Research 15, 633-
638.
Berber, R. (1996). Control of batch reactors : a review : Process operations and control.
Chemical Engineering Research & Design 74, 3-20.
Bull, M. A., Sterritt, R. M., and Lester, J. N. (1984). The distribution of bacterial activity in an
anaerobic fluidized bed reactor. Water Research 18, 1017-1020.
Chen, Y., Cheng, J. J., and Creamer, K. S. (2008). Inhibition of anaerobic digestion process: a
review. Bioresource Technology 99, 4044-64.
Choi, E., and Rim, J. M. (1991). Competition and Inhibition of Sulfate Reducers and Methane
Producers in Anaerobic Treatment. Water Science and Technology 23, 1259-1264.
DuBois, M., Gilles, K. A., Hamilton, J. K., Rebers, P. A., and Smith, F. (1956). Colorimetric
Method for Determination of Sugars and Related Substances. Analytical Chemistry 28,
350-356.
Ferreira, M. L. (2011). Filterability and Sludge Concentration in Membrane Bioreactors, TU
Delft, The Netherlands.
Fredrickson, J. K., and Gorby, Y. A. (1996). Environmental processes mediated by iron-reducing
bacteria. Current Opinion in Biotechnology 7, 287-294.
G-Biosciences (2011). Protein Assays - Handbook & Selection Guide.
Gebauer, R. (2004). Mesophilic anaerobic treatment of sludge from saline fish farm effluents
with biogas production. Bioresource Technology 93, 155-67.
Gebauer, R., and Eikebrokk, B. (2006). Mesophilic anaerobic treatment of sludge from salmon
smolt hatching. Bioresource Technology 97, 2389-401.
Gerardi, M. H. (2003). The Microbiology of Anaerobic Digesters, John Wiley & Sons, Inc.,
Hoboken, New Jersey.
Gujer, W., and Zehnder, A. J. B. (1983). Conversion processes in anaerobic digestion. Water
Science and Technology 15, 127-167.
Haridas, A., Suresh, S., Chitra, K. R., and Manilal, V. B. (2005). The Buoyant Filter Bioreactor: a
high-rate anaerobic reactor for complex wastewater—process dynamics with dairy
effluent. Water Research 39, 993-1004.
Isa, H., M., Farooqi, H., I., Siddiqi, and H., R. (1993). Methanogenic activity test for study of
anaerobic processes. Indian Journal of Environmental Health 35, 1-8.
Anaerobic digestion of sludge from marine recirculation aquaculture systems
78
Ismail, S. B., de La Parra, C. J., Temmink, H., and van Lier, J. B. (2010). Extracellular polymeric
substances (EPS) in upflow anaerobic sludge blanket (UASB) reactors operated under
high salinity conditions. Water Research 44, 1909-17.
Kapdan, I. K., and Erten, B. (2007). Anaerobic treatment of saline wastewater by
Halanaerobium lacusrosei. Process Biochemistry 42, 449-453.
Khanal, S. K. (2008). Anaerobic biotechnology for bioenergy production principles and
applications, Wiley-Blackwell, Oxford.
Liu, H., and H.P. Fang, H. (2002). Extraction of extracellular polymeric substances (EPS) of
sludges. Journal of Biotechnology 95, 249-256.
Lowry, O. H., Rosebrough, N. J., Farr, A. L., and Randall, R. J. (1951). Protein measurement with
the Folin phenol reagent. The Journal of biological chemistry 193, 265-275.
Martins, C. I. M., Eding, E. H., Verdegem, M. C. J., Heinsbroek, L. T. N., Schneider, O.,
Blancheton, J. P., d’Orbcastel, E. R., and Verreth, J. A. J. (2010). New developments in
recirculating aquaculture systems in Europe: A perspective on environmental
sustainability. Aquacultural Engineering 43, 83-93.
McCarty, P. L. (1964a). Anaerobic Waste Treatment Fundamentals, part 1: Chemistry and
Microbiology. Public works 95, 107-112.
McCarty, P. L. (1964b). Anaerobic Waste Treatment Fundamentals, part 2: Environmental
Requirements and Control. Public works 95, 123-126.
McCarty, P. L. (1964c). Anaerobic Waste Treatment Fundamentals, part 3: Toxic Materials and
their Control. Public works 95, 91-94.
McCarty, P. L. (1964d). Anaerobic Waste Treatment Fundamentals, part one: Chemistry and
Microbiology Public works 95, 107-112.
Metcalf & Eddy, I. (2003). Watewater Enginnering: Treatment and Reuse, 4th/Ed. McGraw-Hill,
New York.
Mirzoyan, N., Parnes, S., Singer, A., Tal, Y., Sowers, K., and Gross, A. (2008). Quality of brackish
aquaculture sludge and its suitability for anaerobic digestion and methane production
in an upflow anaerobic sludge blanket (UASB) reactor. Aquaculture 279, 35-41.
Mirzoyan, N., Tal, Y., and Gross, A. (2010). Anaerobic digestion of sludge from intensive
recirculating aquaculture systems: Review. Aquaculture 306, 1-6.
Möller, K., and Müller, T. (2012). Effects of anaerobic digestion on digestate nutrient
availability and crop growth: A review. Engineering in Life Sciences 12, 242–257.
Murthy, S. N. (1998). Bioflocculation: implications for activated sludge properties and
wastewater treatment, Faculty of the Virginia Polytechnic Institute and State
University, Blacksburg, Virginia Tech.
Oh, G., Zhang, L., and Jahng, D. (2008). Osmoprotectants enhance methane production from
the anaerobic digestion of food wastes containing a high content of salt. Journal of
Chemical Technology & Biotechnology 83, 1204-1210.
Owen, W. F., Stuckey, D. C., Healy Jr, J. B., Young, L. Y., and McCarty, P. L. (1979). Bioassay for
monitoring biochemical methane potential and anaerobic toxicity. Water Research 13,
485-492.
Sheng, G.-P., and Yu, H.-Q. (2007). Formation of extracellular polymeric substances from
acidogenic sludge in producing process. Applied Microbiology and Biotechnology 74,
208-214.
Anaerobic digestion of sludge from marine recirculation aquaculture systems
79
Sheng, G. P., Yu, H. Q., and Li, X. Y. (2010). Extracellular polymeric substances (EPS) of microbial
aggregates in biological wastewater treatment systems: a review. Biotechnology
Advances 28, 882-94.
Soto, M., Méndez, R., and Lema, J. M. (1993). Sodium inhibition and sulphate reduction in the
anaerobic treatment of mussel processing wastewaters. Journal of Chemical
Technology & Biotechnology 58, 1-7.
Vyrides, I., Santos, H., Mingote, A., Ray, M. J., and Stuckey, D. C. (2010). Are Compatible
Solutes Compatible with Biological Treatment of Saline Wastewater? Batch and
Continuous Studies Using Submerged Anerobic membrane Bioreactors (SAMBRs).
Water Science and Technology 44, 7437-7442.
Vyrides, I., and Stuckey, D. C. (2009). Adaptation of anaerobic biomass to saline conditions:
Role of compatible solutes and extracellular polysaccharides. Enzyme and Microbial
Technology 44, 46-51.
Wang, Z., Guo, Y., and Li, L. (1990). A study of phosphatase activity in anaerobic sludge
digestion. Water Research 24, 917-920.
Wilderer, P. A., Goronszy, M. C., and Irvine, R. L. (2000). Sequencing batch reactor technology.
Zandvoort, M. H., Geerts, R., Lettinga, G., and Lens, P. N. L. (2003). Methanol degradation in
granular sludge reactors at sub-optimal metal concentrations: role of iron, nickel and
cobalt. Enzyme and Microbial Technology 33, 190-198.
Zhang, D. M., Chen, Y. X., Jilani, G., Wu, W. X., Liu, W. L., and Han, Z. Y. (2012). Optimization of
struvite crystallization protocol for pretreating the swine wastewater and its impact on
subsequent anaerobic biodegradation of pollutants. Bioresource Technology 116, 386-
395.
Zhang, X., Bishop, P. L., and Kinkle, B. K. (1999). Comparison of extraction methods for
quantifying extracellular polymers in biofilms. Water Science and Technology 39, 211-
218.

Anaerobic digestion of sludge from marine recirculation aquaculture systems
80
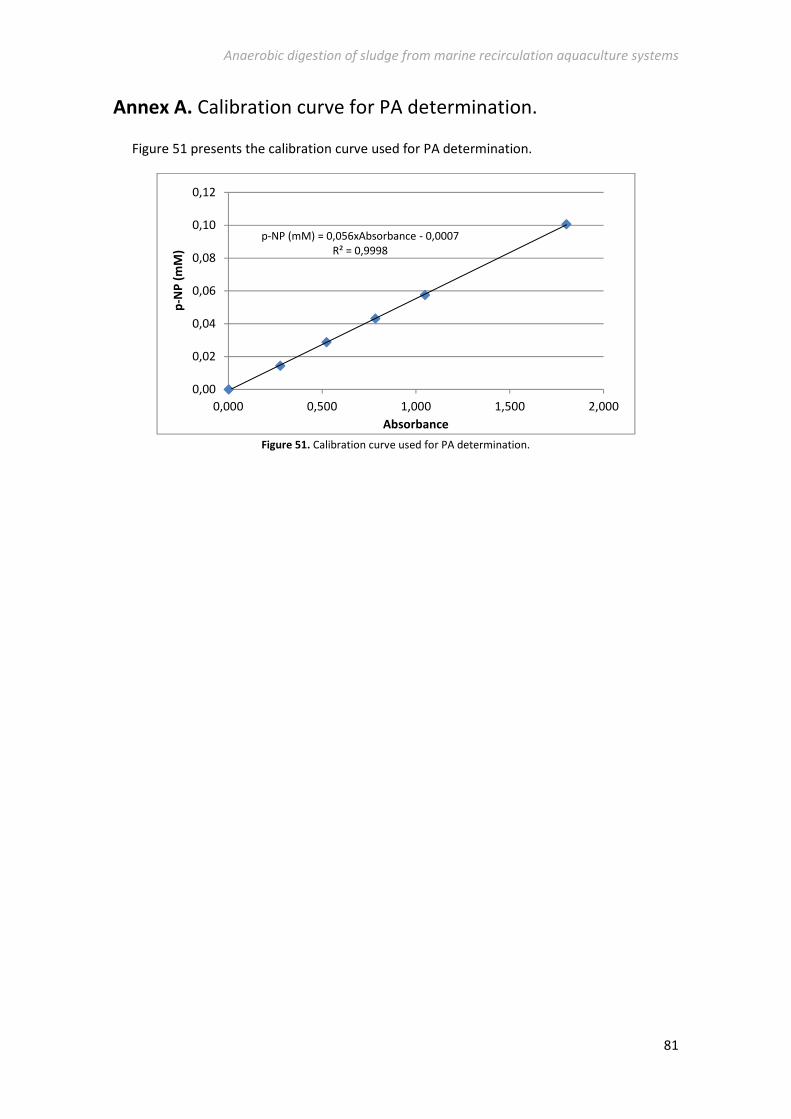
Anaerobic digestion of sludge from marine recirculation aquaculture systems
81
Annex A. Calibration curve for PA determination.
Figure 51 presents the calibration curve used for PA determination.
Figure 51. Calibration curve used for PA determination.
p-NP (mM) = 0,056xAbsorbance - 0,0007
R² = 0,9998
0,00
0,02
0,04
0,06
0,08
0,10
0,12
0,000 0,500 1,000 1,500 2,000
p-N
P (
mM
)
Absorbance

Anaerobic digestion of sludge from marine recirculation aquaculture systems
82
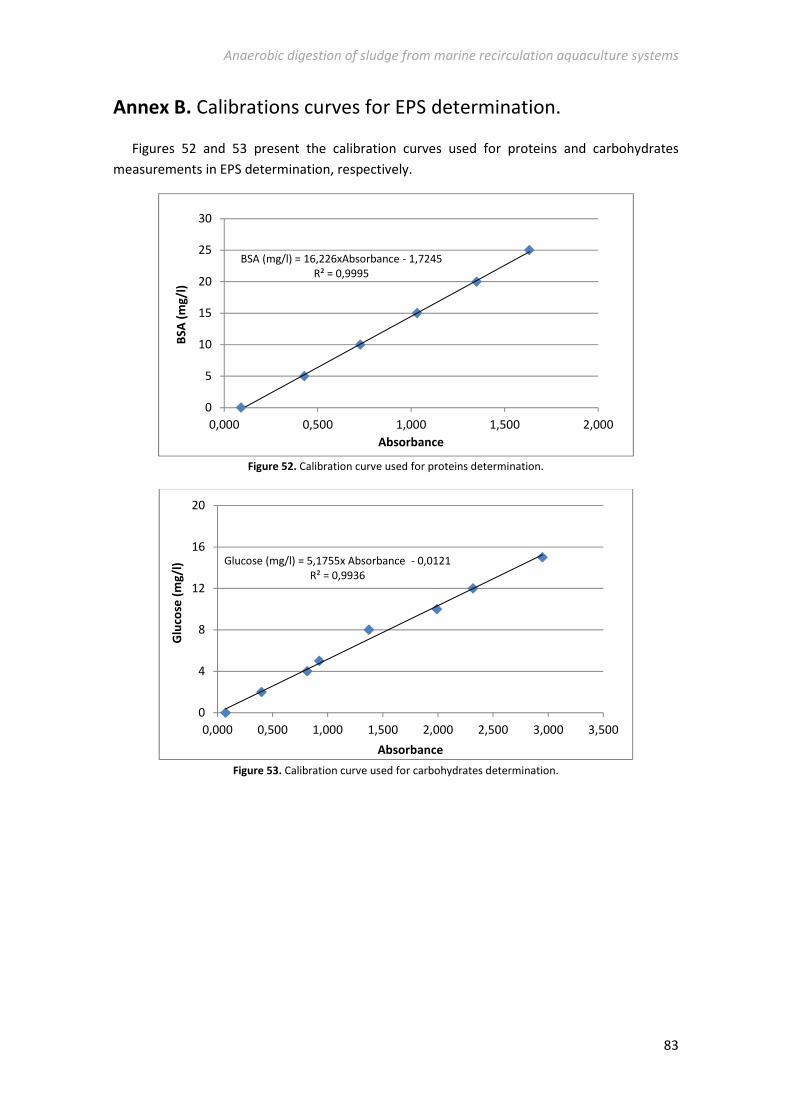
Anaerobic digestion of sludge from marine recirculation aquaculture systems
83
Annex B. Calibrations curves for EPS determination.
Figures 52 and 53 present the calibration curves used for proteins and carbohydrates
measurements in EPS determination, respectively.
Figure 52. Calibration curve used for proteins determination.
Figure 53. Calibration curve used for carbohydrates determination.
BSA (mg/l) = 16,226xAbsorbance - 1,7245
R² = 0,9995
0
5
10
15
20
25
30
0,000 0,500 1,000 1,500 2,000
BS
A (
mg
/l)
Absorbance
Glucose (mg/l) = 5,1755x Absorbance - 0,0121
R² = 0,9936
0
4
8
12
16
20
0,000 0,500 1,000 1,500 2,000 2,500 3,000 3,500
Glu
cose
(m
g/l
)
Absorbance

Anaerobic digestion of sludge from marine recirculation aquaculture systems
84
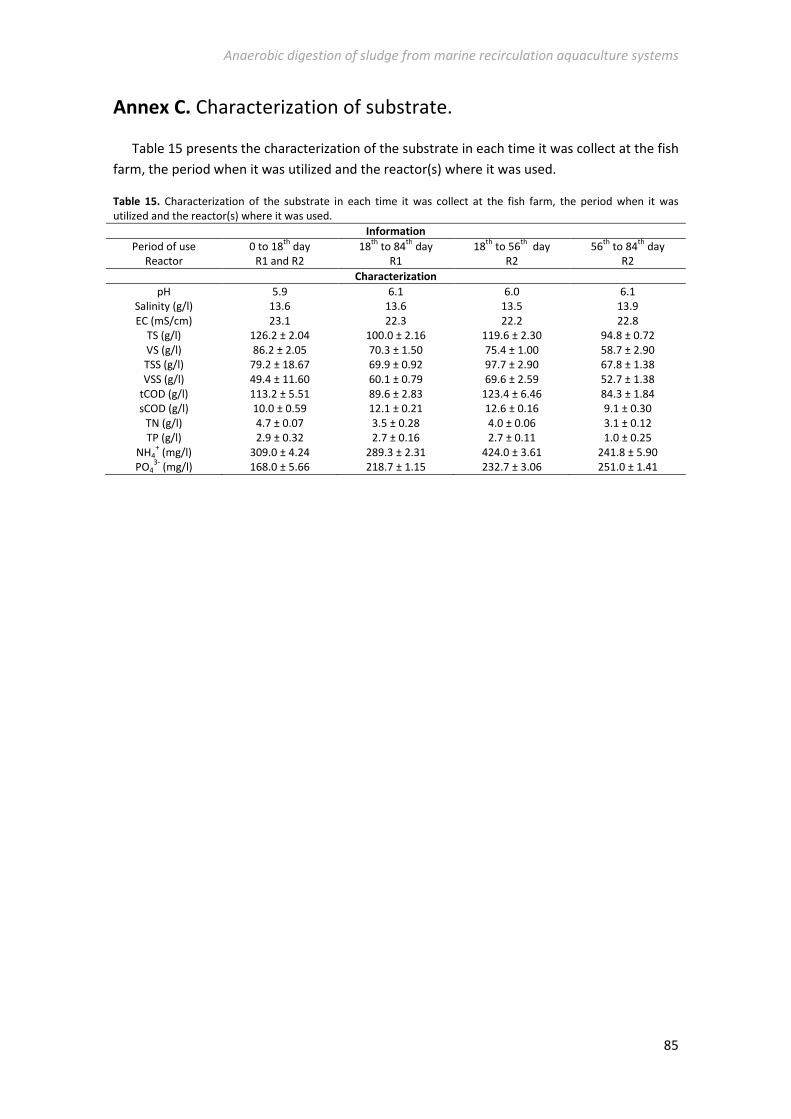
Anaerobic digestion of sludge from marine recirculation aquaculture systems
85
Annex C. Characterization of substrate.
Table 15 presents the characterization of the substrate in each time it was collect at the fish
farm, the period when it was utilized and the reactor(s) where it was used.
Table 15. Characterization of the substrate in each time it was collect at the fish farm, the period when it was
utilized and the reactor(s) where it was used.
Information
Period of use 0 to 18th
day 18th
to 84th
day 18th
to 56th
day 56th
to 84th
day
Reactor R1 and R2 R1 R2 R2
Characterization
pH 5.9 6.1 6.0 6.1
Salinity (g/l) 13.6 13.6 13.5 13.9
EC (mS/cm) 23.1 22.3 22.2 22.8
TS (g/l) 126.2 ± 2.04 100.0 ± 2.16 119.6 ± 2.30 94.8 ± 0.72
VS (g/l) 86.2 ± 2.05 70.3 ± 1.50 75.4 ± 1.00 58.7 ± 2.90
TSS (g/l) 79.2 ± 18.67 69.9 ± 0.92 97.7 ± 2.90 67.8 ± 1.38
VSS (g/l) 49.4 ± 11.60 60.1 ± 0.79 69.6 ± 2.59 52.7 ± 1.38
tCOD (g/l) 113.2 ± 5.51 89.6 ± 2.83 123.4 ± 6.46 84.3 ± 1.84
sCOD (g/l) 10.0 ± 0.59 12.1 ± 0.21 12.6 ± 0.16 9.1 ± 0.30
TN (g/l) 4.7 ± 0.07 3.5 ± 0.28 4.0 ± 0.06 3.1 ± 0.12
TP (g/l) 2.9 ± 0.32 2.7 ± 0.16 2.7 ± 0.11 1.0 ± 0.25
NH4+ (mg/l) 309.0 ± 4.24 289.3 ± 2.31 424.0 ± 3.61 241.8 ± 5.90
PO43-
(mg/l) 168.0 ± 5.66 218.7 ± 1.15 232.7 ± 3.06 251.0 ± 1.41

Anaerobic digestion of sludge from marine recirculation aquaculture systems
86
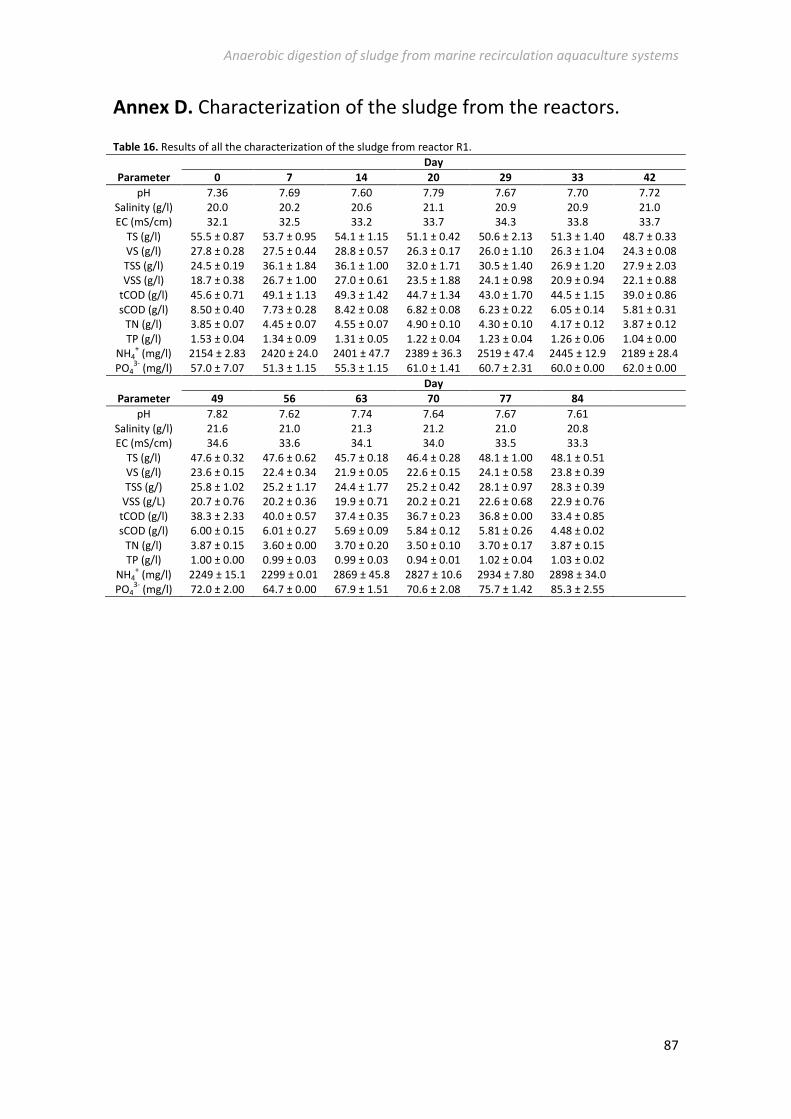
Anaerobic digestion of sludge from marine recirculation aquaculture systems
87
Annex D. Characterization of the sludge from the reactors.
Table 16. Results of all the characterization of the sludge from reactor R1.
Day
Parameter 0 7 14 20 29 33 42
pH 7.36 7.69 7.60 7.79 7.67 7.70 7.72
Salinity (g/l) 20.0 20.2 20.6 21.1 20.9 20.9 21.0
EC (mS/cm) 32.1 32.5 33.2 33.7 34.3 33.8 33.7
TS (g/l) 55.5 ± 0.87 53.7 ± 0.95 54.1 ± 1.15 51.1 ± 0.42 50.6 ± 2.13 51.3 ± 1.40 48.7 ± 0.33
VS (g/l) 27.8 ± 0.28 27.5 ± 0.44 28.8 ± 0.57 26.3 ± 0.17 26.0 ± 1.10 26.3 ± 1.04 24.3 ± 0.08
TSS (g/l) 24.5 ± 0.19 36.1 ± 1.84 36.1 ± 1.00 32.0 ± 1.71 30.5 ± 1.40 26.9 ± 1.20 27.9 ± 2.03
VSS (g/l) 18.7 ± 0.38 26.7 ± 1.00 27.0 ± 0.61 23.5 ± 1.88 24.1 ± 0.98 20.9 ± 0.94 22.1 ± 0.88
tCOD (g/l) 45.6 ± 0.71 49.1 ± 1.13 49.3 ± 1.42 44.7 ± 1.34 43.0 ± 1.70 44.5 ± 1.15 39.0 ± 0.86
sCOD (g/l) 8.50 ± 0.40 7.73 ± 0.28 8.42 ± 0.08 6.82 ± 0.08 6.23 ± 0.22 6.05 ± 0.14 5.81 ± 0.31
TN (g/l) 3.85 ± 0.07 4.45 ± 0.07 4.55 ± 0.07 4.90 ± 0.10 4.30 ± 0.10 4.17 ± 0.12 3.87 ± 0.12
TP (g/l) 1.53 ± 0.04 1.34 ± 0.09 1.31 ± 0.05 1.22 ± 0.04 1.23 ± 0.04 1.26 ± 0.06 1.04 ± 0.00
NH4+ (mg/l) 2154 ± 2.83 2420 ± 24.0 2401 ± 47.7 2389 ± 36.3 2519 ± 47.4 2445 ± 12.9 2189 ± 28.4
PO43-
(mg/l) 57.0 ± 7.07 51.3 ± 1.15 55.3 ± 1.15 61.0 ± 1.41 60.7 ± 2.31 60.0 ± 0.00 62.0 ± 0.00
Day
Parameter 49 56 63 70 77 84
pH 7.82 7.62 7.74 7.64 7.67 7.61
Salinity (g/l) 21.6 21.0 21.3 21.2 21.0 20.8
EC (mS/cm) 34.6 33.6 34.1 34.0 33.5 33.3
TS (g/l) 47.6 ± 0.32 47.6 ± 0.62 45.7 ± 0.18 46.4 ± 0.28 48.1 ± 1.00 48.1 ± 0.51
VS (g/l) 23.6 ± 0.15 22.4 ± 0.34 21.9 ± 0.05 22.6 ± 0.15 24.1 ± 0.58 23.8 ± 0.39
TSS (g/) 25.8 ± 1.02 25.2 ± 1.17 24.4 ± 1.77 25.2 ± 0.42 28.1 ± 0.97 28.3 ± 0.39
VSS (g/L) 20.7 ± 0.76 20.2 ± 0.36 19.9 ± 0.71 20.2 ± 0.21 22.6 ± 0.68 22.9 ± 0.76
tCOD (g/l) 38.3 ± 2.33 40.0 ± 0.57 37.4 ± 0.35 36.7 ± 0.23 36.8 ± 0.00 33.4 ± 0.85
sCOD (g/l) 6.00 ± 0.15 6.01 ± 0.27 5.69 ± 0.09 5.84 ± 0.12 5.81 ± 0.26 4.48 ± 0.02
TN (g/l) 3.87 ± 0.15 3.60 ± 0.00 3.70 ± 0.20 3.50 ± 0.10 3.70 ± 0.17 3.87 ± 0.15
TP (g/l) 1.00 ± 0.00 0.99 ± 0.03 0.99 ± 0.03 0.94 ± 0.01 1.02 ± 0.04 1.03 ± 0.02
NH4+ (mg/l) 2249 ± 15.1 2299 ± 0.01 2869 ± 45.8 2827 ± 10.6 2934 ± 7.80 2898 ± 34.0
PO43-
(mg/l) 72.0 ± 2.00 64.7 ± 0.00 67.9 ± 1.51 70.6 ± 2.08 75.7 ± 1.42 85.3 ± 2.55
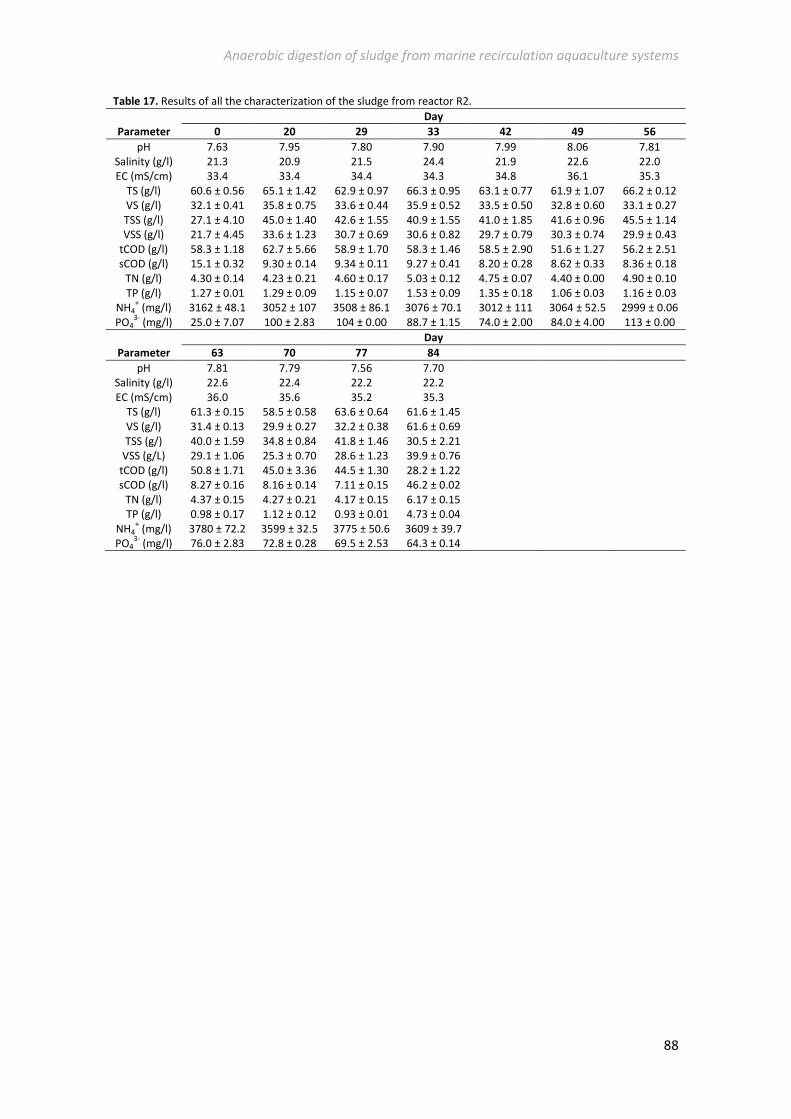
Anaerobic digestion of sludge from marine recirculation aquaculture systems
88
Table 17. Results of all the characterization of the sludge from reactor R2.
Day
Parameter 0 20 29 33 42 49 56
pH 7.63 7.95 7.80 7.90 7.99 8.06 7.81
Salinity (g/l) 21.3 20.9 21.5 24.4 21.9 22.6 22.0
EC (mS/cm) 33.4 33.4 34.4 34.3 34.8 36.1 35.3
TS (g/l) 60.6 ± 0.56 65.1 ± 1.42 62.9 ± 0.97 66.3 ± 0.95 63.1 ± 0.77 61.9 ± 1.07 66.2 ± 0.12
VS (g/l) 32.1 ± 0.41 35.8 ± 0.75 33.6 ± 0.44 35.9 ± 0.52 33.5 ± 0.50 32.8 ± 0.60 33.1 ± 0.27
TSS (g/l) 27.1 ± 4.10 45.0 ± 1.40 42.6 ± 1.55 40.9 ± 1.55 41.0 ± 1.85 41.6 ± 0.96 45.5 ± 1.14
VSS (g/l) 21.7 ± 4.45 33.6 ± 1.23 30.7 ± 0.69 30.6 ± 0.82 29.7 ± 0.79 30.3 ± 0.74 29.9 ± 0.43
tCOD (g/l) 58.3 ± 1.18 62.7 ± 5.66 58.9 ± 1.70 58.3 ± 1.46 58.5 ± 2.90 51.6 ± 1.27 56.2 ± 2.51
sCOD (g/l) 15.1 ± 0.32 9.30 ± 0.14 9.34 ± 0.11 9.27 ± 0.41 8.20 ± 0.28 8.62 ± 0.33 8.36 ± 0.18
TN (g/l) 4.30 ± 0.14 4.23 ± 0.21 4.60 ± 0.17 5.03 ± 0.12 4.75 ± 0.07 4.40 ± 0.00 4.90 ± 0.10
TP (g/l) 1.27 ± 0.01 1.29 ± 0.09 1.15 ± 0.07 1.53 ± 0.09 1.35 ± 0.18 1.06 ± 0.03 1.16 ± 0.03
NH4+ (mg/l) 3162 ± 48.1 3052 ± 107 3508 ± 86.1 3076 ± 70.1 3012 ± 111 3064 ± 52.5 2999 ± 0.06
PO43-
(mg/l) 25.0 ± 7.07 100 ± 2.83 104 ± 0.00 88.7 ± 1.15 74.0 ± 2.00 84.0 ± 4.00 113 ± 0.00
Day
Parameter 63 70 77 84
pH 7.81 7.79 7.56 7.70
Salinity (g/l) 22.6 22.4 22.2 22.2
EC (mS/cm) 36.0 35.6 35.2 35.3
TS (g/l) 61.3 ± 0.15 58.5 ± 0.58 63.6 ± 0.64 61.6 ± 1.45
VS (g/l) 31.4 ± 0.13 29.9 ± 0.27 32.2 ± 0.38 61.6 ± 0.69
TSS (g/) 40.0 ± 1.59 34.8 ± 0.84 41.8 ± 1.46 30.5 ± 2.21
VSS (g/L) 29.1 ± 1.06 25.3 ± 0.70 28.6 ± 1.23 39.9 ± 0.76
tCOD (g/l) 50.8 ± 1.71 45.0 ± 3.36 44.5 ± 1.30 28.2 ± 1.22
sCOD (g/l) 8.27 ± 0.16 8.16 ± 0.14 7.11 ± 0.15 46.2 ± 0.02
TN (g/l) 4.37 ± 0.15 4.27 ± 0.21 4.17 ± 0.15 6.17 ± 0.15
TP (g/l) 0.98 ± 0.17 1.12 ± 0.12 0.93 ± 0.01 4.73 ± 0.04
NH4+ (mg/l) 3780 ± 72.2 3599 ± 32.5 3775 ± 50.6 3609 ± 39.7
PO43-
(mg/l) 76.0 ± 2.83 72.8 ± 0.28 69.5 ± 2.53 64.3 ± 0.14
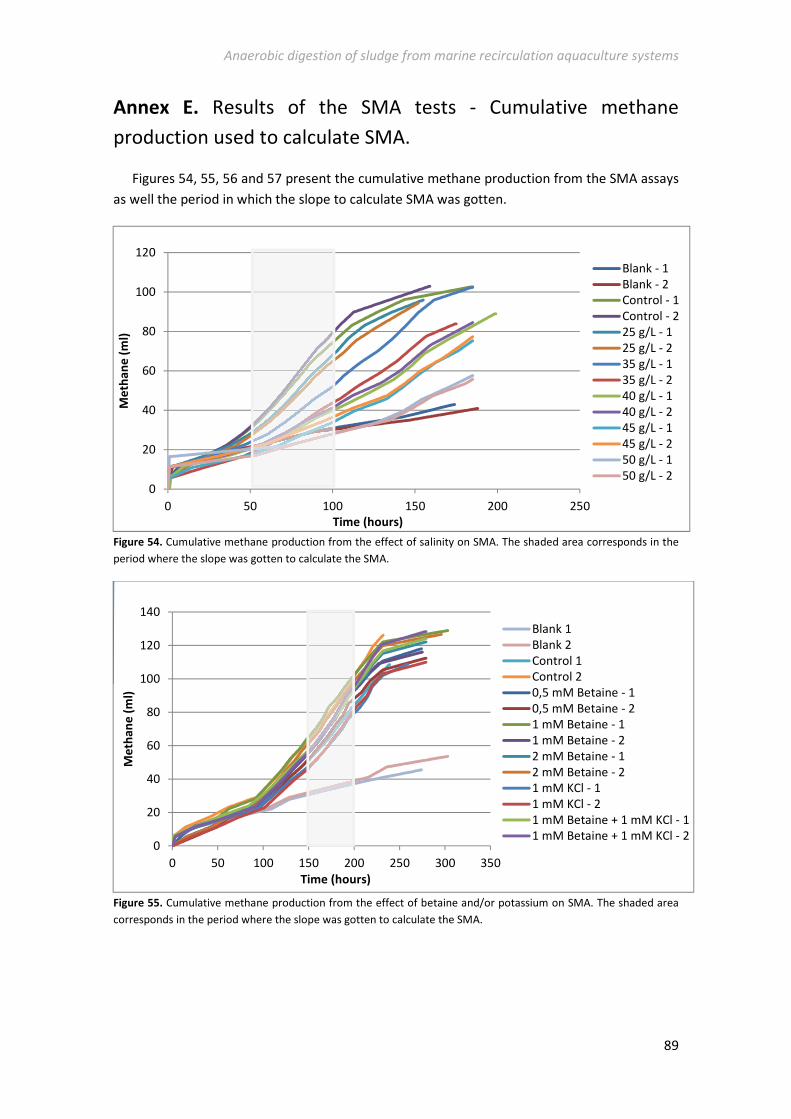
Anaerobic digestion of sludge from marine recirculation aquaculture systems
89
Annex E. Results of the SMA tests - Cumulative methane
production used to calculate SMA.
Figures 54, 55, 56 and 57 present the cumulative methane production from the SMA assays
as well the period in which the slope to calculate SMA was gotten.
Figure 54. Cumulative methane production from the effect of salinity on SMA. The shaded area corresponds in the
period where the slope was gotten to calculate the SMA.
Figure 55. Cumulative methane production from the effect of betaine and/or potassium on SMA. The shaded area
corresponds in the period where the slope was gotten to calculate the SMA.
0
20
40
60
80
100
120
0 50 100 150 200 250
Me
tha
ne
(m
l)
Time (hours)
Blank - 1
Blank - 2
Control - 1
Control - 2
25 g/L - 1
25 g/L - 2
35 g/L - 1
35 g/L - 2
40 g/L - 1
40 g/L - 2
45 g/L - 1
45 g/L - 2
50 g/L - 1
50 g/L - 2
0
20
40
60
80
100
120
140
0 50 100 150 200 250 300 350
Me
tha
ne
(m
l)
Time (hours)
Blank 1
Blank 2
Control 1
Control 2
0,5 mM Betaine - 1
0,5 mM Betaine - 2
1 mM Betaine - 1
1 mM Betaine - 2
2 mM Betaine - 1
2 mM Betaine - 2
1 mM KCl - 1
1 mM KCl - 2
1 mM Betaine + 1 mM KCl - 1
1 mM Betaine + 1 mM KCl - 2
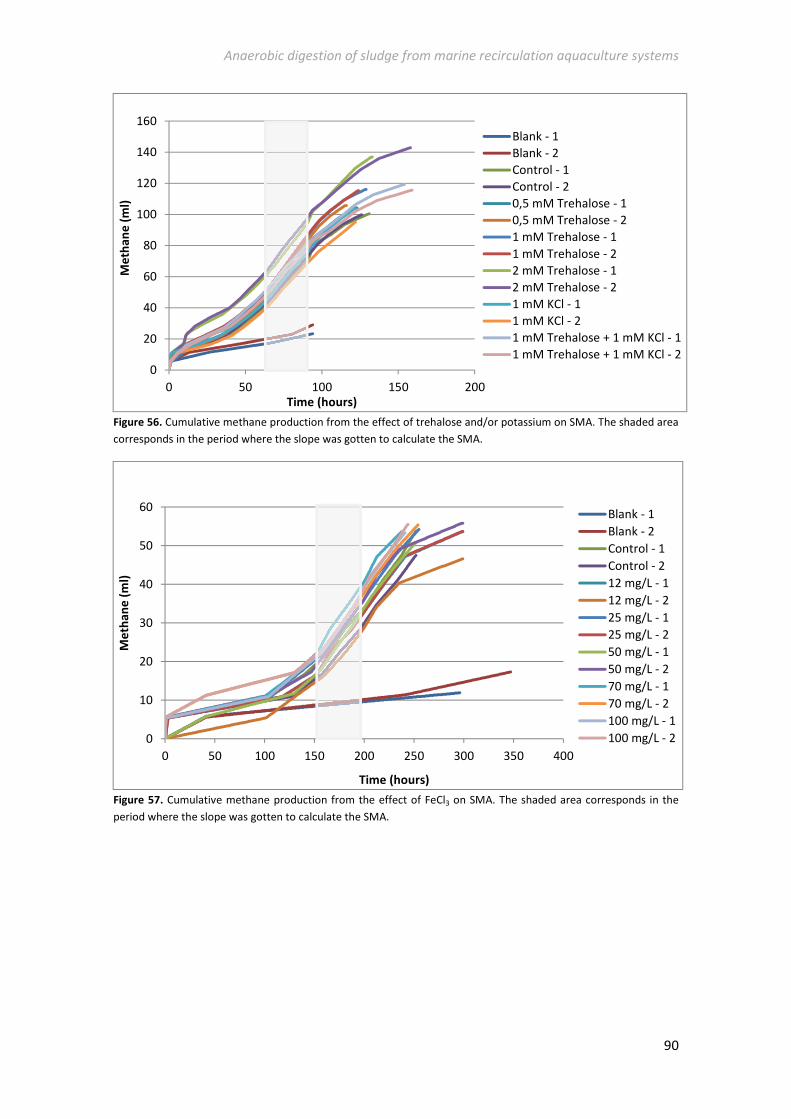
Anaerobic digestion of sludge from marine recirculation aquaculture systems
90
Figure 56. Cumulative methane production from the effect of trehalose and/or potassium on SMA. The shaded area
corresponds in the period where the slope was gotten to calculate the SMA.
Figure 57. Cumulative methane production from the effect of FeCl3 on SMA. The shaded area corresponds in the
period where the slope was gotten to calculate the SMA.
0
20
40
60
80
100
120
140
160
0 50 100 150 200
Me
tha
ne
(m
l)
Time (hours)
Blank - 1
Blank - 2
Control - 1
Control - 2
0,5 mM Trehalose - 1
0,5 mM Trehalose - 2
1 mM Trehalose - 1
1 mM Trehalose - 2
2 mM Trehalose - 1
2 mM Trehalose - 2
1 mM KCl - 1
1 mM KCl - 2
1 mM Trehalose + 1 mM KCl - 1
1 mM Trehalose + 1 mM KCl - 2
0
10
20
30
40
50
60
0 50 100 150 200 250 300 350 400
Me
tha
ne
(m
l)
Time (hours)
Blank - 1
Blank - 2
Control - 1
Control - 2
12 mg/L - 1
12 mg/L - 2
25 mg/L - 1
25 mg/L - 2
50 mg/L - 1
50 mg/L - 2
70 mg/L - 1
70 mg/L - 2
100 mg/L - 1
100 mg/L - 2
Recommended