Embed Size (px)
Citation preview

___. ___. ______ ________________________________
Bachelor’s degree (UAS)
Implementation of pulp and paper sludge in anaerobic wetdigester
Pilot-scale mobile biogas plant technology
Pasi Hynninen
Bachelor’s Thesis

SAVONIA UNIVERSITY OF APPLIED SCIENCES THESIS Abstract
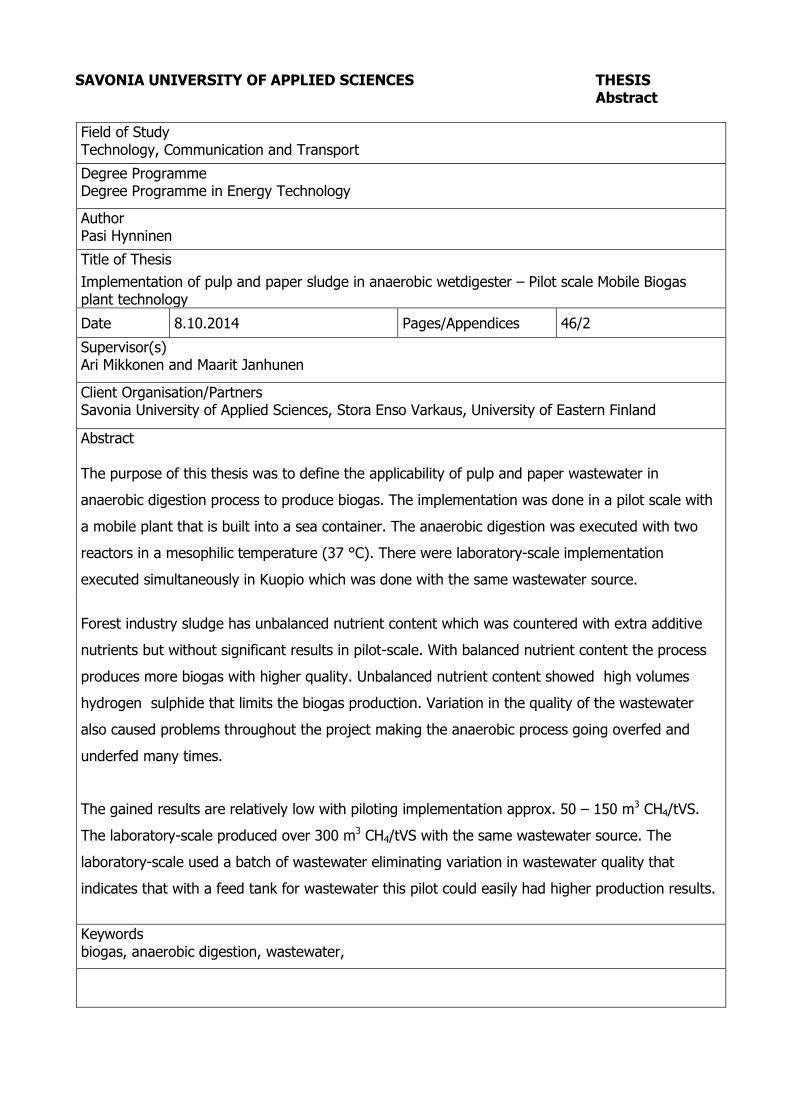
Field of Study Technology, Communication and Transport Degree Programme Degree Programme in Energy Technology
Author Pasi Hynninen Title of Thesis
Implementation of pulp and paper sludge in anaerobic wetdigester – Pilot scale Mobile Biogas plant technology
Date 8.10.2014 Pages/Appendices 46/2
Supervisor(s) Ari Mikkonen and Maarit Janhunen Client Organisation/Partners Savonia University of Applied Sciences, Stora Enso Varkaus, University of Eastern Finland Abstract The purpose of this thesis was to define the applicability of pulp and paper wastewater in
anaerobic digestion process to produce biogas. The implementation was done in a pilot scale with
a mobile plant that is built into a sea container. The anaerobic digestion was executed with two
reactors in a mesophilic temperature (37 °C). There were laboratory-scale implementation
executed simultaneously in Kuopio which was done with the same wastewater source.
Forest industry sludge has unbalanced nutrient content which was countered with extra additive
nutrients but without significant results in pilot-scale. With balanced nutrient content the process
produces more biogas with higher quality. Unbalanced nutrient content showed high volumes
hydrogen sulphide that limits the biogas production. Variation in the quality of the wastewater
also caused problems throughout the project making the anaerobic process going overfed and
underfed many times.
The gained results are relatively low with piloting implementation approx. 50 – 150 m3 CH4/tVS.
The laboratory-scale produced over 300 m3 CH4/tVS with the same wastewater source. The
laboratory-scale used a batch of wastewater eliminating variation in wastewater quality that
indicates that with a feed tank for wastewater this pilot could easily had higher production results.
Keywords biogas, anaerobic digestion, wastewater,

4
ABBREVIATIONS AND USED SYMBOLS °C (Celsius) Unit of temperature. AD Anaerobic digestion is a microbiological process of decomposition in
absence of oxygen. This process is used to biogas production. Biogas Gas mixture created from AD. Consists of methane and carbon dioxide. Carbon dioxide Chemical formula CO2. Common gas in the air. Also a common product
gas in burning process. CHP Combined heat and power plant. Unit that produces electricity and heat. DM Dry matter including ash and organic dry matter. Synonym for TS. GWh Giga watt hour is one billion watt hours. Unit of energy. HRT Hydraulic retention time. This term measures the average length of time
in days that a soluble compound remains in a constructer bioreactor. Hydrogen sulphide Chemical formula H2S. Colorless gas with odor similar to rotten eggs. In
large proportions it’s poisonous, corrosive, flammable and explosive gas Inhibition Inhibition is a chemical state where the rate of chemical reactivity is
slowed done or halted. kg Kilogram is one thousand grams. Metric unit describing weight. l Liter is metric unit describing volume. Thousand liters is one cubic
meter. Nm3 Normal cubic meter in standard pressure and temperature. Pressure in
standard is 1,01325 bar and temperature 20 °C. Nm3 CH4/tVS Normal cubic meters of methane per 1000 kilograms of volatile solids.
This term is widely used in comparing different substrates for the production of biogas.
Methane Chemical formula CH4. Flammable gas with high energy content. Also
known as natural gas. MJ Mega joule is one million joules. Unit of energy. mg Milligram is equal to one thousandth (10-3) of a gram. Metric unit
describing weight pH Logaritmic pH-scale from 0 to 14 describes the acidity of an aquenous
solution. Values below 7 are said to be acidic and over 7 are alkaline. Pure water is considered neutral and has pH close to 7.
ppm Parts per million. Describes small quantities of dissolved substance in
gas or liquid. oDM Organic dry matter that can easily transform to gas. Synonym for VS.

5
TS Total solids including ash and organic dry matter. Synonym for DM. VFA Volatile fatty acids with a carbon chain of six or fewer. This
term is used particularly with carboxylic acids that are created through fermentation or digestion.
VS Volatile solids are organic solid mass that can easily
transform to gas. Synonym for oDM.

6
FOREWORD I appreciate the opportunity to be part of this project even though there were lots of difficulties. I
would like to thank my supervisors Maarit Janhunen and Ari Mikkonen for supporting the writing
process. Thanks also to project engineer Tero Kuhmonen with technical support with operating the
pilot-scale mobile biogas plant. Thanks also to docent Olavi Raatikainen and researcher Tuomas
Huopana from University of Eastern Finland with co-operation and helping with calculations.
I thank personnel of Stora Enso of giving me opportunity and orientation. Special thanks to
Mr. Tenho Pakarinen and Mrs. Susanna Pehkonen for giving guidance and co-operation through
the project. I’d like to thank all the control operator personnel in the wastewater treatment plant.
Special thanks to operator Ismo Holopainen for giving me comprehensive orientation with the
processes in the wastewater treatment. Also thanks for all other unmentioned personnel who gave
assistance to this pilot project.
I would also give thanks to my family, my friends and last but not least my lovely wife Anniina
for supporting me through the whole time.

7
CONTENTS
1 INTRODUCTION ............................................................................................. 8
2 THEORETICAL BASIS ...................................................................................... 9
2.1 ‘METLI’ project ......................................................................................... 9
2.2 Biogas as an energy resource .................................................................... 9
2.2.1 Composition and main properties.................................................... 10
2.2.2 Main applications for biogas ........................................................... 11
2.3 Biogas production ................................................................................... 12
2.3.1 Anaerobic digestion (AD) ............................................................... 13
2.3.2 Legislation related to biogas production in Finland ........................... 16
2.3.3 Optimal production circumstances .................................................. 17
2.3.4 Volatile fatty acids, alkalinity and pH in biogas production ................ 19
2.4 Forest industry sludge ............................................................................. 20
2.4.1 Current treatment of the sludge in Varkaus ..................................... 21
2.5 Description of destination infrastructure ................................................... 23
2.5.1 Wastewater treatment plant ........................................................... 23
2.5.2 Pilot-scale mobile biogas plant ........................................................ 27
3 EXPERIMENTATION ...................................................................................... 33
3.1 Preliminaries, planning and implementation .............................................. 33
3.1.1 Argumentation for using selected sludge ......................................... 37
3.2 Experiments with pilot-scale mobile biogas plant ....................................... 38
3.3 Analysis in laboratory .............................................................................. 39
4 RESULTS ...................................................................................................... 40
4.1 Biogas productivity with pilot-scale mobile biogas plant .............................. 40
4.2 Nutrient impact to the AD process ............................................................ 44
4.3 Evaluation on experimentation ................................................................. 46
4.4 AD as a treatment for the mixed sludge .................................................... 46
5 CONCLUSION ............................................................................................... 48
5.1 Occurred problems and need for further development ............................... 48
REFERENCES .................................................................................................... 50
APPENDICES
Appendix 1 PROCESS AND INSTRUMENTATION DIAGRAM OF PILOT-SCALE
MOBILE BIOGAS PLANT
Appendix 2 A SAMPLE OF RECORDS OF REGULAR CONTROL ON THE
PREMISES

8
1 INTRODUCTION
This thesis report is a part of ‘METLI’ project (Innovative Services for Forest Industry
Sludge Management) which aim is to find solution for forest industry’s sludge treatment
in the future. The project has several partners, but for this study the most significant
parties are Savonia University of Applied Sciences, Stora Enso Varkaus and University
of Eastern Finland. Sludge treatment has to improve in 2016 when new legislation takes
effect. One potential treatment method is anaerobic digestion that is tested in this study
for an alternative for sludge treatment.
The research is done in Stora Enso’s wastewater treatment plant in Varkaus with a pilot-
scale mobile biogas plant. The role of the author in the study is to operate the biogas
production and analyze the forthcoming results. The aim of the study is to determine the
production potential and to test different sorts of ways to improve the anaerobic
digestion process. Alongside this study there is continuous laboratory-scale experiment
with the same sludge to support this study.
The research was carried out with anaerobic digestion of wastewater from industrial
plants of Stora Enso Varkaus. The digestion was done in a mesophilic temperature
range (approx. 37 °C). Evaluation of this study focuses on volumes and quality of
biogas. Also experiments on improving volumes and quality of biogas were executed
and the results are evaluated.
This thesis can be divided roughly to theoretical and experimental section. Theoretical
part of the study contains description of ‘METLI’ project and the pilot-scale mobile
biogas plant. Biogas and anaerobic digestion process is also reviewed. The
experimental section introduces progress of the experimentation and gained results with
evaluation.

9
2 THEORETICAL BASIS
2.1 ‘METLI’ project
The project is carried out by Savonia University of Applied Sciences and University of
Eastern Finland. Some of the research was outsourced to sub-contracting partner
Ostfalia University of Applied Sciences. The aim of the project is to create pellets
through HTC process, producing biogas through AD process or using both methods
using forest industry sludge. The treatment methods have to be able to correspond to
new strict legislation and bring all necessary parties together.
Savonia University of Applied Sciences has the responsibility for experimental study with
different sludge fractions in anaerobic digestion. The aim is to define biogas production
potential, to analyze the residue after anaerobic digestion and to refine anaerobic
process as productive as possible. The experimentation is executed in laboratory-scale
and pilot-scale.
In this project Eastern University of Finland is defining all the current ways to treat forest
industry sludge and the volumes that forest industry are producing with energy potential.
Also other properties of the wastewater are reviewed which have impact to the concept
for dealing forest industry sludge. The university also monitors the biogas process,
develops better gas measurement analytics and evaluates energy balance.
The main focus of the research by Ostfalia University of Applied Sciences is on testing
of HTC (Hydro Thermal Carbonization) process. The process is evaluated as a means
to treat forest industry sludge. In wastewater treatment HTC process produces
carbonaceous pellets that can be burned in power plant or used for soil improvement.
The project also studies the possibilities to combine anaerobic digestion and HTC
process.
2.2 Biogas as an energy resource
Biogas is renewable and environmentally safe energy source that can be used to
produce electricity, heat and mechanical energy with relatively low investments. The
technology for producing biogas hasn’t been optimized to the same level with other
commercial fuels. With biogas a country can improve its energy balance and make a
huge contribution to the preservation of the natural resources and to protection of
environment. Biogas in considered to be carbon neutral which means that it has net zero

10
carbon footprint. The carbon dioxide released from the combustion of biogas is
considered not to increase the green house effect. (Al Seadi, 2008. pp. 10-11;
Janhunen, 2012. p. 9; Toivanen, 2008. p. 8)
Biogas is one of the most upfront technologies for upgrading waste to valuable fertilizer.
Biogas is also very versatile energy source that can produce heat, steam, electricity and
vehicle fuel. Biogas can also be upgraded to biomethane that can be fed to natural gas
grid. Biogas has been very successful over the last 20 years as an energy source.
Roughly 10 000 biogas plants are in operation in agriculture, industry and waste water
treatment in Europe. The most of the European plants are located in Germany.
(European Biogas Association, 2013)
Biogas is formed from biomass which is actually a living storage of solar energy through
photosynthesis. The biomass can be also from animals or anywhere from carbon based
food chain, but it basically wouldn’t be possible without photosynthesis. Biogas is
comparable to natural gas only having lower quality with having much lower content of
methane. But biogas has advantage of being renewable as natural gas is a fossil fuel
and it takes thousands of years to form. (Al Seadi, 2008. p. 11; Manu, 2011. p. 9)
2.2.1 Composition and main properties
Biogas is colorless and almost odorless gas mixture. The density of biogas is roughly
1,22 kg/Nm3. Biogas can spontaneously combust at temperature of 650 – 750 °C. The
lower heating value varies from 14,4 to 21,6 MJ/Nm3. One normal cubic meter produces
4-6 kWh of energy and only combustion products are carbon dioxide and water vapor.
(Alakangas, 2000. pp. 144-146)
Biogas is combustible gas which energy content is bounded in methane. The higher the
methane content, the higher the energy content. Used production methods and
decomposing material have significant effect on the composition and properties of
biogas. Methane content is normally from 50 up to 75 percent. When methane content
of biogas is raised higher than 95 percent, term biomethane is used. Table 1 contains
average biogas composition values. (Al Seadi, 2008. pp. 41, 47)

11
Table 1. Composition of biogas (Al Seadi, 2008. p.41)
Compound Chemical symbol Content (Vol.-%)
Methane CH4 50-75
Carbon dioxide CO2 25-45
Water vapour H2O 2 (20°C) – 7 (40°C)
Oxygen O2 less than 2
Nitrogen N2 less than 2
Ammonia NH3 less than 1
Hydrogen H2 less than 1
Hydrogen sulphide H2S less than 1
2.2.2 Main applications for biogas
Energy utilization of biogas is very flexible. Usage depends on local demand. If natural
gas grid is available, the biogas can be upgraded to biomethane and inserted to the grid.
Biomethane can also be used as vehicle fuel. Cruder biogas can be burned to obtain
heat, electricity or both via combined heat and power (CHP).
When biogas is used as a vehicle fuel it is upgraded to match the properties of natural
gas. In practice the carbon dioxide and sulfur compounds are removed and the
upgraded gas is dried and pressurized to 200 – 300 bar pressure. Upgraded biogas is
compatible with modern petrol engines but its use as a vehicle fuel hasn’t become
popular in Finland. The reason for unsuccessful popularity is partly because of scattered
distribution network and an installation of an extra fuel container. (Latvala 2009, p. 47)
If biogas is used to produce only heat the plant requires a facility that utilizes the
produced heat throughout the year. Investments for heat production are low and it is
very reliable option. In practice only the water vapor is separated from the biogas and
then the gas can be burned in gas burner unit. The total efficiency of heat production is
usually very high. Up to 95 % of energy can harvested and only a little amount of energy
is wasted. (Latvala 2009, pp. 44-45)
With combined heat and power production can achieve up to 90 % efficiency. After
separating water vapor the biogas is directed to gas motor or micro turbine. Gas motors
are typically 0,1 – 2 MW and micro turbines less than 1 MW. However micro turbines
can achieve same power when they are overlapped. Micro turbines are more expensive
investment but their operating and maintenance costs are lower compared to gas
motors. (Latvala 2009, pp. 44-45)

12
The energy production is renewable and using biogas reduces greenhouse gas
emissions because methane is more effective greenhouse gas than carbon dioxide.
Biogas production provides environmentally safe recycling of manure and other organic
wastes. Biogas plants can offer economical benefits to farmers and provide improved
fertilization and veterinary safety through sanitation of digestate.
2.3 Biogas production
The production of biogas is divided to farm-scale biogas plants, municipal and industrial
wastewater treatment plants, landfill gas recovery plants and municipal solid wastes
treating biogas plants in Finland. Chart 1 shows that landfill gas recovery is the most
significant biogas utilizer at the time. (Huttunen, 2013. p. 3)
Chart 1. Biogas production in Finland divided by biogas plant types in 2012. (Huttunen,
2013. p. 18)
In the year 2012 the amount of produced biogas was 55,9 million m3. The energy
production of thermal, electrical and mechanical energy was in total 256,2 GWh. The
energy production has been growing progressively that can be seen in chart 2.
(Huttunen, 2013. p. 3)

13
Chart 2. The amount of energy produced with biogas in Finland from 1994 to 2012.
(Huttunen, 2013. p. 18)
2.3.1 Anaerobic digestion (AD)
AD is a microbiological process of decomposition in absence of oxygen. In the process
part of organic matter transforms to methane that is the desirable product of the
process. The decomposed mass that is left after the process is called digestate. AD is
common process to natural environments such as stomach digestion of ruminants and
peat bogs.
AD can be divided in four linked process steps: hydrolysis, acidogenesis, acetogenesis
and metanogenesis. In the process the material is continuously broken down to smaller
parts. In each process step specific micro-organisms decompose the products of
previous process step. Final product gas contains primarily methane and also carbon-
dioxide while optimal circumstances are in effect. Anaerobic digestion process by stages
is presented in diagram 1. (Al Seadi, 2008. pp. 16-21)

14
Diagram 1. Stages in anaerobic digestion (Al Seadi, 2008. p. 21).
Hydrolysis
In the first stage hydrolytic micro-organisms break carbohydrates, fats and proteins into
sugars, fatty acids and amino acids. In other words long polymers are split to smaller
parts such as glucose, glycerol, purine and pyridine. There are various micro-organisms
in this step because of digestion matter is also versatile. Various molecules require
different enzymes to digest and each micro-organism has its own enzymes that are
used to brake molecules to smaller products. The process is very slow compared to
other process steps and presence of longer slowly degradable molecules such as
cellulose and lignin limits the digestion efficiency. (Al Seadi, 2008. p. 22)

15
Acidogenesis
Acidogenesis continues from hydrolysis stage. Sugars, fatty acids and amino acids are
degraded into carbon acids, alcohols, carbon dioxide, ammonia and hydrogen. Volatile
fatty acids (VFA) and alcohols are also produced. The main product for this step is
carboxylid acid (CH3COOH). In addition propionic acid, formic acid, lactic acid, butyric
acid and succinic acid are produced. The alcohols and ketones that normally are
produced are ethanol, methanol, glycerol and acetone. (Al Seadi, 2008. p. 22)
Acetogenesis
In the third phase AD the acetogenes split VFA and alcohols to smaller parts such as
acetate, hydrogen and carbon dioxide. Other products from acidogenesis can be
converted to methane without acetogenesis. Acetogenesis and metanogenesis are
usually in symbiosis with each other. A low hydrogen content is required to prevent the
inhibition of growth of the micro-organisms. The hydrogen that acetogens produce is
consumed by methanogens. There is a balance between producers and consumers of
hydrogen. If acetogenens is halted, it will leave methanogens without substrate and
produced gas will be mostly carbon dioxide. (Al Seadi, 2008. pp. 22-23; Lund, 2010. pp.
10-13)
A part of hydrogen produced hydrogen is consumed by sulphate reducing bacteria and
thus they are competing with methanogens. Sulphate reducing bacteria are dominant
over methanogens when acetate content is low and vice versa when acetate content is
high. Sulphate reducing bacteria produce hydrogen sulphide that can cause inhibition to
the AD process. (Lund, 2010. pp. 10-13)
Methanogenesis
Methanogenesis utilizes products from acidogenesis and acetogenesis. This is the
slowest process step in AD. The production of methane is also very sensitive and
requires specific surrounding conditions. Temperature, pH, composition of feedstock
and feeding rate are the most common factors influencing the methane production.
Methanogens are unique life forms that can produce methane. Methanogens can be
divided to hydrogentrophic methanogens and acetrophic methanogens. (Al Seadi,
2008. p. 23)

16
2.3.2 Legislation related to biogas production in Finland
Finland is a part of EU (European Union) so European directives commissioned by EU
are introduced to Finnish legislation. Despite European directives every country has its
own legislation so differences between EU members are common. European and
Finnish legislation have made progress benefitting activity around biogas production.
The increasingly stringent treatment requirements have brought new parties and
increased business. On the other hand strict legislation can cause unprofitability and
continuously changing legislation brings uncertainty to the investors.
EU directive on the promotion of the use of energy from renewable sources also known
as RES-directive (Renewable Energy Sources) promotes the use of renewable energy
in traffic and final energy consumption. The final objective is to produce 10 % of traffic
fuels and 20 % of total energy with renewable energy solutions. The objective has been
divided between member countries and in Finland the objective is to produce 38 % of
final energy consumption by renewable energy sources. (2009/28/EC)
European directive will limit the amount of organic matter in landfills in Europe
(2008/98/EC). Finnish government decree determines that on 1st of January 2016 waste
or organic matter cannot be placed to landfills if TOC (Total Organic Carbon) or LOI
(Loss on Ignition) is over 10 per cent. The new legislation will require more advanced
treatment for the wastes from forest industry in the near future. (Jermakka 2012, p. 20)
Finnish legislation controls biogas production and every biogas plant must have
approvals (MRL 1999/132). Building a biogas plant requires planning permission from
local town or city. Also an environmental permit is also required. Environmental law also
demands to use best available technology (BAT) where a danger of environmental
pollution can be found (YSL 2000/86).

17
2.3.3 Optimal production circumstances
The production of biogas is influenced by various factors. Temperature needs to be
stable for the bacteria perform optimally in the process. Temperature can be divided in
three separate ranges: psycrophilic (below 25° C), mesophilic (25-45° C) and
thermophilic (45-55° C). Each step has its advantages and disadvantages, but roughly
the production of methane is higher with hotter temperature. Most common temperature
stage is mesophilic that is usually the most economical solution. Production is not
though linear with temperature that shows in chart 3 below. (Al Seadi, 2008. p. 23)
Chart 3. Relative growth rates of methanogens. (Al Seadi, 2008. p. 25)
Feeding rate and pH affect each other in AD. Methane can be produced in very narrow
pH range from 5,5 to 8,5. Optimal pH is between 6,8 and 7,2 for mesophilic digestion.
AD process is notably inhibited if pH is decreases below 6,0 or rises over 8,3.
Overfeeding usually causes pH to drop producing excessively fatty acids. A significant
property considering pH changes is alkalinity. Alkalinity describes the buffer capacity to
prevent changes in pH levels. If alkalinity is high the increase of acids doesn’t cause
violent changes in pH level. However acids will consume alkalinity. (Lund, 2010. pp. 13-
21)
Sludge, biowaste or other organic matter is used as a feedstock to AD process has to
stay in the reactor for a certain time. Anaerobic micro-organisms reproduce slowly and it
takes a lot of time to digest the feedstock and the organisms get only little energy from
digesting. Delay of the input feed in the AD process has to as long as the slowest micro-
organisms regenerate. For a hygenisation and reducing organic matter the delay is

18
usually doubled compared to regeneration of methanogens. Hydraulic retention time
(HRT) is used to calculate the time needed for the feedstock to stay in reactors. HRT is
calculated according to the following equation. (Lund 2010, pp. 13-21; Janhunen 2012,
p. 30)
HRT = VR / V (1),
where HRT is hydraulic retention time (days)
VR is digester volume (m3)
V is colume of substrate fed per day (m3/d)
Stirring is also widely used method to improve the vitality of the bacteria in AD.
Approximately 90 percent of biogas plants use mechanical stirring equipment. Other
way of stirring is done by hydraulic, pneumatic or passive solutions. Without stirring the
reactors would form swimming layers, the up-flow of gas bubbles would be slower and
micro-organisms would be more passive. (Al Seadi, 2008. p. 80)
To optimize the feeding according to Kuittinen’s lecture the stirring should be stopped for
a moment and let the sludge form sediments and firstly remove the input amount of
sludge from the bottom of the reactor. This enables that the output has less fresh input
mixed in it. The bottom sediment is also the least likely to produce biogas. After the
output the feeding of the fresh input and stirring can continue. The feeding should be
done from the upper part of the reactor to make it less likely to the input to mix with
output as shown in picture 1. (Kuittinen, 2013)

19
Picture 1. Ideal biogas reactor structure (Kuittinen, 2013).
2.3.4 Volatile fatty acids, alkalinity and pH in biogas production
Volatile fatty acids (VFA) are compounds produced during acidogenisis. VFA molecules
have a carbon chain up to 6 atoms. Alkalinity can be described as a buffer that prevents
quick change pH. Acidity of a solution is measured with pH values from 0 to 14. The pH
7 is defined as a neutral value. Below pH 7 is acid and over pH 7 is alkaline. (Al Seadi,
2008. p.26)
In biogas production the acid-forming bacteria occurs above pH 5,0 but methane-
forming bacteria does not occur below pH 6,2. Ideal pH values are between 6,8 and 7,2
in anaerobic digestion. The pH decreases with the production of VFA, but the methane-
forming bacteria consumes VFA and converts them to methane and carbon dioxide.
With low alkalinity the pH can decrease below 6,2 and then methane production is
inhibited. (Gerardi, pp.99-103)

20
The process stability is achieved with high alkalinity concentration. Large concentration
of VFA requires high alkalinity or the decrease in pH value is unavoidable. A decrease in
alkalinity can be detected when there are rapid changes in pH. The alkalinity is
dependent of feed material. For example cow manure has surplus in alkalinity and the
AD process can produce lots of VFA before it affects pH. (Gerardi, pp.99-103)
In conclusion VFA concentration alone can’t be recommended as process monitoring
parameter because VFA, alkalinity and pH are linked properties in biogas production.
The ratio between VFA and alkalinity is a very common and reliable way to view the
state of an AD process. The pH values are more easily monitored but with low alkalinity
the value can change rapidly. (Gerardi, pp.99-103)
2.4 Forest industry sludge
In the year 2012 the forest industry produced 10,7 million tons paper and paperboard
and 10,2 million tons pulp in Finland. The forest industry requires large amounts of water
and the water can circulate up to 15 times in the process before it is treated and
released to water system. The amount of wastewater produced was 32,77 m3 per
produced ton. (Metsäteollisuus ry, 2013. pp. 6-14)
The composition of forest industry sludge can’t be defined accurately, but table 2 shows
typical composition of primary sludge and secondary sludge. The wastewater treatment
in forest industry produces several sludge fractions in the treatment process. Primary
sludge is formed in primary treatment and contains mostly tree fibers and bark.
Secondary treatment is formed in secondary treatment and it is mainly dead microbes
and cell mass. (Ojanen, 2001. p. 10)
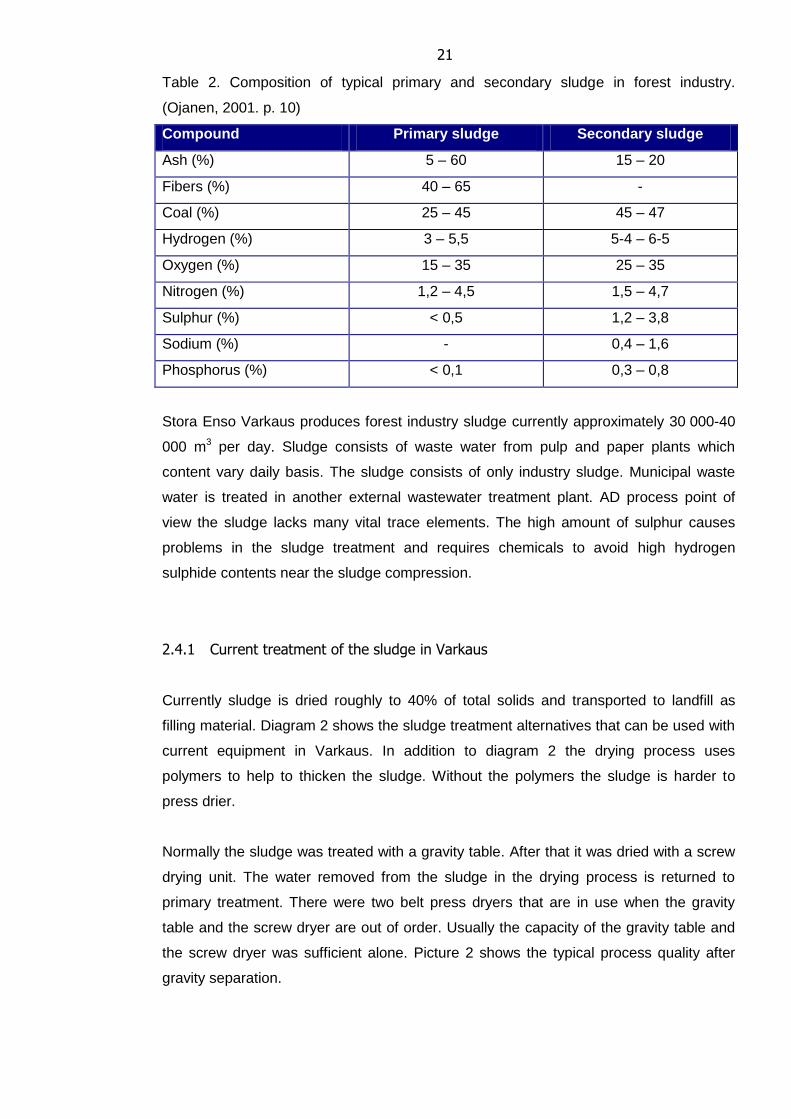
21
Table 2. Composition of typical primary and secondary sludge in forest industry.
(Ojanen, 2001. p. 10)
Compound Primary sludge Secondary sludge
Ash (%) 5 – 60 15 – 20
Fibers (%) 40 – 65 -
Coal (%) 25 – 45 45 – 47
Hydrogen (%) 3 – 5,5 5-4 – 6-5
Oxygen (%) 15 – 35 25 – 35
Nitrogen (%) 1,2 – 4,5 1,5 – 4,7
Sulphur (%) < 0,5 1,2 – 3,8
Sodium (%) - 0,4 – 1,6
Phosphorus (%) < 0,1 0,3 – 0,8
Stora Enso Varkaus produces forest industry sludge currently approximately 30 000-40
000 m3 per day. Sludge consists of waste water from pulp and paper plants which
content vary daily basis. The sludge consists of only industry sludge. Municipal waste
water is treated in another external wastewater treatment plant. AD process point of
view the sludge lacks many vital trace elements. The high amount of sulphur causes
problems in the sludge treatment and requires chemicals to avoid high hydrogen
sulphide contents near the sludge compression.
2.4.1 Current treatment of the sludge in Varkaus
Currently sludge is dried roughly to 40% of total solids and transported to landfill as
filling material. Diagram 2 shows the sludge treatment alternatives that can be used with
current equipment in Varkaus. In addition to diagram 2 the drying process uses
polymers to help to thicken the sludge. Without the polymers the sludge is harder to
press drier.
Normally the sludge was treated with a gravity table. After that it was dried with a screw
drying unit. The water removed from the sludge in the drying process is returned to
primary treatment. There were two belt press dryers that are in use when the gravity
table and the screw dryer are out of order. Usually the capacity of the gravity table and
the screw dryer was sufficient alone. Picture 2 shows the typical process quality after
gravity separation.

22
Picture 2. Sludge coming out of the gravity table and dropping to screw dryer.
Alternatively as the diagram 2 shows the dried sludge after the screw drying unit could
be burned in Stora Enso’s power plant in Varkaus. Burning the dried sludge has been
trialed in Varkaus, but it is not currently in use because of low heating value, high
moisture and high ash content.
Diagram 2. The treatment options of the mixed sludge in Stora Enso Varkaus.

23
Current treatment unfortunately doesn’t make use of sludge’s full potential as an energy
source and all nutrient content is wasted. Anaerobic digestion with post-processing
facilities could potentially harvest energy as biogas and produce nutrient rich fertilizer.
2.5 Description of destination infrastructure
Stora Enso Varkaus mills locates very close to the city of Varkaus. A public traffic road
passes between pulp factory and lime kiln. Varkaus is a small city in eastern Finland
with approximately 22 000 habitants and Stora Enso is still major employer with 260
employees and its power plant’s chimney stacks are clear landmarks for the city.
Stora Enso Varkaus is continuing long industrial history that has started in the 19th
century. In 1909 Walter Ahlström bought the paper mills in Varkaus and he continued
expanding Varkaus mills. Walter Ahlström became very significant actor in Varkaus
owning sawmill industry, chemical and mechanical forest industry and workshops. The
legacy of Walter Ahlström crumbled little by little and in the year 1987 Enso-Gutzeit
bought the forest industry from company currently known as Ahlstrom. Enso-Gutzeit
merged with Swedish company Stora and so the company Stora Enso was formed.
(Jääskeläinen, 2003. pp. 11-15, 43-44)
2.5.1 Wastewater treatment plant
Stora Enso Varkaus has within its industrial area a wastewater treatment plant for all the
industrial sewage it produces. The main features of the wastewater treatment process
are introduced in diagram 3. The used sludge for the AD process consists of a mix of
primary and secondary sludge.

24
Diagram 3. The wastewater treatment process in Stora Enso Varkaus.
The sewage is at first neutralized to achieve pH 7. The neutralized sewage goes to
primary treatment where the heavy solids settle to the bottom. Primary treatment is a
round pool which has a diameter of 55 meters. The picture 3 shows the green rotating
skimmer that collects floating solid mass and near the bottom a scraper with a turbine in
the middle prevents the bottom sludge from solidifying. After the primary treatment the
water from top of the primary treatment goes to the aeration pool where micro-
organisms digest the sewage. Part of the aeration pool can be seen in the background
in picture 3.

25
Picture 3. Primary treatment pool with a rotating scraper.
The aeration pool has approximately 40 aerators that mix the wastewater so that it has
more oxygen for the micro-organisms. The size of aeration pool gives micro-organisms
several days to digest wastewater before it continues to secondary treatment where
heavy solids settle to the bottom again. In the secondary treatment the bottom sewage
(secondary sludge) consists mainly of dead micro-organisms. Secondary treatment is
very similar to primary treatment but it is a bit larger pool than in the primary step.
Picture 4 shows similar structure of secondary treatment pool, but the green rotator
doesn’t have a skimmer attached as in primary treatment.

26
Picture 4. Secondary treatment pool
After the secondary treatment there is still a tertiary treatment where the sewage is
treated chemically and antifoam agents are added. The cleared sewage is returned to
local water system. The treated water has only small amount of solids, but enough to
have a brown color as seen in picture 5. The chemical treatment was rarely used during
the experimentation, because the water was usually clearer than authorities require
even without chemical treatment. The reason for a rare use of tertiary treatment can be
explained with the low flow of wastewater that was most of the time approx. 30 000 –
40 000 m3 per hour through this experiment that is far less than the maximum capacity
of 60 000 m3 per hour.

27
Picture 5. Treated wastewater that is going to the local water system.
The sludge from primary, secondary and tertiary treatments are dried to 40-45% mass
solids. The dried sewage is piled next to the building where it is dried and there it is
transported to Stora Enso’s own landfill in Pukkikangas.
2.5.2 Pilot-scale mobile biogas plant
The facility for researching the production of biogas was built in 2009 by Metener. The
pilot-scale mobile biogas plant (picture 6) is owned by Savonia and it has been used for
several projects and two studies have been written before this current study. It was
originally planned for educational and research purposes and it isn’t capable for
commercial biogas production.

28
Picture 6. The pilot-scale mobile biogas plant (Janhunen, 2012. p. 35).
The biogas plant is built into a sea container to make it easy to change its location. The
sea container contains two 3 m3 reactors which can be used separately or sequentially.
The reactors temperature can be adjusted therefore the experiments can be done in any
desired temperature. Temperature is controlled with water circulation system where
magnetic valves stop the flow inside the reactor when the target temperature is reached.
The inner structure of the reactor can be seen in picture 7 where water circulation pipes
and stirring screw are clearly visible. The liquid used in water circulation consists 20 per
cent of glycol to prevent corrosion and freeze-up. The water boiler is heated with biogas
burner or with thermal element if biogas is not available.

29
Picture 7. The internal structure of an empty reactor. (Janhunen, 2013)
The biogas is stored to a 1 m3 container (picture 8) that is placed on top of the plant. The
container holds a protuberant bag that puff up when gas flows in there. If there are
problems with gas burner, the biogas will flow out of safety valve. Removing biogas out
of the container can also be done manually.

30
Picture 8. Gas container of the biogas plant (Janhunen, 2012. p.38).
The feeding of the reactors can be done through a pipe fitting and with screw conveyors.
The liquid input was originally designed to be pumped with a submersible pump from an
external storage or source. The plant has individual screw conveyors for both reactors
for solid input. The screw conveyors are protected with hatch that can be seen in picture
9. The facility contains also a crushing unit for decreasing the particle size for solid feed.
Picture 9. Screw conveyor for reactor 2 with feeding hatch closed and open.

31
The automation system for controlling and measuring can be accessed with a computer.
The values are stored to log file for analyzing later. The system can be accessed locally
via touch screen monitor and keyboard. The system interface can be accessed with only
pressing the touch screen that is presented in picture 10. The system is also capable for
sending reports and alarms to mobile phone via SMS message. The system monitors
the reactor temperatures, methane content of produced biogas, the amount of biogas
produced and the temperature of the boiler. The feeding can be also automated to any
given time.
Picture 10. User interface with a touch screen.
Above the touch screen there are more traditional controlling features for the most
important operational features in picture 11. They can be set to automatic mode or be
manually overdriven. More specific information about the structure of the plant can be
found in the appendix 1 where the process and instrumentation diagram of this plant is
introduced.

32
Picture 11. Controlling switches above the touch screen.

33
3 EXPERIMENTATION
Pilot-scale experimentation was done next to Stora Enso Varkaus wastewater treatment
plant with a pilot-scale mobile biogas plant. The experimentation started 4th of April
2013 and ended 30th of November 2013. The preliminaries of this chapter describe how
things were done eventually. More accurate details of the experimentation are in the
chapter 3.2.
3.1 Preliminaries, planning and implementation
For the experimentation the pilot-scale mobile biogas plant was transported to Varkaus.
The anaerobically digested cow manure was used as the inoculum to quicken the
starting phase of AD process with the sludge from the wastewater treatment plant. The
origin of inoculum is Finnish agriculture research center’s (MTT) dairy farm in Maaninka
that has biogas plant. The biogas plant treats mainly cow manure but also small
amounts of herbaceous biomass.
The experimentation was planned to carry out with a week containing 5 days of active
operating on the ground and weekend without active monitoring. The process properties
were monitored regularly and the data was written down in a way that can be seen in
appendix 2. Originally the amount of feed was calculated estimating that the fed sludge
was about same quality. However the quality changes of the fed sludge caused
problems with AD process. The estimated values for mixed sludge was 3,7 % TS and for
gravity separated sludge 9,2 %. The feed was set to 100 liters mixed sludge and 10
liters of gravity separated sludge per feed. This feeding plan was calculated to give HRT
of 21 days and organic load of 1,4 kgVS/m3/d. The gravity separated sludge was
replaced with dried sludge half amount (5 liters), when gravity separated sludge wasn’t
available.
In the final weeks of the experimentation on calendar week 45 the original feeding plan
was changed to a more dynamic feeding plan where the sludge dry matter was analyzed
from every feed with a quick drier. This procedure makes HRT a variable property but
makes the organic load more constant as the quality of the sludge changes. The organic
load was set to 2 kg VS per reactor size (m3) per one feed. The effective reactor volume
is estimated 2,25 m3. The rest of the space of the 3 m3 reactor is gas. The amount of VS
was estimated to 67,5 % from TS. With these variables the daily amount of dry matter
added to reactors is 9,3 kg TS according to following equation.

34
(2),
where FTS is amount of feed in total solids (kgTS / d)
VR is the active reactor size (m3)
O is organic load (kg VS / m3 / d)
r is estimated VS/TS ratio
7/5 is multiplier because the reactor is fed 5 days per week
TS values were measured from the mixed sludge and the sludge after gravity table. At
first the reactor was fed with about 150 liters of mixed sludge and then it was calculated
how much gravity separated sludge needed to be fed in addition. The amount of gravity
separated sludge is calculated according to following equation.
(3),
where FGT is amount of gravity separated sludge (liter)
FTS is amount of feed in total solids (kgTS / d)
TSGT is the total solids measured with a quick dryer.
The pumping of the sludge was done with a screw pump that was rarely in other use
than for this experiment. The screw pump that is seen in picture 12 was originally used
for older of the two belt press dryers in the treatment plant. It was also in use when the
newer centrifugal pump was out of service which normally handled all the capacity that
the gravity table needed.
35
Picture 12. Screw pump that pumped sludge to biogas plant.
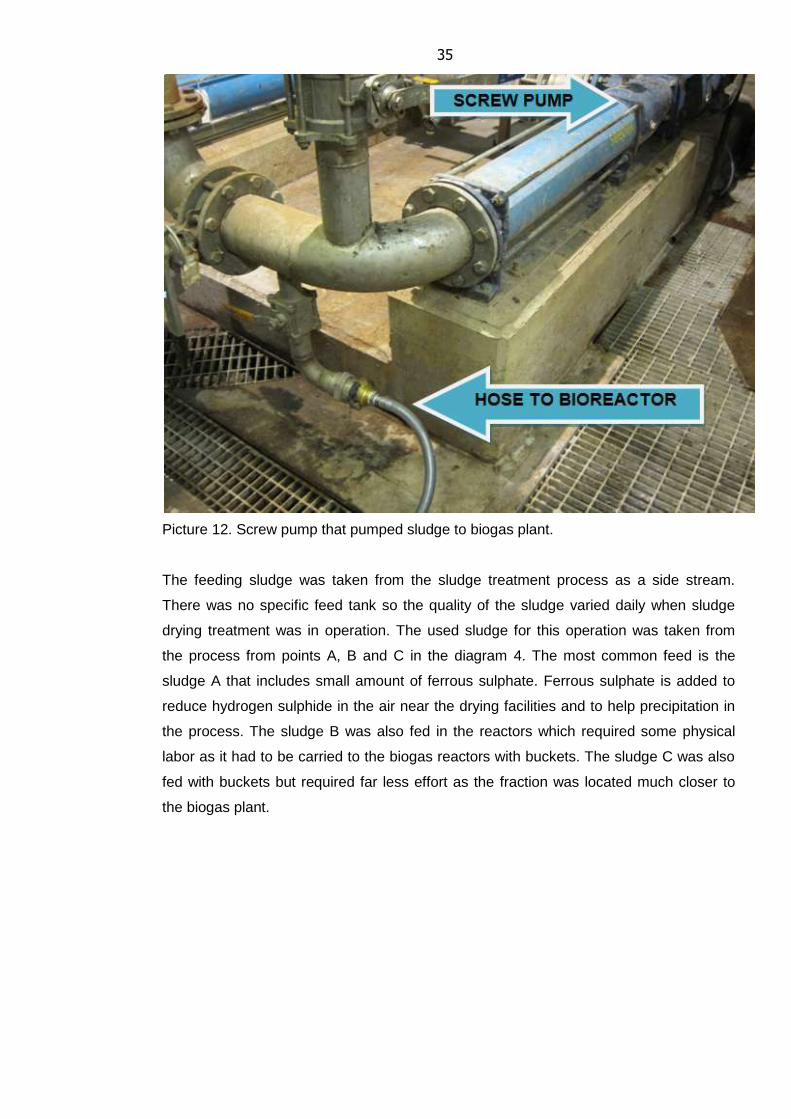
The feeding sludge was taken from the sludge treatment process as a side stream.
There was no specific feed tank so the quality of the sludge varied daily when sludge
drying treatment was in operation. The used sludge for this operation was taken from
the process from points A, B and C in the diagram 4. The most common feed is the
sludge A that includes small amount of ferrous sulphate. Ferrous sulphate is added to
reduce hydrogen sulphide in the air near the drying facilities and to help precipitation in
the process. The sludge B was also fed in the reactors which required some physical
labor as it had to be carried to the biogas reactors with buckets. The sludge C was also
fed with buckets but required far less effort as the fraction was located much closer to
the biogas plant.

36
Diagram 4. The sludge side streams to the biogas reactors from the drying process.
The picture 12 shows the plastic hose that is attached to the flow meter in the picture 13.
The flow meter was easy to use but the hard part with feeding was that the screw pump
pumped sludge over 1 liter per second even with lowest power it can be given. The fast
feeding rate required anticipation because there was delay of few seconds before the
pump reacted to start and stop commands.
Picture 13. The external flow meter for the sludge to the biogas plant.
After the flow meter the hose continues to the input joint in the picture 14. As fresh
sludge is pumped to biogas reactors the digested sludge is pushed out of the reactors in

37
an overflow box and drains out of the biogas plant from the output hose in the picture
14. The joints caused operational problems when the temperature was below freezing
temperature. There were also blockages in the output joint in the beginning of the
experimentation which were caused by combination of sediment and freeze-up.
Picture 14. Above the input joint and below the output joint for the sludge. Picture taken
from the left side of the biogas plant.
3.1.1 Argumentation for using selected sludge
Before the experimentation different sludge samples were tested for the AD process.
Test samples were collected from Savon Sellu and Stora Enso Varkaus. But sludge
samples from Stora Enso Varkaus were more applicable for AD process. Different
variations from sludge from Stora Enso Varkaus were tested to select the best feedstock
for the pilot-scale experiment. The best biogas gain was achieved with combination of
biowaste, primary sludge and biosludge (secondary sludge) that can be seen in chart 4.
Stora Enso mixed sludge was selected for the pilot-scale experiment because it was
easier to implement and it is not significantly inferior than combination of primary sludge
and biosludge. The mixed sludge is very similar to combination of primary sludge and
biosludge but there is small amount ferrous sulphate added to mixed sludge.

38
Chart 4. Batch test results for deciding best sludge fraction for the pilot-scale
experiment.
3.2 Experiments with pilot-scale mobile biogas plant
At the beginning it was decided that the experiment has a month settling period as the
inoculum otherwise might affect to gained results. The settling period was good to have
as there were lots of problems at the beginning. The biogas plant’s own flow meter was
found unreliable. The feed amounts were rough estimates. The water heat circulation
did not work correctly in the biogas reactors at the start, but it wasn’t a huge issue. The
climate wasn’t very fortunate because low temperatures made operating laborious as
the hoses and joints froze over outside the plant. The feeding the wastewater caused
problems because the thickness of sludge varied and it was difficult to estimate the
needed power for the pump. The sludge was pumped in cooperation with the operators
in the wastewater treatment plant. It took a while until a reliable solution was built.
Savonia provided later more reliable external flow meter for measuring the pumped
sludge and then it was decided to use a single screw pump. The flow meter showed the
flow speed and volume so it was easier to adjust a proper power for the pump.
As the operation in the plant became more fluent other problems occurred. The gas
burner was malfunctioning from the start but it was thought that the biogas had too low
methane percentage. Even though the methane portion of the biogas was around 60-70
percent the gas burner wouldn’t ignite. The detonator was changed but with no effect.
0,00
100,00
200,00
300,00
400,00
500,00
Stora Enso Primary + Biosludge
Stora Enso Primary + Biosludge +Biowaste
Stora Enso Biosludge +
Gravity table
thickened sludge
Stora Enso Primary sludge
Stora Enso Mixed sludge
Stora Enso Bio +
Dewatered sludge
Met
han
e yi
eld
Nm
3 C
H4
Batch experiment, mesophilic temperature (37° C)
Nm3 CH4/t FM
Nm3 CH4/t TS
Nm3 CH4/t VS

39
Later it was decided that the burner isn’t used in this experiment as there were found
electrical malfunctions. The biogas was released in the air after the plant’s biogas
container was filled. Fortunately the use of the burner isn’t crucial for this experiment.
Measurements of the produced biogas returned unreliable results after few weeks. Any
leakage was not found and new gas flow meters didn’t improve results so in the end
they were taken out of use. In September after many repair attempts Stora Enso
provided to the experiment two external gas flow meters that showed reliable gas gains
right from the start.
It was discovered with elemental analysis that pulp and paper industry sludge lacks
important nutrients. To improve the AD process we used nutrients to increase gas gains
and decrease the amount of hydrogen sulphide in the produced biogas. Used nutrients
were cobalt (Co) and nutrient mix from a biogas plant partner that’s content is a trade
secret. The presence of cobalt, nickel and iron can enhance the biogas production
significantly (Irvan, 2012. p.17). Nutrients were trialed from August 2013 to the last day
of this experiment.
The sludge in this experiment unfortunately had relatively low alkalinity. Sodium
carbonate (Na2Co3) was used to increase alkalinity to the process and neutralize pH
decrease. Controlling the pH wasn’t possible with this method but the process was more
stable. The used amounts were moderate to avoid rapid pH change.
In the last weeks of the experiment biowaste was trialed as an assisting feed in one
reactor. The biowaste was collected from a local canteen and it contained principally
excess food and coffee grounds.
3.3 Analysis in laboratory
In the beginning of the experiment the laboratory analysis were planned to make locally
in Varkaus. But laboratory analysis was done mainly in Kuopio where Savonia had
better equipment and more resources. Samples were collected weekly and shipped to
Kuopio to observe the AD process. TS and VS was measured from daily fed sludge
according to standard SFS3008 and once a week the alkalinity and VFA were measured
from residue sample with titrimetric analysis by Savonia in Kuopio. There was a quick
drier in Varkaus that was used to measure the solids out of sludge and other input feeds
to biogas plant. Sludge and other input feeds were also sampled and further analyzed in
Kuopio. The continuous laboratory-scale biogas reactors were also located in Kuopio.

40
4 RESULTS
4.1 Biogas productivity with pilot-scale mobile biogas plant
The productivity never reached same results as it did in the laboratory (Table 3). The
reasons for lower biogas gains are probably several but the most significant difference
compared to trials in laboratory was the variation of the sludge in pilot-scale trial. The
laboratory-scale AD used a batch of wastewater, which made homogenous input
possible.
Table 3. Methane yield potential in laboratory (Kaivola 2013, p.50)
Sample m3 CH4/t FM m3 CH4/t TS m3 CH4/t VS
Stora Enso Primary +
Biosludge 0,99 251,50 469,34
Stora Enso Primary +
Biosludge + Biowaste 8,64 446,56 538,66
Technical problems with the biogas plant caused major part of experiments did not give
any desired results. In the last 14 weeks of experimentation results were gained but they
are not comparable to laboratory-scale AD experiments. There weren’t any long period
without fluctuation in the AD process. The rise of the production as chart 5 shows at
calendar week 45 in reactor 1 started with try-out with biowaste as extra feedstock. In
practice it caused overfeeding state so it was fed less than normally it would have been
fed. The biowaste also brought lots of minerals that are boosting the AD process. The
minerals can partly explain why calculations about the biowaste feed volumes were too
high.

41
Chart 5. Biogas production in both reactors per ton of volatile solids fed.
The reactors were sampled every Monday throughout the experiment before the first
feed of the week. The samples were taken from the bottom section of the reactor. The
reactors were unfed on the weekend before sampling the reactors so the samples can
be considered as residue. The volatile solids content in chart 6 shows that before every
feed on Mondays there were at least 2 % volatile solids in the exiting sludge. It is
possible that the exiting sludge has even larger VS content than chart 2 presents
because the reactor was stirred continuously when the reactor was fed with sludge. The
relatively high VS content indicates that the AD process can be improved with post-
digestion and the production of biogas could be much higher than chart 5 presents.
0
50
100
150
200
250
39 40 41 42 43 44 45 46 47 48
Nm
3 C
H4/
tVS
Calendar week
Biogas production considering feedstock
Reactor 1
Reactor 2

42
Chart 6. Volatile solids content in both reactors on Mondays before feeding.
Even though on calendar weeks 45 and 46 show promising increase of biogas
production in chart 5 the process was overfed and input feed had to be limited that made
higher biogas gains possible when biogas was producing with lower feed wastewater.
The process was monitored with regular samples where volatile fatty acids were
analyzed. As the VFA value showed growth the feeding of the reactors was limited or
stopped. Chart 6 shows the VFA values for both reactors at the same time period as
chart 5. The clear rise in reactor 1 indicates overfed state that was caused biowaste
feed that was speeding up VFA production.
0,0
1,0
2,0
3,0
4,0
40 41 42 43 44 45 46 47 48
%
Calendar week
VS content in residue
Reactor 1
Reactor 2

43
Chart 7. Volatile fatty acid values in both reactors.
The rise in VFA values could be seen also in the quality of biogas. The methane
percentage was getting lower when VFA values were getting higher that can be seen in
charts 7 and 8 in reactor 1 from week 45 to week 48. When biogas has less than 50
percent methane it usually has some problems igniting in the burner that was known in
practice with previous experiments with this same biogas plant.
Chart 8. Methane percentage individually measured from both reactors.
0
1000
2000
3000
4000
5000
6000
39 40 41 42 43 44 45 46 47 48
VFA
[m
g C
H3C
OO
H p
er
litre
]
Calendar week
Volatile fatty acids in the reactors
Reactor 1
Reactor 2
20
30
40
50
60
70
80
39 40 41 42 43 44 45 46 47 48
%
Calendar week
Methane percentage of biogas
Reactor 1
Reactor 2

44
4.2 Nutrient impact to the AD process
The sludge that was fed to reactors included some ferrous sulphate (FeSO4) that was
fed to the process in the wastewater treatment. As it was used for reducing hydrogen
sulfide which was a problematic gas also in the AD process. Ferrous sulphate was
trialed for 5 weeks in pilot-scale experiment and also in laboratory but it didn’t improve
the AD process at all. It was tested with different feed amounts and in laboratory it was
tested with relatively huge amounts compared to reactor size with no positive impact to
the AD process. There were even some indication that it might have increased the
hydrogen sulphide content in the produced biogas.
In laboratory-scale the hydrogen sulphide was successfully reduced with ferric chloride
(FeCl3). Later the laboratory-scale experiments revealed that the reduction of hydrogen
sulphide is not necessary if there is suitable nutrient and trace element balance. When
microbes get all the required nutrients and trace elements, the AD process doesn’t
produce hydrogen sulphide.
On and after the calendar week 32 a nutrient mix that was used in full-scale biogas plant
of a METLI-project partner. The content of the nutrient mix is a trade secret and it was
used in the experiment to bring more reliability to the AD process. With the nutrient mix
methane content ascended up to 70 %, when it was before the nutrient mix mainly
below 60 %.
After the calendar week 35 reactor 2 was fed with cobalt which lasted to the end of this
experiment. Cobalt is one nutrient that was lacking in the sludge so with this we tried to
solve does it have clear impact to the process. Unfortunately there wasn’t a clear result
with this additive so it might have improved the process slightly but no significant
changes were in biogas gains or quality.
Sodium carbonate was also used to bring more alkalinity to the process. It was trialed
mainly in reactor 2. It was first used once on calendar week 40 and 41. On calendar
week 42 it was added five times per week. There is no clear indication on the effect on
alkalinity in reactor that might mean that dosage wasn’t large enough for the reactor 2.
But when sodium carbonate was added there were no fluctuations in alkalinity. In table 3
there is presented alkalinity in both reactors where you can see very fluctuating values
in alkalinity of reactor 1 when it is not having sodium additive. Last 3 weeks reactor 1
was also fed with sodium because the pH came down from 6,6 to 6,3. The
recommended level of alkalinity is 3500 – 5000 mg CaCO3/l (Janhunen, 2012. p. 25).

45
Table 4. Alkalinity in reactors in the last weeks of the experiment.
Calendar
week
Sodium
additive
in R1
Alkalinity
reactor 1
(mg CaCO3 / liter)
Sodium
additive
in R2
Alkalinity
reactor 2
(mg CaCO3 / liter)
40 no 1939,7 yes 2169,3
41 no 347,9 yes 1944,4
42 no 4078,4 yes 1983,5
43 no 743,2 yes 1755,3
44 no 1128,7 yes 1569,9
45 no 473,0 yes 1575,4
46 yes 2257,0 yes 1931,8
47 yes 2358,9 yes 1706,2
48 yes 3112,4 yes 1777,3
The reactor 1 had higher biogas production especially from week 45 to week 47. There
can be seen that the AD process was overfed and VFA was produced too much for
methanogens to consume it. The high ratio of VFA/Alkalinity means that there is lots of
volatile acids compared to alkalinity and the pH will more likely decrease. The VFA and
alkalinity were measured in Kuopio by Savonia. In ideal AD process the change in
VFA/Alkalinity ratio would be very small.
Table 5. Ratio between volatile fatty acids and alkalinity.
Calendar
week
VFA/Alkalinity
reactor 1
VFA/Alkalinity
reactor 2
40 0,07 0,08
41 0,36 0,09
42 0,24 0,33
43 0,41 0,13
44 0,54 0,17
45 1,75 0,11
46 1,34 0,43
47 1,88 0,63
48 1,53 0,32

46
4.3 Evaluation on experimentation
Low biogas gain can be explained in this experiment that fed wastewater had very
variable total solids and volatile solids. The amount of wastewater was initially calculated
with default values. If the wastewater had low total solids the reactors were fed in
addition with dried sludge. The added dried sludge didn’t mix very well and it can be only
guessed how much of the dried sludge circulated out. When reactor 2 was emptied after
last week of experimentation there was a lot of stiff sedimentation in the bottom that
refers that the dried sludge was not dissolving very well. Through the experimentation
the reactor 2 was fed more with the dried sludge than reactor 1.
The dry matter of the sludge fluctuated from 0,5 % to 7 % as presented in chart 9. After
the first trial period the dry matter was measured from the sludge with a quick drier daily.
There wasn’t any fast way to analyze the volume of volatile solids from the fed sludge so
it was estimated that 65 % of dry matter is organic dry matter. In practice the volume of
organic dry matter out of total dry matter was fluctuating from 37 % to 70 %. The exact
calculation of the correct amount of input was not possible so the pH decreased often
too low after overfeeding the reactors. The decrease of pH took a lot of valuable
experiment time because the only cure for this situation is time.
Chart 9. Dry matter and organic dry matter of the sludge fed to the biogas reactors.
4.4 AD as a treatment for the mixed sludge
0,00
1,00
2,00
3,00
4,00
5,00
6,00
7,00
8,00
23
.7.2
01
3
26
.7.2
01
3
31
.07
.20
13
05
.08
.20
13
8.8
.20
13
13
.08
.20
13
16
.08
.20
13
21
.8.2
01
3
26
.08
.20
13
29
.08
.20
13
4.9
.20
13
09
.09
.20
13
12
.9.2
01
6
30
.09
.20
13
03
.10
.20
13
08
.10
.20
13
11
.10
.20
13
16
.10
.20
13
Dry matter and organic dry matter of mixed sludge
DM-%
oDM-%

47
Anaerobic digestion can be applied as a solution for the mixed sludge but it also
requires extra nutrients or another feed to support the production. The produced biogas
has a moderate share of methane but it has a very high hydrogen sulphide (H2S)
content. The content was measured around 5000 ppm throughout the whole experiment.
Hydrogen sulphide creates corrosive sulphuric acid with water vapors in biogas which
can cause damage to gas pipelines and gas burning utilities (Al Saedi, 2008. p.86). No
measurable changes were gotten with nutrients in the hydrogen sulphide content even
though nutrients improved the methane content of biogas.
Laboratory-scale continuous biogas reactor results showed very promising results that
indicates the AD process being a profitable solution as it has very high biogas gain.
Laboratory-scale experiments have achieved methane productivity of over 300 Nm3/tVS
when pilot-scale experiment was producing methane approx. 50 – 150 Nm3/tVS.
With AD process the mixed sludge’s organic content can be lowered and gain biogas,
but the process suffers when feedstock varies significantly. For a stable process the
sludge’s dry matter content should be ensured by a feed tank which prevents sudden
fluctuations in the sludge. The process is time consuming and requires monitoring as the
process is vulnerable and slowly recovering which should be taken into consideration
when choosing the next treatment methods in the wastewater treatment plant.

48
5 CONCLUSION
The experiment wasn’t able to show clear and congruent values of biogas productivity
with laboratory tests which can be result of many factors. The pilot-scale mobile biogas
plant showed many malfunction through the experimentation and it hasn’t showed
comparable results with laboratory-scale experiments in previous experiments. The
plant is a prototype which can also explain unexpected results.
The measurements of formed biogas were unreliable with the measuring equipment in
the plant. The gas might have been slipping through the instrument or it could have
leaked out somewhere. Later installed accurate temporary instruments were giving more
sensible results and both reactors were giving similar biogas production values. From
the similar production it is very unlikely that the gas was leaking out.
Compared to a full-scale biogas plant the pilot-scale plant doesn’t have a post-digestion
that is very common in biogas production. Lack of post-digestion can lead to uncomplete
digestion when small portion of organic matter flows through the process without being
digested to biogas. The feeding is done in full-scale biogas plants daily multiple times
and in this experiment the feeding was done five days per week most of the time.
Steady feeding pattern improves AD process and makes it steadier.
The use of dried sludge and sludge after gravity separation wasn’t ideal for the AD
process because the micro-organisms digest the better the smaller the grain size of their
feed. Especially the dried sludge didn’t mix very easily. In the end of the experiment
when reactors were drained empty, there was thick sediment in the bottom of the reactor
2 where dried sludge was more fed. The mixing might not have been sufficient to the
used sludge. The results are probably inferior because the bottom sediments of the
reactors weren’t producing biogas, at least not as much as the upper part of reactor.
The results in the pilot-scale experiment considering the all the problems and the
promising test results from laboratory-scale AD experiments indicates that AD process
could be a very potent solution for reducing organic matter in the forest industry sludge.
There is still research to be done to achieve ideal biogas process.
5.1 Occurred problems and need for further development
As a user of the pilot-scale mobile biogas plant there were several problems with the
utility. The gas burner was obviously one because it never was in operation even though

49
it was working fine in previous experiment. The measuring of the produced biogas
should be redesigned because it is not reliable at all. The temporary measuring
instruments were on loan from Stora Enso Varkaus and they were returned after the
experiment.
The space inside the plant could be improved. There were gas analyzing equipment
from University of Eastern Finland and the temporary measuring instruments which
made the plant a very cramped place. The crushing unit takes a lot of room in the center
of the plant and it is rarely used so it should be reconsidered is it needed in the future.
The reactors could be modified that the output would be from the bottom of the reactor
so there couldn’t form bottom sediment. The current output flow is located in the middle
section of the reactor. The input flow is so close to the output flow that some of the
inserted feed might get mixed to the output flow.

50
REFERENCES
Al Seadi, T., Biogas Handbook, 2008. Handbook made by biogas experts from Denmark, Germany, Austria and Greece, as a part of BiG>East project. University of Southern Denmark Esbjerg. [reference made 4.5.2013]. Available at: http://www.lemvigbiogas.com/BiogasHandbook.pdf Alakangas, E. 2000. Suomessa käytettävien polttoaineiden ominaisuuksia. Espoo. Otamedia Oy. European Biogas Association, 2013. A Belgian non-profit organisation aiming to promote the deployment of sustainable biogas production and use in Europe. [reference made 2.5.2013]. Available at: http://www.european-biogas.eu/images/stories/biogas-brochure-2011-1_small.pdf European parliament and of the Council on the promotion of the use of energy from renewable sources, 23.4.2009/28/EC. EUR-Lex. Legislation [reference made 15.5.2014]. Available at: http://eur-lex.europa.eu European Parliament and of the Council on waste and repealing certain Directives, 19.11.2008/98/EC, EUR-Lex. Legislation. [referenece made 12.3.2014]. Available at: http://eur-lex.europa.eu Gerardi, M. 2003. The microbiology of anaerobic digesters. Published by John Wiley & Sons, Inc., Hoboken, New Jersey. United States of America. Huttunen, M. & Kuittinen, V. 2013. Suomen biokaasulaitosrekisteri n:o 16. University of Eastern Finland, Joensuu [reference made 18.5.2014]. Available at: http://www.biokaasuyhdistys.net/media/Biokaasulaitosrekisteri2012.pdf Irvan, M. 2012. Effect of Ni and Co as Trace Metals on Digestion Performance and Biogas Produced from The Fermentation of Palm Oil Mill Effluent. International Journal of Waste Resources (IJWR). [reference made 1.8.2014] Available at: http://www.ijwr.co/index.php/ijwr/article/download/31/35 Janhunen, M. 2012. Jäteveden biokaasutus ja lietteen kaasun tuottavuuden määrittäminen. Thesis. Savonia University of Applied Sciences, Varkaus [reference made 12.3.2013]. Available at: https://publications.theseus.fi/bitstream/handle/10024/42294/Maarit_Janhunen.pdf.pdf Janhunen, M. 2013. Presentation for METLI project 15.4.2014. Kuopio. Jermakka, J., Laine-Ylijoki, J. & Wahlström, M. 2012. Taustamuistio kaatopaikoista annetun valtio-neuvoston päätöksen muuttamista varten. Helsinki. Ympäristöministeriön raportteja 11/2012. [reference made 28.7.2014]. Available at: http://www.ym.fi/download/noname/%7B7B9316F5-9C05-44A7-ACA0-27FE9329D6C9%7D/27225 Jääskeläinen, J. & Lovio, R. 2003. Globalisaatio saapui Varkauteen. Elinkeinoelämän tutkimuslaitos ETLA, Helsinki [reference made 20.5.2014]. Available at: http://www.etla.fi/wp-content/uploads/2012/09/B201.pdf Kaivola, A., 2013. Metsäteollisuuden lietteiden biokaasutus biojätteen kanssa. Thesis. Savonia University of Applied Sciences, Kuopio [reference made 20.5.2014]. Available at: http://publications.theseus.fi/bitstream/handle/10024/58712/Kaivola_Anna.pdf Kuittinen, V., 2013, Bioenergy lecture, 11.12.2013, Joensuu.

51
Latvala, M. 2009. Paras käytettävissä oleva tekniikka (BAT) Biokaasun tuotanto suomalaisessa toimintaympäristössä. Suomen ympäristökeskus [reference made 17.5.2014]. Available at: https://helda.helsinki.fi/bitstream/handle/10138/37998/SY_24_2009.pdf Lund, C., 2010. Mesofiilisen ja termofiilisen biokaasutuslaitoksen kuormitusvertailu ja optimointi. Aalto University, Helsinki. Manu, H., 2011. Siirrettävän biokaasulaitoksen monitorointi. Thesis. Savonia University of Applied Sciences, Kuopio [reference made 12.3.2014]. Available at: https://publications.theseus.fi/bitstream/handle/10024/25864/Manu_Harri.pdf MRL (Maankäyttö- ja rakennuslaki) 5.2.1999/132. Finlex. Finnish legislation. [reference made 28.7.2014] Available at: http://www.finlex.fi/fi/laki/ajantasa/1999/19990132 Ojanen, P. 2001. Sellu- ja paperitehtaiden lietteiden käsittely ja hyötykäyttö sekä niitä rajoittavat tekijät. Kouvola: Kaakkois-Suomen ympäristökeskus. Toivanen, R., 2008. Kiteen biokaasulaitoksen mädätysjäännös ja sen ravinteiden kierrätys maanviljelyssä. Thesis. Karelia University of Applied Sciences, Joensuu [reference made 24.5.2014]. Available at: http://www.tts.fi/finageng/files/riikka_toivasen_opinnaytetyo.pdf YSL (Ympäristönsuojelulaki) 4.2.2000/86. Finlex. Finnish legislation. [reference made 28.7.2014] Available at: http://www.finlex.fi/fi/laki/ajantasa/2000/20000086

Appendix 1
PROCESS AND INSTRUMENTATION DIAGRAM OF PILOT-SCALE MOBILE BIOGAS PLANT

Appendix 2
A SAMPLE OF RECORDS OF REGULAR CONTROL ON THE PREMISES
Date Time Temperature
Reactor 1 Temperature
reactor 2
Gas meter
reactor 1
Gas meter
reactor 2
Methane %
reactor 1
Methane %
reactor 2 Plant temp.
21.10.2013 08:08 36,9 36,8 80212 5379 49,5 54,1 16
22.10.2013 08:06 37,0 36,8 80405 5571 48,9 53,3 17
23.10.2013 08:20 36,8 36,7 80604 5785 46,9 50,8 16
24.10.2013 08:08 37,0 36,6 80805 6005 16,8 44,2 21
25.10.2013 08:14 37,0 36,7 80987 6212 40,5 40,6 20
26.10.2013
27.10.2013
28.10.2013 08:02 36,9 37,1 81548 6841 50,0 65,0 20
29.10.2013 08:10 37,2 36,5 81748 7066 43,2 48,1 20
30.10.2013 08:10 36,9 36,7 81902 7273 30,1 40,3 20
31.10.2013 08:03 36,9 37,0 82061 7485 44,9 51,3 18
01.11.2013 08:08 37,1 36,6 82239 7700 43,9 50,2 20
2.11.2013
3.11.2013
4.11.2013 8:31 37,1 36,6 82787 8357 42,5 50,4 16
5.11.2013 8:10 36,8 36,6 83089 8544 36 48,1 18
6.11.2013 8:14 37,2 36,9 83624 8770 29,9 37,8 20
7.11.2013 8:13 36,7 36,7 84086 8969 27,1 48,4 19
8.11.2013 8:08 36,6 36,6 84437 9170 25,1 49,3 19
9.11.2013
10.11.2013
11.11.2013 8:06 36,6 36,6 85484 9830 31,5 50,2 18
12.11.2013 8:09 36,8 36,7 85964 10051 34,7 50,9 17
13.11.2013 8:20 36,5 36,6 86465 10276 33,1 48,3 20
14.11.2013 8:06 36,5 37 86855 10468 28,4 49,2 18
15.11.2013 8:06 36,6 36,8 87351 10643 35,2 51,4 17
16.11.2013 8:05 36,7 37 87909 10868 31,3 47,2 20
17.11.2013 8:17 36,5 36,7 88578 11120 30,3 36,3 19
18.11.2013 8:07 34,1 35,7 88880 11235 36,9 50,1 12
19.11.2013
20.11.2013
21.11.2013 8:15 34 36,6 89641 11833 36,9 31,3 15
22.11.2013 8:09 37,8 37,4 90026 12080 35,4 47,4 18
23.11.2013
24.11.2013
25.11.2013 8:08 36,3 36,6 90715 12730 36,4 42,4 15
26.11.2013 8:20 35,5 36,5 90761 12937 36,2 25,1 12
27.11.2013 8:13 36,8 36,8 90851 13160 20,2 41,5 17
28.11.2013 8:11 37,1 36,6 90909 13412 5,2 16 18
29.11.2013 7:59 38 36,6 90994 13603 22,4 13,1 17