
American Monsoons
Working Group
American Monsoons
Working Group
Alice M. GrimmDepartment of Physics, Federal University of Paraná, Curitiba, Paraná, Brazil
CLIVAR/GEWEX Monsoons Panel Meeting 2016 / CLIVAR OSC
September 2016, Qingdao, China

Membership
• Dr Alice M. Grimm Federal University of Parana, Brazil, Co-Chair
• Dr Iracema F. A. Cavalcanti CPTEC/INPE, Brazil, Co-Chair
• Dr Francina Dominguez University of Illinois at Urbana, USA
• Dr Manoel A. GanCPTEC/INPE, Brazil
• Dr Marcelo Barreiro • Universidad de la Republica, Uruguay
• Dr Pedro L. da Silva Dias University of São Paulo, Brazil
• Dr Rong Fu University of Texas at Austin, USA
• Dr Tereza CavazosCentro de Investigacion Cientifica y de Educacion Superior de Ensenada
(CICESE), Mexico
Goals IGoals I
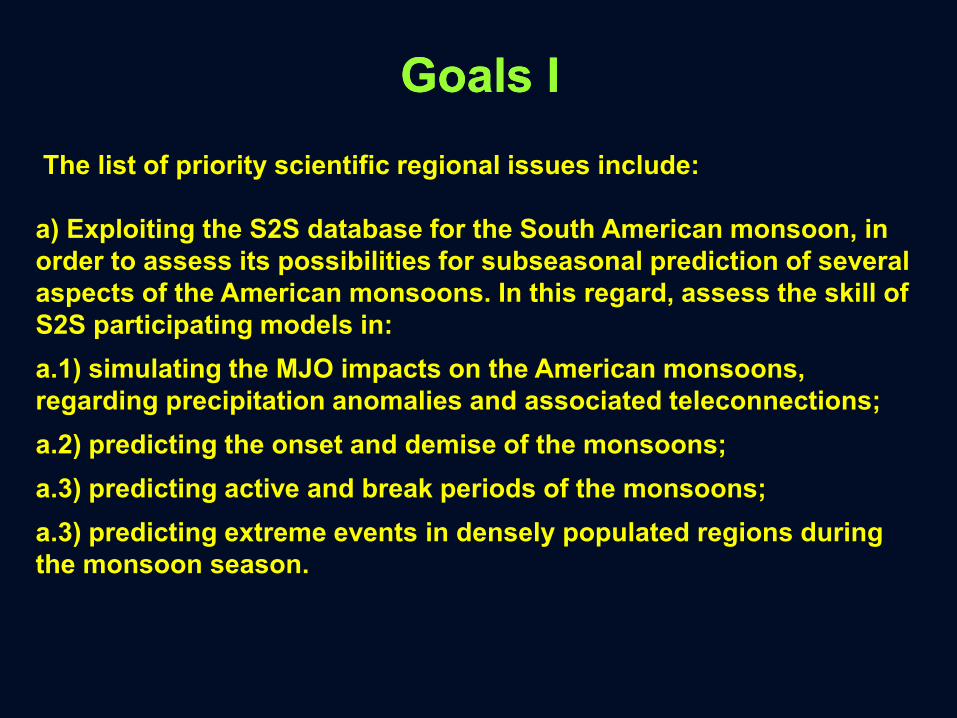
The list of priority scientific regional issues include:
a) Exploiting the S2S database for the South American monsoon, in
order to assess its possibilities for subseasonal prediction of several
aspects of the American monsoons. In this regard, assess the skill of
S2S participating models in:
a.1) simulating the MJO impacts on the American monsoons,
regarding precipitation anomalies and associated teleconnections;
a.2) predicting the onset and demise of the monsoons;
a.3) predicting active and break periods of the monsoons;
a.3) predicting extreme events in densely populated regions during
the monsoon season.
Goals IIGoals II
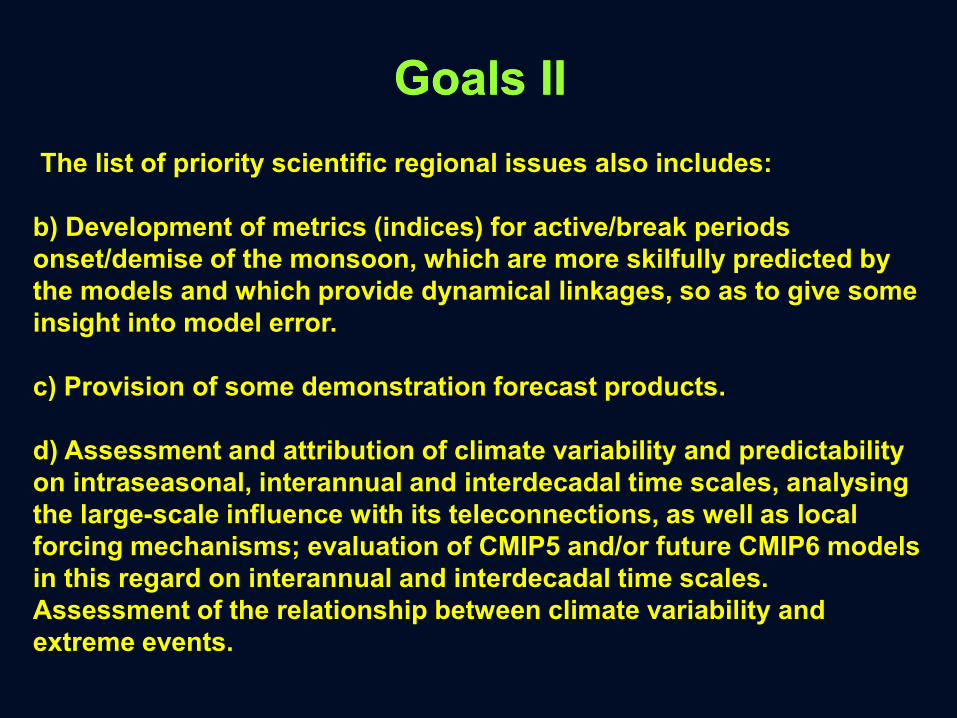
The list of priority scientific regional issues also includes:
b) Development of metrics (indices) for active/break periods
onset/demise of the monsoon, which are more skilfully predicted by
the models and which provide dynamical linkages, so as to give some
insight into model error.
c) Provision of some demonstration forecast products.
d) Assessment and attribution of climate variability and predictability
on intraseasonal, interannual and interdecadal time scales, analysing
the large-scale influence with its teleconnections, as well as local
forcing mechanisms; evaluation of CMIP5 and/or future CMIP6 models
in this regard on interannual and interdecadal time scales.
Assessment of the relationship between climate variability and
extreme events.
Goals IIIGoals III
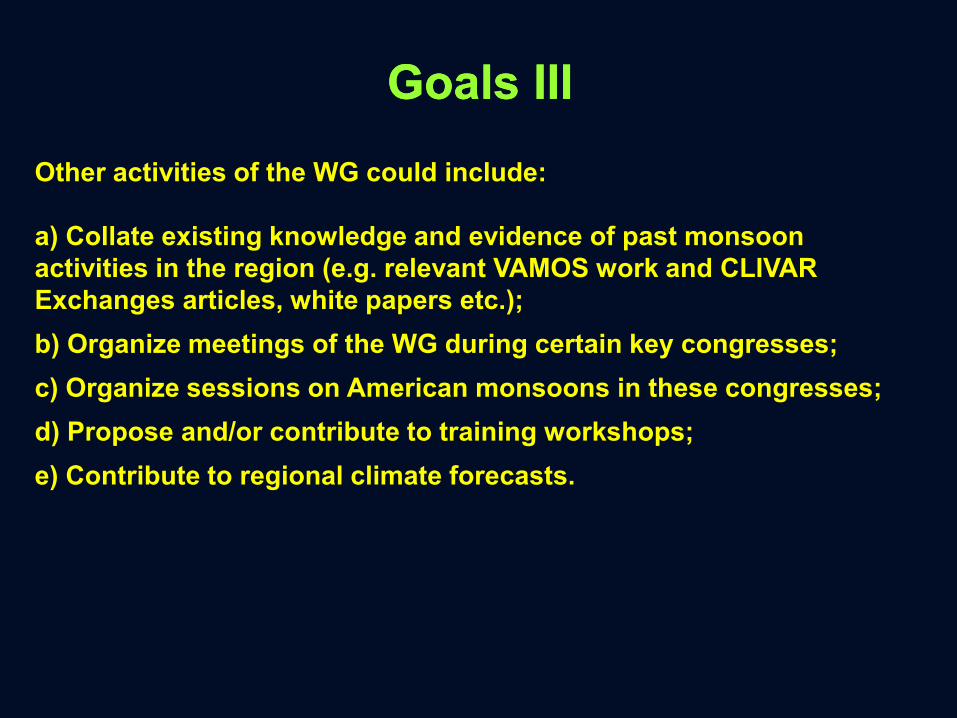
Other activities of the WG could include:
a) Collate existing knowledge and evidence of past monsoon
activities in the region (e.g. relevant VAMOS work and CLIVAR
Exchanges articles, white papers etc.);
b) Organize meetings of the WG during certain key congresses;
c) Organize sessions on American monsoons in these congresses;
d) Propose and/or contribute to training workshops;
e) Contribute to regional climate forecasts.
Other suggestionsOther suggestions
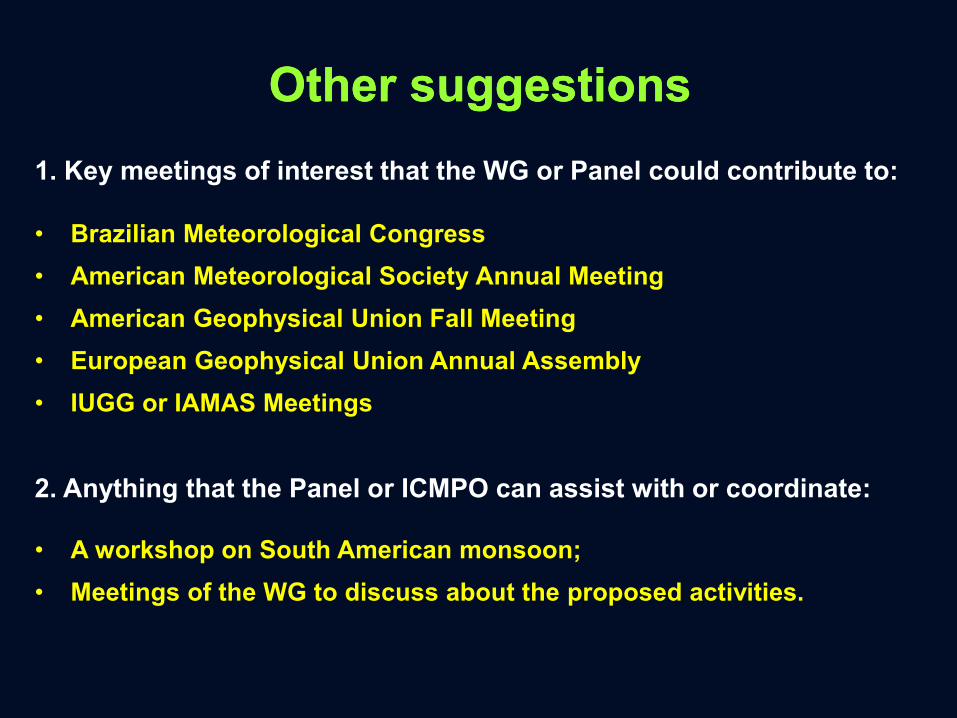
1. Key meetings of interest that the WG or Panel could contribute to:
• Brazilian Meteorological Congress
• American Meteorological Society Annual Meeting
• American Geophysical Union Fall Meeting
• European Geophysical Union Annual Assembly
• IUGG or IAMAS Meetings
2. Anything that the Panel or ICMPO can assist with or coordinate:
• A workshop on South American monsoon;
• Meetings of the WG to discuss about the proposed activities.
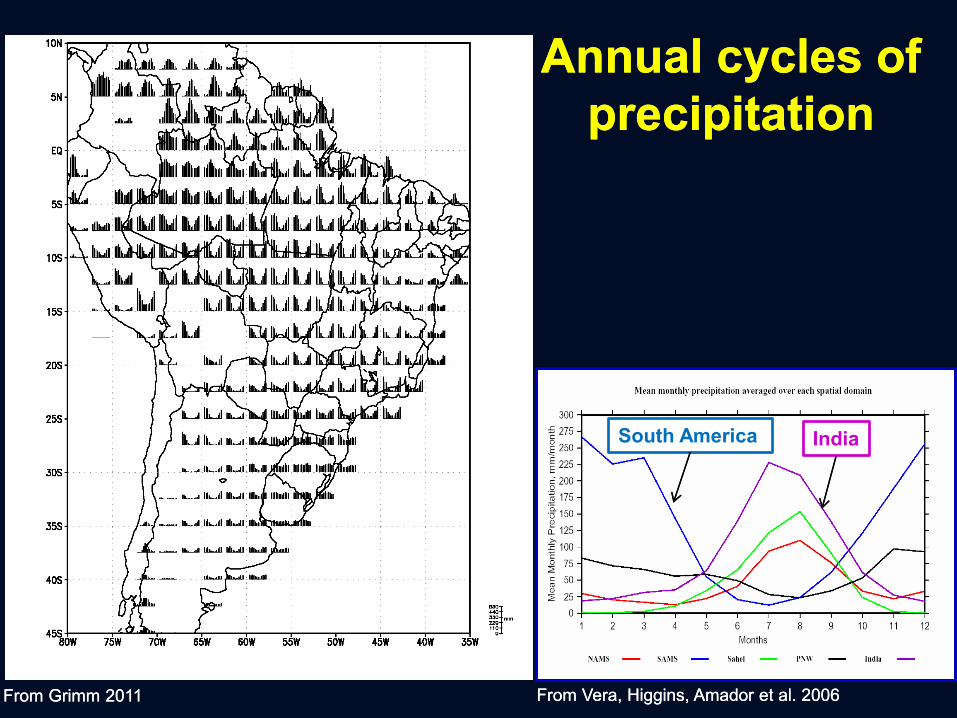
Annual cycles of
precipitation
Annual cycles of
precipitation
From Grimm 2011 From Grimm 2011 From Vera, Higgins, Amador et al. 2006 From Vera, Higgins, Amador et al. 2006
IndiaSouth America
General features of the SAMSGeneral features of the SAMS
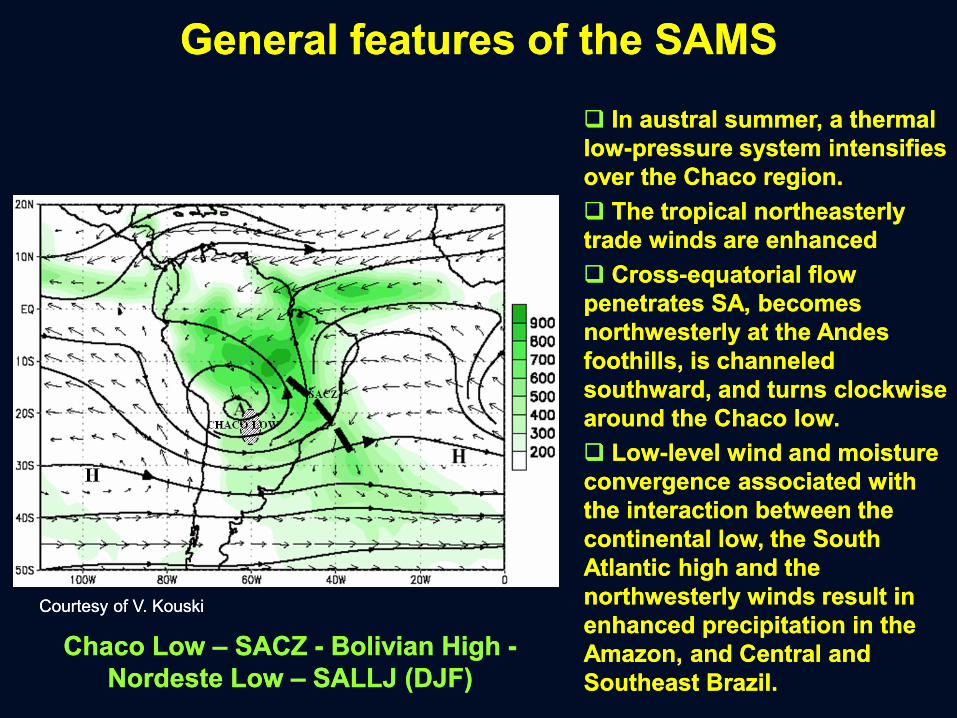
Chaco Low – SACZ - Bolivian High -
Nordeste Low – SALLJ (DJF)
Chaco Low – SACZ - Bolivian High -
Nordeste Low – SALLJ (DJF)
Courtesy of V. KouskiCourtesy of V. Kouski
In austral summer, a thermal
low-pressure system intensifies
over the Chaco region.
The tropical northeasterly
trade winds are enhanced
Cross-equatorial flow
penetrates SA, becomes
northwesterly at the Andes
foothills, is channeled
southward, and turns clockwise
around the Chaco low.
Low-level wind and moisture
convergence associated with
the interaction between the
continental low, the South
Atlantic high and the
northwesterly winds result in
enhanced precipitation in the
Amazon, and Central and
Southeast Brazil.
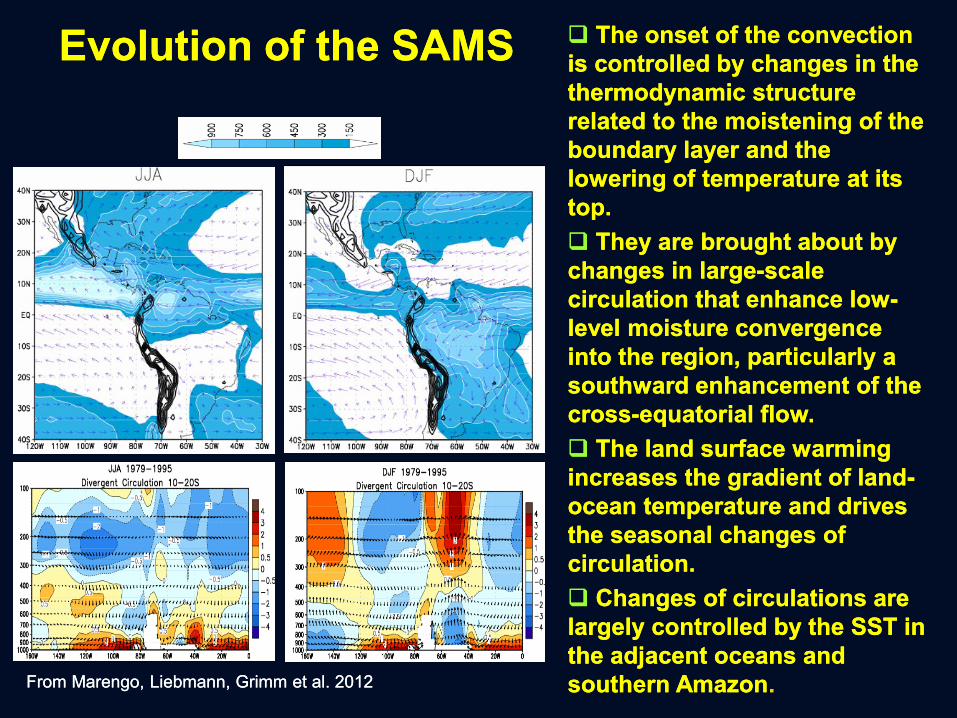
Evolution of the SAMSEvolution of the SAMS The onset of the convection
is controlled by changes in the
thermodynamic structure
related to the moistening of the
boundary layer and the
lowering of temperature at its
top.
They are brought about by
changes in large-scale
circulation that enhance low-
level moisture convergence
into the region, particularly a
southward enhancement of the
cross-equatorial flow.
The land surface warming
increases the gradient of land-
ocean temperature and drives
the seasonal changes of
circulation.
Changes of circulations are
largely controlled by the SST in
the adjacent oceans and
southern Amazon.
The onset of the convection
is controlled by changes in the
thermodynamic structure
related to the moistening of the
boundary layer and the
lowering of temperature at its
top.
They are brought about by
changes in large-scale
circulation that enhance low-
level moisture convergence
into the region, particularly a
southward enhancement of the
cross-equatorial flow.
The land surface warming
increases the gradient of land-
ocean temperature and drives
the seasonal changes of
circulation.
Changes of circulations are
largely controlled by the SST in
the adjacent oceans and
southern Amazon.From Marengo, Liebmann, Grimm et al. 2012 From Marengo, Liebmann, Grimm et al. 2012
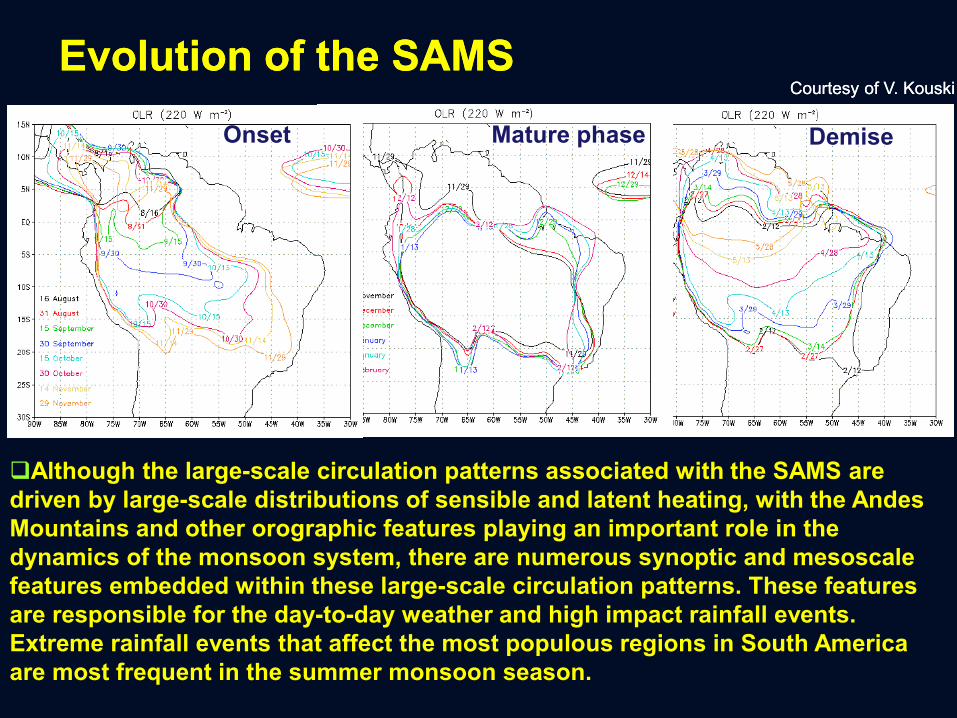
Evolution of the SAMSEvolution of the SAMSCourtesy of V. KouskiCourtesy of V. Kouski
Although the large-scale circulation patterns associated with the SAMS are
driven by large-scale distributions of sensible and latent heating, with the Andes
Mountains and other orographic features playing an important role in the
dynamics of the monsoon system, there are numerous synoptic and mesoscale
features embedded within these large-scale circulation patterns. These features
are responsible for the day-to-day weather and high impact rainfall events.
Extreme rainfall events that affect the most populous regions in South America
are most frequent in the summer monsoon season.
Onset Mature phase Demise
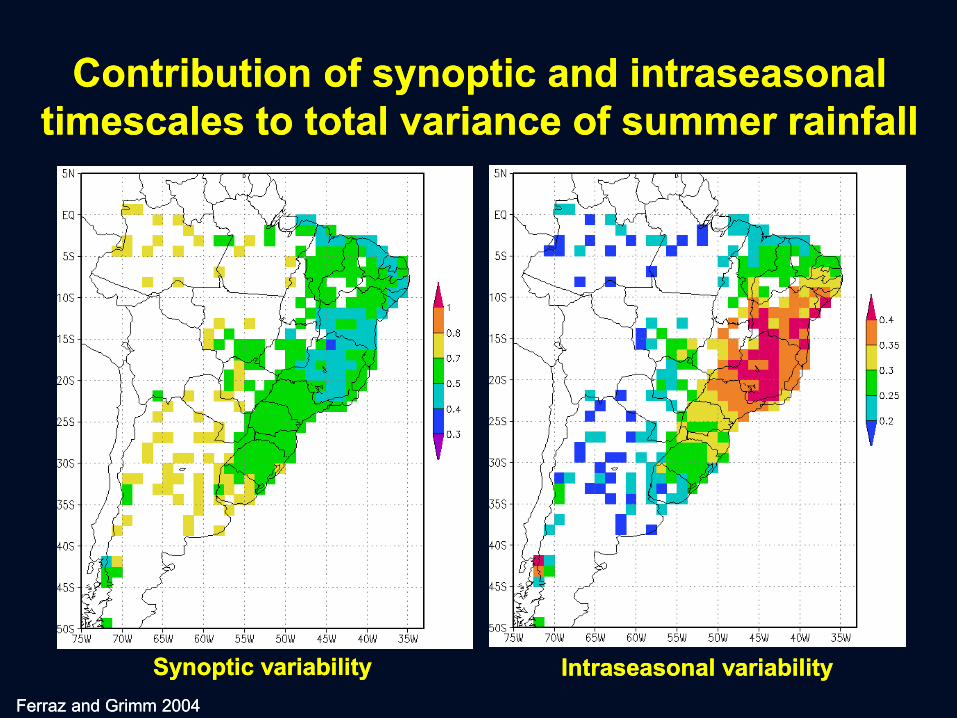
Contribution of synoptic and intraseasonal
timescales to total variance of summer rainfall
Contribution of synoptic and intraseasonal
timescales to total variance of summer rainfall
Ferraz and Grimm 2004Ferraz and Grimm 2004
Synoptic variabilitySynoptic variability Intraseasonal variabilityIntraseasonal variability
The Role of Synoptic and
Intraseasonal Anomalies
in the Life Cycle of
Summer Rainfall Extremes
over the SACZ
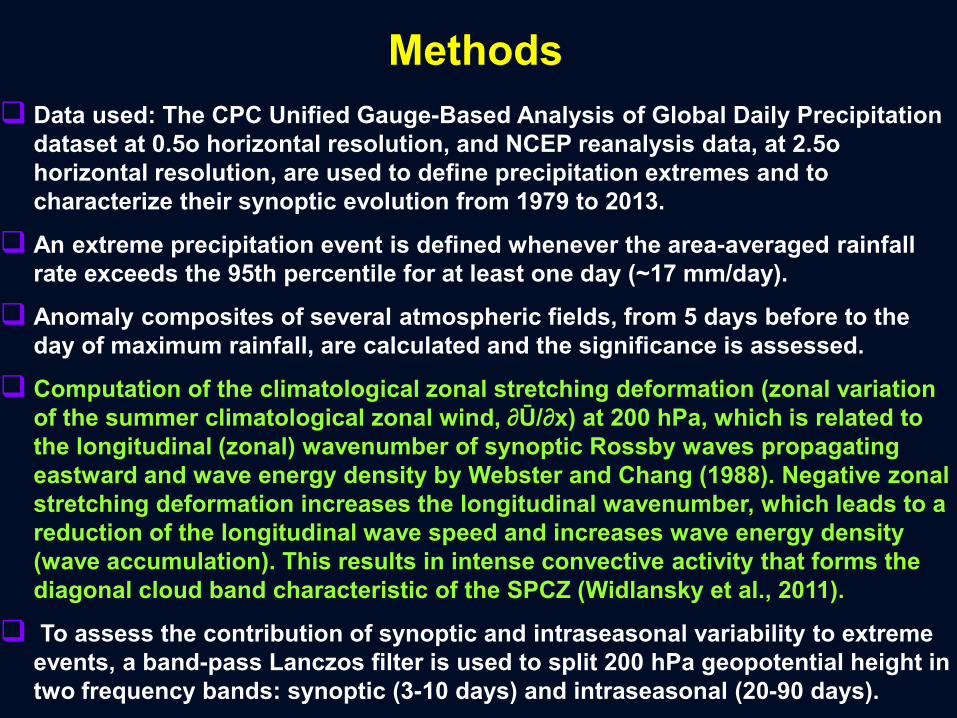
Data used: The CPC Unified Gauge-Based Analysis of Global Daily Precipitation
dataset at 0.5o horizontal resolution, and NCEP reanalysis data, at 2.5o
horizontal resolution, are used to define precipitation extremes and to
characterize their synoptic evolution from 1979 to 2013.
An extreme precipitation event is defined whenever the area-averaged rainfall
rate exceeds the 95th percentile for at least one day (~17 mm/day).
Anomaly composites of several atmospheric fields, from 5 days before to the
day of maximum rainfall, are calculated and the significance is assessed.
Computation of the climatological zonal stretching deformation (zonal variation
of the summer climatological zonal wind, ∂Ū/∂x) at 200 hPa, which is related to
the longitudinal (zonal) wavenumber of synoptic Rossby waves propagating
eastward and wave energy density by Webster and Chang (1988). Negative zonal
stretching deformation increases the longitudinal wavenumber, which leads to a
reduction of the longitudinal wave speed and increases wave energy density
(wave accumulation). This results in intense convective activity that forms the
diagonal cloud band characteristic of the SPCZ (Widlansky et al., 2011).
To assess the contribution of synoptic and intraseasonal variability to extreme
events, a band-pass Lanczos filter is used to split 200 hPa geopotential height in
two frequency bands: synoptic (3-10 days) and intraseasonal (20-90 days).
Methods
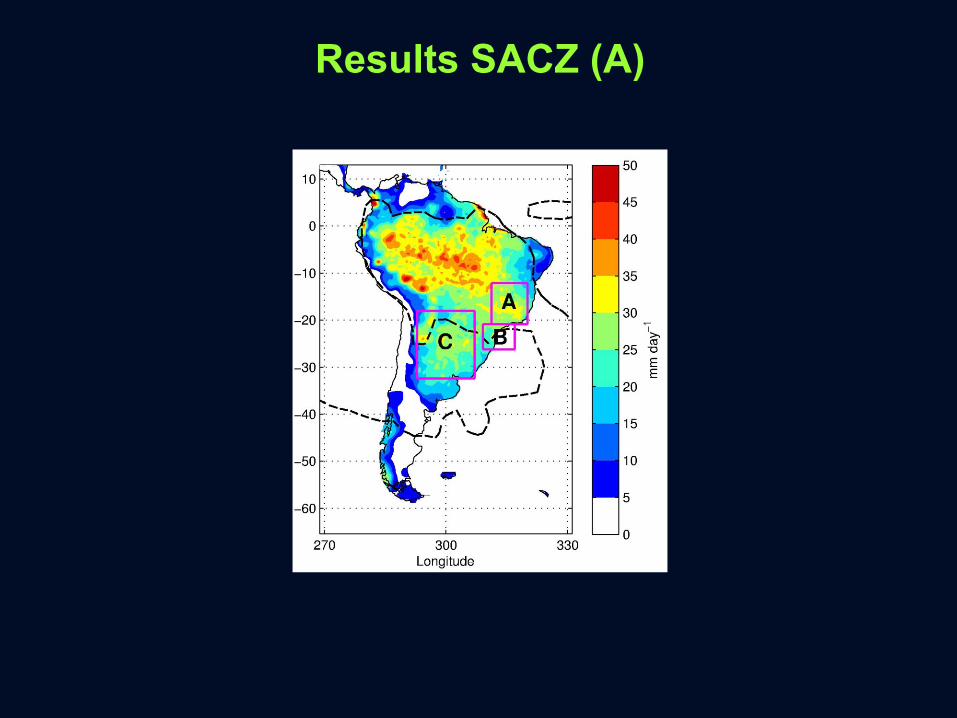
Results SACZ (A)
Results SACZ
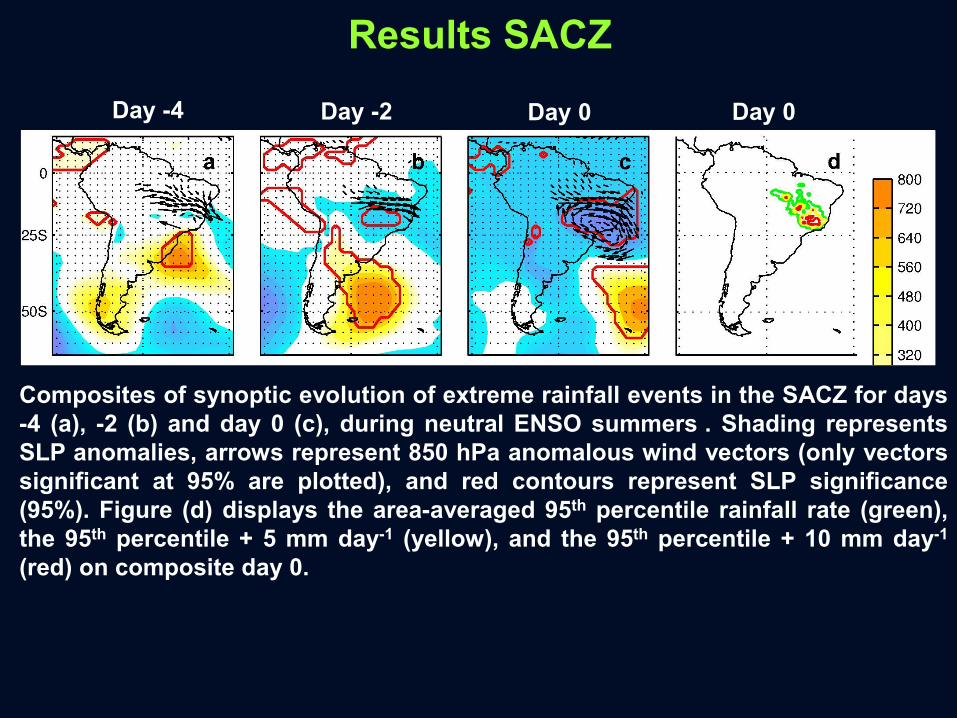
Composites of synoptic evolution of extreme rainfall events in the SACZ for days
-4 (a), -2 (b) and day 0 (c), during neutral ENSO summers . Shading represents
SLP anomalies, arrows represent 850 hPa anomalous wind vectors (only vectors
significant at 95% are plotted), and red contours represent SLP significance
(95%). Figure (d) displays the area-averaged 95th percentile rainfall rate (green),
the 95th percentile + 5 mm day-1 (yellow), and the 95th percentile + 10 mm day-1
(red) on composite day 0.
Day 0 Day 0Day -2Day -4
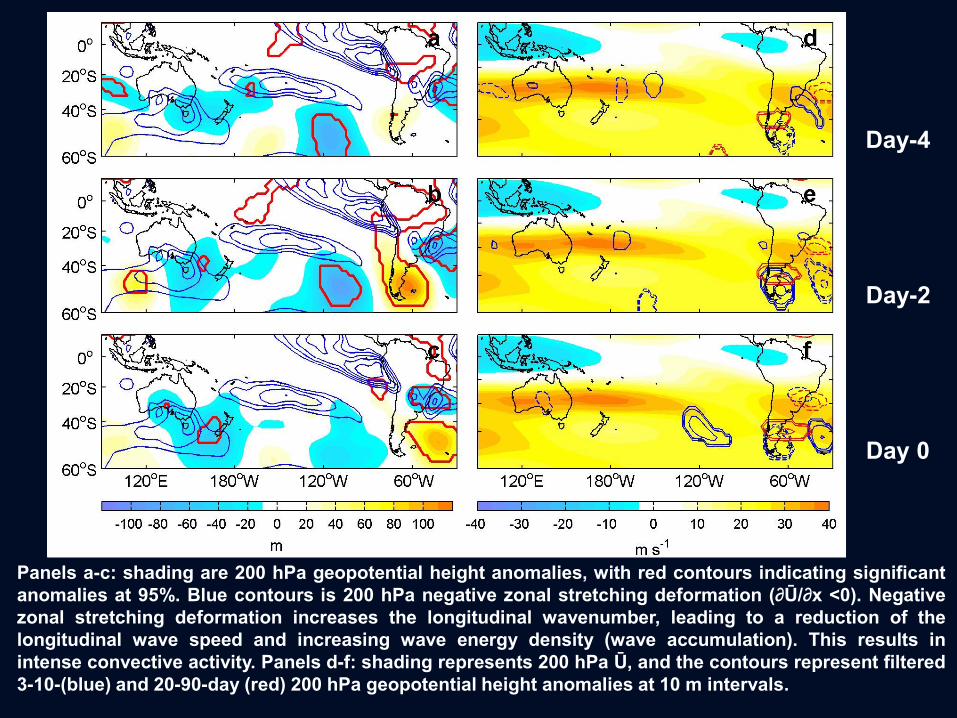
Panels a-c: shading are 200 hPa geopotential height anomalies, with red contours indicating significant
anomalies at 95%. Blue contours is 200 hPa negative zonal stretching deformation (∂Ū/∂x <0). Negative
zonal stretching deformation increases the longitudinal wavenumber, leading to a reduction of the
longitudinal wave speed and increasing wave energy density (wave accumulation). This results in
intense convective activity. Panels d-f: shading represents 200 hPa Ū, and the contours represent filtered
3-10-(blue) and 20-90-day (red) 200 hPa geopotential height anomalies at 10 m intervals.
Day-4
Day-2
Day 0
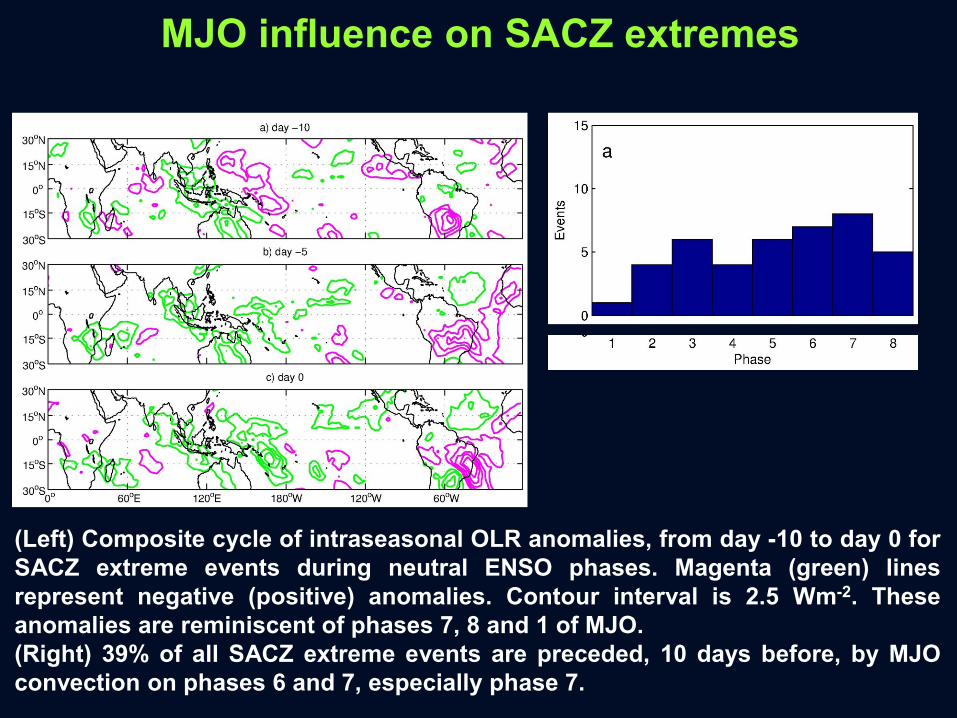
MJO influence on SACZ extremes
(Left) Composite cycle of intraseasonal OLR anomalies, from day -10 to day 0 for
SACZ extreme events during neutral ENSO phases. Magenta (green) lines
represent negative (positive) anomalies. Contour interval is 2.5 Wm-2. These
anomalies are reminiscent of phases 7, 8 and 1 of MJO.
(Right) 39% of all SACZ extreme events are preceded, 10 days before, by MJO
convection on phases 6 and 7, especially phase 7.
Intraseasonal variability
MJO impact on
South America
Observations(and model simulations)
(Grimm, 2016, in preparation)
(The slides of this section were shown
in the presentation at the Monsoon Panel Meeting, for discussion,
but are not included in this file for the webpage)
MJO impact on
South America
Simulated by models
CFS v2 and ECMWF
Reforecasts 1999-2010(Grimm et al., 2016, in preparation)
(The slides of this section were shown
in the presentation at the Monsoon Panel Meeting, for discussion,
but are not included in this file for the webpage)
Connections between
intraseasonal monsoon
variability in South
America and Southeast
Africa(Some slides of this section were shown
in the presentation at the Monsoon Panel Meeting, for discussion,
but are not included in this file for the webpage)
Connections between
intraseasonal monsoon
variability in South
America and Southeast
Africa(Some slides of this section were shown
in the presentation at the Monsoon Panel Meeting, for discussion,
but are not included in this file for the webpage)
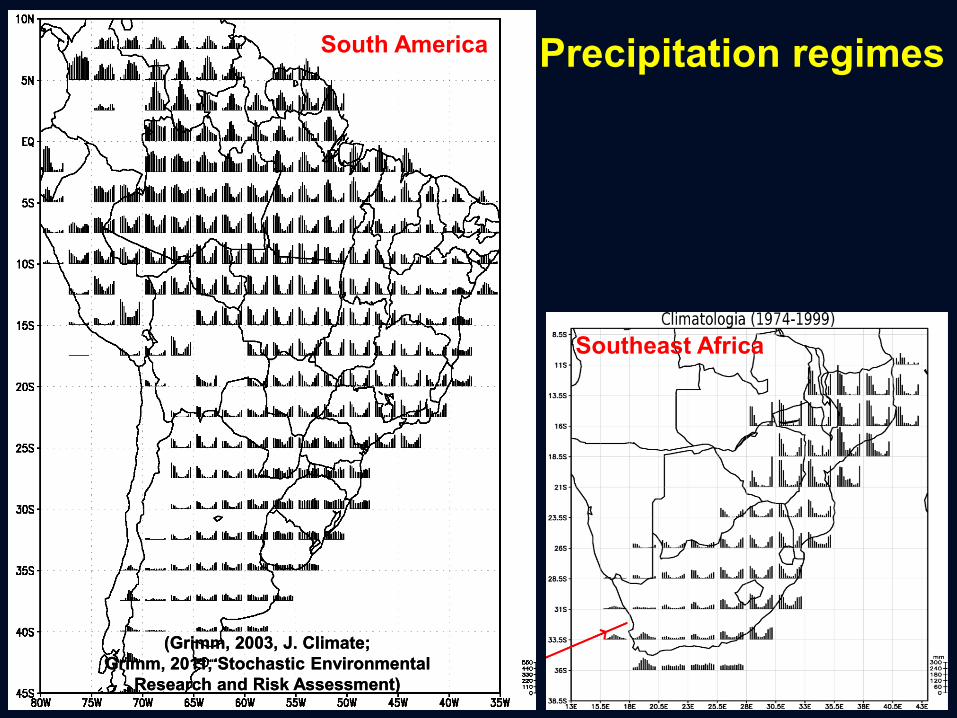
Precipitation regimesSouth America
(Grimm, 2003, J. Climate;
Grimm, 2011, Stochastic Environmental
Research and Risk Assessment)
(Grimm, 2003, J. Climate;
Grimm, 2011, Stochastic Environmental
Research and Risk Assessment)
Southeast Africa
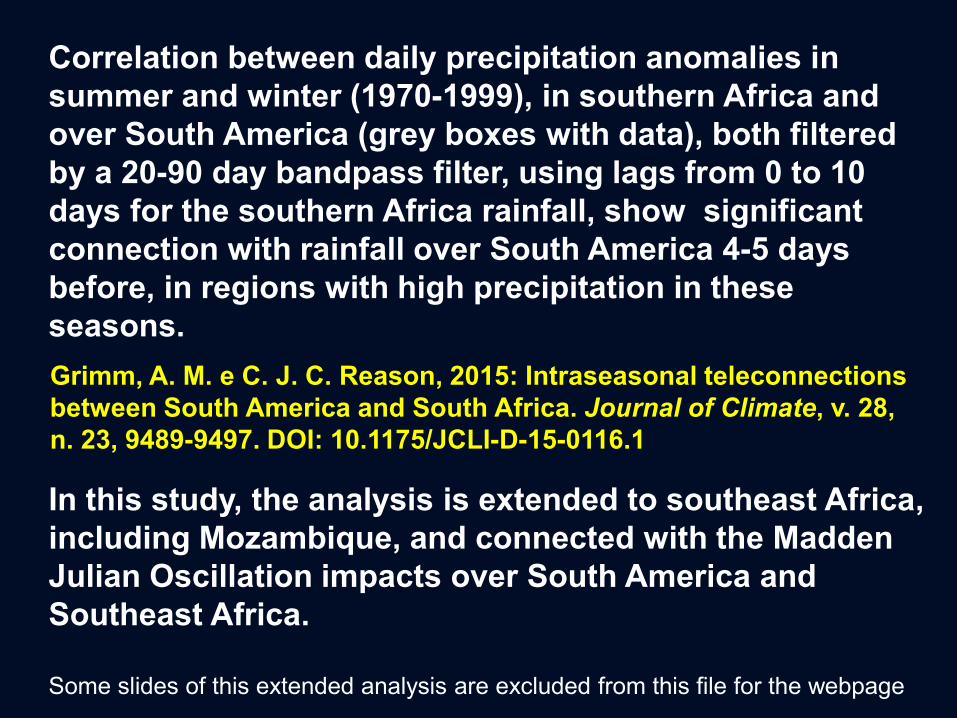
Correlation between daily precipitation anomalies in
summer and winter (1970-1999), in southern Africa and
over South America (grey boxes with data), both filtered
by a 20-90 day bandpass filter, using lags from 0 to 10
days for the southern Africa rainfall, show significant
connection with rainfall over South America 4-5 days
before, in regions with high precipitation in these
seasons.
Grimm, A. M. e C. J. C. Reason, 2015: Intraseasonal teleconnections
between South America and South Africa. Journal of Climate, v. 28,
n. 23, 9489-9497. DOI: 10.1175/JCLI-D-15-0116.1
In this study, the analysis is extended to southeast Africa,
including Mozambique, and connected with the Madden
Julian Oscillation impacts over South America and
Southeast Africa.
Some slides of this extended analysis are excluded from this file for the webpage
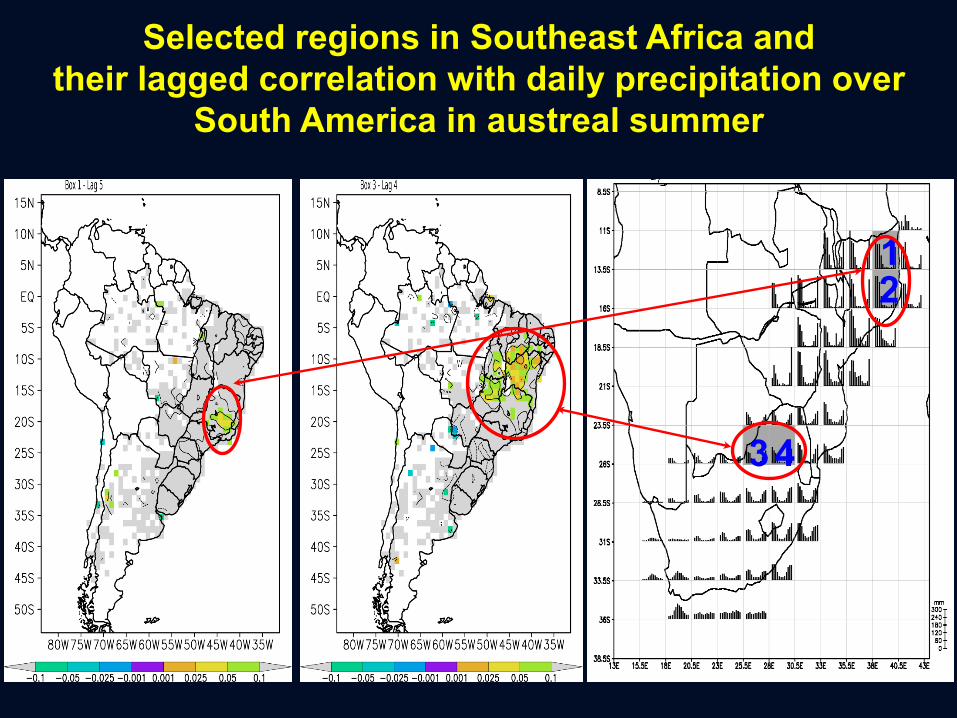
Selected regions in Southeast Africa and
their lagged correlation with daily precipitation over
South America in austreal summer
12
34
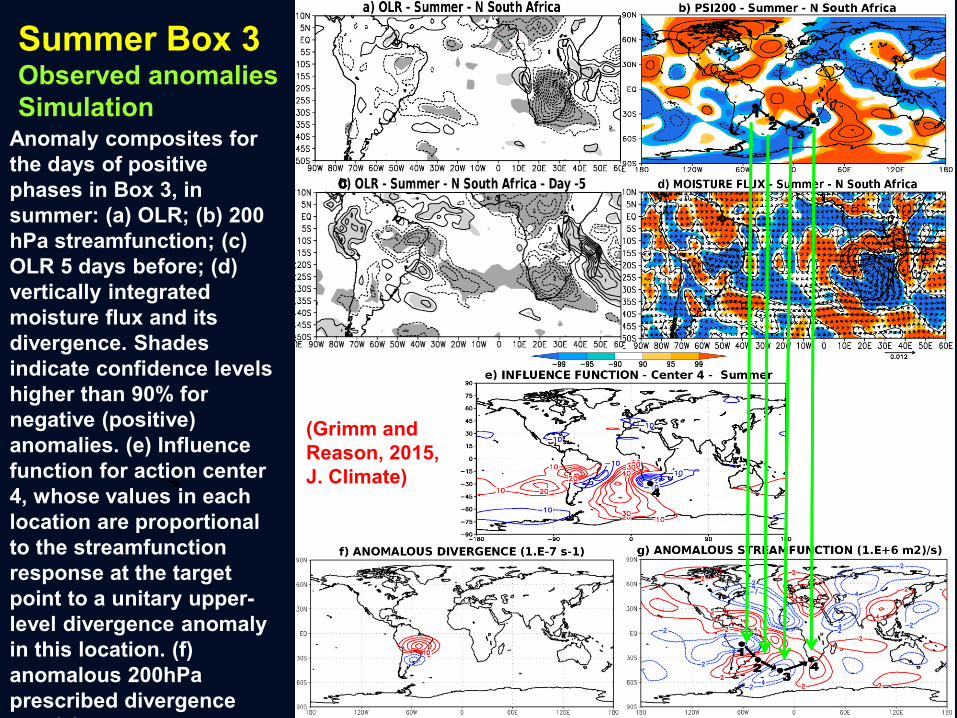
Summer Box 3Observed anomalies
SimulationAnomaly composites for
the days of positive
phases in Box 3, in
summer: (a) OLR; (b) 200
hPa streamfunction; (c)
OLR 5 days before; (d)
vertically integrated
moisture flux and its
divergence. Shades
indicate confidence levels
higher than 90% for
negative (positive)
anomalies. (e) Influence
function for action center
4, whose values in each
location are proportional
to the streamfunction
response at the target
point to a unitary upper-
level divergence anomaly
in this location. (f)
anomalous 200hPa
prescribed divergence
and (g) corresponding
c
(Grimm and
Reason, 2015,
J. Climate)
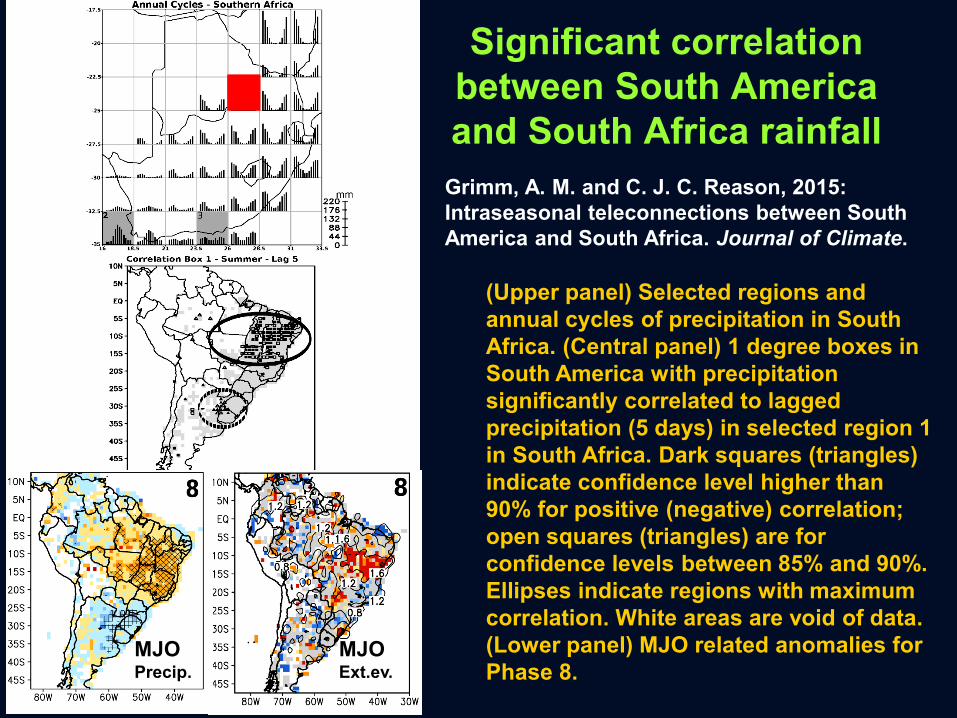
Significant correlation
between South America
and South Africa rainfall
(Upper panel) Selected regions and
annual cycles of precipitation in South
Africa. (Central panel) 1 degree boxes in
South America with precipitation
significantly correlated to lagged
precipitation (5 days) in selected region 1
in South Africa. Dark squares (triangles)
indicate confidence level higher than
90% for positive (negative) correlation;
open squares (triangles) are for
confidence levels between 85% and 90%.
Ellipses indicate regions with maximum
correlation. White areas are void of data.
(Lower panel) MJO related anomalies for
Phase 8.
Grimm, A. M. and C. J. C. Reason, 2015:
Intraseasonal teleconnections between South
America and South Africa. Journal of Climate.
MJOPrecip.
MJOExt.ev.
Teleconnections exist between South American rainfall
variability and that of various South African regions. The mechanisms
by which these teleconnections occur involve the generation of wave
trains across the South Atlantic that then impact on regional circulation
and moisture flux convergence over South Africa. There are also an
anomalous Walker type circulation in the tropical Atlantic region,
associated with anomalous tropical convection.
The strongest relationships between the intraseasonal
variability of South American and South African rainfall exist at lags of
4-5 days of the South African rainfall behind that over South America.
This aspect then suggests that there may be some possibilities for
improving forecasting skill of wet and dry spells over South Africa
based on near real-time monitoring of rainfall upstream over South
America.
Analysis of precipitation and circulation anomalies during
certain phases of the Madden-Julian Oscillation indicate that these
teleconnections are responsible for the MJO impacts in southeast
Africa, especially for producing anomalous rainfall in phases 8 and 1.
Summary and conclusions
Recommended