BALANCED SCORECARD: EVALUATION OF AIR FORCE MATERIEL COMMAND’S
IMPLEMENTATION AND USE
THESIS
Aaron J. Hepler, Captain, USAF
AFIT/GLM/ENS/08-03
DEPARTMENT OF THE AIR FORCE AIR UNIVERSITY
AIR FORCE INSTITUTE OF TECHNOLOGY
Wright-Patterson Air Force Base, Ohio
APPROVED FOR PUBLIC RELEASE; DISTRIBUTION UNLIMITED

The views expressed in this thesis are those of the author and do not reflect the
official policy or position of the United States Air Force, Department of Defense, or the
U.S. Government.
AFIT/GLM/ENS/08-03
BALANCED SCORECARD: EVALUATION OF AIR FORCE MATERIEL COMMAND’S
IMPLEMENTATION AND USE
THESIS
Presented to the Faculty
Department of Operational Sciences
Graduate School of Engineering and Management
Air Force Institute of Technology
Air University
Air Education and Training Command
In Partial Fulfillment of the Requirements for the
Degree of Master of Science in Logistics Management
Aaron J. Hepler, BS
Captain, USAF
March 2008
APPROVED FOR PUBLIC RELEASE; DISTRIBUTION UNLIMITED

AFIT/GLM/ENS/08-03
BALANCED SCORECARD: EVALUATION OF AIR FORCE MATERIEL COMMAND’S
IMPLEMENTATION AND USE
Aaron J. Hepler, BS
Captain, USAF
Approved: ____________________________________ ________ Bradley Anderson, Lt Col, USAF (Chairman) Date
____________________________________ ________ Martha Cooper, Dr (Member) Date ____________________________________ ________ Jeffrey Ogden, Dr (Member) Date

AFIT/GLM/ENS/08-03
Abstract Managing in a contemporary world has become increasingly more complex. It
has evolved from a manufacturing setting with little to steer managers but a single,
financial indicator to managing a greater percentage of intangible assets through
numerous leading and lagging indicators. The industry has also evolved from centrally
located and managed to decentralized, multi-national companies. In response to these
changes, a new strategic management tool was developed called the Balanced Scorecard
(BSC). This management tool has proved successful throughout the last decade.
The purpose of this research was to evaluate the implementation and use of Air
Force Materiel Command's (AFMC's) BSC, which started as a program in 2001. To guide
this effort, a meta-synthesis approach was used to synthesize qualitative BSC data that
resulted in eleven keys to successful BSC implementation and use. Secondly, an
historical methodology was employed to review AFMC's BSC history within each of
these eleven key areas. Finally, perceived gaps between AFMC's BSC and the literature
were identified and recommendations to improve AFMC's BSC were provided. Two
important recommendations are: 1) to conduct analyses to confirm hypothesized cause-
and-effect objective relationships and 2) to ensure new BSC software can continue to
meet AFMC's BSC needs. As Paul R. Niven stated (2003), a properly constructed BSC
can "inspire and motivate all employees, set direction for the organization, and encourage
alignment from top to bottom."
iv

Dedication
I would like to dedicate this to my wife, my son and unborn daughter. This project could
not have completed without their support.
v

Acknowledgments
I would like to express my sincere appreciation to my faculty advisor and readers for
their guidance and support throughout the course of this thesis effort. Their insight and
experience proved critical throughout the research. I would also like to thank my
sponsors for both the support and advice provided to me in this endeavor.
Aaron J. Hepler
vi

Table of Contents Page
Abstract .............................................................................................................................. iv
Dedication ............................................................................................................................v
Acknowledgments.............................................................................................................. vi
Table of Contents.............................................................................................................. vii
List of Figures .................................................................................................................... ix
List of Tables .......................................................................................................................x
I. Introduction .....................................................................................................................1
Background...................................................................................................................1 Problem Statement........................................................................................................1 Research Objectives .....................................................................................................2 Research Focus.............................................................................................................3 Investigative Questions ................................................................................................3 Assumptions/Limitations..............................................................................................3 Implications ..................................................................................................................4
II. Literature Review............................................................................................................5
Introduction ..................................................................................................................5 The Balanced Scorecard ...............................................................................................6 Keys to Successful Balanced Scorecard Implementation and Use ..............................9 Summary.....................................................................................................................30
III. Methodology ................................................................................................................32
Chapter Overview.......................................................................................................32 Qualitative Approach..................................................................................................32 Investigative Question One ........................................................................................33 Investigative Question Two........................................................................................42 Summary.....................................................................................................................49
IV. Analysis and Results....................................................................................................50
Chapter Overview.......................................................................................................50 Investigative Question One ........................................................................................50 Investigative Question Two........................................................................................51 Summary.....................................................................................................................93
vii

viii
V. Conclusions and Recommendations ............................................................................95
Chapter Overview.......................................................................................................95 Research Conclusions.................................................................................................95 Recommendations for Action.....................................................................................96 Significance of Research ............................................................................................98 Recommendations for Future Research......................................................................99 Summary.....................................................................................................................99
Bibliography ....................................................................................................................100
Vita 105

List of Figures Page
Figure 1: Four Perspectives of BSC................................................................................... 7
Figure 2: Quantifiable Measure and Target ..................................................................... 19
Figure 3: City of Transportation Department's Strategy Map ......................................... 23
Figure 4: BSC Flow Chart ............................................................................................... 54
Figure 5: AFMC's BSC Infrastructure ............................................................................. 62
Figure 6: Applying the Triad ........................................................................................... 64
Figure 7: Fundamental Problem....................................................................................... 65
Figure 8: Nested Problems............................................................................................... 66
Figure 9: Focus Areas ...................................................................................................... 67
Figure 10: Measure Representation ................................................................................. 71
Figure 11: Logic of Questions ......................................................................................... 75
Figure 12: Cause and Effect Horizontal Mapping ........................................................... 79
Figure 13: December 16th, 2005 Strategy Map............................................................... 81
Figure 14: Two-Year Capability Sample......................................................................... 86
Figure 15: Number of Metrics Over Time....................................................................... 91
Figure 16: SMIS's Functional Framework....................................................................... 92
ix

List of Tables Page
Table 1: Keys to Successful BSC Implementation and Use ............................................ 10
Table 2: Meta-Synthesis Results...................................................................................... 31
Table 3: Relevant Situations for Different Research Strategies ...................................... 44
Table 4: Keys to Successful BSC Implementation and Use ............................................ 51
Table 5: Rating Summary ................................................................................................ 52
Table 6: Ratings Summary............................................................................................... 94
x

BALANCED SCORECARD: AIR FORCE MATERIEL COMMAND’S IMPLEMENTATION
I. Introduction
Background
“If you’re not keeping score, you’re only practicing” (Schneiderman, 1999).
The strategic management method known as Balance Scorecard (BSC) was
developed by Professor Robert Kaplan, an accounting professor at Harvard University,
and Doctor David Norton, a consultant from the Boston area (P. R. Niven, 2003). These
researchers led a study of a dozen companies to explore new methods of performance
measurement with the hypothesis that traditional financial measures of performance were
ineffective for successful management. From this study, the BSC was born with a
scorecard balanced through careful selection and implementation of four perspectives:
financial, customer, internal-business-process, and learning and growth.
Over the last 15 years, the Balanced Scorecard methodology has matured. It has
been sharpened by its developers through such books as The Strategy Focused
Organization (2000), Strategy Maps (2004), and Alignment (2006). Operational
experience has also been accumulated through a number of BSC implementations.
Together, organizations now have a plethora of information available to implement
and/or analyze BSCs.
Problem Statement
Air Force Materiel Command (AFMC) implemented the use of a BSC in August,
2001 in response to the tasker to “Develop [a] Plan for Executive Management System”
1

(HQ AFMC/XP Deputy, 2001). The command’s goal, explained in the briefing AFMC
Strategy Process and BSC (2006), was to integrate individual initiatives, such as
Capabilities Review and Risk Assessment (CRRA), Expeditionary Logistics for the 21st
Century (eLog21), Purchasing and Supply Chain Management (PSCM), Depot
Maintenance Transformation (DMT), and Agile Acquisition, through the focusing lens of
BSC to deliver “Seamless War Winning Customer Solutions--products and services on
time, on cost” (2006).
AFMC has now orchestrated their BSC from 2001 to present, approximately six
years, and the question remains as to how well they have progressed towards meeting
their goal of “Seamless War Winning Customer Solutions--products and services on time,
on cost”(HQ AFMC/XP Deputy, 2001).
Research Objectives
This objective of this research was to explore AFMC’s BSC implementation and
evaluate its implementation and current use. To accomplish this, AFMC’s BSC
implementation and use needed compared and contrasted against the BSC literature.
Specifically, this thesis identified key factors for BSC success and then compared them
with that of AFMC’s journey, identified perceived differences, provided analyses and
made recommendations.
2

Research Focus
Research Question
Does AFMC’s BSC implementation and use align with what the literature
indicates is required to obtain optimal results?
Investigative Questions
Investigative Question One
What are the key areas of a BSC an organization must address and succeed in to
optimize its use?
Investigative Question Two
How does AFMC’s implementation and use of the BSC align with what the
literature indicates is needed to obtain optimal results?
Assumptions/Limitations
This research was based on one main assumption and that was that all of the data
collected was reasonably accurate and valid, since it was not observed but rather
reported.
The two major limitations in this research were conclusions which were based
solely on historical documentation and an inability to review and utilize AFMC’s BSC
software. First, an historical methodology was utilized to review AFMC’s BSC. This
methodology lacks some of the insights and alignment which could have been added
through interviews. Secondly, the command’s software was unable to be utilized during
the research due to its decommissioning. Availability of the software may have increased
3

4
the scope of this research to include a quantitative analysis, further validated this
research’s findings, or possibly provided deeper AFMC BSC understanding.
Implications
This research assessed whether AFMC had maximized their opportunity to
optimize their BSC. The results will provide guidance for other organizations in critical
key processes within their implementation and use of a BSC. Additionally, perceived
misalignments between AFMC’s BSC and civilian BSC literature were identified and
recommendations provided in areas which could be addressed and improved. The most
important implication of this research is to ensure the BSC methodology is understood
and properly implemented to “inspire and motivate all employees, set direction for the
organization, and encourage alignment from top to bottom” (P. R. Niven, 2003).

II. Literature Review
Introduction
In 1992, Kaplan and Norton published the strategic, management method called
the Balanced Scorecard (BSC) in the article “The Balanced Scorecard--Measures That
Drive Performance,” based on performance measurement. Harvard Weekly Review
hailed it as one of the 75 most influential ideas of the twentieth century (P. R. Niven,
2003). Shortly after its introduction, companies around the world started implementing
their own BSC’s and proving its success, such as Mobil, Best Buy, BMW Financial
Services, Canon USA, Wells Fargo and many, many more.
One example of the BSC’s success can be seen from Mobil’s BSC experience,
which started in 1994. In 1992, Mobil needed a $500 million infusion from their parent
company to sustain operations. By 1994, it was the least profitable company in its sector.
Executives knew things needed to change and decided to roll out the BSC. Within a year,
Mobil had the top profitability rating with profits 56 percent higher than the industry
average. Mobil’s success continued to reach new heights, reflecting the number one
ranking in profits in 1997--for a third consecutive year. (R. S. Kaplan and Norton, 2002)
Since its inception, the BSC has continued to blossom. Over half of the
Fortune 1000 organizations have adopted the BSC (Marr and Schiuma, 2003). It has
matured through numerous publications and has left a trail of lessons learned and critical
focus areas which should be addressed to optimize results.
This literature review provides the reader with an understanding of the BSC and
its structure. Then, it identifies and expands on the key areas that should be addressed in
order to optimize companies’ BSC success.
5

The Balanced Scorecard
Kaplan and Norton introduced the importance of a Balanced Scorecard (BSC) by
providing the following example of traditional management systems (where managers
focus and make decisions based solely on evaluation of financial factors) through a
conversation with a pilot.
Q: I’m surprised to see you operating the plane with only a single instrument. What does it measure? A: Airspeed. I’m really working on airspeed this flight. Q: That’s good. Airspeed certainly seems important. But what about altitude? Wouldn’t an altimeter be helpful? A: I worked on altitude my last few flights and I’ve gotten pretty good on it. Now I have to concentrate on proper air speed. Q: But I notice you don’t even have a fuel gauge. Wouldn’t that be helpful? A: You’re right; fuel is significant, but I can’t concentrate on doing too many things well at the same time. So on this flight I’m focusing on air speed. Once I get to be excellent at air speed, as well as altitude, I intend to concentrate on fuel consumption on the next set of flights. (R. S. Kaplan and Norton, 1992)
This example illustrated that as a qualified pilot would not fly without the appropriate
number and type of indicators in an aircraft, nor should an executive operate a company
without anything less than an appropriate number and consistency of guiding indicators.
(R. S. Kaplan and Norton, 1992)
The BSC was developed as a management system through performance
measurement to assist decision makers in understanding and obtaining strategic goals (R.
S. Kaplan and Norton, 1996). It does this by building and balancing causal linked
objectives into a “balanced scorecard,” through which an organization provides a
framework that tells the story of the organization’s strategy (P. R. Niven, 2003). As
illustrated through the above conversation, the BSC methodology recognizes the fallacy
of relying on just financial measures; therefore, it also integrates those financial measures
6

with critical operational measures. It accomplishes this by providing a default structure
or “balanced scorecard” in the form of four perspectives: financial, customers, internal
business processes, and learning and growth (R. S. Kaplan and Norton, 1996).
Companies can use this balanced scorecard framework to select a balanced set of
objectives and measures to effectively manage their organizations.
The four perspectives that Kaplan and Norton commonly found during their case
studies are displayed in Figure 1. The development of a company’s financial
perspectives’ objectives and measures allows that company to “define the financial
performance expected from the strategy and ... set targets for the other measures and
objectives of all the other scorecard perspectives” (R. S. Kaplan and Norton, 1992).
(R. S. Kaplan and Norton, 1992)
Figure 1: Four Perspectives of BSC In the customer perspective, organizations identify the “customer and market segments in
which they have chosen to compete,” or in the case of the military, it identifies the
customer which the organization serves. Additionally, it also permits companies to
7

“align their core customer outcome measures and identify and measure, explicitly, the
value propositions they will deliver” (R. S. Kaplan and Norton, 1992). In the internal
business process perspective, “processes at which the organization must excel in order to
continue adding value to the customers” are identified; organizations may have to re-
engineer internal processes rather than focusing on continuous improvements of existing
activities (P. R. Niven, 2003). Finally, in the learning and growth perspective (the
enabler of the other three perspectives) measures are designed to close gaps between
current organizational infrastructure of employee skills, information systems, and
organizational climate which are discovered during the process of modeling the other
three perspectives. However, these perspectives are only suggestive when using the BSC
model. Organizations are able to tailor these perspectives to best meet their individual
needs and strategy.
The BSC retains financial measures and introduces drivers of future performance.
Financial measures are measures of past performance which identified where one has
gone and not necessarily where one is going; therefore, they are termed lagging
indicators. They may have been adequate for industrial-age companies for which
investments, long-term capabilities and customer relationships were not as critical for
success, but financial measures alone are inadequate in today’s age of future value
through investment in customers, supplies, employees, processes, technology, and
innovation. (R. S. Kaplan and Norton, 1996) By combining financial and performance
measures, the BSC provides real insight into organizations’ operations and assists in
implementing strategy (P. R. Niven, 2003).
8

Keys to Successful Balanced Scorecard Implementation and Use
Since the conception of the Balanced Scorecard (BSC), companies have
succeeded and failed at its implementation. Along the way, numerous researchers have
analyzed and published these results. Review of these results has provided 11 keys to
successfully implement and use a BSC, which when followed will improve the
probability of a company’s BSC success (Table 1).
While this research does not focus on implementation order (Table 1), they are
discussed in that way within this section to provide structure. However, the presented
implementation order is a common and logical progression for BSC development and
use. First, the BSC has only proven successful in studies where it was deployed from the
top of the organization. Some BSC consulting agencies even have a standard operating
instruction to decline consultation service to companies that do not have this top-level
involvement. Secondly, a BSC framework is necessary to develop, implement and
monitor the BSC use. Thirdly, prior to developing a BSC, standards should be
established. In addition to identifying areas to standardize, this key also identifies what
not to standardize when cascading the BSC. Keys four, five, six and seven should be
implemented together. They are separated into four different keys because there is
specific information provided about each key; however, they should be implemented in
concert with each other. Implementing them together ensures that objectives and
performance measures are quantified and present causal relationships--derived through
the implementation of a strategy map. Next, BSC software should be carefully selected
because it is critical in meeting organizational requirements. The sixth step, which could
9

arguably be the fifth, is to establish goals for measures and timelines for their completion.
Without goals and timelines, a company may not be moving towards improvements but
merely maintaining. The seventh step--simplify management systems--is important in
managing precious resources and obtaining employee buy-in. The eighth and final step
listed here is to cascade the BSC. Without this step, the executives would know where
the company is trying to go and what it is trying to achieve, but the workers would be left
in the dark and therefore unable to direct their efforts accordingly.
Table 1: Keys to Successful BSC Implementation and Use Implementation
Order1 1 Deploy BSC from the Top Down2 2 Establish BSC Framework3 3 Standardize Within the BSC--but Do Not Standardize Content
4 Select the Right Objectives and Performance Measures5 Quantify Objectives or Their Performance Measures6 Ensure Objectives Present a Causal Pattern7 Implement Strategy Maps
5 8 Select Software to Help--Not Hinder6 9 Select BSC Goals and Timelines for Their Completion7 10 Simplify Management Systems--Do Not Just Add To Existing Framework8 11 Cascade the BSC
Key to Successful BSC Implementation and Use
4
1. Deploy BSC from the Top Down
The BSC, by its very design as a strategic management tool, requires top-level
development, support and involvement. While the BSC could be used without top-level
involvement, the company will not be fully utilizing the BSC’s potential. First, top-level
involvement provides benefits by building consensus on the direction in which the
company should focus, strengthens commitment towards selected objectives and goals,
10

and simultaneously facilitates team building. Secondly, by having top-level involvement,
the execution of the company’s initiatives will be supported and financial backing
provided. Numerous case studies have shown that top-level involvement and deployment
does indeed provide positive results (Building and implementing a balanced scorecard
case study: UNUM corporation.1999; Active Strategy, 2007b; Antarkar, Cobbold, and
2GC Active Management, 2001; Cuganesan, Ford, and Khan, 2006; Schneiderman,
1999).
A case study completed by 2GC Active Management on a company disguised as
“Arran Ltd.,” a multi-divisional retail financial service firm based in the UK, reflected the
negative results when there is an absence in top-level deployment. Their first BSC was
developed by the General Manager and used in the Retail Division. The appeal of the
Retail Division’s successful implementation and use of the BSC prompted its design and
approach to be applied at the corporate level and throughout other divisions. Since the
BSC was not developed from the top in a corporate scorecard, imposition of numerous
non-regionalized standards and objectives, which were right for the Retail Division but
not for the company as a whole, were pushed onto the remaining divisions.
Consequently, 2GC concluded these imposed standards and objectives marginalized
Arran’s BSC. Additionally, they reported that by the time the case study was prepared,
only financial perspectives of various scorecards were still being used. (Cobbold and
2GC Active Management, 2001)
Ultimately, BSCs should be deployed from the top-down for two main reasons.
The first reason is to ensure management has come to a consensus of their strategic goal,
11

objectives and measures. The second reason the BSC is deployed from the top-down is
so it will be formulated to best fit the corporation as a whole and carry with it support and
financial backing.
2. Establish BSC Framework
The implementation of a BSC is not an overnight process change; therefore, an
implementation framework needs to be in place to maintain drive and initiative.
Additionally, the nature of the BSC as a continuous improvement system requires
vehicles which will aid in monitoring and continually improving its performance.
The UNUM Corporation utilized innovative vehicles to motivate employees and
monitor the company’s performance and direction. One way UNUM ensured their BSC
was meeting the needs of the customers was through a benchmark survey. This survey
measured employee’s perception on how the company is doing at meeting their vision of
“... having the mind of a customer and the pride of an owner” by having them evaluate 11
different key areas, such as “live by our word” and “strive together towards goals.”
Ultimately, the company’s goal was to increase the number of employees who believed
these behaviors were being practiced and decrease the number of those who did not.
Secondly, UNUM created trust workshops and a 360 degree appraisal system to help
further ensure that managers are aligned to the corporate BSC. A third motivator, which
UNUM agreed was one of their biggest successes, was the 1998 Goals Stock Option
Plan. This plan provided employees with a stock option grant and was believed to
motivate employees to “have a mind of a customer and the pride of an owner” because
their actions now affected themselves fiscally. UNUM also incorporated an annual bonus
12

for meeting company goals. The combination of the stock option plan and the bonus for
meeting the annual goals provided the motivation for the employees to reach both short
and long-term goals. Another key part of UNUM’s BSC development was continuous
improvement processes. These processes included development of best practices, regular
reviews to evaluate the company’s BSC, obtaining feedback from their managers, and
publishing questions for all employees to focus. Evidence of the improvement in the
company through these innovative vehicles was presented in UNUM’s 1997 Annual
Report which stated that the company was “closer than ever to its vision...of world
leadership in disability and special risk insurance.” (Building and implementing a
balanced scorecard case study: UNUM corporation.1999)
Implementing a BSC can be a slow, labored process and require a strong
implementation framework, as well as vehicles to aid in monitoring and continually
improving the BSC’s performance. Without these, implementation efforts may flop, or if
a BSC is successfully implemented and not continuously improved, it could become
stagnant.
3. Standardize Within the BSC—but Do Not Standardize Content
Standardizing within a BSC can be accomplished in different areas such as
standardizing vocabulary to define BSC components to increase communication as well
as understanding (i.e. what exactly do the terms vision, objectives, measures, initiatives,
etc. mean?) and standardizing design process and review cycles to promote continuous
improvement. However, standardizing BSC content in cascaded scorecards, in the form
of mandatory objectives and measures, risks diminishing employee buy-in and potentially
13

reduces the ability to further optimize the cascaded scorecard through its
individualization.
Paul R. Niven, author, management consultant and noted speaker on the BSC, felt
so strongly on the topic of standard vocabulary that he wrote an entire article titled “The
Importance of Terminology to Your Balanced Scorecard.” In his introduction, he quoted
Karl von Clausewitz, a German General:
The first task of any theory is to clarify terms and concepts that are confused…Only after agreement has been reached regarding terms and concepts can we hope to consider the issues easily and clearly, and expect others to share the same viewpoint…. (P. Niven, 2006a).
Niven transitioned into the importance of language selection by also quoting
Organizational Learning Expert Peter Senge:
Words do matter. Language is messy by nature, which is why we must be careful in how we use it. As leaders, after all, we have little else to work with. We typically don't use hammers and saws, heavy equipment, or even computers to do our real work. The essence of leadership -- what we do with 98 percent of our time -- is communication. To master any management practice, we must start by bringing discipline to the domain in which we spend most of our time, the domain of words. (P. Niven, 2006a)
The importance of a standard vocabulary extends into determining a set of BSC
standards. Niven explained that “what passes for measures in your shop, may be a key
performance in another,” and by having differences such as these “can have a profound
impact on the success of your BSC.” He concluded by stating that an organizational team
should invest in a terminology exercise, so they can
agree on specifically [what the common terms] mean..., construct a solid foundation from which to launch both their Scorecard building efforts and educational initiatives..., and finally and possibly most importantly, give team members insight into unique perspectives held by their colleagues...leading to a stronger team. (P. Niven, 2006a)
14
Two case studies completed by 2GC Active Management on companies disguised
as “Crosshouse” and “TRURO” evaluated the area of standardization. (Crosshouse is a
multi-national fast moving consumer goods company and TRURO is a multi-divisional
oil firm based in the Middle East.) Through their study of Crosshouse, 2GC concluded
that a standardized approach “facilitated auditing of BSC design work, and also built a
common vocabulary within the organization.... This helped promote internal discussions
concerning strategy, and also made it easier for units to learn about their new unit’s
strategy and performance.” (Lawrie, Cobbold, and 2GC Active Management, 2001)
Conversely, the case study on TRURO identified that a default design approach was set
in place for cascading the BSC to ensure consistency throughout the project. They found
that using a designated design approach helped with “communication and performance
issues both during and after the design project.” However, with this benefit, the company
also incorporated a standardized “objective based BSC architecture,” which bordered on
the negative aspect of standardized content. Because of this, 2GC Active Management
concluded TRURO “reduced the availability of the developers of the...BSC...to ensure
alignment with the overall goals of the business.” (Antarkar et al., 2001)
UNUM Corporation, a disability and special risk insurer who has been recognized
as the “100 best companies to work for in America” by Fortune magazine (1997) and
“100 best companies for working mothers” by Working Mother magazine (1997), also
disagrees with implementing standardized BSC content throughout their organization.
Eileen Farrar, vice president of human resources, instructed their companies managers
“...to decide on [their own] the most effective way to move that company towards
15

strategic goals. At the unit level, it is the responsibility of the manager to roll the unit’s
goals back to company and corporate goals. However, annual business goals will not be
accepted unless they represent progress towards our corporate goals.” (Building and
implementing a balanced scorecard case study: UNUM corporation.1999)
In this section, standardization within the BSC was discussed within three main
areas: standardized vocabulary, standardized approach and standardized content.
Standardized vocabulary and approach are beneficial to an organization’s BSC.
Standardized vocabulary provides a clear understanding of the terminology.
Standardized approaches provide users with direction. Conversely, requiring
standardized content throughout an organization’s cascaded BSCs can degrade a
company’s success. This happens by preventing the different business units from
customizing their scorecards to best meet their needs while still aligning with the
corporate scorecard.
4. Select the Right Objectives and Performance Measures
The selection of the “right” objectives is crucial to a company’s BSC success
(Schneiderman, 1999). Commonly, executives, who have historical knowledge and know
what areas their company must succeed in to be profitable, meet to discuss and select
their BSC’s objectives and performance measures. But there are scientific methods
available to also make these selections. One such way is through the use of a quality
function deployment (QFD) (Schneiderman, 1999). QFD was introduced in 1972 by Yoji
Akao to aid in physical design. Since then, it has also been shown to be valuable in non-
physical designs. Literature revealed a small study where QFD was used on the
16

systematic selection of textbooks, as well as a more applicable, larger study where QFD
was used in developing a BSC for an air cargo terminal (Chen and Chou). By applying a
scientific method selection, such as the QFD, users could “concurrently engineer towards
the goal of ensuring the satisfaction of shareholders, employees and external customers”
(Chen and Chou).
Selecting the right objectives and performance measures is critical to BSC
success. If organizations fail to select the right objectives and performance measures,
they could be steering their company in the wrong direction, and ultimately, decrease—or
fail to optimize—the value added to the end users.
5. Quantify Objectives or Their Performance Measures
Objectives, or their performance measures, must be quantifiable. A company
should also take care to measure what they want to manage and to not manage what they
measure (Excitant, 2005b; R. S. Kaplan and Norton, 2004). Niven quotes the Irish
mathematician and physicist Lord Kelvin’s viewpoint on measures: “When you can
measure what you are speaking about, and express it in numbers, you know something
about it; but when you cannot measure it, when you cannot express it in numbers, your
knowledge is of a meager and unsatisfactory kind...” (P. R. Niven, 2003). Others have
simply stated, “You can’t manage what you can’t measure.” Regardless of who said
what, measurements provide managers the opportunity to know where they are and
establish goals as to where they want to go.
Under the BSC framework, there are two reasons why objectives or performance
measures require quantification. First, managers sometimes choose “vague and nebulous
17

terms” to identify an objective (P. R. Niven, 2003). Selecting quantifiable objectives (or
performance measures when a vague objective is named) provides employees at all levels
with the ability to clearly understand the objective. This permits “all employees [to]
focus their energies and day-to-day activities on the [now] crystal clear goal” (P. R.
Niven, 2003). Secondly, quantified objectives (or performance measures) permit
management to question and test their hypothesized cause and affect relationships.
The example in Figure 2 illustrates selection of a quantified performance
measure for an objective (AFMC, 2007b). In this example, the department hypothesized
that by reducing “average wait time at key bus stations during rush hours” the linked
objective “provide convenient travel” would improve. Anyone who views this scorecard
could understand that one way to improve the objective “effectively cover rush hour
demands” is to reduce average wait times. Associating an objective with a quantified
measure permits employees to understand which part of their day-to-day operations to
focus on improving--to help meet the company’s strategic goal. If a quantified
performance measure was provided for “providing convenient travel”, statistical
computations could be made after adequate data was collected in each area. This analysis
could either fail to reject or reject the hypothesis that “by effectively managing rush hour
demands” they will be “providing convenient travel” and in-turn maintain or adjust their
scorecard accordingly.
18

1. Objectives
Value for Taxpayer
Money
Provide Convenient
travel
Adjust to traffic
problems
Mis
sion
Cus
tom
erPr
oces
sLe
arni
ng a
nd
Gro
wth
2. Measure
3. Target: the desired level of performance
Average wait time at key bus stations during rush hours
Effectively cover rush
hour demands
TargetActual
17
8PerformanceGap
Example: City Transportation Department
(AFMC, 2007b)
Figure 2: Quantified Measure and Target There were two important areas noted in this section when selecting BSC
objectives or their performance measures. First, they need to be quantified to clearly
relay the priorities of the company to their employees and permit statistical analyses to a
BSC’s success to stay the course, change directions or simply convince sponsors of the
BSC’s success. Secondly, when numerous measures are identified to represent a single
objective, those measures should be weighted to reflect each measure’s importance on the
objective. This permits organizations to prioritize their efforts and resources as well as
properly analyze hypothesized relationships.
6. Ensure Objectives Present a Causal Pattern
As previously mentioned in development of the strategy map, the perspectives’
objectives should be selected in such a fashion that they are all linked through cause-and-
19

effect (R. S. Kaplan and Norton, 1996). The rationale behind the cause-and-effect
relationship is that a properly constructed scorecard should tell the story of the business
unit’s strategy through a sequence of relationships. Peter Drucker was quoted as saying
“The most common source of mistakes in management decisions is the emphasis on
finding the right answer rather than the right question” and BSC is no exception
(Schneiderman, 1999). It is not enough to simply select objectives that meet the criteria
within each of the BSC’s perspectives. Emphasis should be placed on selecting
objectives which “...identify and make explicit the sequence of hypotheses about the
cause-and-effect relationships so that they can be managed and validated” (R. S. Kaplan
and Norton, 1996).
An example of this cause and effect pattern is reflected in the Department of
Transportation example in Figure 2, above. Here the hypothesis is that improvement in
the learning and growth perspective’s objective of “adjust to traffic patterns” will lead to
an improvement in the internal and business processes perspective’s objective of
“effectively cover rush hour demands.” This philosophy of the obligatory cause and
effect relationship throughout the BSC should link all objectives, from the bottom of the
strategy map to the top.
The failure to develop a causal model of the strategy will cause organizations to develop performance measures that are not tied to how the organization intends to compete. The outcome is a collection of measures that is fragmented and adds little value add to the organization. The BSC ends up becoming an exercise in developing more paper work and information collection that does not have a strategic impact. (Othman, 2006)
20

7. Implement Strategy Maps
Another critical part of the BSC, a strategy map, is a necessary tool used to “align
priorities of different domains and to help balance the tangible and intangible elements in
the overall strategic plan” (R. S. Kaplan and Norton, 2004). In 1982, Brookings Institute
showed that the majority of an organization’s value was tangible--62 percent (Blair,
1995). Baruch Lev, the Philip Bardes Professor of Accounting and Finance at New York
University's Leonard N. Stern School of Business, estimated that by the end of the
twentieth century, tangibles would account for only 10 to 15 percent of a company’s
value (Webber, 2000). While the developers identified the strategy map to assist in the
balance of tangibles and intangibles, it has also proven to be a globally recognized form
of understanding the user’s strategy and causal objective measures.
Kaplan and Norton explained how a strategy map can help organizations align
their strategy and its characteristics:
Physically, a strategy map is a single page split into four horizontal bands or rows – one for each perspective, plus information listing areas of alignment, such as strategic change. Each band displays its area’s priorities with the names circled. These priorities range from long-term shareholder value on the financial band to the customer value proposition on the customer band. Arrows link related subjects, up and down, from one band to another. The result is one page that describes the company’s value proposition and growth strategy, plus the linkages that explain how those objectives will be achieved. (R. S. Kaplan and Norton, 2004)
An example of a strategy map, courtesy of Air Force Materiel Command’s
(AFMC) Strategy Implementation training aid, is depicted in Figure 3. This example of
the City’s Department of Transportation’s strategy map reveals their strategic theme and
illustrates the causal relationship between one perspective to the other in order to achieve
the “balance” for success when using the BSC. In this example, the department initially
21

decided that their mission was to increase the value for taxpayer’s money. Once the
mission was established, the department understood and tried to provide what the
customer interprets as value for their money--convenient travel. The department then
identified what processes were critical to providing the customer with convenient travel--
effectively cover rush hour demands. Finally, the department answered how they were
going to accomplish the objective of effectively covering rush hour demands by selecting
the objective of adjusting to traffic problems within their learning and growth
perspective. Upon completion of the City’s Transportation Department’s strategy map,
everyone privy to its contents can clearly identify what objectives need to be optimized
within each perspective in order to accomplish the mission (AFMC, 2007b).
22

Value for Taxpayer
Money
Provide Convenient
travel
Adjust to traffic
problems
Mis
sion
Cus
tom
erPr
oces
sLe
arni
ng a
nd
Gro
wth
Effectively cover rush
hour demands
Value for Taxpayer
Money
Provide Convenient
travel
Adjust to traffic
problems
Mis
sion
Cus
tom
erPr
oces
sLe
arni
ng a
nd
Gro
wth
Effectively cover rush
hour demands
(AFMC, 2007b)
Figure 3: City of Transportation Department's Strategy Map A Manpower Australia case study reflected the results from a company’s use of a
strategy map. Suresh Cuganesan and Guy Ford, from Macquarie Graduate School of
Management, completed a case study of the company Manpower Australia titled “Using
Strategy Maps and the Balanced Scorecard Effectively: The Case of Manpower
Australia.” In their report, they concluded that Manpower Australia’s strategy map “was
used to describe the corporate strategy and elaborate how the value would be created
through the execution of the strategy.” It was added that a key feature of their strategy
map was “the integration and alignment of all levels of [Varina Nissen’s, Managing
23
Director of Manpower Australia] management team and the overall organization,” as well
as creating a “less silo-oriented county.” A survey confirmed the BSC and its strategy
map success with 85 percent of responses agreeing “the BSC had provided a better
understanding of business, more focus on key issues and learning and development of
management team.” (Cuganesan et al., 2006)
Prior to using a strategy map as a part of the BSC, organizations experienced
negative side effects. “Organizations went overboard with number of measures they
adopted.” Furthermore, “not only were there too many to measure and manage, they
were often only marginally relevant or conflicted with other measures.” The absence of
scorecards also contributed to a lack of required linkage between the strategy and
objectives. (Armitage and Scholey, 2004) These effects could still hold true for
organizations that do not apply them today.
8. Select Software to Help--Not Hinder
Software should help--not hinder--the efforts to manage business processes. This
concept is especially important when implementing and using a BSC, which has
structural roots in a company’s ability to capture and monitor measurement data with
appropriate software. Should software become a roadblock to success rather than an
enabler, discouragement and non-productivity becomes inevitable.
South Florida’s Miami-Dade County’s Office of Strategic Management
apparently knew software was a key to strategic success when they hired Active Strategy
to provide them with Active Strategy Enterprise™ software. This software permitted
drill down capability starting with top-tier objectives and ending with the supporting
24

measures. (Active Strategy, 2007b) In addition to the ease of data review throughout the
different levels and data collection, this system also facilitated “deeper and more
beneficial reviews of performance, allowing key managers to focus not only on how they
have been performing to date, but much more importantly on where performance levels
need to be and how they will get there.” Mr. George Burgess, County Manager, added
“Active Strategy Enterprise™ software enables business review meetings to be
conducted in a format where all the information is easy to share for consideration and
feedback.” Because of Active Strategy and their provided software, Miami-Dade “has
been able to become more focused, on track, and aligned with its strategic goals and
performance objectives,” which became evident when they were named Overall
Performance Management award winner in 2007 by The Performance Institute and The
Council for Excellence in Government. (Active Strategy, 2007b)
2GC Active Management also felt software selection is a critical step in process
improvement to prevent hampered efforts. They believed a clear understanding of what
is needed and wanted in a software system should be made prior to acquisition and its
implementation. Their case study on Crosshouse revealed that while software selection
was carefully thought out it may not have been the right choice. Crosshouse choose an
internal, limited software system for its use and provided a low-profile presentation
throughout the company. 2GC concluded that because of the characteristics of the
chosen software system and the manner in which it was presented, managers placed a
lower priority on their requirement to populate it with their area’s measures and targets.
Consequently, 2GC conveyed that this lead to a large number of “completion delays
25

which consumed time and energy that would otherwise have been invested in making use
of the BSC system, and probably reduced the utility of the whole project to the
organization.” (Lawrie et al., 2001)
The literature showed that helpful software is required to help mitigate difficulties
in BSC implementation and use. It provides the capability to capture and utilize all BSC
data. Helpful BSC software also increases employee buy-in and moral which could lead
to increased productivity.
9. Select BSC Goals and Timelines for their Completion
Like objectives, goals and their timelines are commonly selected subjectively.
Arthur M. Schneiderman, independent consultant on process management, contended that
“...rather than negotiating scorecard goals, they should be based on knowledge of the
required corrective actions, or absent that knowledge the capabilities of the improvement
process as captured in an empirical model such as the half-life method” (Schneiderman,
1999). Schneiderman also expanded this reasoning stating that if a goal is too low, the
company will underperform relative to its potential; if the goal is too high, the company
will underperform according to others’ expectations. In either circumstance, a non-
desirable outcome will be the result. (Schneiderman, 1999)
In the case study of UNUM Corporation, goals were believed to have a strong
impact on obtaining desired results. UNUM selected and referred to their goals as ‘Goals
1998.’ Farrar commented, “Specifying a year by which we reach our goals worked
well...because it gave employees something definite to aim for...” (Building and
implementing a balanced scorecard case study: UNUM corporation.1999). The case
26

study on UNUM Corporation showed the benefit of establishing goals which were met by
a corresponding timeline, but it also demonstrated that they may have also been doing
themselves an injustice if those goals were established below the company’s potential.
Operating without the establishment of goals would lead to organizations just
going through the motions. To maximize potential and results, not only do goals need set
and worked towards the “right” goals need selected.
10. Simplify Management System--Do Not Just Add To Existing Framework
Niven wrote that “the key to BSC success lies in selecting, and measuring, just
those processes that lead to improved outcomes for customers, and ultimately allow you
to work toward your mission” (P. R. Niven, 2002). The BSC was designed to operate as
the central management system within an organization. While maintaining current
measures until the new BSC is online could prevent a management gap. However, a
decision to add the BSC to the existing framework with no intention of making it the
primary management system ultimately increases measures which must be tracked. This
increase could lead to reduced employee buy in and diluted scorecard ability and results
to the decision makers.
2GC Active Management echoed the viewpoint that the BSC should be the central
management system by stating the “BSC...is designed to improve focus on what is
important.... This increases clarity and reduces ambiguity - not more information, just
relevant information.” 2GC Active Management’s case study on TRURO’s BSC
implementation, a company which chose not to replace their current management system
with their BSC, concluded that “the introduction of additional processes [without
27

reduction in current measures] did not lead to simpler or more effective business
processes.” (Antarkar et al., 2001) In a rare case where a company identified through
implementation of a BSC that they were in fact not using enough measures to monitor
operations, measures could be added. 2GC Active Management’s case study on
Crosshouse reflected this point and they concluded “new information was relevant and
valuable. This offset resistance to [the] increase...” (Lawrie et al., 2001).
The literature indicates that only measures that lead to improved outcomes for
customers, and ultimately allow an organization to work toward their mission, should be
utilized. By focusing on other than these measures, companies consume precious
resources and once again have the potential to decrease moral. Additionally, the
literature also indicated that the BSC should be the central management system within an
organization. By utilizing more than one management system, companies could be
sending unclear messages to employees and increasing manual error through increased
data inputs.
11. Cascade the BSC
Niven opened his commentary on cascading the BSC to create alignment by
describing a story about former President B. Johnson’s tour of Cape Canaveral during the
space race to the moon. Niven tells that:
During his visit, the president came across a man mopping the floor and asked him, “What’s your position here?” The gentleman looked up from his pail and proudly replied, “I’m sending a man to the moon.” Such is the power of alignment, when every person, regardless of role or rank, possesses a clear line of sight between his or her job and the organization’s loftiest goals. (P. R. Niven, 2003)
28

Niven quantified this point by including the results presented by consulting firm
Watson Wyatt which revealed that only 49 percent of employees understood their
company’s goals--a 20 percent decrease from a study completed just three years earlier.
Ilene Gochman expanded on these results stating, “There is tremendous positive impact
to the bottom line when employees see strong connections between company goals and
their jobs. Many employees aren’t seeing that connection” (Taub and CFO.com).
Niven explained that cascading should start with the highest-level scorecard,
referred to as the corporate-level or organization-wide Scorecard, with its objectives and
measures indicating critical drivers for the company’s success. And that every scorecard
subsequently developed should link back to that document. Niven continued to state that
through cascading a two-way flow of information up and down the organizational
hierarchy is created (double loop management style). Furthermore, when scorecards are
cascaded and results analyzed across the agency, the ability for leaders to see across their
organization will increase. As a result, Niven concluded “Analysis is no longer limited to
a few high-level indicators...; instead, cascaded Scorecards provide real-time data for
decision making, resource allocation, and, most importantly, strategic learning.” (P. R.
Niven, 2003)
2GC’s case study on Crosshouse presented results from their cascaded BSC.
Prior to the implementation of the BSC, Crosshouse’s evaluating centers would conduct
strategic evaluations on the operating units, which required large volumes of data be
provided. After their BSC implementation and use, the amount of routinely demanded
information by the evaluating centers greatly decreased. They were now simply able to
29

review the always-available performance measures, and if data were outside of limits,
they would inquire as to why. (Lawrie et al., 2001)
In summary, cascading scorecards down to the team and even the individual level
provides employees the understanding as to the critical nature of their contributions
towards the company’s strategic vision. Furthermore, this understanding could even
encourage employees to develop personalized measures to assist the company in
achieving their strategy. Without establishing goals, even at the lowest levels, companies
could fail to reach their potential.
Summary
This literature review provided an overview of the BSC and identified 11 keys for
its success, Table 1. These finding are also reflected in Table 2. In Table 2, all case
studies that contributed to one or more keys to successful BSC implementation and use
are listed and the topic(s) addressed within them annoted by an “X.” Understanding the
BSC and its key areas to successful implementation and use are critical in developing or
evaluating a company’s BSC. Specifically, these keys and their information were
collected and used to evaluate AFMC’s BSC. This is accomplished in the analysis
chapter by defining and analyzing AFMC’s BSC specifics within each of these keys.
30

31
Table 2: Meta-Synthesis Results
Dep
loy
BSC
from
the
Top
Dow
nEs
tabl
ish B
SC F
ram
ewor
kSt
anda
rdiz
e W
ithin
the B
SC--b
ut D
o N
ot S
tand
ardi
ze C
onte
nt
Sele
ct th
e Ri
ght O
bjec
tives
and
Perfo
rman
ce M
easu
res
Qua
ntify
Obj
ectiv
es o
r The
ir Pe
rform
ance
Mea
sure
s
Ensu
re O
bjec
tives
Pre
sent
a C
ausa
l Pat
tern
Impl
emen
t Stra
tegy
Map
sSe
lect
Sof
twar
e to
Hel
p--N
ot H
inde
rSe
lect
BSC
Goa
ls an
d Ti
mel
ines
for T
heir
Com
plet
ion
Sim
plify
Man
agem
ent S
yste
ms-
-Do
Not
Just
Add
To
Exis
ting
Fram
ewor
k
Casc
ade
the
BSC
(2GC Active Management, 2006) X X X(Active Strategy, 2007a) X X X(Active Strategy, 2007b) X X X X X(Antarkar et al., 2001) X X X X(Building and implementing a balanc X X X X X X(Cardemil-Katunaric & Shadbolt) X X X(Chen & Chou) X X X X(Cobbold & 2GC Active Managemen X X X(Cuganesan et al., 2006) X X X X X X X X(Excitant, 2005a) X X X(Excitant, 2005b) X(Lawrie et al., 2001) X X X X X X(Malina & Selto, 2001) X X(Mooraj, Oyon, & Hostettler, 1999) X X X(Neely, 2007) X(Niven, 2006a) X(Othman, 2006) X X X(Paladino, Jul 2007) X X X X X(Schneiderman, 1999) X X X X(Stephen, 2006) X X X X X(Strategy execution and alignment. 20 X X X X(Weinstein & Castellano, 2004) X X

III. Methodology
Chapter Overview
This chapter expounds on the methodology used to guide this study. Meta-
synthesis and historical methodologies are employed to research and analyze qualitative
Balanced Scorecard (BSC) data. First, this chapter explains the meta-synthesis of
qualitative case studies which was completed to synthesize results across numerous case
studies on BSC implementation and use. The purpose of performing a meta-synthesis
was to identify and develop the list of key areas to BSC implementation and use; this list
was discussed under the literature review and was a needed element which provided a
baseline for later comparison. Secondly this chapter explains the selection of the
historical methodology, which was applied to collect information on Air Force Materiel
Command’s (AFMC) implementation and use of the BSC. The findings uncovered by
these two methodologies paved the way for an analysis of AFMC’s BSC.
Qualitative Approach
Although research can utilize combined paradigm designs, Creswell (2003)
recommends “having only a single research paradigm for the overall design of the study.”
Appropriately, and fittingly considering that analysis of quantitative data is not performed
within this research, a qualitative paradigm was selected for this research’s overall design
of study. Furthermore, Creswell writes that “in a qualitative methodology inductive logic
prevails and that “this emergence provides rich context-bound information leading to
patterns or theories that help explain a phenomenon” (Creswell, 2003). This research did
32

indeed follow Creswell’s advice and provided patterns in the form of keys to BSC
implementation and use as well as a history of AFMC’s BSC implementation and usage.
The readers must also familiarize themselves with a qualitative researcher’s
reality. Creswell comments that “for the qualitative researcher, the only reality is that
constructed by the individuals involved in the research situation” versus quantitative
research where the “researcher views reality as objective and independent of the
researcher” (Creswell, 2003). As a result, findings and analyses are based primarily on a
methodical research design to promote authenticity and validity but the amount of
experience and perception of the researcher are non-excludable factors.
Investigative Question One
What are the key areas of a BSC an organization must address and succeed
in to optimize its use?
This investigative question is the foundation of this research. Through
identification and understanding of the keys to successful BSC implementation and use,
the second investigative question of “How does AFMC’s implementation and use of the
BSC align with what the literature indicates is needed to obtain maximum results?” can
be answered. In order to answer this first investigative question, a meta-synthesis
methodology is employed.
Meta-Synthesis
Defined
Meta-synthesis is the synthesis or aggregation of qualitative studies. In line with
Marshall and Rossman’s guidance from “Designing Qualitative Research,” the process of
33
meta-synthesis of qualitative data within this research was based on data reduction and
interpretation (Marshall and Rossman, 1989). This was accomplished by taking
“voluminous amounts of information and reducing it to certain patterns, categories, or
themes and then interpret this information by using some schema” (Creswell, 2003).
Data Reduction
Data were primarily collected in the format of case studies which evaluated a
company’s BSC implementation and use. Additionally, data provided through books and
articles were also included. Before data reduction commenced, inclusion criteria were
established to focus and guide research efforts.
To collect and reduce the scope of included case studies, it was necessary to
determined inclusion criteria. First, the inclusion criteria loosely stipulated that data were
collected through case studies which analyzed and provided results from a company’s
BSC implementation and use. Secondly, with the fairly new nature of the BSC concept,
no time stipulations were imposed--a lesson learned immediately following the BSC
conception would be just as important as a recent lesson learned. Finally, all case studies
that met the above inclusion criteria were included regardless of geographic region in
which studied organizations resided.
Advice and guidance published through numerous books and articles from the
BSC originators and associates was also utilized only if it met the following inclusion
criteria. Inclusion of books and articles were utilized only when the author’s research
was supported through case studies. Identifying case studies which validated the author’s
34

advice and guidance proved to be a simple task since the format for their publications
were merely an expansion of lessons learned throughout BSC implementation and use.
Once the above inclusion criteria on case studies, books and articles had been
established for data collection, the author followed Tesch’s eight steps for developing an
organizing system for unstructured qualitative data.
Interpretation
Renata Tesch (1990) provides eight steps for developing an organizing system for
unstructured qualitative data in her book “Qualitative Research: Analysis Types and
Software Tools.” She wrote that “since qualitative research is inductive, the data
themselves remain the most suitable and richest source for the development of an
organizing system.” By following Tesch’s eight steps outlined below, categories for
successful BSC implementation and use were outlined and were thereafter referred to as
“keys to successful BSC implementation and use.” These keys provided a baseline for
this research’s analyses between AFMC’s BSC implementation and use and the
literatures’ BSC implementation and use.
1. First, get a sense of the whole.
2. Pick a document and make notes of the topics within it--not content.
3. Complete step two for three to five sets of data and make a list of all topics.
4. Take the list and return to remaining data. Abbreviate the topics as codes and write
the codes next to the appropriate segments of the text. Try out this preliminary
organizing scheme to see whether new categories and codes emerge.
35

5. Find the most descriptive wording for your topics and turn them into categories. Look
for reducing your total list of categories by grouping topics that relate to each other.
Perhaps draw lines between your categories to show interrelationships.
6. Make a final decision on the abbreviation for each category and alphabetize these
codes.
7. Assemble the data material belonging to each category in one place and perform a
preliminary analysis.
8. If necessary, recode your existing data. (Tesch, 1990)
1. First, get a sense of the whole.
This step to get a sense of the whole was designed to provide the necessary
background information in the subject area (Tesch, 1990). To accomplish this step,
Kaplan, Norton and Niven’s books which explained and advised on BSC performance
management and strategic leadership framework were read and understood. These books
were The Balanced Scorecard: Translating Strategy into Action, The Strategy Focused
Organization, Strategy Maps, Alignment, and Balanced Scorecard: Step-by-Step for
Government and Nonprofit Agencies.
This research’s main focus was to evaluate AFMC’s BSC implementation and
utilization. Before that could be completed, first the BSC framework needed understood.
Understanding the BSC framework permitted further research into understanding the
BSC’s key areas for successful implementation and use, which in-turn was used to
compare and analyze AFMC’s BSC.
36

2. Pick a document and make notes of the topics within it--not content.
Tesch emphasized that during this step of picking a document and making notes
of the topics within it to not pay attention to what is said—to address the substance of the
article later in the process. She also added that the researcher should not feel a
compulsion to capture everything at this stage. Finally, she advised that when a
researcher identifies a topic they should write it in the margins of the document. (Tesch,
1990)
Out of the available case studies collected up until this point, one study conducted
by 2GC Active Management titled “Implementing the Balanced Scorecard—Lessons and
Insights from a Financial Services Firm” appeared to readily associate with Tesch’s
second step by already categorizing and titling the different lessons learned. This
categorized and titled structure facilitated easy understanding and differentiation between
the analyzed BSC topics. To conclude this step, this case study was reviewed and notes
were taken to identify the author’s topics of importance when implementing and using a
BSC.
37

3. Complete step two for three to five sets of data and make a list of all topics.
In this step, Tesch explains to continue making notes of the topics located within
three to five sets of additional data (case studies). After notes have been taken of these
additional studies’ topics, Tesch advises on how to organize this newfound qualitative
data. She advises to drawn lines between similar topics, cluster the similar topics on a
separate piece of paper, and select the best fitting name for the cluster of topics or invent
a new one that better captures the substance of the group. (Tesch, 1990)
The case studies reviewed in this step were “Implementing the Balanced
Scorecard—Lessons and Insights from a Multi-Divisional Oil Company,” “Building and
Implementing a Balanced Scorecard—Case Study: UNUM Corporation,” and “Driving
Strategic Transformation and Embedding Accountability at Tri-Health, Inc.” Upon
completing reviews of these case studies and noting the topics, lines were drawn
connecting associated or similar topics. Then, these topics were clustered and an
overarching word or theme for the clustered topics was assigned. These overarching
words or themes started to form a list of the critical areas a company should focus on
when implementing and using a BSC.
4. Take the list and return to remaining data.
Tesch continues her eight step process by indicating that in this step the
researcher should abbreviate the topics as codes and write the codes next to the
appropriate segments of the text. Then, try out the preliminary organizing scheme to see
38

whether new categories and codes emerge (Tesch, 1990). Abiding by this step’s
direction, these remaining documents were coded:
• “Organisational Performance Management in a UK Insurance Firm: Aligning Individual’s Goals with the Business Strategy”
• “A BSC Framework for Air Cargo Terminal Design: Procedure and Case Study” • “Using Strategy Maps and the Balanced Scorecard Effectively: The Case of
Manpower Australia” • “Miami-Dade County: Becoming a Results-Oriented Government with Active
Strategy Enterprise™” • “The Balanced Scorecard as a spontaneous framework in an agricultural hybrid
cooperative under strategic change: A case study in the New Zealand kiwifruit industry”
• “Strategic Alignment: Cascading the Balanced Scorecard in a Multi-National Company”
• “Strategy Execution and Alignment” • “Communicating and Controlling Strategy: An Empirical Study of the
Effectiveness of The Balanced Scorecard” • “Why Balanced Scorecards Fail” • “Communicating and Controlling Strategy: An Empirical Study of the
Effectiveness of the Balanced Scorecard” • “5 Key Principles of Corporate Performance Management” • “The Balanced Scorecard: a Necessary Good or an Unnecessary Evil?” • “Balanced Scorecard and Causal Model Development: Preliminary Findings” • “Beating the Balanced Scorecard Blues” • “Scorecard Support” • “The Search for Meaningful Measures” • “Strategy Only Sticks if You Have Active Support and Involvement from the
Top…and Follow Through” • “The Case for Balanced, Structured, Performance Management. What difference
can it make to an organisation?” • “The Importance of Terminology to your Balanced Scorecard” • “Training for Balanced Scorecard Success”
5. Find the most descriptive wording for your topics and turn them into categories.
This step, while potentially applicable in other research efforts where further
refinement of an organization system may be needed, was not applied here. The reason
39

descriptive words were not found for topics and turned into categories is because this
would have been a duplication of step three.
6. Make a final decision on the abbreviation for each category and alphabetize these
codes.
Tesch explains that alphabetizing codes ensures duplication of codes has not
taken place (Tesch, 1990). Alphabetization and review of codes generated under step
three showed that the categorical list or codes were not duplicated.
7. Assemble the data material belonging to each category in one place and perform a
preliminary analysis.
In this step, Tesch recommends to assemble the data material belonging to each
category in one place and perform a preliminary analysis. Furthermore, Tesch advises to
look for “a) commonalities in content, b) uniqueness in content, c) confusions and
contradictions in content, and d) missing information with regard to the research
question/topic.” (Tesch, 1990)
This step was completed by first separating material according to topics. Then,
each group of material was carefully reviewed to understand the content of the topic and
noting commonalities, uniqueness and confusions or contradictions. This step provided
in-depth information on each key area to successfully implement and use the BSC.
40

8. If necessary, recode your existing data.
This step was not necessary for this research. Similar to the decision under step
five above, the need to recode data was unnecessary. All data was already organized,
coded and analyzed. No further research was warranted to provide greater understanding.
The result once Tesch’s eight steps were completed was the list of keys to
successful BSC implementation and use. This research, which rendered these keys,
answered investigative question one, “What are the key areas of a BSC an organization
must address and succeed in to optimize its use?”
Validation
Qualitative analysis contains questions of feasibility, validity, study selection,
mechanism and interpretation. To combat these issues, keys were only identified as keys
upon finding confirming evidence from multiple sources through multiple researchers.
Dr. James Banning (2001) describes that the act “of looking at phenomenon from a
variety of vantage points” improves the validity of a researcher’s findings. Simply stated,
a key to successful BSC implementation and use did not become a key unless it was
supported by more than one document. To review a summary of these findings, please
refer back to Table 2.
41

Investigative Question Two
“How does AFMC’s implementation and use of the BSC align with what the
literature indicates is needed to obtain optimal results?”
Robert K. Yin (2003) in his book “Case Study Research Design and Methods,”
guides researchers in selecting an appropriate methodology for conducting research.
Specifically, he explained that a historical methodology can be appropriate for answering
“how” or “why” questions, when the researcher has little control over behavioral events
and the degree of focus is on historical events as opposed to contemporary. This section
will show through Yin’s three steps how an historical methodology was deemed
appropriate to answer this research question. Specifically, this section explains the
answers to Yin’s three steps’ questions which were: the second investigative question
proposed is a “how” question; there is little control over behavioral events; and the
degree of focus is on historical events. Upon completing Yin’s three steps and
understanding an historical approach was appropriate, it was applied to help answer this
second investigative question.
Historical
Selection
Historical research, a process to learn and understand the background and growth
of a chosen field of study, offers insight into organizational culture and operation. Yin
outlines when researchers could select the historical methodology through three
conditions:
42

1) Type of research question posed
2) Extent of control an investigator has over actual events
3) The degree of focus on contemporary as opposed to historical events (Yin, 1994)
1. Type of research question posed
Yin’s first condition answered in order to select a proper research methodology
addressed the structure of the research question. To aid in this selection, Yin developed a
basic categorization scheme which consists of the series: “who,” “what,” “where,”
“how,” and “why.” Furthermore, Yin’s table, Table 3, displays this series and shows
how it relates to the five research strategies: experiments, surveys, archival analyses,
histories, and case studies.
43

Table 3: Relevant Situations for Different Research Strategies
(Yin, 1994)
Yin further explained the relationships amongst the methods and conditions in his book.
However, the relevant information extrapolated from his explanation which pertains to
this research is that, ““how” or “why” questions are likely to favor the use of case studies,
experiments or histories.” (Yin, 1994)
The second investigative question to be answered was a “how” question. When a
“how” question is to be answered, Yin’s three-step process narrows down potential
research approaches to case study, experiment or historical. To further delineate between
these three approaches, the extent of control required over actual events should be
identified.
2. Extent of control an investigator has over actual events
Since the second investigative question contains a “how” differentiator, the next
step was to evaluate the amount of control required on actual events. If control over
44

actual events is not needed, the researcher should turn their focus to either the case study
or historical research designs.
This step further delineated between the following potential research methods
narrowed down under step one above: case studies, experiments or historical. Since there
was no need to control actual events in order to answer this investigative question, the
experimental methodology was eliminated leaving historical and case study
methodologies as the two remaining potential approaches for this question. In order to
isolate the appropriate research method, the last condition answered was the degree of the
focus on contemporary as opposed to historical events.
3. The degree of focus on contemporary as opposed to historical events
Finally, Yin differentiated between the case study and historical research
approaches. He explained that the historical research is optimal when a researcher “must
rely on primary documents, secondary documents, and cultural and physical artifacts as
the main sources of evidence” (Yin, 1994).
To answer this investigative question, documents were the sole source of
information. The types and details of these documents are outlined under Busha and
Harter’s second of six steps below. Sponsorship was in place to provide documents and
provide slight guidance when needed; however, interviews were not conducted to
eliminate potential bias and no other forms of data were collected. Since this research
focused almost completely on historical events, the historical approach was deemed
appropriate.
45

The answers to Yin’s three steps’ were: the second investigative question
proposed is a “how” question; there is little control over behavioral events; and the
degree of focus is on historical events. Through progression of these answers, Yin’s
steps narrowed down the appropriate research methodology to historical. Consequently,
the historical approach was then applied to help answer this second investigative
question.
Historical Research Application
The historical approach to answer the second investigative question was applied
by following Charles Busha and Stephen Harter’s six steps for conducting historical
research noted in their book Research Methods in Librarianship: Techniques and
Interpretation (Busha and Harter, 1980). By following Busha and Harter’s steps, listed
below, information was gathered and evaluations were made of AFMC’s BSC
implementation and use.
1) Recognize an historical problem or identify a need for certain historical knowledge.
2) Gather as much relevant information about the problem or topic as possible.
3) If appropriate, form a hypothesis that tentatively explains the relationships between
historical factors.
4) Organize the evidence and then verify the authenticity and veracity of information and
its sources.
46

5) Select, organize and analyze the most pertinent collected evidence and draw
conclusions.
6) Record the conclusions in a meaningful narrative. (Busha and Harter, 1980)
1) Recognize an historical problem or identify a need for certain historical knowledge.
First, the need for historical information in order to answer the second
investigative question of “How does AFMC’s implementation and use of the BSC align
with what the literature indicates is needed to obtain optimal results?” was identified. In
order to answer this question, historical documents of AFMC’s BSC implementation and
use were needed to first understand AFMC’s BSC specifics within each key.
2) Gather as much relevant information about the problem or topic as possible.
An abundance of information was collected on AFMC’s BSC, spanning from
2001 to 2007, from two major sources: 554 ELSG/SBI office and AFMC Strategy
webpage. The 554 ELSG/SBI office, which monitored and managed the BSC software
system, provided all the information ever collected on the implementation and use of
AFMC’s BSC. Secondly, information was gathered from AFMC’s webpage which, once
approved access, provides viewers current information on the command’s strategy.
Together, information was collected primarily in these formats: presentations, meeting
minutes, governance and guidance.
47
3) If appropriate, form a hypothesis that tentatively explains the relationships between
historical factors.
Since this research did not focus on relationships between the historical factors,
this step to generate a hypothesis was not deemed appropriate. However, this research
would fail to reject the hypothesis that a not for-profit organization could utilize the
BSC—which was initially developed for-profit organizations.
4) Organize the evidence and then verify the authenticity and veracity of information and
its sources.
The abundance of information on AFMC’s BSC was organized chronologically to
evaluate is implementation and use. The authenticity of this information was never
questioned and assumed to be valid, as it was always in the form of military briefings,
planning documents, etc. of an official capacity.
5) Select, organize and analyze the most pertinent collected evidence and draw
conclusions.
The most pertinent information was selected, organized and analyzed to identify
the specifics of AFMC’s BSC within the key areas of successful implementation and use.
This entailed focusing on the BSC implementation and utilization data and dismissing
irrelevant data such as contracting information, IT system technical specifications, etc.
The massive abundance of data required two reviews, once upon initial collection and
again prior to analysis. The data was then organized into the 11 categories of successful
48

49
BSC implementation and use identified in the literature review. Finally, the specifics of
AFMCs BSC within each of these categories were understood and analyzed against
finding from the qualitative meta-synthesis.
6) Record the conclusions in a meaningful narrative. (Busha and Harter, 1980)
Finally, perceived differences were noted and listed under areas for
recommendation. These recommendations provided the specific areas AFMC should
focus on for BSC improvement, if they have yet to be completed.
Summary
This chapter explained the methodical approach taken to answer this research’s
investigative questions. The meta-synthesis methodology approach was employed to
derive the list of keys to successful BSC implementation and use outlined in the literature
review chapter to answer the first investigative question. An historical methodology was
the approach taken to collect and analyze AFMC’s historical documentation in order to
understand and note the specific areas of AFMC’s BSC. Ultimately, AFMC’s BSC
specifics were compared against the literature to answer the second investigative
question.

IV. Analysis and Results
Chapter Overview
In this chapter, analyses and results of the investigative questions are provided.
First, investigative question one is addressed and its importance in answering
investigative question two is identified. The remainder of the chapter extensively
addressed investigative question two. This was accomplish by providing specifics of
AFMC’s scorecard within each key to successful BSC implementation and use,
comparing those specifics with the findings from investigative question one, and
providing analyses.
Investigative Question One
“What are the key business processes an organization must address and succeed in to
successfully implement a BSC?”
This question was answered by applying a meta-synthesis approach in researching
the literature. The findings from this research established a baseline of 11 keys to
successful BSC implementation and use illustrated in Table 4 below, which were
extensively discussed under the literature review. That baseline provided the framework
for which to identify and contrast the key areas of AFMC’s BSC in order to answer
investigative question two.
50

Table 4: Keys to Successful BSC Implementation and Use Implementation
Order1 1 Deploy BSC from the Top Down2 2 Establish BSC Framework3 3 Standardize Within the BSC--but Do Not Standardize Content
4 Select the Right Objectives and Performance Measures5 Quantify Objectives or Their Performance Measures6 Ensure Objectives Present a Causal Pattern7 Implement Strategy Maps
5 8 Select Software to Help--Not Hinder6 9 Select BSC Goals and Timelines for Their Completion7 10 Simplify Management Systems--Do Not Just Add To Existing Framework8 11 Cascade the BSC
Key to Successful BSC Implementation and Use
4
Investigative Question Two
“How does AFMC’s implementation and use of the BSC align with what the
literature indicates is needed to obtain optimal results?”
In order to answer this question, an analysis of AFMC’s BSC implementation and
use was completed. In this analysis, the 11 keys identified as critical to successful BSC
implementation and use were taken and, in succession and separately, used to identify
and analyze AFMC’s specifics within each key. AFMC’s implementation within each
key as compared to the literature was then rated as having a low, medium or high
implementation level. A low level was assigned if AFMC missed a critical area within a
key. A medium level was assigned if AFMC met the basic intent of the key. And a high
rating was assigned if AFMC fully met a key’s intent. This rating is shown in the Table 5
and is further explained within each key’s section.
51

Table 5: Rating Summary
Key to Successful BSC Implementation and Use RatingDeploy BSC from the Top Down Low
Establish BSC Framework HighStandardize Within the BSC--but Do Not Standardize Content Medium
Select the Right Objectives and Performance Measures MediumQuantify Objectives or Their Performance Measures Medium
Ensure Objectives Present a Causal Pattern LowImplement Strategy Maps High
Select Software to Help--Not Hinder HighSelect BSC Goals and Timelines for Their Completion Medium
Simplify Management Systems--Do Not Just Add To Existing Framework MediumCascade the BSC Low
1 and 11. Deploy and Cascade the BSC from the Top Down
The literature indicated that BSCs should be deployed from the top-down for two
main reasons. The first reason is to gather the management’s consensus of the strategic
goal, objectives and their measures. Secondly, to receive support and financial backing
that accompanies top-level involvement. Furthermore, top-down deployment can take
two forms: governance and cascaded BSCs. Therefore, both of these keys to successful
BSC implementation and use are discussed within this section: BSCs should be deployed
from the top-down and should be cascaded. As noted previously by Niven, it is critical
for organizations to cascade scorecards in order to create a two-way flow of information,
increase organizational visibility and provide “...real-time data for decision making,
resource allocation, and most importantly, strategic learning” (P. R. Niven, 2003).
This research identified the top of AFMC’s corporation as the President--our
Commander and Chief--and his Secretary of Defense. Therefore, the question answered
in this section is: Was the BSC deployed and cascaded from the President and Defense
52

Secretary level? Consequently, a low rating in this key is given to the DoD as a whole—
not solely to AFMC—because the BSC was neither deployed nor cascaded from the top
of the DoD by way of the Office of Secretary of Defense’s (OSDs) BSC. It was,
however, deployed from the top of AFMC and cascaded down to the center levels but
research failed to show further deployment or cascadement down to team or individual
levels.
Overview
Throughout the remainder of this section, the specifics of AFMC’s
implementation within keys one and eleven are discussed and analyzed. First, a figure
representing different levels of scorecards and guidance is presented. Then, the different
levels are explained. Finally, an analysis is provided.
Levels of Scorecards and Guidance
By combining governance, timelines and various BSCs, a possible top-down
involvement hierarchy integrated with cascaded BSCs is illustrated in Figure 4. As
reflected in this figure, the driving force behind performance management started in 1993
with the Government Performance and Results Act (GPRA) (United States Congress,
1993). In the 2001 President’s Management Agenda (PMA), the progress of performance
measurement implementation and use within the government was assessed, and deemed
unsatisfactory (Executive Office of the President and Office of Management and Budget,
2001). Shortly thereafter, AFMC immediately started their campaign with the BSC, and
when they felt the timing was right, cascaded it down to their centers. Lastly, in close
succession between 2002 and 2003, three governance documents titled management
53
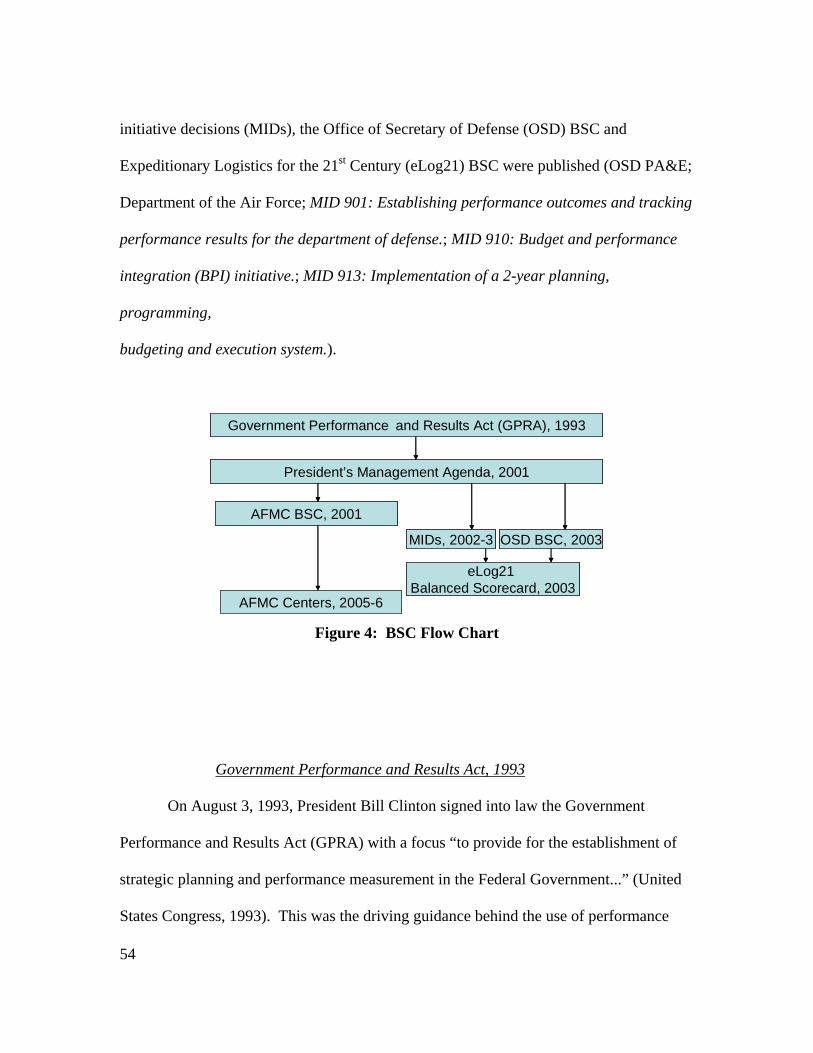
initiative decisions (MIDs), the Office of Secretary of Defense (OSD) BSC and
Expeditionary Logistics for the 21st Century (eLog21) BSC were published (OSD PA&E;
Department of the Air Force; MID 901: Establishing performance outcomes and tracking
performance results for the department of defense.; MID 910: Budget and performance
integration (BPI) initiative.; MID 913: Implementation of a 2-year planning,
programming,
budgeting and execution system.).
Government Performance and Results Act (GPRA), 1993
MIDs, 2002-3
President’s Management Agenda, 2001
OSD BSC, 2003
AFMC BSC, 2001
eLog21 Balanced Scorecard, 2003
AFMC Centers, 2005-6
Government Performance and Results Act (GPRA), 1993
MIDs, 2002-3
President’s Management Agenda, 2001
OSD BSC, 2003
AFMC BSC, 2001
eLog21 Balanced Scorecard, 2003
AFMC Centers, 2005-6 Figure 4: BSC Flow Chart
Government Performance and Results Act, 1993
On August 3, 1993, President Bill Clinton signed into law the Government
Performance and Results Act (GPRA) with a focus “to provide for the establishment of
strategic planning and performance measurement in the Federal Government...” (United
States Congress, 1993). This was the driving guidance behind the use of performance
54

management and could be categorized as top-down performance management
deployment, albeit not specifically BSC deployment.
President’s Management Agenda
President George W. Bush, in his 2001 President’s Management Agenda (PMA),
formally labeled our government as one that fails to finish grand plans and aimed to
rectify this mindset and practice. Specifically, he stated:
Government likes to begin things—to declare grand new programs and causes. But good beginnings are not the measure of success. What matters in the end is completion. Performance. Results. Not just making promises, but making good on promises. In my Administration, that will be the standard from the farthest regional office of government to the highest office in the land. (Executive Office of the President and Office of Management and Budget, 2001)
Additionally, he expounded stating:
New programs are frequently created with little review or assessment of the already-existing programs to address the same perceived problem. Over time, numerous programs with overlapping missions and competing agendas grow up alongside one another—wasting money and baffling citizens. (Executive Office of the President and Office of Management and Budget, 2001)
President Bush intended to address government’s reform through the
implementation of five government-wide management initiatives and nine agency-
specific reforms. Of the five government-wide management initiatives, one was
“Budgeted and Performance Integration.” (Executive Office of the President and Office
of Management and Budget, 2001) Under this initiative, seven convincing problem
bullets are listed--one of which stated that after the enactment of GPRA “progress
towards the use of performance information for program management has been
discouraging.” Consequently, the budget and performance integration initiative focus
55

was to “formally integrate performance review with budget decisions.” (Executive
Office of the President and Office of Management and Budget, 2001)
Air Force Materiel Command’s BSC
The requirement for AFMC to “develop [a] plan for [an] executive management
system” was briefed in August of 2001 and was presumably driven from the 2001 PMA
(HQ AFMC/XP Deputy, 2001). AFMC immediately responded to this directive and
developed the first version of their BSC. AFMC should be applauded for their
responsive change management. Unfortunately, their quick implementation made them a
pioneer in BSC implementation within the DoD, and because of such, they were unable
to align it to the higher levels within the corporation—such as OSD and AF—because
those levels had yet to develop BSCs. AFMC did, however, cascade their scorecard
down to their centers but research failed to show cascadement down to the team or
individual level.
Secretary of Defense Balanced Scorecard
The OSD did not develop a BSC until 2003—two years after AFMC’s BSC
implementation. Because this scorecard was developed after AFMC’s BSC, the two were
not linked. Additionally, the OSD did not cascade any scorecards. In a Balanced
Scorecard Interest Group, the OSD acknowledged that military services were already
utilizing the BSC but stated that the OSD BSC was differentiated through further
strategic reach (Scala and Office of Secretary of Defense, 2003). It appears the OSD
used this reasoning to avoid or explain the lack of cascaded scorecards.
56

Management Initiative Decisions
In response to the President’s Management Agenda (PMA), management
initiative decisions (MID) 901, 910 and 913 were created in concert with the OSD BSC
(MID 901: Establishing performance outcomes and tracking performance results for the
department of defense.; MID 910: Budget and performance integration (BPI) initiative.;
MID 913: Implementation of a 2-year planning, programming, budgeting and execution
system.). These MIDs were part of the BSC key, top-down level deployment, albeit once
again not specifically for the BSC but for performance management.
These MIDs were illustrated in the January 2004 Air Force Effects Management
Program (AFEMP) Primer presentation (HQ USAF/DPM, 2004). The goals of these
initiatives were to “establish performance outcomes and tracking performance results for
the DoD, implement the budget and performance integration initiative, and implement a
two year planning, programming and execution process.” (HQ USAF/DPM, 2004)
These three MIDs provided guidance initiatives within the DoD. MID 901 “assigned
responsibility for OSD performance measurement collection...” which in-turn required
each service to use a performance measurement system. Under MID 910, the AF
established a plan to obtain 100 percent integration between performance measures and
budget. Finally, MID 913 guided “the department’s strategy development, identification
of needs for military capabilities, program planning, resource estimation and allocation,
and other decision processes.” (HQ USAF/DPM, 2004).
57

Air Force Balanced Scorecard
To comply with the literature, the OSD BSC should cascade down to the next
level within the corporation—the military branches. Through review of the historical
data, it is unclear whether the OSD BSC was cascaded down to the AF in an AF BSC and
whether that AF BSC was then cascaded down to an AF Logistics BSC, whether two
BSCs within the AF were developed independent of the OSD BSC and each other, or
whether the first AF BSC was merely a proposed scorecard whereas the AF Logistics
BSC was operational. The historical documents only revealed that the AF BSC was a
proposed idea, whereas the second scorecard discussed here—AF Logistics BSC—
showed as being implemented. It was concluded that the OSD BSC did not cascade
down to an AF BSC and the AF Logistics BSC was developed independent of any other
scorecards. Consequently, these scorecards were identified as not cascaded or
aligned/linked.
The first scorecard, AF BSC, was presented during the AFEMP Primer (HQ
Department of the Air Force /DPM, 2004). There was not much information surrounding
this scorecard. The only available information was from a strategy map figure, which
showed a possible link between it and the OSD’s BSC through use of the same four OSD
perspectives. Once again, however, no further documentation was found on this
scorecard, and it was concluded to only be a proposed scorecard that never undertook
further development.
58
A second BSC, the AF Logistics BSC, was also identified. This scorecard did not
have any linking indicators to other scorecards and most likely was an independent
scorecard.
Analysis
The BSC key of top-down deployment was rated as low, because even though
top-down deployment appeared to be present in the guidance and direction of
performance management it did not directly support the implementation and use of a
BSC to conduct the required performance management. Without top-down BSC
deployment, the literature showed that corporations are exposed to a lack of financial and
resource BSC support and therefore may fail to get started or maintain. AFMC’s
responsibility to implement top-down deployment showed positive results in their
guidance and creation of center scorecards but research failed to show further
cascadement down to team or individual levels.
The BSC key of cascading scorecards was also rated low because the data showed
that BSCs were established at different levels within the hierarchy but were not always
aligned (linked). Through review of the data, it was shown that the top of the
corporation--the OSD’s BSC--was developed after AFMC’s BSC. Therefore, the two
were not engineered to align and research failed to show any attempts to link the two.
After the AFMC BSC and OSD BSC were developed, the AF BSC and AF Logistics
BSC were discussed. It appears the AF BSC was never implemented and the link
between the OSD’s BSC and the AF Logistics BSC was not visible, if even present.
59

AFMC, however, did cascade their scorecard down to the center levels but further
cascading was uncertain.
The absence of links between BSCs reflects a potential lack of strategic
alignment. Utilizing the BSC throughout the DoD could prove beneficial; however,
without alignment of linked scorecards throughout the entire corporation (from our
President down to team and individual scorecards), integration of strategic goals and
objectives may be misaligned or demands for excess resources required. The overall
misalignment of the BSC throughout the DoD should not ultimately be the responsibility
of AFMC; however, if AFMC has failed to attempt to rectify this misalignment or has
failed to cascade their BSC and align their strategic goals down to the team and
individual levels, then an opportunity exists to further optimize their BSC in these areas.
2. Establish Balanced Scorecard Framework
Implementing a BSC can be an intensive, slow process and therefore requires a
BSC framework. A BSC framework could include infrastructure, governance and
processes. AFMC was rated high in the implementation of this key, because the research
showed that they were successful in implementing and using a BSC framework.
Overview
In this section, the details of AFMC’s framework are provided. Initially, the
infrastructure of the BSC framework and its involvement in the BSC are discussed.
Then, some of AFMC’s governance, review processes and procedures are reviewed.
Finally, an analysis of this key is provided.
60

Infrastructure
The first reason AFMC was given a high rating in key was because they
developed a BSC infrastructure, which is visually represented in illustration Figure 5
(AFMC, 2007b). This infrastructure proved critical to continuous improvement and
management of their BSC. While all the players identified in this infrastructure definitely
contributed to AFMC’s BSC, some of the most visible players were the AFMC
Command Strategy Review (CSR) and the Executive Steering Group (ESG). Throughout
AFMC’s BSC use, historical documents reflected repetitive meetings and operations of
these groups. Furthermore, these groups discussed new and existing objectives,
measures, initiatives and processes--just to name a few of their responsibilities.
Governance, a relationship triad and the four areas to each objective were some of the
tools used by AFMC in BSC management.
61

CC• Sets strategic priorities• Provides direction and decisions on strategic issues
AFMC Command Strategy Review
• Council Membership• Oversees Strategic Performance• Challenges Progress and Results
Executive Steering Group • Oversees the strategy management process• Ensures Commander’s intent incorporated in
design and execution
Objective Owners • Define and recommend problems, measures and
initiatives to ESG and CSR• Oversee the execution of initiatives• Analyze and forecast performance against measures
Objective InitiativeProcess Teams
• Support ESG and Objective Owners with expertise and recommendations
Strategy Office • Facilitate the Balanced Scorecard process for strategy design and execution
(AFMC, 2007b)
Figure 5: AFMC's BSC Infrastructure
Governance
Another reason AFMC was rated high in this key was due to its governance
process. The military understands that governance is critical in change management and
implementing and using a BSC was no exception. In one of their briefings, they
introduced and defined governance as a leadership process to manage long-term
direction, establish responsibilities for strategic objectives, review strategic performance,
and revise priorities (HQ AFMC/XPX, 2005). Two of AFMC’s governance publications
are discussed here. First, command instruction AFMCI 90-104 titled “Implementing
Improvement and Change Initiatives: An Integrated AFSO21 and BSC Approach” was
published. This instruction’s purpose follows the title—it instructs a user on how to
62

implement improvement and change initiatives within an Air Force Special Operations
for the 21st Century (AFSO21) and BSC context. The second source of governance is an
AFMC strategy webpage. This webpage provides an interested reader the ability to
access information (once approved and using the required computer access card and
password) in the following AFMC strategic categories: training, objective, measure,
communication, governance, AFMC senior leader briefs, and meetings-groups. This
webpage’s information provides a reader the ability to not necessarily review the BSC
development but to understand the current BSC structure and surrounding
documentation.
Processes
A third reason AFMC scored high in this key’s implementation was because
processes were implemented to manage the BSC. In command strategy reviews (CSRs),
executive steering groups (ESGs) and similar working groups, a triad was utilized to
understand the relationship between objectives, measures and initiatives (AFMC). This
triad played a critical role in facilitating change and the working relationship of these
components can be viewed in Figure 6. In this AFMC change process, the first step
would be to establish an objective and assign a performance measure (metric). Then, a
target would be established and a gap analysis performed. Finally, initiatives would be
established in an attempt to close this gap. Through this cycle, managers could actively
focus on specific objectives and their performance measure(s) which were improved
through initiative management.
63
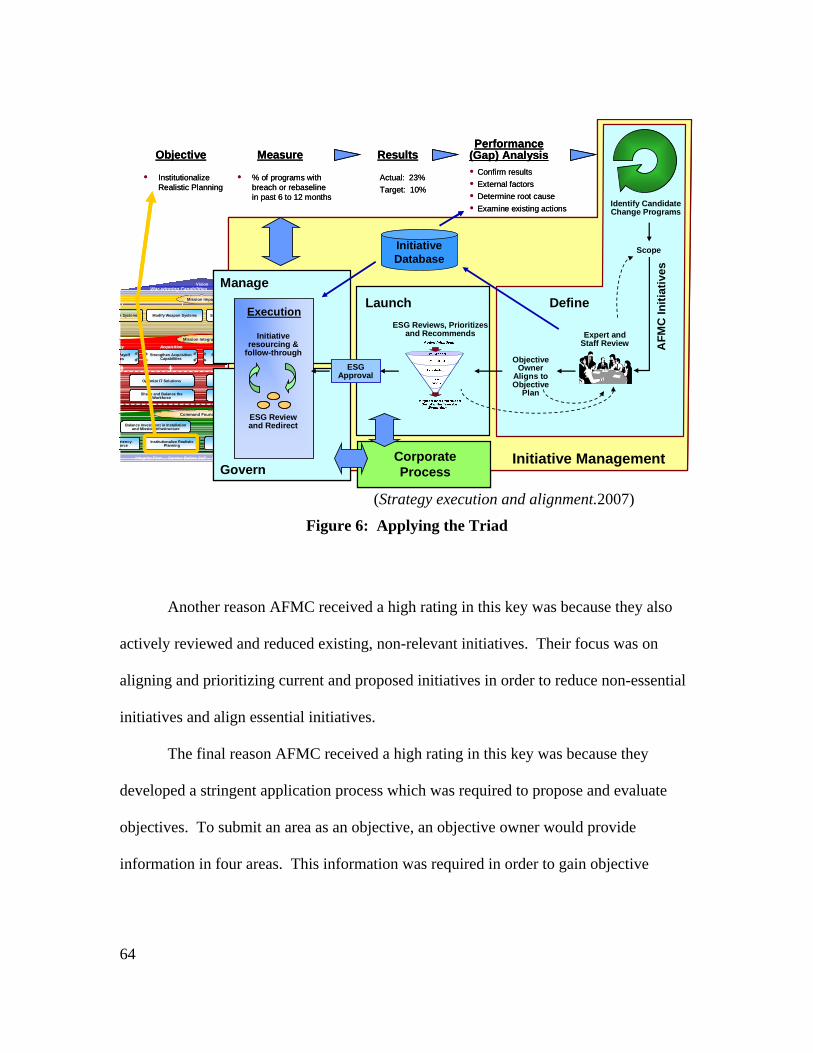
War-winning Capabilities… On TiVision
Integrity First … Service Before Self … Excelle
Balance Investment in Installation and Mission Infrastructure
Develoetency-orce
Pro
Institutionalize Realistic Planning
Strengthen Acquisition Capabilities
Payoff es
Provide Cap
Enhan
StrengShape and Balance the Workforce
Optimize IT Solutions
gygy AcquisitionAcquisition
Modify Weapon Systems Sustain Wn Systems
Mission ImpactMission Impact
Mission IntegrationMission Integration
Command FoundationCommand Foundation
Govern
Manage
ESG Approval
• % of programs with breach or rebaselinein past 6 to 12 months
Measure Results
Actual: 23%Target: 10%
Performance (Gap) Analysis• Confirm results• External factors• Determine root cause• Examine existing actions
AFM
C In
itiat
ives
Execution
Expert and Staff Review
ESG Reviews, Prioritizes and Recommends
• Institutionalize Realistic Planning
Objective
Initiative Database
Initiative resourcing &
follow-through
ESG Review and Redirect
Initiative Management
Launch
Identify Candidate Change Programs
Define
CorporateProcess
Scope
Objective Owner
Aligns to Objective
Plan
(Strategy execution and alignment.2007)
Figure 6: Applying the Triad Another reason AFMC received a high rating in this key was because they also
actively reviewed and reduced existing, non-relevant initiatives. Their focus was on
aligning and prioritizing current and proposed initiatives in order to reduce non-essential
initiatives and align essential initiatives.
The final reason AFMC received a high rating in this key was because they
developed a stringent application process which was required to propose and evaluate
objectives. To submit an area as an objective, an objective owner would provide
information in four areas. This information was required in order to gain objective
64

approval, place the objective on the strategy map, and evaluate it over time. These four
areas are as follows:
1) Fundamental Problem statement- In this step, the owner would describe the
fundamental problem that warranted inclusion into the strategy map in the form of an
objective. Specifically, this problem should reflect not inadequate processes, resources or
tools but reflect what the commander cannot do, does poorly or inadequately, or which
warrants leadership attention. An example of this step is illustrated in Figure 7. Under
the objective “create a wellness-focused and safe workforce,” the fundamental problem,
or the “overall problem [they] are trying to solve,” is a lack of adequate employee
wellness and safety culture.
Fundamental Problem“Overall Problem We Are Trying to Solve”
Nested Problems“Family of Related Problems”
Focus Areas“Drivers or Mechanics of the Problem”
Create a Wellness-Focused and Safe
Workforce • Fundamental Problem: Lack of an adequate employee wellness and safety culture: suboptimizes productivity -> suboptimizes mission impact
ProductivityImpact Effect
• Non-work related health issues
• Mishaps- Injured or loss
of personnel
• “Distractions”• “Disengagement”
- Employees dispassionate about work
- Morale
Absenteeism Presenteeism
(AFMC, 2006)
Figure 7: Fundamental Problem
65

2) Nested Problems- Under the second step, the owner identified three to five nested
problems, prioritized if possible, that underlie the fundamental problem. An example of
this is illustrated below containing four nested problems. These problems were also
referred to as the “family of related problems.”
Nested Problems:1. Workforce not sufficiently
driven toward wellness and safety
2. Supervisors/Commanders faced with conflicting requirements
- Encourage wellness- Achieve financial goals
3. Absenteeism (physically not present)
4. Presenteeism (physically present but distracted or not engaged)
Objective“Strategy Building Block”
Fundamental Problem“Overall Problem We Are Trying to Solve”
Nested Problems“Family of Related Problems”
Focus Areas“Drivers or Mechanics of the Problem”
Create a Wellness-Focused and Safe
Workforce
(AFMC, 2006)
Figure 8: Nested Problems 3) Focus Areas- To further decompose the nested problems, the owner would identify
the focus areas by identifying general problems and root causes that will closely align to
solutions. An example of this is illustrated below.
66

Objective“Strategy Building Block”
Fundamental Problem“Overall Problem We Are Trying to Solve”
Nested Problems“Family of Related Problems”
Focus Areas“Drivers or Mechanics of the Problem”
Create a Wellness-Focused and Safe
Workforce
Focus Area 1:- Failure to infuse safety and wellness into everyday activities and schedules- Dilution of wellness and safety emphasis down the chain -“Seasoned” workforce implementing shortcuts (safety)
- Familiarity encourages complacency
- Train junior workforce on shortcuts without appreciation for risks
- Supervisors do not always set right safety example-Supervisors not adequately coached to reinforce message of safety and wellness
-Goal: Reduce Safety Mishaps; improve productivity
(AFMC, 2006)
Figure 9: Focus Areas 4) Measures- Finally, the owner would list and attach the strategic measures which
reflected the performance of the proposed objective.
Analysis
This key appeared to be a strong suit for AFMC and not much, if any, could be
added to this already great program. The research showed that some of AFMC’s
framework appeared to match or surpass civilian companies’ infrastructure. In addition
to the highlights of AFMC’s active involvement discussed in this section, this framework
is the core of AFMC’s BSC and is integrated with almost all of the keys to successful
BSC implementation and use.
3. Standardize Within the BSC—but Do Not Standardize Content
Standardization, in areas such as vocabulary and approach, can increase
companies’ BSC effectiveness. Standardized BSC content, on the other hand, could
67
decrease its success. AFMC was given a medium level rating in this key. The reason
they received a medium rating was because they took several steps towards the positive
aspect of BSC standardization, but they missed the opportunity to standardize areas and
required standardized content within their cascaded scorecards.
Overview
This section reviews standardization within AFMC’s BSC. First, how AFMC
standardized the main BSC terms to increase communication but did not provide a
published standardized vocabulary listing is presented. Next, the benefit of AFMC’s
standardized BSC objective template is reviewed. Then, AFMC’s process for cascading
scorecards to their centers is applauded for standardizing the approach but questioned for
requiring standardized content. AFMC’s standardized measure definitions and charting
guidelines, which ensured appropriate data collection and efficient data reviews, are
discussed next. Finally, a standardized metric building process is covered, which ensured
approved metrics were built to the required standards and contained the required
information. In conclusion, an analysis is completed on this key to “standardize within
the BSC—but do not standardize content.”
Standardized Vocabulary
The literature showed that by utilizing a standardized vocabulary to define BSC
components, organizations can increase communication as well as understanding.
Although the historical research of AFMC failed to show any standardized AFMC
vocabulary publications or consolidated listings, a user could gather definitions of the
main BSC terms through other governance. For instance, the terms “fundamental
68

problem,” “nested problem” and “focus area,” were defined through a process
explanation, which can be seen through Figures 7-9 above. The fact that AFMC provided
definitions throughout different presentations and media most assuredly guided users;
however, a consolidated listing would provide a complete, one-stop-shop for
understanding their BSC vernacular.
Standardized Objective Template
Another positive implementation in this key was the development of a
standardized objective template (AFMC, 2005b). This template ensured all necessary
parameters of the AFMC BSC strategic objectives were identified and provided a
standard approach for new objective development. The parameters this template required
were frequency of update, measure, frequency of executive review, measurement intent,
units of measure, measurement definition and formula, next steps, assumptions,
comments, target setting approach, whether measurement information is available, data
elements and sources, and data and performance owners.
AFMC mandated the completion of this template for all objectives (AFMC,
2005b). This standardized requirement and approach for detailing future objectives and
their parameters enabled everyone involved to readily review an objective’s details and
understand its parameters as well as build an all encompassing objective.
Standardized BSC Cascadement
AFMC attempted to improve their BSC by developing a standardized approach to
cascading scorecards. While their standardized approach provided guidance and
facilitated completion of cascaded scorecards, it may have potentially eliminated these
69
benefits by requiring standardized content (AFMC, 2006a). Specifically, they instructed
the centers to use the same 10 objectives the command utilized for two out of the three
objectives and to individualize the remaining objective. There are two area of interest in
this approach: 1) Did the standardized approach facilitate development of cascaded
scorecards? 2) By requiring standardized content within these scorecards, did AFMC
reduce the optimality which could have been provided had the centers been given the
flexibility to further customize their scorecards? The historical research showed that
center scorecards were developed. Secondly, research was unable to identify the affect
the command’s requirement to standardize content had. This standardized content may
have had no adverse reactions to BSC optimization or perhaps it hampered potential
center productivity and buy-in by removing the opportunity for the centers to modify
their scorecards to best fit their needs.
Standardized Measure Definitions and Charting
AFMC published measure definitions to ensure appropriate data collection and
efficient data reviews (AFMC, 2007a). Leadership outlined measure definitions by
explaining eight relevant factors to a measure: actual, target (or standard), forecast, goal,
upper and lower bounds, variance and deviation. Additionally, an example of how to
standardize measures’ charting was provided, Figure 10. This publication mandated
charts to be of the same format across the command to create effective and efficient
review.
70
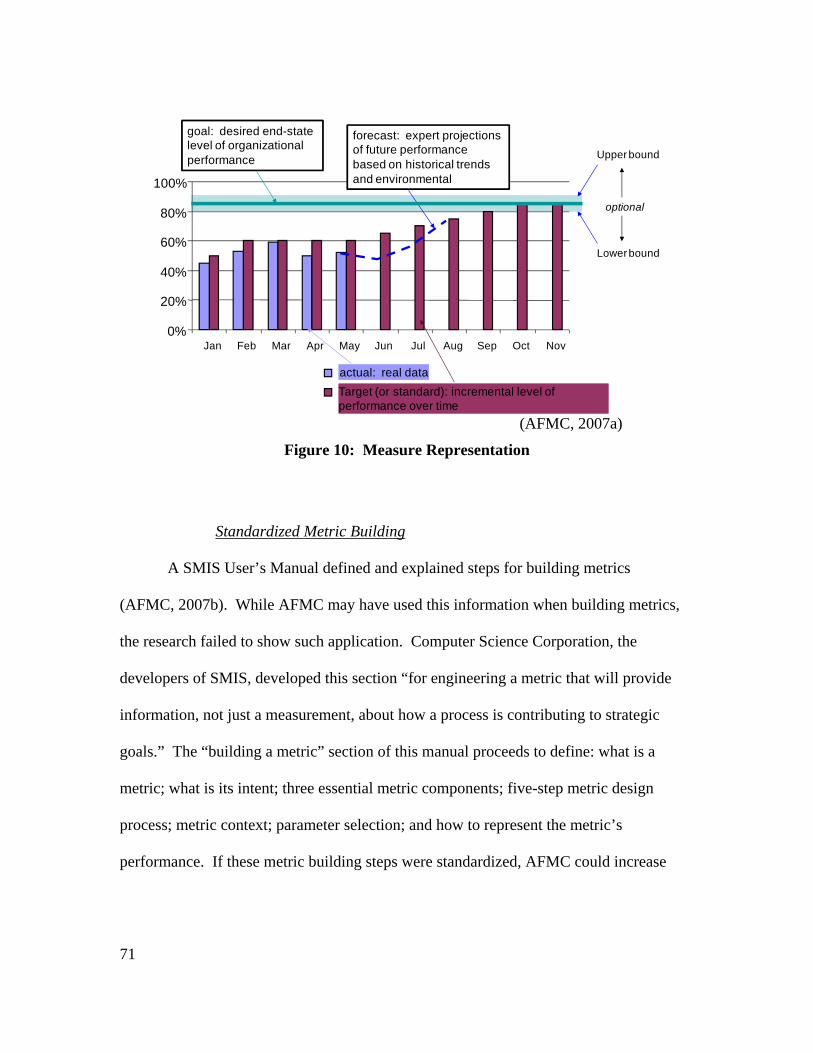
0%
20%
40%
60%
80%
100%
Jan Feb Mar Apr May Jun Jul Aug Sep Oct Nov
actual: real dataTarget (or standard): incremental level of performance over time
forecast: expert projections of future performance based on historical trends and environmental
goal: desired end-state level of organizational performance Upper bound
Lower bound
optional
(AFMC, 2007a)
Figure 10: Measure Representation
Standardized Metric Building
A SMIS User’s Manual defined and explained steps for building metrics
(AFMC, 2007b). While AFMC may have used this information when building metrics,
the research failed to show such application. Computer Science Corporation, the
developers of SMIS, developed this section “for engineering a metric that will provide
information, not just a measurement, about how a process is contributing to strategic
goals.” The “building a metric” section of this manual proceeds to define: what is a
metric; what is its intent; three essential metric components; five-step metric design
process; metric context; parameter selection; and how to represent the metric’s
performance. If these metric building steps were standardized, AFMC could increase
71

the probability that an area is accurately measured to in-turn evaluate how the said area
contributes to the strategic goal and how it should be properly managed.
Analysis
AFMC met a large amount of this key’s intent and therefore received a medium
rating. The areas of this key in which AFMC excelled were they: provided some form of
standardized vocabulary; implemented a standardized objective template; provided a
standardized approach to cascade scorecards; and standardized measure definitions and
charting. The possibility still exists to optimize this key by: providing a consolidated
BSC vocabulary listing; removing the required scorecard content with cascaded
scorecards; and implementing instructions on how to properly build metrics.
4. Select the Right Objectives and Performance Measures
Selecting the right objectives and performance measures are critical to a
company’s BSC success. First, objectives must be correctly identified. The selection of
incorrect objectives will lead to optimization of non-value added processes—meaning
that even though process will be optimized they may fail to contribute to the optimization
of the company as a whole. Secondly, appropriate measures must also be selected to
accurately reflect the objective. If measures are not correctly selected, they will be
measuring performance somewhere other than in the objective. If the selected measures
fail to measure the objective, not only will managers fail to understand the performance
within that objective and its result on the strategy but it will also be wasting resources.
Therefore, careful considerations should be taken to select both the appropriate objectives
and their measures.
72

Overview
This section of AFMC’s key to select the right objectives and measures was given
a medium rating. First, this section explains AFMC’s developed a process for identifying
and capturing both internal and external requirements. Then, shortcomings within this
key are presented. Next, the processes and guidance AFMC used to rectify these
shortcomings are discussed. Finally, an analysis is provided.
External and Internal Requirements
AFMC worked towards selecting the right objectives and measures by attempting
to balance external and internal requirements. Because AFMC is not the top of the
corporation--it is a business unit within a larger AF corporation--it possesses both internal
and external requirements. One way AFMC identified that all requirements were met
was through implementation of a requirements pyramid. This pyramid provided structure
in three main categories—customer effects metrics, process performance metrics, and
strategic plan assessment—which drilled down to 11 specific metric areas. (HQ
AFMC/XP Deputy, 2001) AFMC could use then use these metrics throughout the
pyramid structure to balance all requirements.
Identified Shortcomings
Evidence of incorrectly selected objectives and measures began to surface through
command performance reviews (CPR), offsite visits, direct feedback from participants,
input from field leadership and teams, and strategic management integrated process teams
(IPT) (HQ AFMC/XP, 2005). One of these challenges was identified as “BSC Quality.”
Under this observation, it was noted that AFMC’s BSC had:
73

missing or buried commander intent, does not directly support the mission, insufficient attention to customer voice, missing core activities of the command, [too] operational instead of strategically focused, as well as too many measures and measures [that] do not fit objectives (HQ AFMC/XP, 2005).
A later analysis also identified shortcomings with the objectives and measures.
Specifically, the briefer identified that: specific directorates were selecting measures to
showcase projects or activities; measures had “little relationship to mission objectives or
vision impact”; and, the BSC contained many historically reported measures of limited
change value. (Hocker and RTS Partners LLC, 2005)
Processes for Selecting the Right Objectives and Measures
The identified shortcomings in objective and measure development drove AFMC
to take action. They attempted to improve this key through several steps (Hocker and
RTS Partners LLC, 2005). Their first thing AFMC did to improve in this area was define
a strategic measure. Then, a three-by-four chart was presented to help users differentiate
between urgent, operational and strategic measures by looking at frequency, rationale,
scope and examples. Now that AFMC provided information so users could more easily
differentiate between different measures, they attempted to improve this key further by
identifying eight principles for strategic measure design: 1) lead (input) versus lag
(output) 2) control versus influence 3) tipping point measures 4) averages 5) the role of
surveys 6) top 10 measures 7) the danger of indices and 8) be strategically focused
(Hocker and RTS Partners LLC, 2005). Two other improvements came by way of the
SMIS Users Manual which provided extensive guidance on measure selection and
implementation and through AFMC’s “logic of questions” to further aid in objective and
74

measure selection (Figure 11). (554 ELSG/SBI, 2006a) One final improvement noted in
this section was guidance to “not pursue measures [just] to have something to show--
they must add significant value...” (AFMC, 2006a).
How will it contribute to the
vision?
What is the fundamental
problem we are trying to solve?
Who, within our Command, is
impacted by this problem?
How do our measures reflect
the answers to the these questions?
What other objectives will be
impacted by improvement?
How will it contribute to the
vision?
What is the fundamental
problem we are trying to solve?
Who, within our Command, is
impacted by this problem?
How do our measures reflect
the answers to the these questions?
What other objectives will be
impacted by improvement?
(AFMC, 2006b)
Figure 11: Logic of Questions
Analysis
This section attempted to show AFMC’s specifics within this key and discuss the
reasons it received its medium rating. The identified shortcomings section highlighted
how the process of selecting objectives and measures can be very subjective and where
subjectiveness can lead. To combat these shortcomings, AFMC instituted a number of
actions. These actions not only provided assistance in delineating and understanding the
different types of measures but also provided guidance to reduce subjectivity when
selecting objectives or measures. Unfortunately, the research failed to show whether the
results of these action were ever re-evaluated as to whether they succeeded in improving
objective and measure selection and rectified the identified shortfalls. Ultimately, the
75

development of guidance and governance improved the potential to select the right
objectives and measures but AFMC needs to verify its results.
5. Quantify Objectives or Their Performance Measures
There are two areas of importance when it comes to BSC objectives or their
performance measures. First, they need to be quantified. Evaluation of a BSC’s success
can easily be reflected quantitatively to stay the course, change directions or simply
convince sponsors of the BSC’s success. Secondly, when numerous measures are
identified to represent a single objective, those measures should be weighted to reflect
each measure’s importance on the objective.
Overview
AFMC received a medium rating in this key because they developed quantified
measures but did not assign weights when numerous measures were aggregated to reflect
one objective. This section reviews the specifics of AFMC within this key in two areas.
First, AFMC’s position on quantified and weighed objectives and measures is identified.
Secondly, the development of quantified measures and their lack of weights are provided.
In conclusion, an analysis is presented.
AFMC’s Position
AFMC believed that measures were important. Two areas that reflected this
position were through discussion of measures themselves and the type of measures used.
Their position for measures was evident through their series of logic which stated that
since strategy represents leaderships’ choices and priorities, and measures communicate
priorities that, by association, measures must be tied to strategy. They further detailed
76

the types of measurer by stating that one of their strategic vision attributes was to have
“weighting and aggregation functions” (MSG/MMD7, 2002).
Quantified and Weighed Measures
The initial BSC, with fairly simple objectives had but one measure per objective.
These measures were quantified and therefore fulfilled the first portion of this key to BSC
success. As AFMC’s scorecard evolved, however, objectives became more generalized
and each objective became theoretically driven by numerous, unweighted measures (554
ELSG/SBI, 2006b).
Analysis
This key proved to be straight forward within AFMC’s historical documentation.
AFMC received the medium rating because while they did realize and develop quantified
measures they did not assign weights to numerous measures when they theoretically
represented one objective. By not allocating weights to an objective’s measures, a user
might then inappropriately assume that each measure should be weighed evenly when in
actuality certain measures may play a larger role in the objectives improvement. This
could lead to a misuse of critical resources. The absence of weighted measures could
also possibly invalidate any analytical analyses performed in an attempt to verify the
BSC’s cause and effect.
6 & 7. Ensure Objectives Present Causal Pattern and Implement Strategy Maps
These two keys—objectives should present a causal pattern and implement
strategy maps—are reviewed together. The concept and use of strategy maps was not
considered part of the BSC framework until a number of years after the BSC was
77

introduced. Companies that have developed their BSC after the criticality of
implementing strategy maps had been revealed have used the development of their
strategy maps to blueprint their BSC. This blueprinting not only provides the blueprint of
a company’s BSC by identifying all their perspectives and perspectives’ objectives but
also ensures and reflects the causal relationships within those objectives through the use
of arrows. Because it is now common for companies to develop cause-and-effect
relationships through development of strategy maps, research in one area reveals insights
into the other.
Overview
The research conducted to confirm that AFMC did use strategy maps also
answered that, while their initial objectives did present a causal pattern, objectives after
December 2005 may not have. Consequently, AFMC received a high implementation
rating because they did implement strategy maps but a low rating in the key to ensure
objectives present a causal pattern because their objectives from 2005 onward failed to
show causal relationships and any hypothesized relationships were never validated.
This section will reveal AFMC’s specifics within these keys by first introducing
AFMC’s position on causal relationships and explaining how they initially were tied to
strategy maps. Then, the critical error of AFMC to validate their causal relationships, as
well as future potential capability, is discussed. Finally, an analysis on these findings is
provided.
78
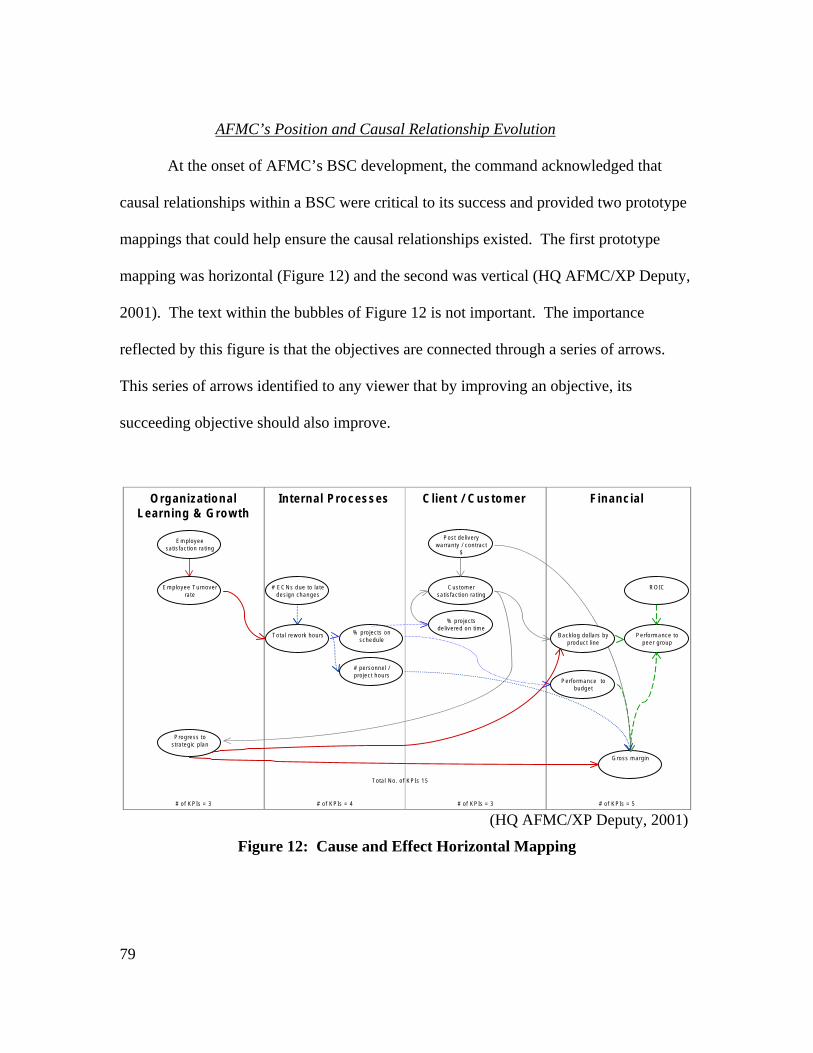
AFMC’s Position and Causal Relationship Evolution
At the onset of AFMC’s BSC development, the command acknowledged that
causal relationships within a BSC were critical to its success and provided two prototype
mappings that could help ensure the causal relationships existed. The first prototype
mapping was horizontal (Figure 12) and the second was vertical (HQ AFMC/XP Deputy,
2001). The text within the bubbles of Figure 12 is not important. The importance
reflected by this figure is that the objectives are connected through a series of arrows.
This series of arrows identified to any viewer that by improving an objective, its
succeeding objective should also improve.
T ota l N o . o f K P Is 1 5
O rg an iza tio n a lL earn in g & G ro w th
In tern a l P ro cesses C lien t / C u sto m er F in an c ia l
% pro jec ts onsche du le
R O IC
P erfo rm an ce tope er g roup
C ustom ersa tis fac tion ra ting
% p ro je c tsde live re d o n tim e
# personn e l /p ro jec t ho urs
To ta l re w ork hou rs
G ro ss m arg in
# o f K P Is = 3 # o f K P Is = 3 # o f K P Is = 5
E m plo yee T urn overra te
E m ployeesa tis fac tio n ra ting
P ro gre ss tos tra teg ic p lan
# o f K P Is = 4
P o st d e live ryw a rran ty / con tra c t
$
P erfo rm an ce tob udg e t
# E C N s d ue to la tede s ig n ch an ges
B ack log do lla rs byp ro duct line
(HQ AFMC/XP Deputy, 2001)
Figure 12: Cause and Effect Horizontal Mapping
79

AFMC selected this mapping technique of using arrows to acknowledge and
reflect causal relationships. They implemented and continued to use this technique
through a number of strategy map revisions until December of 2005. In the December
and all succeeding strategy maps, cause-and-effect arrows were no longer utilized
(Figure 12). This abandonment of arrows may lead to generalizations about causal
relationships. For example, when a viewer looks at the strategy map in Figure 13, are
they to generalize that since each perspective has a triangle at the top of it that the
triangle is similar to a causal arrow and that the objectives between the perspectives are
linked? And by that reasoning, improvements in any one of the objectives in the lowest
level perspective will drive improvements in all the next higher level perspective’s
objectives? This example demonstrates that unless the viewer was involved in the
strategy map’s development they may not understand its true meaning.
80
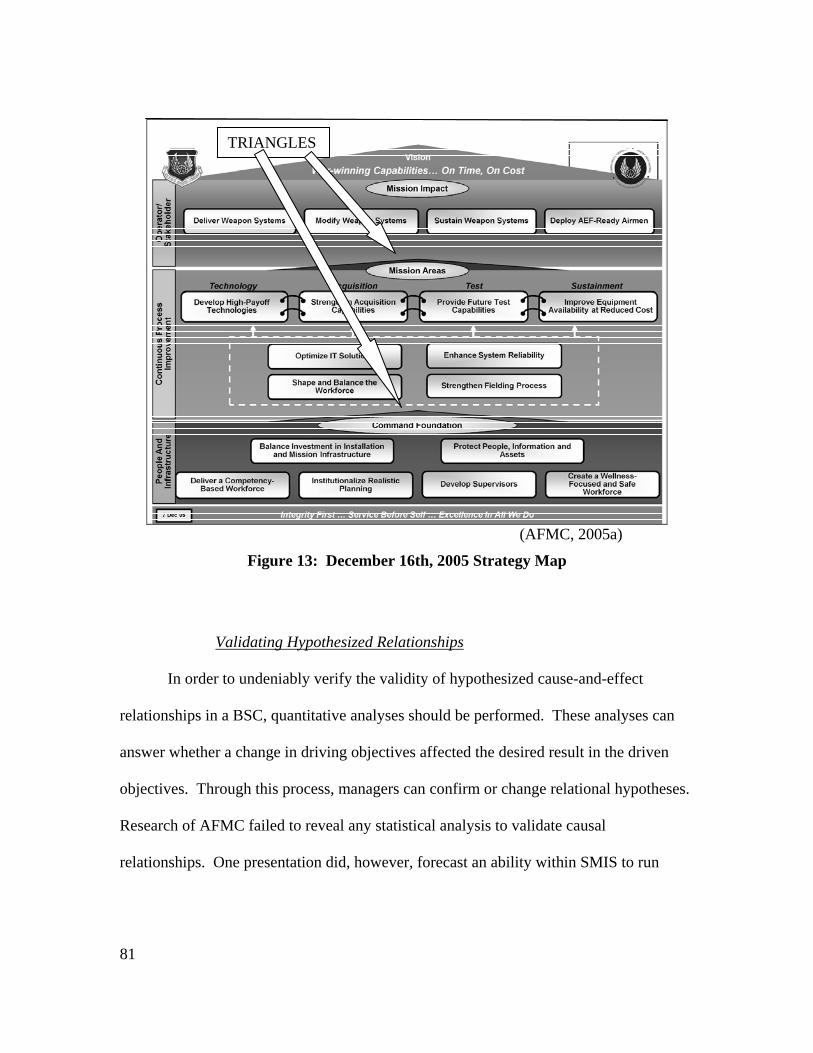
TRIANGLES
(AFMC, 2005a)
Figure 13: December 16th, 2005 Strategy Map
Validating Hypothesized Relationships
In order to undeniably verify the validity of hypothesized cause-and-effect
relationships in a BSC, quantitative analyses should be performed. These analyses can
answer whether a change in driving objectives affected the desired result in the driven
objectives. Through this process, managers can confirm or change relational hypotheses.
Research of AFMC failed to reveal any statistical analysis to validate causal
relationships. One presentation did, however, forecast an ability within SMIS to run
81
“Cause/Effect Simulations” but SMIS has been decommissioned since this research was
conducted.
Analysis
Research showed that AFMC initially developed their scorecard with causal
relationships. By implementing strategy maps, they received a high implementation
rating in the key to implement strategy maps. While AFMC may understand and contend
a causal relationship is also present among the most recent objectives, research has failed
to surface any analyses verifying these hypothesized cause-and-effect relationships. The
lack of causal relationships and their validations are critical shortcomings in AFMC’s
scorecard and therefore received a low rating. Without validated causal relationships,
AFMC cannot confirm their BSC relationships are accurate or verify whether their BSC
is structured to meet their strategic goal. If AFMC’s hypothesized relationships were not
valid and their BSC was not properly structured to meet their strategic goal, then valuable
resources would have been wasted and the command as a whole would have missed an
opportunity to become “balanced.”
8. Select Software to Help--Not Hinder
Software should help, not hinder the efforts to manage business processes. This
key to successful BSC implementation and use proved to be one of AFMC’s strong suits.
AFMC contracted with Computer Science Corporation (CSC) to build the Strategic
Management Information System (SMIS), which was the system of choice for AFMC’s
BSC. To provide the reader with an understanding of the type of software AFMC was
using, CSC earned the “Enhancing Operational Readiness in Defense” annual award,
82

presented by Cognos Corporation, for unparalleled implementation. Because of CSC’s
product and its capabilities, AFMC received a high rating within this key.
Overview
This section explains why AFMC received a high rating for this key. First, the
activity locations and operations covered by SMIS are identified. Then, AFMC’s
requirements and SMIS’s ability to meet those requirements are discussed. Finally, an
analysis is provided on this key’s findings.
SMIS Activity Locations and Operations
SMIS was AFMC’s primary system for collecting, tracking, analyzing, and
reporting performance. One reason AFMC received a high implementation level in this
key was because SMIS accomplished these tasks through a web-based access across
numerous activity locations and operations listed below (AFMC):
The activity locations:•AFMC Headquarters (Wright-Patterson AFB, OH)•AF Research Laboratories (reported from AFRL HQ at Wright-Patterson AFB, OH) •AF Flight Test Center (Edwards, AFB, CA)•Air Armament Center (Eglin AFB, FL)•Aeronautical Engineering and Development Center•Electronic Systems Center (Hanscom AFB, MA)•Aeronautical Systems Center (Wright-Patterson AFB, OH)•AF Security Assistance Center (Wright-Patterson AFB)•Aerospace Maintenance and Regeneration Center (Davis-Monthan AFB, AZ)•Nuclear Weapons Center (Kirtland AFB, NM)•Ogden Air Logistics Center (Hill AFB, UT)•Oklahoma City Air Logistics Center (Tinker AFB, OK)•Warner-Robins Air Logistics Center (Robins AFB, GA)
The operations involved:•Headquarters (including Community Action Information Board (CAIB))•Acquisition•Test and Evaluation•Sustainment•Science and Technology•Mission Support (base infrastructure)•Human Resources
83
AFMC Requirements and SMIS Capabilities
SMIS was introduced at the same time and alongside AFMC’s BSC (HQ
AFMC/XP Deputy, 2001). Another reason SMIS enabled AFMC to receive a high rating
was because it advertised the capability and met AFMC’s “management system
characteristics” to be “simple,” “aggressive,” “flexible,” and have a “low overhead.” It
proved to be “simple” by providing “a view of AFMC we can review together and
balanced measures for strategic management.” It proved to be “aggressive” by
“increasing amount of communication up and down, [providing a] window into what
strategic actions are needed, and get to the point.” It proved to be “flexible” by being
able to “follow the focus of I know what I want when I see it.” Finally, it proved to have
“low overhead” by using “common/existing databases.”
The first two requirements of simplicity and aggressiveness can be viewed
through a succession of strategy maps with drill-down functions and correlated initiatives
within SMIS. Upon entry into the SMIS system, a user could review the current strategy
map which provided the user the ability to review its objectives and each objective
measure’s status through associated “piecons.” Then, with a simple click on a plus
symbol located on a navigation toolbar positioned to the left side of the screen, very
similar to folders in Microsoft’s Windows Explorer, the user could drill-down to view
cascaded, center scorecards. This allowed the user to readily review the same features
available at the command’s scorecard. Proceeding through the SMIS system, the user
had the ability to further drill-down in order to view a number of items, such as
objectives’ driving performance measures, performance information measures and
84

reports, links between strategy maps and initiatives, initiative overview capability,
milestone tracking capability, AFSO21 reporting capability, return on investment
analysis ability, and an earned value analysis capability. These abilities certainly
provided the “simplicity” for reviewers, as well as the aggressiveness to increase
communication.
The SMIS system also proved flexible through its ability to respond to the desired
mindset to “follow the focus of I know what I want when I see it”--a mindset most
custom software applications likely follow. A two-year representation of the SMIS’s
responsiveness and flexibility can be seen in Figure 14 (AFMC). This figure’s time-
series data illustrated how SMIS’s capabilities increased to meet increasing needs of the
command. The total area reflected the total needs of AFMC; the dark area reflected the
capabilities that were identified and met, whereas the light area reflected the small
amount of capabilities that were identified and yet to be fulfilled. As shown, capabilities
increased approximately seven times over a two-year period. In spite of the fast-paced
increase, CSC was able to ensure SMIS consistently met these increased demands and
ultimately met all but a few of those requirements by the end of this two year period.
85

0
50
100
150
200
250
300
350
400
Jan‐03
Mar‐03
Apr‐03
May‐03
Jun‐03
Jul‐0
3
Aug
‐03
Sep‐03
Oct‐03
Nov
‐03
Dec‐03
Jan‐04
Feb‐04
Mar‐04
Apr‐04
May‐04
Jun‐04
Jul‐0
4
Aug
‐04
Sep‐04
Oct‐04
Nov
‐04
Total CLOSED
Remaining OPEN
(AFMC)
Figure 14: Two-Year Capability Sample Finally, the requirement to use “low overhead and common/existing databases”
was completed through the use of four pre-existing sources: AFMC Strategic Plan,
Center Plans, Metrics and Existing Data Systems (HQ AFMC/XP Deputy, 2001). These
preexisting sources appeared to be used in lieu of requiring another central data
management system.
Analysis
In summary, AFMC received a high rating because their software was able to
meet all of AFMC’s BSC requirements. Furthermore, SMIS proved to be a software
system equal or better than those in the civilian industry. As was mentioned during the
validating hypothesized relationships section, SMIS has been decommissioned. Since the
86

software system is the backbone of a BSC, a lot of responsibility rests with the new
software system to continue meeting all of AFMC’s requirements.
9. Select BSC Goals and Timelines for Their Completion
Operating without the establishment of goals would lead to organizations just
going through the motions. To maximize potential and results, not only do goals need set
and worked towards--the “right” goals need to be selected (Griffis et. al. 2004).
Overview
AFMC received a medium rating in this area, because while research revealed
they understood the importance and implemented goals, the research was unable to
identify whether timelines for their completion were also established. This section will
review AFMC’s position on goals as well as their overarching and specific goals. An
analysis is then provided on these findings.
Position
AFMC recognized through a command review of lessons learned that targets and
time-phased goals should be utilized in their BSC (MSG/MMD, 2003). Consequently,
AFMC released guidance on target setting as a method to further clarify strategy. This
guidance explained their rationale, process and available methods for target setting. The
rationale was that target setting communicates clear expectations from leadership. They
guided the process for target setting by 1) starting with top perspectives and working
down 2) introducing customers into as many measures as possible 3) balancing stretch
versus incremental goals 4) set one target per measure 5) retain the story of the strategy in
each target, and 6) ensure leadership responsibility. Moreover, this guidance identified
87

historical, baseline and benchmark as methods for target setting. (Hocker and RTS
Partners LLC, 2005)
Goals
Following their advice AFMC’s established overarching and specific goals. The
overarching goals of their BSC were:
• Develop and transition technology to maintain air, space and information dominance • Develop, field and sustain war-winning expeditionary capabilities on time, on cost • Provide opportunities for career development and progression • Operate quality installations • Sustain a safe, healthy, fit and ready workforce • Organized and resource the command to improve and increase effectiveness (HQ
AFMC/XPX, 2005) AFMC also set specific goals within each measure. While examples of these goals are
not discussed here, they were numerous and their format can be reflected in Figure 10.
Analysis
As introduced, this key received a medium rating because AFMC set goals but
research failed to show timelines for their completion. Additionally, similar to selecting
the right objectives and measures, goals could also be selected in a methodical way.
Research failed to show whether goals were selected in this way but by establishing goals
methodically, as through the use of statistical analyses, AFMC could avoid a situation
where unobtainable results are requested and resources are wasted. General Carlson
understood this point and wisely reminded to one of AFMC’s councils ‘to set targets
based on the requirement (How many do we need and how good do we really have to be?
To do more than what's really needed takes resources away from other areas)’ (Dolan,
2007). Even though the research failed to show whether goals and their timelines for
88

completion were set methodically, it is possible they were constructed in this manner. If
scientific methods were not employed in the selection of said goals when appropriate, a
number of biases may have taken place—conservatism, recency, availability, illusory
correlations, optimism and selective perception—just to name a few (Makridakis et. al.
1998).
10. Simplify Management Systems--Do Not Just Add To Existing Framework
This key focused on two main areas: only implement and use necessary measures
and use the BSC as the central management system. Specifically, the literature indicated
that only measures that lead to improved outcomes for customers, and ultimately allow an
organization to work toward their mission, are to be utilized. The literature also indicated
that the BSC should be the central management system within an organization.
Overview
AFMC received a medium rating within this key. They abided by the literature’s
guidance by selectively adding only necessary objectives and measures to help meet their
strategy. However, research failed to show how AFMC attempted to reduce existing,
non-essential measures. Together, this resulted in using necessary objectives and
measures along with unnecessary measures. Finally, research showed that AFMC took
steps to place the BSC as their central management system.
Measures
AFMC understood that only critical measures to the operation should be added.
Consequently, they developed a methodical process for selecting and approving any
additional measures. (This process was explained under the process section of “establish
89

balanced scorecard framework” above.) By establishing this process, AFMC attempted
to prevent the addition of frivolous measures. The historical research, however, showed
no such process for evaluating or eliminating active, non-current measures. A process to
review measures could confirm whether all active measures are necessary to more most
efficiently manage resources.
The reality of AFMC’s number of measures graphed over time is reflected in
Figure 15 (554 ELSG/SBI). The actual number of metrics, between the years of 2003 to
2006 (solid line), shows to be very erratic without any sign of stability. The hypothesized
metric count (dashed line) reflects a more hopeful result in metric numbers. Discussing
this hypothesized metric count, the metrics would begin to rise during BSC
implementation because players are just getting involved in the new management tool
and are providing their inputs. Then, the number of metrics would stabilize for a short
time during leadership, and potentially management software, changeover. Succeeding
that short time of stabilization would be a decreasing number of metrics resulting the
elimination of past, outdated metrics. Finally, the number of metrics over time would
mostly stabilize, save for times of war or other dynamic events when priorities may
change causing existing and metrics to be redirected or new metrics to be derived to
reflect and meet any changes in priorities. The rate of progression in the hypothesized
number of measures over time may increase or decrease depending on the size of the
organization, funding, etc. Regardless whether the reader agrees with this hypothesized
number of measures over time, they must concede that AFMC’s number of measures
90

over time reflected an erratic pattern. The lack of stability could lead to increased
difficulty within AFMC’s BSC implementation and use.
0
10
20
30
40
50
60
70
# of
Met
rics
Time
Number of Metrics Over Time
Actual
Hypothesized
(554 ELSG/SBI)
Figure 15: Number of Metrics Over Time
Central Management System
AFMC also understood that the BSC should be the central management system
and declared it as such (HQ AFMC/XPX, 2005). It was initially forecasted to become
the central management system through the use of in-place data sources. Using in-place
data sources would maintain simplicity of BSC implementation and use through
integration in order to avoid “just adding to the existing framework” (HQ AFMC/XP
Deputy, 2001). The way the BSC acted as AFMC’s centralized system is reflected in the
Figure 16 (554 ELSG/SBI, 2006b). This pyramid reflected the different levels of the
91

management system starting with the base—data and administration—and ending with
the peak—command performance reviews (CPR). Through this framework, AFMC
planned to obtain reliability, flexibility, ease of preparation/modification/use,
performance, different levels of users, accountability, incentives, system maintenance,
strategy influencing programs management agenda (POM), resource allocation,
initiatives that have an impact, and time series data. As shown below, these results are
identified within the different levels of the pyramid.
(554 ELSG/SBI, 2006b)
Figure 16: SMIS's Functional Framework
Analysis
AFMC appeared to meet most of this key’s requirements by establishing a process
to add only essential measures and use the BSC as the central management system and
therefore, received a medium rating. Research failed to show, however, whether active,
92

non-essential measures were removed. Selectively adding measures but neglecting to
reduce non-essential measures is similar to a profit driven company solely focusing on
improving revenue but neglecting to reduce cost--except in this BSC example the goal is
to minimize the resource requirement versus maximize profit.
RESOURCE REQUIREMENT = NEW MEASURES (+) EXISTING MEASURES
PROFIT = REVENUE (-) COST
By not exploring the possibility to focus on—and reduce if appropriate—non-critical
measures, additional resources may be required or additional strain may be placed on
those monitoring the existing and now additional measures. This could possibly lead to a
decrease in measurement accuracy, employee buy-in or morale. Furthermore, while
AFMC may have had a process for selectively adding objectives and their measures to
the BSC, Figure 15 above shows the number of measures to be very erratic. This lack of
stability, may have translated into a workforce which experienced constantly changing
priorities, and because of this, productivity may never have had the chance to become
optimized.
Summary
Throughout this chapter, the 11 keys identified as critical to successful BSC
implementation and use were taken and, in succession and separately, used to identify
and analyze AFMC’s specifics within each key. While AFMC may not have received
high ratings under each key, they should be applauded for identifying and being involved
in all of the keys. In summary, the ratings of each key can once again be reviewed in
Table 6.
93

Table 6: Ratings Summary Key to Successful BSC Implementation and Use Rating
Deploy BSC from the Top Down LowEstablish BSC Framework High
Standardize Within the BSC--but Do Not Standardize Content MediumSelect the Right Objectives and Performance Measures Medium
Quantify Objectives or Their Performance Measures MediumEnsure Objectives Present a Causal Pattern Low
Implement Strategy Maps HighSelect Software to Help--Not Hinder High
Select BSC Goals and Timelines for Their Completion MediumSimplify Management Systems--Do Not Just Add To Existing Framework Medium
Cascade the BSC Low
94

V. Conclusions and Recommendations
Chapter Overview
This chapter will summarize the research findings. First, conclusions of the
research will be addressed by investigative question. Secondly, this section provides
recommendations for AFMC’s BSC. Finally, the significance of this research is
discussed and recommendations for future researcher are provided.
Research Conclusions
The primary focus of this research was to evaluate whether AFMC’s BSC
implementation and use aligned with what the literature indicated was required to obtain
optimal results. To complete this evaluation, two investigative questions to guide the
research were established and answered.
Investigative Question One
What are the key areas of a BSC an organization must address and succeed
in to optimize its use?
The BSC management tool is a fairly new concept with developing guidance.
Because of this, various organizations’ BSC implementation and use were collected and
reviewed through case studies. By answering this investigative question, 11 key areas
referred to in this paper as keys to successful BSC implementation and use were revealed.
Investigative Question Two
How does AFMC’s implementation and use of the BSC align with what the
literature indicates is needed to obtain optimal results?
95

BSC implementation within the DoD is also fairly new, with AFMC being the
pioneer. In order to evaluate AFMC’s BSC implementation and use, the 11 key areas
which were identified from answering investigative question one, were focused on. By
addressing AFMC’s specifics within each key, a list of recommended actions to better
optimize AFMC’s BSC was developed and organized below.
Recommendations for Action
In this section, the eleven keys to successful BSC implementation and use are
listed and recommendations provided. These recommendations are based solely on
historical data and may have already been considered or implemented.
1. Deploy BSC from the Top Down
• Attempt to align with higher offices
• Deploy the BSC down to AFMC team or individual level
2. Establish Balanced Scorecard Framework
• None
3. Standardize Within the BSC—but Do Not Standardize Content
• Consolidate and publish list of AFMC BSC vernacular
• Re-evaluate standardized material in cascaded BSC for possible diminishment of
local relevance.
• Establish standardized instructions, with options, for developing metrics.
96

4. Select the Right Objectives and Performance Measures
Ensure that the following challenges identified within AFMC have been
addressed:
• Missed or buried commander intent
• Did not directly support the mission
• Insufficient attention to customer voice
• Missed core activities of the command
• Too many measures and measures [that] do not fit objectives
• Specific directorates selected measures to showcase projects or activities
• Measures had “little relationship to mission objectives or vision impact”
• BSC contained many historically reported measures of limited change value
5. Quantify Objectives or Their Performance Measures
• Ensure that weights are assigned to supporting measures
6. Ensure Objectives Present a Causal Pattern
• Conduct causal analysis to verify hypothesized relationships
NOTE: This appeared to be the largest, potential shortfall within AFMC. Understanding
that Generals with years of experience collaborated to build AFMC’s BSC, the
hypothesized relationships are likely valid ones. Still, quantitative analyses could be used
to verify these relationships to solidify the relationships, convince sponsors, and provide
the weights of supporting measures when objectives have more than one to better manage
resources.
97

7. Implement Strategy Maps
• Review current strategy maps and evaluate whether the initial position to “easily
and effectively communicate” is still being met
8. Select Software to Help--Not Hinder
• None--as researched
NOTE: The software researched here has been decommissioned. Careful consideration
should be taken to ensure the new software provides equal or superior service.
9. Select BSC Goals and Timelines for Their Completion
• Ensure timelines are established for goals
• Ensure scientific methods for goal generation are used when appropriate
10. Simplify Management Systems--Do Not Just Add To Existing Framework
• Ensure active measures are reviewed and out-dated measures are discontinued
11. Cascade the BSC
• Ensure teams and individuals at the lowest levels understand their involvement
with the command’s BSC. Encourage the generation and use of measures at their
level towards improvement of the command’s BSC objectives.
Significance of Research
The significance of this research is twofold. First, it identified eleven key areas
which business units similar to that of AFMC should carefully address when
implementing and using a BSC. Secondly, it provided AFMC an evaluation which may
help guide their efforts through future BSC use.
98
99
Recommendations for Future Research
This case study laid the foundation for the future of AFMC’s BSC. Specifically,
two main areas could be further researched. First, a case study approach could be applied
to further evaluate AFMC’s BSC and provide further recommendations or corrections to
this study. The case study could include interviews, surveys and other methods of data
collection to better understand AFMC’s BSC. Secondly, a quantitative approach could
be applied to the scorecard. If provided the required quantitative data, this approach
could potentially validate causal relationships, assign weights to supporting measures,
and most importantly, evaluate whether AFMC has achieved overall improvement.
Summary
The purpose of this research was to evaluate AFMC’s BSC implementation and
use. Because of this effort, eleven keys to address during BSC implementation and use
were identified. A historical synopsis of AFMC’s BSC was provided and analyzed
within each of these areas. This thesis provided recommendations for AFMC’s BSC, if
not already completed or considered. Finally, two areas of future research were
identified in the form of case study or quantitative designs.

Bibliography
2GC Active Management. (2006). “Organisational Performance Management in a UK Insurance Firm: Aligning Individual's Goals with the Business Strategy.” 4 October 2007 http://www.2gc.co.uk/pdf/2GC-IIC.pdf
554 ELSG/SBI. “Metric Data by Load Date.” Internal Working Document.
554 ELSG/SBI. (2006a). SMIS User's Manual. Internal Working Document.
554 ELSG/SBI. (2006b). “Spiral 10 Support of Strategy Management Process: AFSO 21/Initiative Application.” Internal Working Document.
Active Strategy. (2007a). “Driving Strategic Transformation and Embedding Accountability at TriHealth, Inc.” 11 October 2007 http://www.activestrategy.com/pdfs/TriHealth_Case_Study.pdf
Active Strategy. (2007b). “Miami-Dade County: Becoming a Results-Oriented Government with ActiveStrategy Enterprise.” 9 October 2007 http://www.activestrategy.com/about_us/miami_dade_case_study.aspx
AFMC. (a). “Brief to Mike Henke.” Internal Working Document.
AFMC. (b). “Functional Requirements.” Internal Working Document.
AFMC. (c). “Measure Development Changes.” Internal Working Document.
AFMC. (d). “Objective-Metric-Initiative Relationships.” Internal Working Document.
AFMC. (2003). “Achieving ESC Strategy Using the Balanced Scorecard Tool.” Internal Working Document.
AFMC. (2005a). “AFMC BSC Measures.” Internal Working Document.
AFMC. (2005b). “AFMC Measurement Template.” Internal Working Document.
AFMC. (2006a). “Center BSC Video Teleconference.” Internal Working Document.
AFMC. (2006b). “CSR Draft Briefing Version Three.” Internal Working Document.
AFMC. (2007a). “Measure Definitions.” Internal Working Document.
AFMC. (2007b). “Strategy Implementation within AFMC.” Internal Working Document.
AFMC/A8. (2006). “AFMC Command Strategy.” Internal Working Document.
100

Antarkar, N., Cobbold, I. and 2GC Active Management. (2001). “Implementing the Balanced Scorecard--Lessons and Insights from a Multi-Divisional Oil Company.” 1 October 2007 http://www.2gc.co.uk/pdf/2GC-Truro.pdf
Armitage, Howard and Scholey, Cam. (2004). “Hands-on Scorecarding.” CMA Management, ABI/INFORM Research.
Blair, M. M. (1995). “Ownership and Control: Rethinking Corporate Governance for the Twenty-First Century.” Brookings Institute Press.
“Building and Implementing a Balanced Scorecard Case Study: UNUM Corporation.” (1999). 13 December 2007 http://www.exinfm.com/training/pdfiles/Balanced %20Scorecard %20Cs.pdf
Busha, C. H. and Harter, S. P. (1980). “Research Methods in Librarianship Techniques and Interpretation.” New York: Academic Press.
Cardemil-Katunaric, G. and Shadbolt, N. “The Balanced Scorecard as a Spontaneous Framework in an Agricultural Hybrid Cooperative Under Strategic Change: A Case Study in the New Zealand Kiwifruit Industry.” 1 October 2007 http://www.ifama.org/tamu/iama/conferences/2006conference/Symposium%20Presentations/Ombu%202/Ombu%202/S3_O2/S3_O2_1132_Shadbolt.pdf
Chen, M. C. H. and Chou, S. Y. “A BSC Framework for Air Cargo Terminal Design: Procedure and Case Study.” Journal of Industrial Technology, 22(1)
Cobbold, I. and 2GC Active Management. (2001). “Implementing the Balanced Scorecard--Lessons and Insights from a Financial Services Firm Balanced Scorecard Case Study--Arran Ltd.” 1 October 2007 http://www.2gc.co.uk/pdf/2GC-Arran.pdf
United States Congress. (1993). Government Performance and Results Act of 1993. 26 August 2007 http://govinfo.library.unt.edu/npr/library/misc/s20.html
Creswell, J. W. (2003). Research Design Qualitative, Quantitative, and Mixed Method Approaches. Thousand Oaks, California: Sage Publications.
Cuganesan, S., Ford, G. and Khan, H. (2006). “Using Strategy Maps and the Balanced Scorecard Effectively: The Case of Manpower Australia.” 9 October 2007 http://www.mgsm.edu.au/download.cfm?DownloadFile=5CEAF106-9185-1122-50ED311B730670BB
Dolan, M. (2007). “AFMC Council Meeting Minutes.” Internal Working Document.
Excitant. (2005a). “The Case for Balanced, Structured, Performance Management.” 15 November 2007 http://www.excitant.co.uk/
101

Excitant. (2005b). “Strategy Only Sticks if You Have Active Support and Involvement from the Top…and Follow Through.” 15 November 2007 http://www.excitant.co.uk/
Executive Office of the President and Office of Management and Budget. (2001). The President's Management Agenda. 17 November 2007 http://www.whitehouse.gov/omb/ budget/fy2002/mgmt.pdf
Griffis, Stanley E. and Cooper, Martha C. and Goldsby, Thomas J. and Closs, David J. (2004) “Performance Measurement: Measure Selection Based Upon Firm Goals and Information Reporting Needs.” Journal of Business Logistics, Vol. 25, No.2, pp. 95-118.
Hocker, G., and RTS Partners LLC. (2005). “Implementing Strategy within AFMC: Developing Strategic Measures.” Internal Working Document.
HQ AFMC/A8. (2006). “Command Strategy Review.” Internal Working Document.
HQ AFMC/XP. (2005). “Institutionalizing the BSC CPR Process.” Internal Working Document.
HQ AFMC/XP Deputy. (2001). “Strategic Management Information System.” Internal Working Document.
HQ AFMC/XPX. (2005). “AFMC Strategic Management.” Internal Working Document.
HQ USAF/DPM. (2004). “Air Force Effects Management Program Primer.” Internal Working Document.
Kaplan, R. S., and Norton, D. P. (1996). “Using the Balanced Scorecard as a Strategic Management System.” Harvard Business Review, 74(1), 75-85.
Kaplan, R. S., and Norton, D. P. (2002). The Strategy-Focused Organization. Harvard Business School Press.
Kaplan, R. S., and Norton, D. P. (1992). “The Balanced Scorecard--Measures that Drive Performance.” Harvard Business Review, 70(1), 71-79.
Kaplan, R. S., and Norton, D. P. (2004). Strategy Maps Converting Intangible Assets Into Tangible Outcomes. Boston: Harvard Business School Press.
Lawrie, G., Cobbold, I. and 2GC Active Management. (2001). “Strategic Alignment: Cascading the Balanced Scorecard in a Multi-National Company Balanced Scorecard Case Study--Crosshouse.” 1 October 2007 http://www.2gc.co.uk/pdf/2GC-Crosshouse.pdf
Makridakis, Spyros and Wheelwright, Steven C. and Hundman, Rob J. (1998) Forecasting: Methods and Applications. John Wiley and Sons Ltd.
102

Malina, M. A., and Selto, F. H. (2001). “Communicating and Controlling Strategy: An Empirical Study Of The Effectiveness of The Balanced Scorecard.” Journal of Management Accounting Research. 13(1), 47–90.
Marr, B. and Schiuma, G. (2003). “Business Performance Measurement-Past, Present and Future.” Management Decision, 41(8), 680-687.
Marshall, C., and Rossman, G. B. (1989). Designing Qualitative Research. Newbury Park, California: Sage Publications.
MID 901: Establishing Performance Outcomes and Tracking Performance Results for the Department Of Defense. 17 November 2007 http://www.asafm.army.mil/ceac/perfmgt/mid/ mid901.pdf
MID 910: Budget and Performance Integration (BPI) Initiative. 17 November 2007 http://www.asafm.army. mil/ceac/perfmgt/mid/mid910.pdf
MID 913: Implementation of a Two-Year Planning, Programming, Budgeting and Execution System. 17 November 2007 http://www.asafm.army.mil/ceac/perfmgt /mid/mid913.pdf
Mooraj, S., Oyon, D., and Hostettler, D. (1999). “The Balanced Scorecard: A Necessary Good or an Unnecessary Evil?” European Management Journal, 17(5), 481-491.
MSG/MMD. (2003). “The Balanced Scorecard: An Approach to Strategic Management.” Internal Working Document.
MSG/MMD7. (2002). “AFMC Balanced Scorecard.” Internal Working Document.
Neely, A. (2007). “The Search for Meaningful Measures.” Management Services, ABI/INFORM Research
Niven, P. R. (2002). Balanced Scorecard Step by Step: Maximizing Performance and Maintaining Results. John Wiley and Sons.
Niven, P. R. (2003). Balanced Scorecard Step-By-Step for Government and Nonprofit Agencies. John Wiley and Sons.
Niven, P. (2006a). “The Importance of Terminology in Your Balanced Scorecard.” 2007 http://balancedscorecard.biz/articles/Importance_of_Terminology.pdf
Niven, P. (2006b). “Training for Balanced Scorecard Success.” 9 December 2007 http://www.senalosa.com
OSD PA&E. “The DoD Balanced Scorecard: Overview.” 17 November 2007 http://unpan1.un.org/intradoc/groups/public/documents/ASPA/UNPAN013239.pdf
103

Othman, Rozhan. (2006). “Balanced Scorecard and Causal Model Development.” Emerald Group Publishing Limited.
Paladino, B. (Jul 2007). “5 Key Principles of Corporate Performance Management.” Strategic Finance, ABI/INFORM Research.
Scala, M., and Office of Secretary of Defense. (2003). “Balanced Scorecard Interest Group--The US Defense Department's Use of a Risk-Management Scorecard.” 17 November 2007 http://unpan1.un.org/intradoc/groups/public/documents/ ASPA/UNPAN013238.pdf
Schneiderman, A. M. (1999). “Why Balanced Scorecards Fail.” Journal of Strategic Performance Measurement, 2(S 6), 11.
Stephen, B. (2006). “Beating the Balanced Scorecard Blues.” 7 March 2007 http://www.wipfli.com/Wipfli/Impact_Magazine/Industry_Archive/Health_Care/General/200601HCA_Balanced_Scorecard_Troubleshooting.htm
“Strategy Execution and Alignment.” (2007). 10 October 2007 http://www.insightformation.com/learn-more/strategy-execution-alignment.html
Taub, S., and CFO.com. “The Peasants Are Revolting.” 2007 http://www.cfo.com/article.cfm/3006358/c_3043096?f=singlepage
Tesch, R. (1990). Qualitative Research Analysis Types and Software Tools. New York: Falmer Press.
Department of the Air Force. “eLog21 Course.” 24 August 2007 https://www.my.af.mil/gcss-af/afp40/USAF/ep/globalTab.do?channelPageId=-738606andpageId=681743
Webber, A. M. (2000). “New Math for a New Economy.” Fast Company, 214.
Weinstein, L. B., and Castellano, J. F. (2004). “Scorecard Support.” Management for Strategic Business Ideas. 78(2), 18.
Yin, R. K. (1994). “Case Study Research Design and Methods.” Thousand Oaks: Sage Publications.
104

105
Vita Captain Aaron J. Hepler graduated from Montoursville High School in
Montoursville, Pennsylvania. He enlisted in the military in 1996 and became a Refueling
Maintenance Technician. During his enlistment, he served tours in Little Rock AFB, AR,
Osan Air Base, Korea, and Dover, DE. While enlisted, Captain Hepler began
undergraduate studies at Southern Illinois University, Carbondale, where he graduated in
May 2002 with a Bachelor of Science degree in Industrial Technology. He was
commissioned through Officer Training School in February of 2003.
Captain Hepler’s only assignment as an officer was at Lackland AFB, TX. He
served as the Officer in Charge of Contingency Planning and Training Flight and later as
Flight Commander of the Management and Systems Flight.
In August 2006, Captain Hepler entered the Graduate School of Engineering and
Management, Air Force Institute of Technology. Upon graduation, he will be assigned to
the Air Force Materiel Command.

REPORT DOCUMENTATION PAGE Form Approved OMB No. 074-0188
The public reporting burden for this collection of information is estimated to average 1 hour per response, including the time for reviewing instructions, searching existing data sources, gathering and maintaining the data needed, and completing and reviewing the collection of information. Send comments regarding this burden estimate or any other aspect of the collection of information, including suggestions for reducing this burden to Department of Defense, Washington Headquarters Services, Directorate for Information Operations and Reports (0704-0188), 1215 Jefferson Davis Highway, Suite 1204, Arlington, VA 22202-4302. Respondents should be aware that notwithstanding any other provision of law, no person shall be subject to an penalty for failing to comply with a collection of information if it does not display a currently valid OMB control number. PLEASE DO NOT RETURN YOUR FORM TO THE ABOVE ADDRESS. 1. REPORT DATE (DD-MM-YYYY)
19-03-2008 2. REPORT TYPE
Master’s Thesis 3. DATES COVERED (From – To)
March 2007 – March 2008 5a. CONTRACT NUMBER
5b. GRANT NUMBER
4. TITLE AND SUBTITLE
BALANCED SCORECARD: EVALUATION OF AIR FORCE MATERIEL COMMAND’S IMPLEMENTATION AND USE
5c. PROGRAM ELEMENT NUMBER
5d. PROJECT NUMBER
5e. TASK NUMBER
6. AUTHOR(S)
Captain Aaron Hepler 5f. WORK UNIT NUMBER
7. PERFORMING ORGANIZATION NAMES(S) AND ADDRESS(S)
Air Force Institute of Technology Graduate School of Engineering and Management (AFIT/EN) 2950 Hobson Way, Building 640 WPAFB OH 45433-8865
8. PERFORMING ORGANIZATION REPORT NUMBER
AFIT/GLM/ENS/08-03
10. SPONSOR/MONITOR’S ACRONYM(S)
554 ELSG/SBI
9. SPONSORING/MONITORING AGENCY NAME(S) AND ADDRESS(ES)
Headquarters Air Force Materiel Command Building 262 Wright Patterson AFB, OH 45433-5006
11. SPONSOR/MONITOR’S REPORT NUMBER(S)
12. DISTRIBUTION/AVAILABILITY STATEMENT APPROVED FOR PUBLIC RELEASE; DISTRIBUTION UNLIMITED.
13. SUPPLEMENTARY NOTES 14. ABSTRACT
Managing in a contemporary world has become increasingly more complex. It has evolved from a manufacturing setting with little to steer managers but a single, financial indicator to managing a greater percentage of intangible assets through numerous leading and lagging indicators. The industry has also evolved from centrally located and managed to decentralized, multi-national companies. In response to these changes, a new strategic management tool was developed called the Balanced Scorecard (BSC). This management tool has proved extremely successful throughout the last decade. In 2001, Air Force Materiel Command (AFMC) implemented a Balanced Scorecard (BSC). The purpose of this research was to evaluate the implementation and use of AFMC’s BSC. To guide this effort, both meta-synthesis and historical methodologies were employed. First, a meta-synthesis approach was used to synthesize qualitative BSC data that resulted in eleven keys to successful BSC implementation and use. Secondly, an historical methodology was employed to review AFMC’s BSC history within each of these key areas. Once the literature and AFMC’s history were compared, perceived gaps were identified and recommendations provided. Finally, the significance of the research and recommendations for future research were also provided. 15. SUBJECT TERMS
16. SECURITY CLASSIFICATION OF:
19a. NAME OF RESPONSIBLE PERSON
Bradley Anderson, Lt Col, USAF a. REPORT
U
b. ABSTRACT
U
c. THIS PAGE
U
17. LIMITATION OF ABSTRACT
UU
18. NUMBER OF PAGES
117
19b. TELEPHONE NUMBER (Include area code)
(937) 255-6565, ext 4646 ([email protected])
Standard Form 298 (Rev. 8-98) Prescribed by ANSI Std. Z39-18

Recommended