AGRICULTURAL AND
FOREST METEOROLOGY
ELSEVIER Agricultural and Forest Meteorology 68 (1994) 119-131
Aerodynamic conductances along a bare ridge-furrow tilled soil surface 1
K.J. Mclnnes *'a, J.L. Heilman a, M.J. Savage b aDepartment of Soil and Crop Sciences, Texas A & M University, College Station, TX 77843, USA
bDepartment of Agronomy, University of Natal, Pietermaritzburg 3201, South Africa
(Received 7 July 1993; revision accepted 25 October 1993)
A b s t r a c t
Spatial dependence of aerodynamic conductances for heat and mass between the atmosphere and positions along the surface of ridge-furrow tilled soil has been ignored in modeling efforts. Aerodynamic conductances may vary with both wind speed and wind direction. This research was conducted to determine the effect of wind direction on aerodynamic conductances for heat transport gh from small sensors placed along a bare ridge-furrow tilled soil surface relative to the spatial mean value (gh), Aerodynamic conductances were determined from an energy balance of a pair of adjacent sensors, heated and unheated, placed flush with the soil sur- face. Twelve minute average gh values, 1 m wind speeds, and wind directions, were measured over a 4 week period in a ridge-furrow tilled field near College Station, Texas. The average vertical distance from the furrow bottoms to the ridge tops was 0.24 m and the horizontal distance between ridges was 1 m. Sensors were placed flush with ridge tops, ridge-furrow sides, and furrow bottoms. To minimize the influence of free convection on gh, only measurements that were taken when 1 m wind speeds were greater than 0.5 m s -1 were analyzed. Values of gh/(gh) at the ridge top were 5-10% higher than those at the furrow bottom when the wind was parallel to ridge orientation. When wind was perpendicular to ridge orientation, aerodynamic conductances from sensors on the windward ridge-furrow side were about 5-15 % higher than (gh), and those from sensors on the leeward side, were about 5-15% lower than (gh). Differ- ences in gh/(gh) between ridge top and furrow bottom were smaller than differences between windward and leeward sides when wind was not parallel to the ridge orientation. Results from this research could be used to assign spatially dependent conductances from the surface to the atmosphere when modeling two or three dimensional energy and mass transport in ridge- furrow systems.
* Corresponding author. 1 Technical Article TA-31262, Texas Agricultural Experiment Station, College Station, TX 77843, USA.
0168-1923/94/$07.00 © 1994 - Elsevier Science B.V. All rights reserved SSDI 0168-1923(93)02131-O
120 K.J. Mclnnes et al. ' Agricultural and Forest Meteorology 68 (1994) 119 /3/
I. Introduction
Considerable research efforts have been devoted to developing models of heat and mass movement in ridge and furrow tilled soil systems (Mahrer, 1982; Nieber, 1982; Mahrer and Avissar, 1985; Thomas, 1985). In these efforts, spatially dependeni aerodynamic conductances of the near surface layer for either heat or mass have not been used. If the geometry of the surface is considered, the aerodynamic con-- ductances along a ridge--furrow tilled surface would be expected to change with the angle the wind makes with respect to the direction of the cultivation. It may be important in modeling mass and energy movement in r idge-furrow systems to con- sider the spatial variability of aerodynamic conductances and how they are influenced by wind direction.
In past modeling efforts, aerodynamic conductances have generally been computed from wind speed, zero-plane displacement, and momentum roughness using flux profile theory. Values of the zero-plane displacement and momentum roughness have been determined as a function of wind direction (McInnes et al., 1991), but conduc- tances for fluxes to and from the surface to the atmosphere based on f l u x profile relationships do not give detail of the spatial variation across the ridge- furrow sur- face. Spatially dependent boundary conditions for incident and reflected radiation have been defined for r idge-furrow surfaces (Vining, 1988; Sharratt et al., 1992) and some research on the effects of ridges on wind erosion has been conducted (Armbrust et al., 1964; Hagen and Armbrust, 1992). Little, however, has been done to charac- terize aerodynamic conductances for sensible heat or gas transport to and from ridge-furrow tilled surfaces, probably because of the complexity of the turbulence around such surfaces. Even for simple isothermal steady state systems, present mod- eling of turbulence around ridge surfaces requires a supercomputer (Karniadakis and Orszag, 1993).
Research in fluid mechanics for steady turbulent flow of water between a smooth wall and a wavy surface has shown that at H/L (ridge height to horizontal spacing from ridge top to ridge top) ratios greater than 0.03, areas of separated flow formed in the wake of ridges when bulk flow was perpendicular to the direction of the ridges (Zilker and Hanratty, 1977, 1979). At Reynolds numbers between 8300 and 15 600 (based on bulk velocity and half-height of channel), flow along the surface separated near 0.1 L and reattached near 0.6 0.7 L (Buckles et al., 1984). In the area of separation, flow near the surface was predominantly in the opposite direction as the above movement. Ratios of H/L for r idge-furrow tillage are often greater than 0.1, so one would expect areas of separated flow to form between ridges when winds are perpendicular to the ridge orientation. Areas of separation should not occur when wind is parallel to the row direction. What happens to near surface air flow when winds are at angles other than perpendicular or parallel is uncertain.
The purpose of our experiments was to determine the effect of wind direction on the spatial distributions of aerodynamic conductances for heat from small sensors placed along a r idge-furrow tilled soil surface. We assumed that these distributions would be similar to the distributions in aerodynamic conductances for the soil surface.
K.J. Mclnnes et al. / Agricultural and Forest Meteorology 68 (1994) 119-131
2. Materials and methods
121
2.1. Conductance sensors
We constructed sensors in our laboratory to measure heat t ransport from a r idge- furrow tilled soil surface. In our design, we wanted to meet three criteria. First, the sensors must be placed flush with the soil surface. Because we were interested in the spatial dependence of aerodynamic conductances across (perpendicular transect) the r idge-furrow surface, the size of the sensors was limited to being small compared with the distance between furrows. Second, the measured values of the aerodynamic conductances from the sensors when placed on a smooth horizontal surface must be independent of wind direction. This restricted the sensors to being circular in shape. Last, the measurement must be independent of temporal differences in ambient temperature and absorbed thermal and solar irradiance. The sensors we constructed were similar in principle to the heat-transport sensors of Bailey et al. (1975) and the water-vapor- transport sensors used by Tanner and Shen (1990), in that both relied on a pair of sensors, one internally heated and the other unheated. The unheated sensor served as a reference to remove the effect of absorbed irradiance and air temperature. Isothermal sensors (Shewen et al., 1989) that could potentially measure aerodynamic conductances of the soil surface would have been ideal, but we chose sensors simpler to construct and operate on the assumption that spatial variations in aerodynamic conductances of the sensors would be similar to spatial variations in aerodynamic conductances of the soil surface (Bailey et al., 1975).
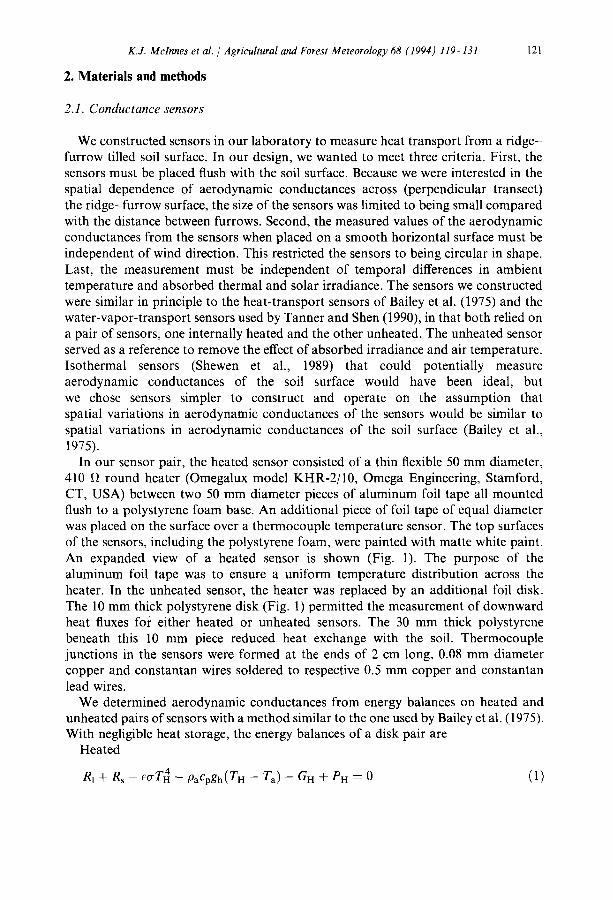
In our sensor pair, the heated sensor consisted of a thin flexible 50 m m diameter, 410 f~ round heater (Omegalux model KHR-2/10, Omega Engineering, Stamford, CT, USA) between two 50 m m diameter pieces of aluminum foil tape all mounted flush to a polystyrene foam base. An additional piece of foil tape of equal diameter was placed on the surface over a thermocouple temperature sensor. The top surfaces of the sensors, including the polystyrene foam, were painted with matte white paint. An expanded view of a heated sensor is shown (Fig. 1). The purpose of the aluminum foil tape was to ensure a uniform temperature distribution across the heater. In the unheated sensor, the heater was replaced by an additional foil disk. The 10 m m thick polystyrene disk (Fig. 1) permitted the measurement of downward heat fluxes for either heated or unheated sensors. The 30 m m thick polystyrene beneath this 10 m m piece reduced heat exchange with the soil. Thermocouple junctions in the sensors were formed at the ends of 2 cm long, 0.08 m m diameter copper and constantan wires soldered to respective 0.5 mm copper and constantan lead wires.
We determined aerodynamic conductances from energy balances on heated and unheated pairs of sensors with a method similar to the one used by Bailey et al. (1975). With negligible heat storage, the energy balances of a disk pair are
Heated
RI + Rs - ecrT 4 - paCpgh(TH -- Ta) - GH + PH = 0 (1)
122 K.J. Mclnnes et al. Agricultural and bbrest Meteorology 68 (1994) 119 13 I
[~ 50mm .[
THERMO~
) mm
)mm
90 mm
Fig. 1. Conductance sensor construction.
Unheated
R 1 4- R s - f o r t 4 - paCpgla(Tt~ - Ta) - G t --- 0 (2)
where R t is the absorbed flux density of long wave irradiance; Rs is the absorbed flux density of short wave irradiance; e a t 4 is the flux density of long wave radiation emitted from the heated source; ~eT 4 is the flux density of long wave radiation emitted from the unheated source; p a c p g h ( T n - - Ta) is the sensible heat flux density to or from the heated source; pacpgh(Tu - Ta) is the sensible heat flux density to or from the unheated source, respectively; G/4 and Gu are the heat flux densities con- ducted through the polystyrene foam for the heated and unheated sources, respec- tively; P n is the power density of the heater. Units of all terms are W m -2. In these equations, c is the thermal emissivity, cr is the Stephan-Bol tzmann constant (W m- ? K-a), Pa is the density of air (kg m-3), cp is the specific heat capacity of air (J kg K - I ) , gh is the aerodynamic conductance or heat transport coefficient (m s -t), T, is the air temperature (K), and TH and Tu are the temperatures (K) of the heated and unheated surfaces, respectively. Assuming gh to be the same for both surfaces, sub-
K.J. Mclnnes et al. / Agricultural and Forest Meteorology 68 (1994) 119-131 123
tracting Eq. (2) from Eq. (1) gives
- e o ' ( T 4 - T 4 ) - paCpgh(TH -- TU) -- (G H - Gu) --b PH = 0 (3)
Hence, the aerodynamic conductance gh may be determined as
gh = [--ccr( T4 -- T4) - (GH -- Gu) + PH]/[paCp(TH -- TU)] (4)
Inclusion of the unheated sensor thus removes the effects of varying amounts of long wave (Rz) and short wave (Rs) irradiance from the calculation of gh.
Because the heated sensor is warmer than the soil surface and because of absence of T, in Eq. (4), it is important to note that gh is the aerodynamic conductance of the sensor and not a true aerodynamic conductance (measured with a sensor at the same temperature as the soil) for the soil surface. For a r idge-furrow tilled surface, an exact relationship between the two terms is not easily defined, but we expect that relative differences in the conductances of the sensors along a r idge-furrow surface would be similar to relative differences in true aerodynamic conductances along the same sur- face. Much of the heat t ransport from our sensors is advective in nature and so is much of the heat transport near the surface of a r idge-furrow tilled soil. At times, the temperature of the soil on a sunlit r idge-furrow side may be 15 K warmer than that of the adjacent shaded side (Radke, 1982). Also, advective heat transport from clods should be related to wind speed in a form similar to that of our sensors (Kays and Crawford, 1980).
For a heated horizontal plate of length scale dplaced in a free stream of wind speed u, forced convection theory predicts that
gh CX umd n (5)
For a laminar boundary layer, experiments have shown m = 1/2 and n = - l / 2 , while Tor a completely turbulent boundary layer, m = 4/5 and n = - 1 / 5 (Kays and Crawford, 1980). From preliminary measurements with our sensors placed flush with a fiat soil surface, we found gh ~ ul/2, suggesting an essentially laminar boun- dary layer effect. Even in a turbulent free stream the leading edges of the thermal and aerodynamic boundary layers are often laminar (Kays and Crawford, 1980). When we placed sensors 0.5 m above the soil surface we found values of m were between those for laminar and turbulent flow (gh OC u6"5/10). I f the surfaces of our sensors were of infinite area, values of gh would be equivalent to the mean aerodynamic conduc- tance of the soil surface and the values should be proport ional to u (Bailey et al., 1975). Data of Bailey et al. (1975) show that measurements of gh with sensors as large as 0.3 m diameter still show a linear relationship ofgh with u m, where m is less than 1. For forced convection, if values of gh were calculated relative to the spatial mean value (gh), the d n term in Eq. (5) should cancel and the resultant g h / ( g h ) values should be independent of the diameter of the sensor.
I f heated sensors were used at low wind speeds, heat t ransport would be from a combination of free and forced convection. With horizontal flat plates in a laminar boundary layer, the value of the Grashof number (Gr) compared with the Reynolds number (Re) may be used to determine the significance of free convection to total conductance. For Gr/Re 5/2 = 0.05 with flat plates having a laminar boundary layer,
124 K.J. Mclnnes et al. ; Agricultural and bbrest Meteorology 68 (1994) 119 131
free convection accounts for about 5% of the conductance (Chen et al., 1977)~ Detailed analysis of the significance of free convection with heated sensors placed on a rough soil surface is more complex. A rough solution to the problem, though, can be made by noting that Eq. (5) predicts that a plot ofln(gh) against ln(u) would be linear. Because free convection would prevent gh from being zero as wind ceased, the point at which ln(gh) against ln(u) deviates from linearity would be approximately the point at which free convection becomes significant.
2.2. Field measurements
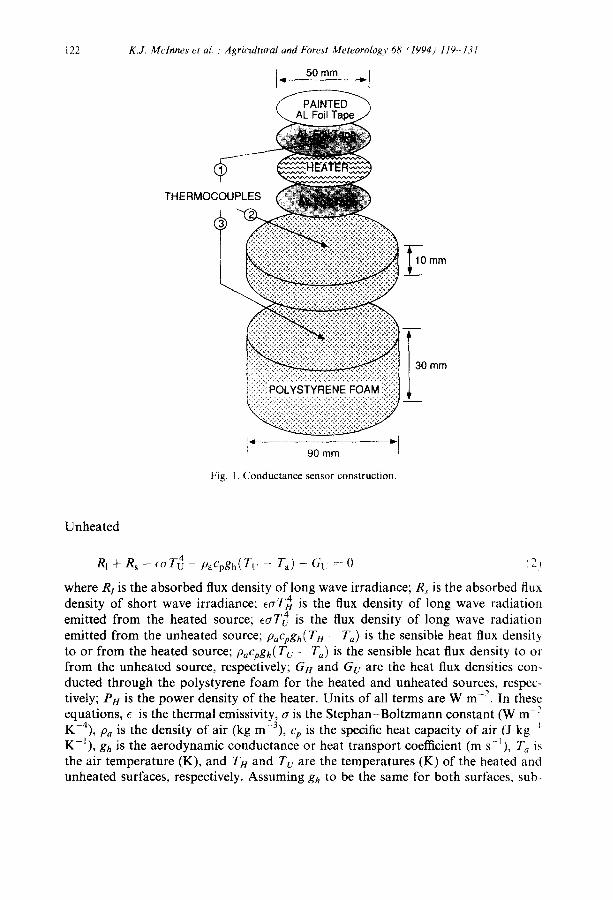
We maintained conductance sensors that were installed flush with the soil surface on diagonal transects in a ridge furrow tilled field near College Station, Texas from 11 November through 8 December 1992. The ridges in the field were oriented 58 ° W of N and minimum fetch was 100 m in all directions in which data will be reported. The average vertical distance from the furrow bottom to the ridge top (H) was 0.24 m and the horizontal distance between ridge tops (L) was 1 m. A wind vane (Model 12302, R.M. Young, Traverse City, MI, USA) was installed at 2 m above the ridge tops. Two cup anemometers (Model 12102D, R.M. Young) were installed 1 m above the ridge tops. Three studies were conducted. Studies 1 and 2 were conducted to measure gh values at four locations across the r idge-furrow surface and to determine the effect of the power density input of the heater on gh (temperature of the heated sensor as it might influence the ratio of free to forced convection). Study 3 was conducted to measure gh values at nine locations across the r idge-furrow surface, a finer spatial resolution than in studies 1 and 2.
Aerodynamic conductances were calculated from Eq. (4). Temperatures of the heated and unheated surfaces, Tt4 and Tt.~, were measured with thermocouples beneath the top layer of foil (thermocouple 1, Fig. 1). The value used for e was 0.96. Heat flux densities, G H and Gu, were calculated from the thermal conductivity of the polystyrene foam and the temperature gradients across the 10 mm layer of foam (from thermocouples 2 and 3, Fig. 1). Heater power density Pt4 was calculated from the voltage supplied to the heater and its resistance. Voltage across the heaters was regulated to within 0.02 V DC. Resistances of individual heaters were measured at 298 K No corrections were made for changes in resistances with temperature as measured changes in resistance over the operational temperature ranges were less than 1%. In studies 1 and 2, gh values were calculated for power densities of 360 and 720 W m -2 (17 and 24 V DC, respectively, applied to heaters of about 410 ~2). Time-averaged gh values, 1 m wind speeds, and 5 ° bin wind direction frequencies were recorded at the end of t2 min intervals with a model CR7X data logger (Campbell Scientific, Logan, UT, USA). Average wind directions were calculated from the wind direction frequencies. Ten sensor pairs were used in both studies. Sensor pairs for studies 1 and 2 were placed flush with the surface and along a diagonal running east west. A perpendicular cross section of their placement is shown (Fig. 2). Measure- ments on the ridge tops and furrow bottoms were replicated three times and measurements on the furrow sides were replicated twice. Aerodynamic conductances were calculated relative to the spatial mean value (gh). The value of (gh) was deter-
K.J. Mclnnes et al. / Agricultural and Forest Meteorology 68 (1994) 119-131 125
1
iii!ii! i iiii!ii! i ii ii!i!i:: 2 4 ..::!i ili!i!ii iii
a .::iiiiii!!!iiiiiiii iiiiiiiiiiil O24m : : : : : : : : : : : : : : : : : : : : : : ITI::::::~::::~:~-:-. . .-:-:£-:-:-:-:-:-:-:-:-~-:-:-:-:-:-:-:
i ! ! iiiiiii!ii !!?! ! iiiiii i ! ! iiiiiiii!i i! i iiii i !! i iiii i i ! i ?i i i! i ii i i ii iiii i ii I_ lm "1
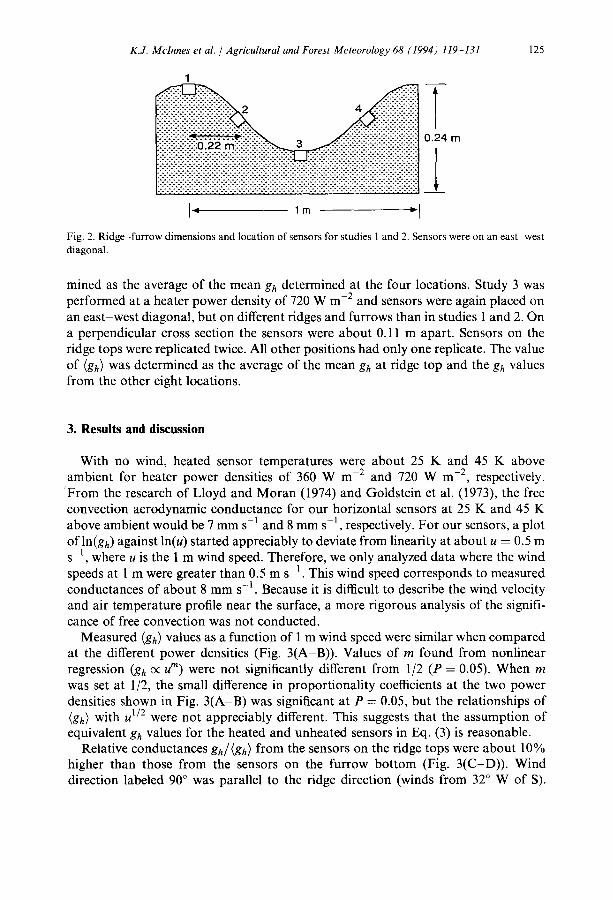
Fig. 2. Ridge-furrow dimensions and location of sensors for studies 1 and 2. Sensors were on an east-west diagonal.
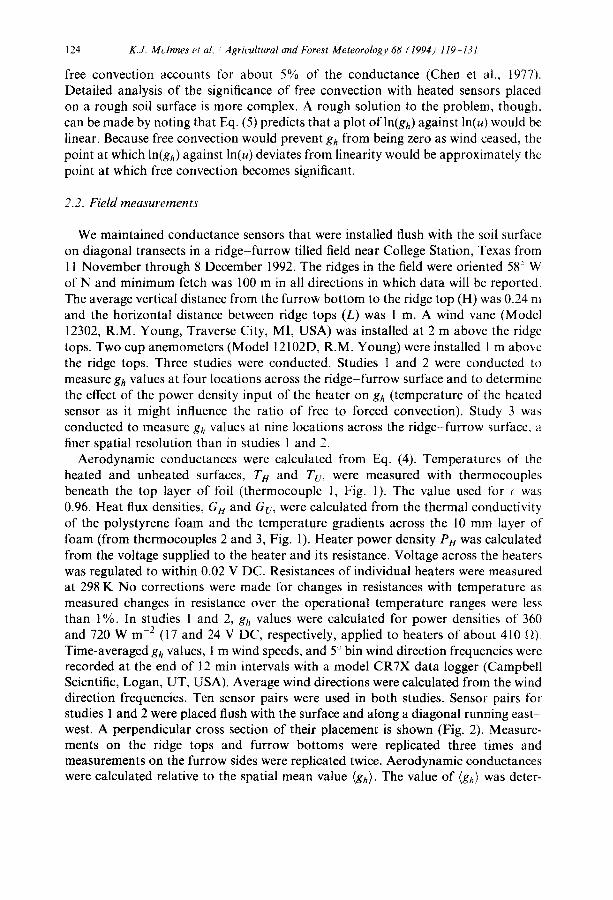
mined as the average of the mean gh determined at the four locations. Study 3 was performed at a heater power density of 720 W m -2 and sensors were again placed on an eas t -west diagonal, but on different ridges and furrows than in studies 1 and 2. On a perpendicular cross section the sensors were about 0.11 m apart. Sensors on the ridge tops were replicated twice. All other positions had only one replicate. The value of (gh) w a s determined as the average of the mean gh at ridge top and the gh values from the other eight locations.
3. Results and discussion
With no wind, heated sensor temperatures were about 25 K and 45 K above ambient for heater power densities of 360 W m -2 and 720 W m -2, respectively. 'F rom the research of Lloyd and Moran (1974) and Goldstein et al. (1973), the free convection aerodynamic conductance for our horizontal sensors at 25 K and 45 K above ambient would be 7 m m s -1 and 8 m m s -1, respectively. For our sensors, a plot ofln(gh) against In(u) started appreciably to deviate from linearity at about u = 0.5 m s - l , where u is the 1 m wind speed. Therefore, we only analyzed data where the wind speeds at 1 m were greater than 0.5 m s -1. This wind speed corresponds to measured conductances of about 8 m m s - l . Because it is difficult to describe the wind velocity and air temperature profile near the surface, a more rigorous analysis of the signifi- cance of free convection was not conducted.
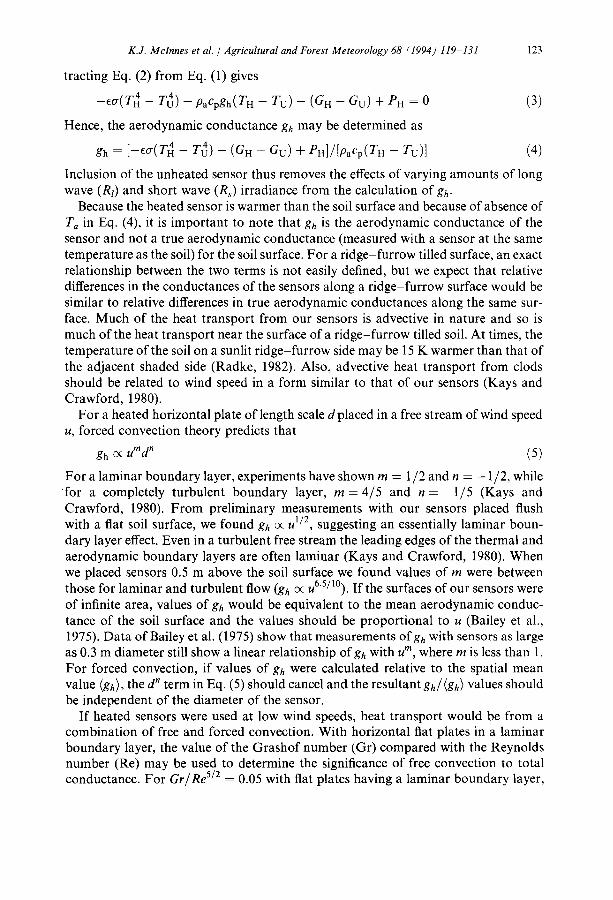
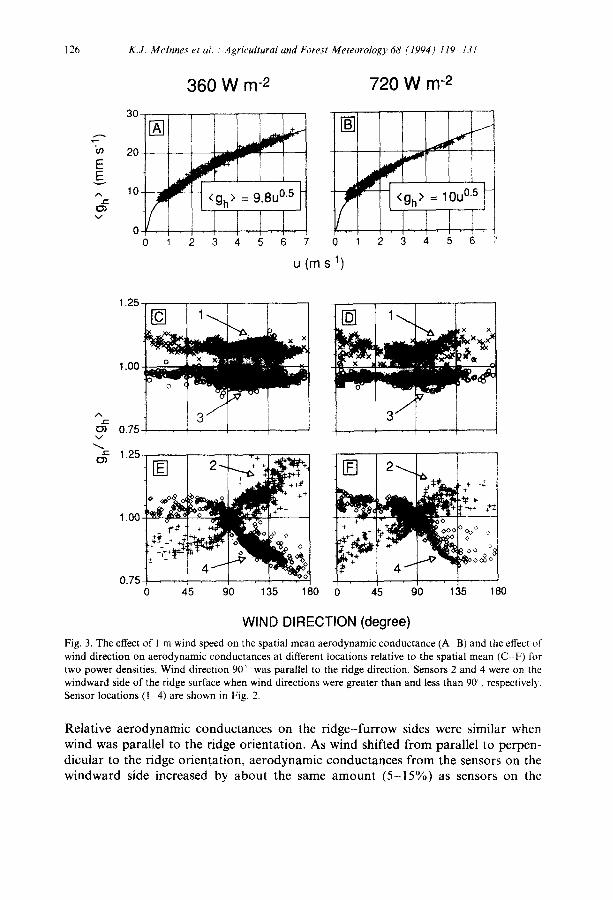
Measured (gh) values as a function of 1 m wind speed were similar when compared at the different power densities (Fig. 3(A-B)). Values of m found from nonlinear regression (gh (x u m) were not significantly different from 1/2 (P = 0.05). When m was set at 1/2, the small difference in proportionality coefficients at the two power densities shown in Fig. 3(A-B) was significant at P = 0.05, but the relationships of (gh) with u 1/2 were not appreciably different. This suggests that the assumption of equivalent gh values for the heated and unheated sensors in Eq. (3) is reasonable.
Relative conductances gh/(gh) from the sensors on the ridge tops were about 10% higher than those from the sensors on the furrow bot tom (Fig. 3(C-D)) . Wind direction labeled 90 ° was parallel to the ridge direction (winds from 32 ° W of S).
126 K.J. Mclnnes et al. Agricultural and Forest Meteorology 68 (1994) 119 t31
360 W m -2 720 W m -2
3o I I I '
20-
1 0 - ~ < gh > = 9"8U0"5
0 0 1 2 3 4 5 6
°1 : ouo.!t
0 1 2 3 4 5 6 7
u (m s -1)
% v
of
1.25-
1.00-
0.75-
1.25
1.00.
0.75 0 45
2 ~ . 1
4 j
'910
o
135 180
3 / ! . . . . , , , J
[]
45 90 135 180
WIND D I R E C T I O N (degree)
Fig. 3. The effect of I m wind speed on the spatial mean aerodynamic conductance (A B) and the effect of wind direction on aerodynamic conductances at different locations relative to the spatial mean (C F) lbr two power densities. Wind direction 90 ~ was parallel to the ridge direction. Sensors 2 and 4 were on the windward side of the ridge surface when wind directions were greater than and less than 90 '~, respectively. Sensor locations (1 4) are shown in Fig. 2.
R e l a t i v e a e r o d y n a m i c c o n d u c t a n c e s o n the r i d g e - f u r r o w s ides w e r e s i m i l a r w h e n
w i n d w a s p a r a l l e l to t he r i dge o r i e n t a t i o n . A s w i n d s h i f t e d f r o m p a r a l l e l to p e r p e n -
d i c u l a r to t h e r i dge o r i e n t a t i o n , a e r o d y n a m i c c o n d u c t a n c e s f r o m the s e n s o r s o n the
w i n d w a r d s ide i n c r e a s e d by a b o u t t he s a m e a m o u n t ( 5 - 1 5 % ) as s e n s o r s o n the
K.J. Mclnnes et al. / Agricultural and Forest Meteorology 68 (1994) 119-131
1.25 [ ~ SENSOR LOCATION [ ] 1
+ ++
1.00 '~g~z* ' ÷ ~ +
L!iiiiiiiiii!i iiiii!i!iiiiiiil o,, . . . .
127
1,25.
q
1 . 0 0
% o) 0.75
"- 1.25 o'}
"''"-C, ~++++ + ~ - + +
9
1.00
45 90 135
~-.-g++
[ ] 5
o o I~0 0 0...0
6 7
45 90 135
WIND DIRECTION (degree)
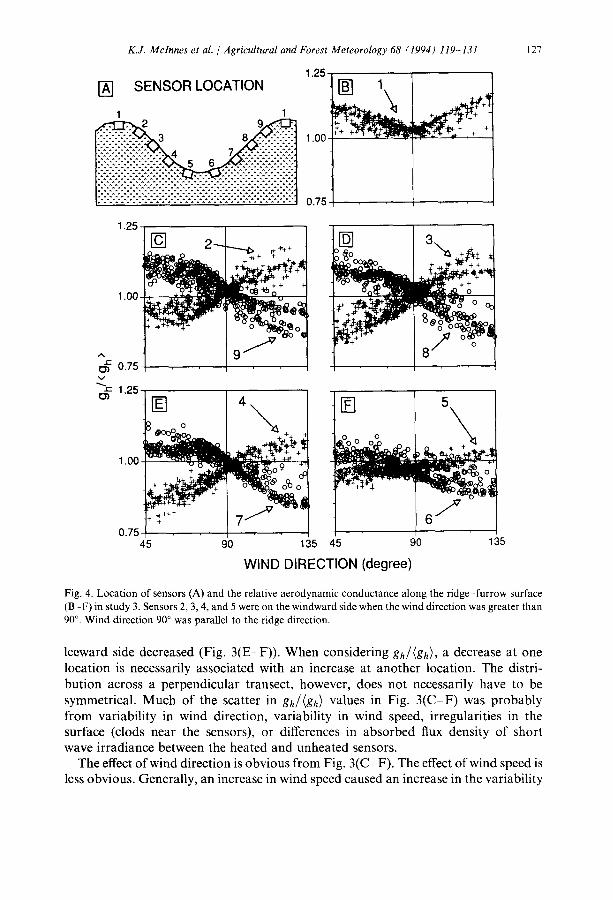
Fig. 4. Location of sensors (A) and the relative aerodynamic conductance along the ridge-furrow surface (B-F) in study 3. Sensors 2, 3, 4, and 5 were on the windward side when the wind direction was greater than 90 ° . Wind direction 90 ° was parallel to the ridge direction.
leeward side decreased (Fig. 3(E-F)). When considering gh/(gh) , a decrease at one location is necessarily associated with an increase at another location. The distri- bution across a perpendicular transect, however, does not necessarily have to be symmetrical. Much of the scatter in gh/(gh) values in Fig. 3(C-F) was probably from variability in wind direction, variability in wind speed, irregularities in the surface (clods near the sensors), or differences in absorbed flux density of short wave irradiance between the heated and unheated sensors.
The effect of wind direction is obvious from Fig. 3(C-F). The effect of wind speed is less obvious. Generally, an increase in wind speed caused an increase in the variability
128 K.J. Mclnnes et al. Agricultural and Forest Meteorology 68 (1994) 119 131
% o') v
t -
O )
1.15-
0.85
k•S 1800
00\
i i i i i [ I i
1.15
, ~ 1350
1
0.85
SENSOR LOCATION
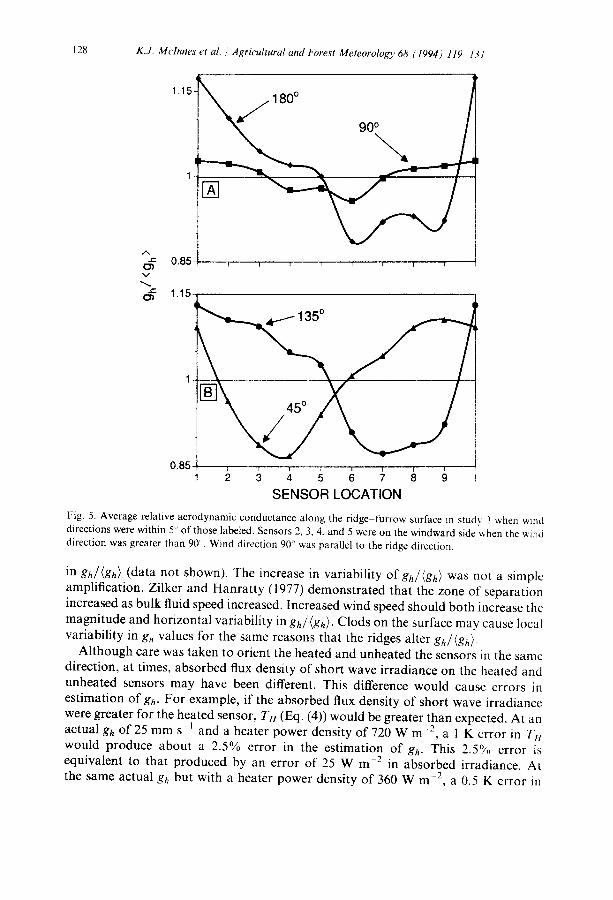
Fig. 5. Average relative aerodynamic conductance along the ridge furrow surface in study 13 when wind directions were within 5" of those labeled. Sensors 2, 3, 4, and 5 were on the windward side when the wind direction was greater than 9if, Wind direction 90 ° was parallel to the ridge direction.
in gh/(gh) (data not shown). The increase in variability ofgh/(gh) was not a simple amplification. Zilker and Hanratty (1977) demonstrated that the zone of separation increased as bulk fluid speed increased. Increased wind speed should both increase the magnitude and horizontal variability in gh/(gh). Clods on the surface may cause local variability in gh values for the same reasons that the ridges alter gh/(gh)-
Although care was taken to orient the heated and unheated the sensors in the same direction, at times, absorbed flux density of short wave irradiance on the heated and unheated sensors may have been different. This difference would cause errors in estimation of gh. For example, if the absorbed flux density of short wave irradiance were greater for the heated sensor, TH (Eq. (4)) would be greater than expected. At an actual gh of 25 mm s -1 and a heater power density of 720 W m -2, a 1 K error in TH would produce about a 2.5% error in the estimation of gh. This 2.5% error is equivalent to that produced by an error of 25 W m - " in absorbed irradiance. At the same actual gh but with a heater power density of 360 W m -2, a 0.5 K error in
K.J. Melnnes et al. / Agricultural and Forest Meteorology 68 (1994) 119 131 129
30
20-
E
% 10- v
°
,
<gh > 0 5 5 + 9 8 u °5
R 2 = 0.98
0 0.5 1 1.5 2 2.5 3
U0.5
E E
w
% v
0
% E~
v
2.50-
1'25 " ° ^c
0.00-
o
-2.50- 0
o o o o o °oo.~
o o ^o o~.,~
o ° °
45 90
~ 0 0 ~ 0 0
o Oo ~oO~
o
o
o O 0
o o
135 180
WIND DIRECTION (degree)
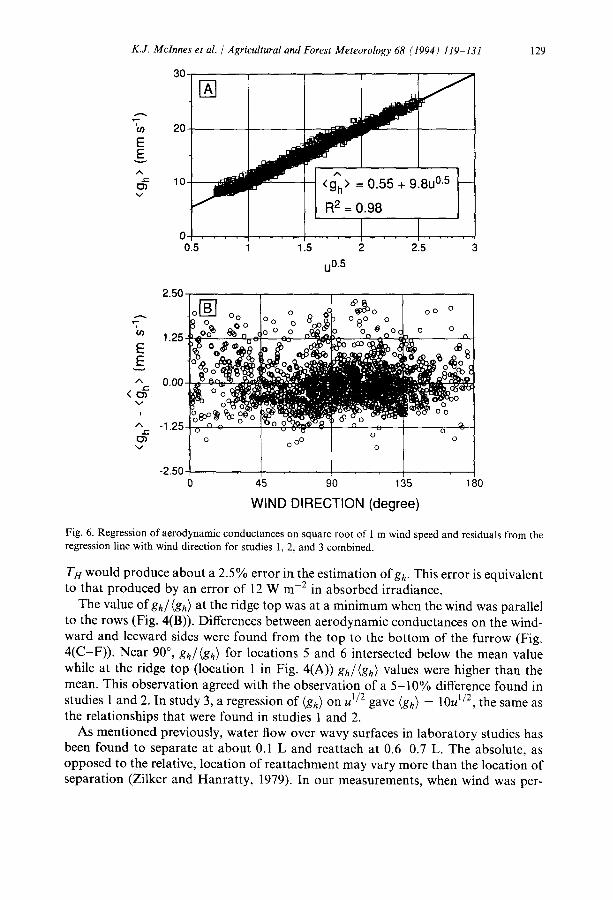
Fig. 6. Regression of aerodynamic conductances on square root of 1 m wind speed and residuals from the regression line with wind direction for studies 1, 2, and 3 combined.
TH would produce about a 2.5% error in the estimation ofg h. This error is equivalent to that produced by an error of 12 W m -2 in absorbed irradiance,
The value ofgh/(gh) at the ridge top was at a minimum when the wind was parallel to the rows (Fig. 4(B)). Differences between aerodynamic conductances on the wind- ward and leeward sides were found from the top to the bot tom of the furrow (Fig, 4(C-F)) . Near 90 °, gh/(gh) for locations 5 and 6 intersected below the mean value while at the ridge top (location 1 in Fig. 4(A)) gh/(gh) values were higher than the mean. This observation agreed with the observation of a 5 -10% difference found in studies 1 and 2. In study 3, a regression of (gh) o n u 1/2 gave (gh) ---- 1 0 u l / 2 , the same as the relationships that were found in studies 1 and 2.
As mentioned previously, water flow over wavy surfaces in laboratory studies has been found to separate at about 0.1 L and reattach at 0.6-0.7 L. The absolute, as opposed to the relative, location of reattachment may vary more than the location of separation (Zilker and Hanrat ty , 1979). In our measurements, when wind was per-
130 K.J. Mclnnes et al. : Agricultural and Forest Meteorology 68 (1994) 119 131
pendicular to the row (180 °) a sharp decrease in g h / ( g h ) occurred at the first leeward location (location 9 in Fig. 4(A)) (Fig. 5(A)). Sensor 9 was located at 0.11 L downwind from the ridge top, the area where separation may have begun. By 0.66 L. g h / ( g h ) was near unity. A similar phenomenon occurred when the wind was at 4 5 or 135 '~ (Fig. 5(B)).
For all studies combined, the relationship between (gh) and u 1/2 was linear (Fig. 6(A)). The intercept was small, but significantly (P = 0.5) different t¥om 0. No apparent relationship existed between the residual (gh) -- (gh) and wind direction (Fig. 6(B)). McInnes et al. (1991) found that variability in the shape of wind profiles above r idge-furrow tilled soil with wind direction could be accounted for with either variations in d or z0. They calculated that there would be very little influence of wind direction on the aerodynamic conductance determined from wind profiles ( k 2 u / [ l n ( ( z - d)/z0)] 2) when z 0 was held constant and d allowed to vary with wind direction. On the other hand, when d was held constant and z 0 allowed to vary with wind direction, large variations (72%) in the aerodynamic conductances were calcu- lated. Because of the tack of influence of wind direction on (gh), our measurements suggest that z0 should be held constant and d allowed to vary when calculating aerodynamic conductances above a ridge furrow tilled soil. Variability in the aero- dynamic conductance along the r idge-furrow surface then could be partitioned with the information given in Figs. 3~-5.
In summary, it would seem prudent to assign spatially dependent aerodynamic conductances from the surface to the atmosphere when modeling two or three dimen- sional energy and mass transport in r idge-furrow systems, especially when the pre- dominant winds are not parallel to the ridge orientation.
References
Armbrust, D.V., Chepil, W.S. and Siddoway, F.H., 1964. Effects of ridges on erosion of soil by wind. Sol! Sci. Soc. Am. Proc., 28:557 560.
Bailey, R.T., Mitchell, J.W. and Beckman. W.A., 1975. ('onvective heat transfer from a desert surface..! Heat Transfer, 97:104 1(/9.
Buckles, J., Hanratty, T.J. and Adrian, R.J., 1984. Turbulent flow over large-amplitude wavy surfaces..t Fluid Mech., 140: 27-44.
Chen, T.S., Sparrow, E.M. and Mucoglu, A., 1977. Mixed convection in boundary layer llow on a horizontal plate. J. Heat Transfer, 99: 66- 71.
Goldstein, R.J., Sparrow, E.M. and Jones, D.C., 1973. Natural convection mass transfer adjacent t~, horizontal plates. Int. J. Heat Mass Transfer, 16:1025 1034.
Hagen, L.J. and Armbrust, D.V., 1992. Aerodynamic roughness and saltation trapping efficiency of tillage ridges. Trans. Am. Soc. Agr. Eng., 35:1179 1184.
Karniadakis, G.E. and Orszag, S.A., 1993. Nodes, modes and flow codes. Phys. Today, 46:34 42. Kays, W.M. and Crawford, M.E., 1980. Convective heat and mass transfer. McGraw-Hill, New York,
420 pp. Lloyd, J.R. and Moran, W.R., 1974. Natural convection adjacent to horizontal surface of various plan-
forms. J. Heat Transfer, 96: 443--447. Mahrer, Y., 1982. A theoretical study of the effect of soil surface shape upon the soil temperature profile.
Soil Sci., 134:381 387.
K.J. Mclnnes et al. / Agricultural and Forest Meteorology 68 (1994) 119-131 131
Mahrer, Y. and Avissar, R., 1985. A numerical study of the effect of soil surface shape upon the soil temperature and moisture regimes. Soil Sci., 139: 483-490.
Mclnnes, K.J., Heilman, J.L. and Gesch, R.W., 1991. Momentum roughness and zero-plane displacement of ridge-furrow tilled soil. Agric. For. Meteorol., 55: 167-179.
Nieber, J.L., 1982. Finite element analysis of soil moisture flow and moisture stress in a desiccating soft. In: K.P. Holtz (Editor) Finite elements in water resources. Proceedings of the 4th international conference on finite elements in water resources, Hannover, Germany, June 1982. Springer, Berlin, pp. 13 22.
Radke, J.K., 1982. Managing early season soil temperatures in the northern corn belt using configured soil surfaces and mulches. Soil Sci. Soc. Am. J., 46: 1067-1071.
Sharratt, B.S., Schwarzer, M.J., Campbell, G.S. and Papendick, R.I., 1992. Radiation balance of ridge- tillage with modeling strategies for slope and aspect in the subarctic. Soil Sci. Soc. Am. J., 56:1379 1384.
Shewen, E.C., Hollands, K.G.T. and Raithby, G.D., 1989. The measurement of surface heat flux using the peltier effect. Trans. Am. Soc. Mech. Eng., 111: 798-803.
Tanner, C.B. and Shen, Y., 1990. Water vapor transport through a flail-chopped corn residue. Soil Sci. Soc. Am. J., 54: 945-951.
Thomas, H.R., 1985. Modeling two-dimensional heat and moisture transfer in unsaturated soils, including gravity effects. Int. J. Num. Anal. Methods Geomech., 9: 573-588.
Vining, K.C., 1988. Two-dimensional energy balance model for ridge-furrow tillage. PhD dissertation, Texas A&M University, College Station (Dissertation Abstract 89-13462).
Zilker, D.P. and Hanratty, T.J., 1977. Influence of the amplitude of a solid wavy wall on a turbulent flow. Part 1. Non-separated flows. J. Fluid Mech., 82: 2951.
Zilker, D.P. and Hanratty, T.J., 1979. Influence of the amplitude of a solid wavy wall on a turbulent flow. Part 2. Separated flows. J. Fluid Mech., 90: 257-271.
Recommended