Advice on the Opportunity to Set up an Action Plan for the Promotion of
LNG Chain Investments
- Economic, Market, and Financial Point of View -
FINAL REPORT
Chair of Energy Economics and Public Sector Management, Dresden University of Technology Prof. Dr. Christian von Hirschhausen Dr. Anne Neumann Dipl.-Wi.-Ing. Sophia Ruester Danny Auerswald
Study for the European Commission, DG-TREN Contracting party: MVV Consulting
Dresden, May 2008

2
Table of Contents Executive Summary ................................................................................................................................ 4 1 Introduction ................................................................................................................................... 10 2 Economic Point of View ............................................................................................................... 10
2.1 Supply and demand forecasts............................................................................................... 10 2.1.1 Demand............................................................................................................................ 10 2.1.2 Supply.............................................................................................................................. 11
2.2 Economics of LNG .............................................................................................................. 12 2.2.1 LNG versus pipeline transportation................................................................................. 13 2.2.2 Globalization of natural gas markets ............................................................................... 14 2.2.3 Prices, wholesale markets, and the emergence of a global natural gas market ............... 16
3 Market and Regulatory Point of View........................................................................................... 17 3.1 Security of supply issues...................................................................................................... 17
3.1.1 The “optimal” level of supply security............................................................................ 18 3.1.2 Applications..................................................................................................................... 21
3.2 Quality issues ....................................................................................................................... 22 3.2.1 Different qualities as a market barrier ............................................................................. 22
3.3 Regulatory issues ................................................................................................................. 25 4 Financial Point of View................................................................................................................. 25
4.1 Overview: investment in LNG regasification terminals is forthcoming .............................. 25 4.2 Case study: data ................................................................................................................... 27 4.3 Traditional NPV approach ................................................................................................... 29 4.4 Real options approach.......................................................................................................... 29
5 Conclusion..................................................................................................................................... 30 6 References ..................................................................................................................................... 30

3
Figures Figure 1: Long-term natural gas demand projections for the EU.......................................................... 11 Figure 2: LNG value chain.................................................................................................................... 12 Figure 3: Cost structure along LNG value chains ................................................................................. 13 Figure 4: Break-even of LNG and pipeline transportation.................................................................... 14 Figure 5: „Old world of LNG“ – bilateral relationships........................................................................ 15 Figure 6: „New world of LNG“ – globalization of natural gas markets ............................................... 16 Figure 7: Optimal level of supply security ............................................................................................ 18 Figure 8: Marginal damage function at various levels of supply disruption ......................................... 19 Figure 9: Combination of emergency supply strategies ........................................................................ 20 Figure 10: One importer – one exporter case ........................................................................................ 20 Figure 11: One importer – two exporters case ...................................................................................... 21 Figure 12: UK versus Poland versus Lithuania..................................................................................... 22 Figure 13: Heat content of LNG suppliers ............................................................................................ 23 Figure 14: Wobbe-Index and HHV of various importing and exporting regions.................................. 24 Figure 15: Development of regasification capacities ............................................................................ 26 Figure 16: Location of the considered LNG terminal ........................................................................... 27 Figure 17: Real option values in million EUR ...................................................................................... 30
Tables Table 1: Development of regasification capacities in Spain and the UK.............................................. 26 Table 2: Input parameters case studies.................................................................................................. 28
Boxes Box 1: Aspects of supply security ......................................................................................................... 17 Box 2: Wobbe Index ............................................................................................................................. 23

4
Executive Summary
The task
1. This study discusses opportunities to set up an Action Plan at the EU level for the promotion of
liquefied natural gas (LNG) chain investments. The study has been commissioned by MVV
Consulting, the general contractor of DG TREN, on behalf of DG TREN (units C1, C2) to
Professor Christian von Hirschhausen. The study also takes into account previous research in the
joint EE2-DIW program on “The Globalization of Natural Gas Markets”, mainly from Dr. Anne
Neumann and Sophia Ruester. The focus of the study is on the economic, market, and financial
point of view.
Economic point of view
2. From an economic point of view, there seems to be no major problem that would justify an
Action Plan. LNG plays an important role for the supply of Europe with natural gas, and it is also
an essential building stone to promote the establishment of a global market for natural gas. Global
natural gas supplies to Europe are sufficiently available for pipeline gas and LNG. The
globalization of natural gas markets is beneficial to supply security; it also means, however, that
Europe will compete with North America and Asia for natural gas “at the margin”.
3. In the perspective of 2030, pressure on prices may cease due to declining demand for natural gas.
Taking current climate policy goals serious natural gas must be considered as a “dirty” source of
energy, since it emits about 350 g CO2/kWh. In a world with predominant carbon capture, natural
gas will not be competitive with clean coal. Indeed, recent forecasts of natural gas in the low
carbon scenarios (IEA, WETO) forecast a demand decrease in the EU. Likewise, EIA forecasts of
US natural gas demand have been significantly downgraded in recent years. The DG TREN
“European Energy and Transport Trends 2030 – Update 2007” is likely to reflect this turnaround,
too, in its upcoming scenario on the 2020 targets set by the 2007 European Council.
4. The value-added chain of LNG consists of 1) upstream natural gas production and transportation,
2) liquefaction, 3) shipping, 4) regasification, 5) storage, transmission and distribution. Steps 1) to
3) are generally outside the reach of the European Union. While shipping is a potentially
competitive activity, natural gas production and liquefaction have come under the increased
suspicion of oligopolistic behavior recently (danger of a “GasPEC”). Prices for LNG deliveries
have increased since 2002. However, when compared to the regional (monopolistic) markets of
the 1990s, there are now more market participants and a global market is emerging. It seems that
there is little the European Union can or should do to affect the structure of the upstream LNG
market beyond the activities it is already pursuing, i.e. strategic energy partnerships.
5
Market and regulatory point of view
5. From a market and fiscal federalist perspective, an Action Plan at the Community level is
justified: i) if there is a significant market failure along the LNG chain, or in natural gas or energy
supply at large, that can be remedied by public action without running the risk of state failure; and
ii) if this action is implemented more efficiently at the Community level, rather than at the level
of member states, or still at another constitutional level. Regarding the first aspect, market failure,
we have identified three issues:
• Supply security as a public good;
• Quality asymmetry which may hinder market integration;
• Regulatory issues towards the completion of the European internal market for natural
gas that would favor supply security.
6. The main motivation to enquire about an Action Plan for LNG is to strengthen supply security of
natural gas (see study outline). In this context it is important to note that supply security is not an
objective state of the world that can or can not be attained. Rather, there are different levels of
supply security, and each of these states is related to costs. A supply disruption induces damages
to the economy, private businesses, and households. To avoid this or keep costs low, agents can
diversify their energy supply. The optimal level of supply security is provided when the sum of
expected damage costs, security costs, and administrative costs is minimized. In other words,
options to diversify supplies determine the costs of supply security interruptions. For countries
with a diversified LNG portfolio or diversified pipeline gas supplies (such as the UK or Spain),
these costs are low. Exceptions are new EU member states in Central and Eastern Europe that
depend on one country for natural gas supplies. In these countries, building an LNG regasification
terminal may increase the resilience against supply disruptions. The price risk, however, remains.
We conclude that security of supply with respect to natural gas (LNG and pipeline) is not really
in danger provided the internal market works. A look at the regional level shows that the potential
impact of an Action Plan varies significantly: thus, some of the new member countries of Central
and Eastern Europe might benefit from specific action to increase their supply security. This
might consist of LNG terminals, but also from inverting pipeline capacity to accommodate
imports from the West.
7. Different quality specifications for LNG do exist, but the potential market disturbance is limited
to the UK. The Wobbe Index of most of the LNG imported to Europe corresponds to the range
defined in the European Association for the Streamlining of Energy Exchange (EASEE). In
addition, the energy content can be modified at the receiving facilities at relatively low cost: the
energy content can be decreased by adding nitrogen, and it can be increased by injecting propane.
Some standardization of LNG qualities may make sense, but it is questionable whether an EU-
wide Action Plan is the appropriate instrument to achieve this.
8. The downstream part of the LNG chain (regasification terminals, storage, transmission and
distribution) is currently undergoing a major institutional change given the implementation of the

6
Acceleration Directive 2003/55/E, and the proposed 3rd Package. A long-term Action Plan needs
to assume that both pieces of legislation to be implemented, which will relieve some of the
inefficiencies currently hindering the development of an internal market for natural gas. This
relates particularly to the vertical separation between natural gas trading and transmission
pipelines, non-discriminatory access to the transmission grid, regulated access to storage, and the
emergence of a truly functioning internal market. The separation of natural gas trading and
natural gas transportation in the form of ownership unbundling is a requirement to create
competitive wholesale markets. Access to storage should be regulated where it is in a dominant
market position, and opened to merchant storage investment.
Financial point of view
9. Part 3 of the study finds that financing is no major obstacle to LNG regasification terminal
developments in the EU. A case study of a representative LNG regasification project shows that
as long as the appropriate institutional framework is in place, this investment is highly lucrative.
Bilateral discussion with industry representatives have confirmed that financing is no barrier to
the development of LNG receiving facilities in Europe. This is shown both by the large number
of LNG regasification projects under way or planned in Europe, in particular in the UK and
Spain. Therefore it does not seem to be necessary to extend the instruments of financial support
by the EU beyond the existing framework. The main obstacle to the development of
regasification terminals is resistance at the local level.
10. The case study of a commercial terminal (South Hook, UK) confirms that these projects have
high rates of return, in particular if one included the real option value of building the terminal at a
later point in time. The case study indicates that there should be no problem concerning
investment incentives for European LNG regasification terminals. South Hook in the UK shows a
positive net present value.
11. Employing the traditional net present value approach disregards a number of relevant factors. If
the decision-maker has flexibility, and hence the opportunity to delay the investment in the
regasification terminal, it is possible to broaden the scope. The real option value, i.e. the value of
waiting, is highly positive for South Hook, so a delay of the investment decision is advisable to
await higher natural gas prices.
Assessment
12. We conclude that from an economic, market, and financial point of view, there is a limited case
for an LNG Action Plan at the EU level. If asked to provide a quantitative assessment on the need
for an Action Plan, it would be located it in the range of 30%. In case an Action Plan is adopted,
it should target the development of the internal market and European-wide competition, and
specific problems of supply security in some of the new member countries of Central and Eastern
Europe.

7
Answers to the questions in the Terms of References for Part II-C of the study
1, 2, 3) Growth of LNG demand in the next years and costs along the value chain
Long-term natural gas demand projections for the EU are shown in Figure 1 (page 11). The share of
LNG in import demand is likely to rise significantly at the EU level. Due to the uncertainty to
forecast private and public company behavior, it is not possible to predict a global investment figure.
Figure 3 (page 13) shows the main costs foreseeable along the LNG value-added chain for different
relations. Cost decreases realized during the 1990s, mainly due to economies of scale along the value
added chain, have been partly absorbed in recent years owing to rising raw material prices and
competition for skilled labor. Investors frequently announce cost-overruns and time delays (e.g.
Snovhit project Norway).
The optimal size for an LNG regasification terminal depends on various region specific factors such
as the structure of the downstream transmission network, the location of the terminal relative to
demand centers, seasonality of demand, etc.. The Figure below shows the nominal capacities of
European LNG regasification plants (including greenfield projects and existing/planned expansions).
The capacities vary considerably and there seems to be no preferred “optimal” size by industry.
Nominal capacity of European LNG regasification terminals
0
1
2
3
4
5
6
7
x < 3 3 ≤ x < 4 4 ≤ x < 5 5 ≤ x < 6 6 ≤ x < 7 7 ≤ x < 8 8 ≤ x < 9 9 ≤ x < 10 x > 10
Nominal capacity x in bcm/a
Num
ber
of te
rmin
als
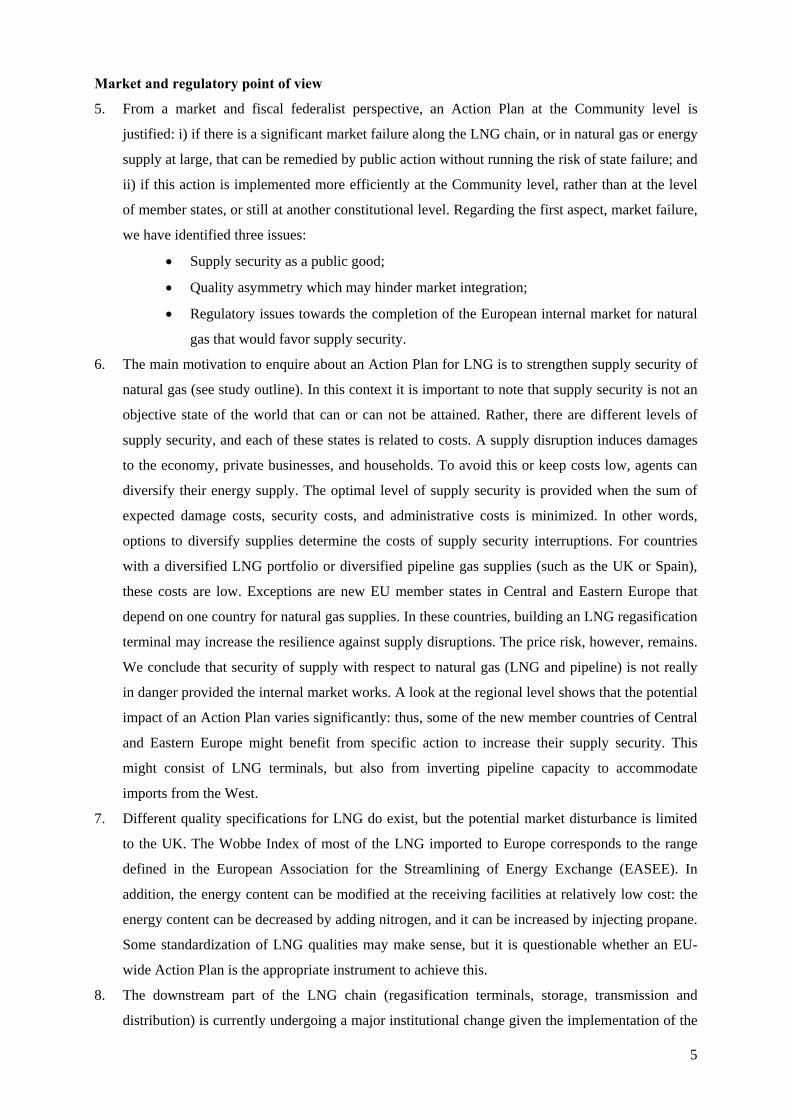
In midstream transportation we observe a trend towards two main types of vessels: Standard
transportation ships have a capacity of 135,000 to 148,000 m³. Furthermore, a number of super size
vessels are under construction (see Figure “LNG vessel capacities” below). These very large vessels
(with a capacity of up to 270,000 m³) will serve e.g. for LNG deliveries from Qatar to the UK, an
integrated project of ExxonMobil in cooperation with QatarPetroleum. However, these vessels will
8
not be able to land at every LNG regasification terminal due to capacity constraints and port
characteristics.
LNG vessel capacities
0
50,000
100,000
150,000
200,000
250,000
300,000
1960 1970 1980 1990 2000 2010
cubi
c m
eter
OperatingOrdered
4) Competition between LNG and piped natural gas
See Figure 4 (page 14); it is generally estimated that the break-even point of LNG and piped gas has
moved to the left in the last years, i.e. towards more competitive LNG for shorter distances.
5, 9) LNG investment decisions, appropriate margins
The main criteria which govern LNG investment decisions are the long-term rate of return and – in
the case of an integrated company – the possibility to arbitrage between different supply options (be
it LNG or pipeline natural gas). Long-term contracts play an important role for this decision,
especially in order to secure capital intensive upstream greenfield investments. However, one
observes increasing rates of capacity of LNG regasification terminals that can also accommodate
shorter-term supplies (“flexible” LNG); on the exporting side for example, liquefaction projects such
as Oman LNG reserve a part of the capacity for short-term deliveries.
There is a significant number of terminals under construction or planned, mainly by private
investors. It seems as if the private sector is engaging in investment activity and no financial support
beyond the existing framework seems to be required. The solvency of the companies involved is
sufficient securing downstream investments; bilateral discussions with industry representatives have
confirmed that financing is no barrier to the development of LNG receiving facilities in Europe.
6) Net regasification margins and optimal internal rate of return
There is no reliable information on this issue available.

9
7) Conditions to lead to a European natural gas price
Liquid trading places, secondary markets for transportation, and access to transportation and storage
infrastructure are important. The completion of the European internal market for natural gas should
lead to a European price. At present, this is not happening due to an insufficient implementation of
the Directive 2003/55/EC, in particular with regard to cross-border trading, equal access to
infrastructure capacity, and a lack of primary and secondary markets thereof.
8) LNG terminal connection to underground storage
It is important that LNG receiving terminals have flexibility in processing their natural gas. On-site
storage in tanks is relatively expensive, so access to underground storage plays an important role in
determining the financial structure of projects and to make use of arbitrage. A strong seasonality in
demand further enhances the need for underground storage capacities. Storage can also ensure
security of supply in times of severe crisis. Access to underground storage infrastructures should be
regulated, since this is often an essential facility; where this is not the case, merchant storage should
be allowed to develop freely.
10) LNG Action Plan justified?
We conclude that from an economic, market, and financial point of view, there is a limited case for
an LNG Action Plan at the EU level. If asked to provide a quantitative assessment on the need for an
Action Plan, it would be located it in the range of 30%. In case an Action Plan is adopted, it should
target the development of the internal market and European-wide competition, and specific problems
of supply security in some of the new member countries of Central and Eastern Europe.

10
1 Introduction The increasing importance of LNG in the European natural gas supply portfolio in order i) to bring in
additional natural gas volumes and ii) to diversify supply sources has led to considerations on the
interoperability of LNG facilities and interchangeability of natural gas. Further, the study addresses
the question whether there is a need for a European LNG Action Plan. This report investigates – as
one of four expert opinions of the second part of the study – economic, market, and financial issues.
The study is structured in three main parts: in the Section 2 we address economic issues, focusing on
supply and demand forecasts as well as the economics of LNG. Section 3 discusses potential market
failures in the industry and the regulatory responses. Section 4 is dedicated to the financial point of
view and a case study is calculated based on traditional net present value and real options approach. In
particular, we ask whether investments into regasification capacities in the LNG chain are financially
viable, and whether financial incentives should be provided by the Community, e.g. in the Priority
Interconnection Plan, or EIB-credits. Section 5 concludes.
2 Economic Point of View
2.1 Supply and demand forecasts
In a mid-term perspective up to 2030, increasing natural gas demand is facing declining domestic
production. LNG plays a key role in order to fill the future gap in the supply-demand balance.
Furthermore, an increase in diversification of energy sources and transit routes increases the security
of supply.
2.1.1 Demand
EU-27 natural gas demand in 2006 accounted for 545 bcm. There is a high uncertainty about future
demand development. Figure 1 compares different forecasts based on varying scenarios, including the
updated “European Energy and Transport Trends to 2030” baseline scenario published by the
European Commission in 2007. In the mid-term, until 2020, these forecasts remain relatively similar
expecting a demand level between 550 and 670 bcm. However, things change in the longer-term. For
the period up to 2030, the highest scenario (IEA reference case) and the lowest scenario (WETO
carbon constraint case) differ by 200 bcm.
However, the perspective changes once considering the recent evolution of forecasts, and once taking
serious the engagement on climate change policies at the national and EU levels. Taking current
climate policy goals serious natural gas must be considered as a “dirty” source of energy, since it emits
about 350 g CO2/kWh. In a world with predominant carbon capture, natural gas will not be
competitive with clean coal. Indeed, recent forecasts of natural gas in the low carbon scenarios (IEA,
WETO) forecast a demand decrease in the EU. Likewise, EIA forecasts for US natural gas demand are
significantly downgraded in recent years. Therefore, the supposed gap between supply and demand
may turn out to be much less significant than currently expected. Natural gas may turn out to become a

11
“sunset”-industry, far from the “transition fuel” it was considered to become a decade ago. These
projections concur with the majority of current studies of generation costs that find coal-fired plants to
be the most competitive technology at current fuel and carbon prices (IEA, 2006).1
Figure 1: Long-term natural gas demand projections for the EU
400
450
500
550
600
650
700
750
800
2000 2010 2020 2030
bcm
WETO (reference case) WETO (carbon constraint) WETO (H2)
DG TREN (reference case, 2007) DG TREN (soaring price, 2005) IEA (reference case)
IEA (low carbon)
Source: Based on data from DG TREN, IEA, WETO2
2.1.2 Supply
There is no serious concern about the long-term supply of natural gas, but prices may stay high. More
than half (57%) of total EU-27 demand in 2006 has been imported from foreign suppliers.3 Member
states are unlikely to expand domestic production significantly, as major suppliers in North-western
Europe report declining production rates (e.g. UK). Even though pipeline deliveries will continue to
dominate, LNG plays an increasing role for EU natural gas supplies. In some African countries
liquefaction capacities are extended; some countries have additional export potentials (such as
Nigeria). However, these countries face increasing domestic demand, which in turn may influence
future export volumes. Furthermore, political instability interferes with security of supplies. Large
natural gas export potentials exist in the region of the Middle East; Qatar has been rapidly expanding
1 Nevertheless, competition between gas and coal for electric generation is more complex than appears at first sight. Ellerman (1996) identifies sunk cost as one of the main drivers of fuel choice, while Johnson and Keith (2004) argue that investment decisions as mitigation options in an uncertain world are mainly driven by price volatility in natural gas and the price of emissions. 2 Note that the WETO-figures also include the European countries that are not part of EU 27. 3 Russia accounted for the largest share (130 bcm), followed by Norway (84 bcm), Algeria (56 bcm), Nigeria (11 bcm), Egypt (8.5 bcm), Libya (8.5 bcm), and the Middle East.

12
its liquefaction capacities, further expansions are planned; other countries (such as Iran) plan to enter
the market.
However, in times of increasing natural gas demand worldwide, we observe a global competition for
world natural gas supplies. In the Atlantic Basin Europe competes with North America for African as
well as South American supplies; the Middle East (accounting for more than 40% of worldwide
proven natural gas reserves) is currently evolving to a swing producer; deliveries to European and
Asian markets and even to North America are feasible without a significant difference in
transportation cost. According to Stern (2007), it is difficult today to find any new large scale long-
term contract which could start deliveries before 2015. In today’s sellers’ market new entrants have
difficulties in finding an upstream contracting partner.
Recent discussions on a potential “GasPEC” further increase the debate on supply security. The Gas
Exporting Countries Forum (GECF) mainly includes LNG exporters (Algeria, Qatar, Trinidad); since
2007 also Russia participates in the organization. Experts are split whether the GECF would have a
cartel-power similar to OPEC. In any case, upstream market power is a problem for European natural
gas supply. In this context, the intensification of energy dialogue is useful but it is unlikely to resolve
the issue completely. As the history of OPEC shows, European and other consumers will need to live
with imperfectly competitive commodity markets in natural gas, too.
2.2 Economics of LNG
Figure 2 depicts the five stages of the LNG value chain: after exploration and production (stage 1),
natural gas is transported via pipeline to liquefaction facilities where it is cooled to -160°C (113K)
under atmospheric pressure (stage 2) and shrinks to about 1/600 of its volume. Next, the liquefied gas
is loaded into tankers containing a complex cooling system essential to keep the gas liquid during
shipment to the destination countries (stage 3).4 Upon arrival, tankers are off-loaded to terminals that
reconvert the LNG to its original state of aggregation (stage 4). Finally, natural gas is fed into the
destination country’s pipeline grid, traded and sold to marketers, distributors, or power producers
(stage 5), or stored for future demand.
Figure 2: LNG value chain
Source: Own illustration
4 Transportation infrastructure is a substantial element linking exporting and importing projects. In contrast to oil shipping, vessels for LNG transport remain dedicated assets for specific routes booked under extensive long-term contracts. However, an increasing number of vessels for uncommitted trade are now on the order books of shipyards and these will reduce dedicated asset specificity.
Exploration & Production Liquefaction Transport
Sales or Storage Regasification
Midstream Upstream Downstream

13
2.2.1 LNG versus pipeline transportation
Investment costs within the five stages vary significantly. Exploration and production account for 15-
20% of the total costs of the LNG value chain; liquefaction for 30-45%; shipping for 10-30%; and
regasification for 15-25%. Costs vary widely from one value chain to another; exact figures depend on
factors such as distance, traded volumes, local conditions including construction costs, port
configuration, and site conditions (see Figure 3).
Significant cost reductions could be realized during the last two decades along all stages of the value
chain of LNG production due to technological innovations, economies of scale,5 etc. and reached a
level where LNG is able to compete for pipeline supplies. Recent price increases in raw materials and
increasing investment activities led to a certain re-escalation of investment costs: whereas investment
costs for liquefaction facilities where in the range of 400 million USD per mtpa in the 1990s, they
decreased to about 200 million USD per mtpa and re-escalated to levels at 500-800 USD per mtpa
recently according to industry experts.
Figure 3: Cost structure along LNG value chains
0
1,000
2,000
3,000
4,000
5,000
6,000
7,000
8,000
Trinidad to U.S.(brown-field)
Indonesia toJapan (green-
field)
Nigeria to U.S.(green-field)
Qatar to U.S.(brown-field)
Bolivia to U.S.(green-field)
CA
PEX
in m
illio
n U
SD
E&P Liquefaction T ransport Regasification & Distribution
Source: Own calculation based on Jensen (2003), adaptation of cost levels according to recent cost developments [Unfortunately, similar data on European relations is not readily available.]
LNG transportation generally is favorable to pipeline transportation for distances larger than 1,500 km
for large offshore pipelines (42’’; 29 bcm/a) and larger than about 3,000 km for large onshore
transmission lines (56’’; 31 bcm/a) as shown in Figure 4.
5 For example, the first liquefaction trains (Arzew in Algeria) had a capacity of 1.1 mtpa; today, trains with a capacity of 4 mtpa are common, and Qatar recently announced plans to construct units with 7.8 mtpa. Economies of scale of two 4 mtpa trains reduce the liquefaction cost of an 8 mtpa greenfield project with four 2 mtpa units by nearly 30%; an increase of one 7.8 mtpa unit leads to an additional 20% cost reduction (Jensen, 2003).

14
Despite recent price increases and the higher costs for LNG transportation for shorter distances
compared to pipelines, LNG is an attractive technology; on the one hand natural gas prices are at high
levels, too, allowing for adequate profits in the natural gas industry; and on the other hand LNG
contributes to diversification of energy sources and transit routes, hence, supporting supply security. It
is generally estimated that the break-even point of LNG and piped gas has moved to the left in the last
years, i.e. towards more competitive LNG for shorter distances.
Figure 4: Break-even of LNG and pipeline transportation
Source: Jensen (2004)
2.2.2 Globalization of natural gas markets
The globalization of natural gas markets favors security of supply, but also introduces competition
between previously separated regions. Converting natural gas to LNG for transportation by tanker has
been utilized for more than 40 years, but the industry achieved a remarkable level of global trade only
recently. Markets stayed regional in nature until the 1990s, Inflexible bilateral long-term contracts
with take-or-pay and destination clauses allocated price risks to the seller and volume risks to the
buyer (see Figure 5). During the last two decades, large investments along all stages of the value chain
have been realized; new players – countries as well as companies – entered the industry and the LNG
technology supports the globalization of formerly regional markets (i.e. Europe; North America; Asia
Pacific). Contracts gain in flexibility, contract duration decreases (Neumann and Hirschhausen, in
print) and spot markets gain in liquidity.
Today, LNG is responsible for supplying the US, the UK, Spain, South Korea, India, and China
among others. The Middle East accounts for more than 40% of worldwide proven natural gas reserves
and is expected to become the largest regional exporter of LNG.

15
Changes in the institutional framework (from monopolistic structures to competition) in turn require
fundamental changes in the organizational behavior of market participants. Global mergers and
acquisitions, vertical and horizontal integration, and strategic partnerships have become routine today
(Ruester and Neumann, 2006). Global oil and natural gas producers and distributors are frequently
engaged in all stages of the LNG value chain. In addition, export projects are increasingly financed
and developed by private (and foreign) interests. Former downstream monopolists of natural gas are
finding their traditional markets challenged by the intrusion of oil and gas majors integrating into
import markets. Vertical integration in response to market deregulation features various drivers:
Upstream producers aiming to benefit from downstream margins, ownership of transportation
capacities to exploit arbitraging possibilities, distribution and power companies moving upstream to
ensure margins and supply security in a period of increasing global demand. Furthermore, non-
integrated merchants enter the industry and use their infrastructures as “tolling facilities” (particularly
in the US).
Figure 5: „Old world of LNG“ – bilateral relationships
Source: Own illustration
Typically inflexible bilateral LTC
Major import regions
Major export regions

16
Figure 6: „New world of LNG“ – globalization of natural gas markets
Source: Own illustration
2.2.3 Prices, wholesale markets, and the emergence of a global natural gas market
The development towards more international trading of natural gas has direct repercussions with the
pricing of the commodity. The increase in LNG trade provides the missing link allowing market
integration across regions, in particular across the Atlantic Ocean. The analysis of international spot
trading prices at Henry Hub (US) and NBP (UK) suggests an increasing convergence of spot prices on
either side of the Atlantic Basin (see Neumann, 2007). In addition, traditional pricing schemes are
being reviewed moving from long-term, often oil-price indexed natural gas prices towards prices
based on market mechanisms providing a better indicator of a gas-to-gas competitive market. The
restructured industry in Europe and North America features an increasing proportion of spot trading.
Transparent information on the market is provided by trade press and trading platforms for natural gas
thus favoring competition. Active arbitrage is observed in the Atlantic Basin, where LNG shipments
from Trinidad and Nigeria have been diverted either to the US or Europe depending on spot prices.
Arbitraging possibilities occur in cases when the price differential of a homogeneous commodity
exceeds transportation costs. The impact of these swaps and diverting activities on spot price in
countries where cargoes have been sent to has been modest. Nevertheless, underutilization of US
facilities during the main part of 2007 indicates the power of short term trading on the flow direction
of LNG vessels.
Curiously, though, there has not yet been a convergence towards a single European price for natural
gas. Quite on the contrary, even physically close regions such as Zeebrugge and Bunde have featured
wide price dispersion (see Neumann, et al., 2006). An increasing number of trading places in
Major import regions
Major export regions
17
Continental Europe (such as France, Spain, Italy, and Germany) would facilitate the management of
price risk. A liquid market is required to provide a standardized trading environment in which market
participants have full information. Introducing futures and options would deliver substantial certainty
under else volatile prices. Independent, commercial users along the value chain might thus achieve
planning certainty provided by futures and options markets. Regulatory reform in this direction is
urgent.
3 Market and Regulatory Point of View There are two market failures that apply to the LNG industry: the public good character of supply
security, and diverging quality standards. Neither seems to be sufficiently important to require an
Action Plan at the EU-level.
3.1 Security of supply issues
The discussion on supply security entails two very different aspects: Firstly, the supply of a country or
a region with energy resources, and its resilience against unexpected supply disruptions. This will be
the focus of our analysis here; and second the reliable supply of network infrastructure and services,
such as electricity generation and transmission or natural gas infrastructure. The supply uncertainty
problem represents a market failure of the externality type where the true social costs of non-secure
supplies are not reflected by the price.
The European discussion on supply security is fostered by various aspects, among them the effort to
finalize new contracts with upstream suppliers in a market where major consumers worldwide
compete for (the same) supplies, the peaking of domestic production in several countries (i.e. UK,
Netherlands), current record high energy prices (LNG spot cargoes to Japan have been delivered at
prices above the 19$/MBTU level in January 2008), or discussions about a GECF cartel.
The ongoing liberalization process of natural gas and electricity markets in Continental Europe is one
issue enhancing the discussion concerning supply security. We argue that liberalization is conducive to
supply security. A more competitive structure in the European natural gas market will not undermine
supply security of the EU, because competitive markets will provide efficient investment signals.
Ample availability of pipeline gas and the emergence of new LNG markets will lead to a more
diversified, rather than a more constrained, supply structure. There is no inherent conflict between
market liberalization and supply security as long as an appropriate regulatory framework is
implemented; spot trading and (“modern”) long-term contracts should be seen as complementary.
Box 1: Aspects of supply security
Supply security has something to do with two main components of concern: volumes and prices.
Concerning reliable supplies people fear potential supply disruptions due to upstream, midstream, or
downstream breakdowns. High levels of import dependency and the political instability of many
major suppliers support this fear; furthermore, national oil companies control a huge share of world

18
natural gas reserves (e.g. Gazprom, Sonatrach, Nigerian NPC, QatarPetroleum). Concerning prices
the risks lie in the very low short-term price elasticity facing highly volatile prices.
The concept of supply security should be understood as a concept of risk management. There may be
technical risks (such as a shortfall of infrastructure), political risks (such as a supply disruption by a
transit country), regulatory risks (instable institutional framework), physical risks (exhaustion of
resources), or economic risks (such as a lack of investment in capacities or excessive prices for
pipeline access).
Supply security can be regarded and evaluated from a number of perspectives: i) short-term
reliability of the system from long-term adequacy of investments; ii) regional levels: sub-national vs.
national vs. regional vs. world level; iii) economic perspective (costs of supply security; welfare, …)
versus from a (geo-) political perspective; iv) supply side versus demand side perspective; v) ex post
versus ex ante analysis.
3.1.1 The “optimal” level of supply security
If you asked an engineer what the optimal level of supply security was, he or she would most probably
answer “such that never constrains operation”. This line of reasoning neglects the fact that supply
security has a benefit – it allows the smooth production and consumption process – but that it also has
a cost. From an economic or a social welfare perspective, it is the optimal relation between the two
that determines the “optimal” level of supply security. More precisely: we want to equate “marginal
social benefit” and “marginal social cost”. The theoretically optimal level of supply security can be
determined by equaling the consumers’ marginal willingness to pay for extra supply and the social
costs of providing this extra security (see Figure 7). The marginal cost curve is flat over a wide area
and then rising steeply when remaining risks are expensive to deal with.
Figure 7: Optimal level of supply security
Source: Own illustration based on Nera (2002, 10)

19
Energy supplies subject to political, economic, or regulatory risks should receive a lower social
valuation than secure energy supplies. However, market prices are not able to reflect any security
premium. In order to address the question about a justifiable price premium for secure energy supplies
we will discuss a theoretical model dealing with optimal import dependence reduction programs (for
an application to the US oil market see Griffin and Steele, 1986, 221 ff.). This analysis is based on the
minimization of the sum of expected damage costs (due to a supply disruption), security costs (due to
the provision of extra supplies), and administrative costs such that social welfare is maximized.
Social costs are defined by the area under the marginal damage function (MDF) of a supply
interruption of a strategic commodity (e.g. oil or natural gas). The marginal damage function is sloped
downward; the marginal effect of the first unit of energy not delivered is less than the loss of the last
unit: low quantities of the resource can easily be replaced by another energy source, or by energy
efficiency measures, whereas these costs increase with the amount of natural gas withheld. The MDF
equals zero if all demand is satisfied by secure supply sources. In order to obtain an expected marginal
damage function, the absolute marginal damage has to be weighted with the probability corresponding
to the various durations of potential supply disruptions, leading to the expected MDF function (see
Figure 8).
Figure 8: Marginal damage function at various levels of supply disruption
Source: Own illustration based on Griffin/Steele (1986)
A country generally has several options to respond to a supply disruption (it can use strategic storage
in which it has invested previously, and can increase its domestic production of natural gas or of other
close substitutes).6 These measures are depicted by the marginal social cost curves (MSC) in Figure 9:
We define strategy A as the use of emergency storage, marginal security costs MSCA are rising in
quantity. Strategy B is defined as the increase of domestic production (e.g. the use of standby
capacities), with MSCB rising again. We further define strategy C as the combined use of both
measures and denote it MSCC.
6 Note that energy “conservation” is not an alternative, since the expected MDF curve already measures the costs of “forced” conservation.
Implicit premium per unit of secure energy ($)
Quantity of secure energy available
MDF during disruption
Expected MDF

20
Figure 9: Combination of emergency supply strategies
Soure: Own depiction following Griffin and Steele (1986, 224)
The first case to be investigated is the one importer – one exporter case, hence in the case of a supply
disruption no alternative imports are available. In Figure 10, Q is the total demand of the region under
investigation. A domestic production of 60% of total energy needs is assumed (0.6 Q). MSC0 indicates
a situation without any supply security strategy, a disruption of imports would reduce total supply to
the level of 60%. Total costs will equal damage costs (area OXY). Strategy C is the most preferable
strategy since employing both measures (storage as well as an increase in domestic production) yields
the lowest marginal costs for additional volumes of secure energy. Damage costs would be reduced to
the area (CC’Y), the costs for additional supplies account for the area (CC’O). MSCB indicates a
situation in which only domestic production is increased; this strategy is inferior to MSCC since the
remaining damage equals the area (BB’Y); security costs equal the area (BB’O).
Figure 10: One importer – one exporter case
Source: Own illustration based on Griffin/Steele (1986)
Things get slightly more involved when two exporters deliver to one importer. One exporter is
assumed to be reliable and always supplying energy at market prices, whereas the other is unreliable
Implicit premium per unit of secure energy ($)
Quantity of secure energy available 0.6 Q Q
MSC0 MSCB
O
X
C
Y C’
Expected MDF
B
B’
MSCC
MSCC MSCB
MSCA
Q Q Q
Costs ($) Costs ($) Costs ($)

21
and supply disruptions have a certain probability. In that case, the expected MDF does not change, but
the MSC does: First, it is shifted to the right by the amount that the reliable exporter provides in the
base case; and second, additional supplies can be purchased from the reliable supplier, albeit once
again at higher marginal costs than the non-emergency supplies. The aggregate MSC-function lowers
the social costs of a disruption (see MSCD in Figure 11).
We assume again 60% of total demand being produced domestically; and each supplier delivering
another 20%. A potential supply disruption of one supplier therefore would lead to a decline by only
20% of total supplies. MSC0 indicates a situation without any supply security strategy, a disruption of
imports would reduce total supply to the level of 80%. Total costs will equal the damage costs (area
OXY). MSCB indicates a situation in which only domestic production is raised; under MSCC storage
capacities are used and domestic supply is increased. MSCD indicates the case where an even more
extensive supply security strategy is followed: storage is used, domestic supply is increased and
furthermore, additional volumes are imported from the importer without disruption. Due to a further
decreasing marginal cost of extra supplies, this last strategy is the most efficient solution. Remaining
damage is reduced to the area (DD’Y); total security costs in this case equal area (DD’O).
Figure 11: One importer – two exporters case
Source: Own illustration based on Griffin/Steele (1986)
3.1.2 Applications
For countries with varying natural gas supply portfolios the marginal security cost curves have
significantly varying shapes. The UK, with a domestic production of 88% of total demand in 2006 and
a well diversified supply portfolio including pipeline as well as LNG deliveries, faces a quite low total
marginal security cost curve (MSCD=MSCtotal). In contrast, for a country like Lithuania (no domestic
production, total foreign deliveries originating from Russia) or Poland (only 30% domestic production,
major supplier Russia) the slope of MSCtotal will be much steeper (for a graphical illustration see
Figure 12). Lithuania’s only possibility to react to a supply disruption from the single supplier is the
Implicit premium per unit of secure energy ($)
Quantity of secure energy available 0.8 Q Q
MSC0 MSCB
O
X
C
Y C’
Expected MDF
B
B’
MSCC
MSCD
D
D’

22
use of storage whereas the UK would have a broad portfolio of possibilities reducing significantly
total security costs.
Figure 12: UK versus Poland versus Lithuania
Source: Own illustration
We conclude that supply security is a relative concept; the degree to which it is a critical issue varies
widely between countries. There are major differences in the supply portfolio of European countries.
Typically, Western European countries like the UK, Spain, or Italy have a significant share of
domestic production or at least a well diversified supply portfolio including pipeline as well as LNG
deliveries. In contrast, most Eastern European states, such as Lithuania, do not have the opportunity to
diversify there supply today, they heavily rely on one strong supplier.
3.2 Quality issues
The changing nature of the global natural gas market inhibits a trend towards globalization of formerly
regional markets, increasing importance of spot trade, and companies following a strategy of
investments in a portfolio of LNG export and import facilities. This is mainly to act more flexible and
to benefit from arbitrage possibilities. As a result, interchangeability and adaptation to varying natural
gas qualities and standards, in particular for the regasification terminals are required.
3.2.1 Different qualities as a market barrier
The Wobbe-Index is the single most important interchangeability parameter; in combination with a
secondary parameter (e.g. the High Heating Value) it ensures interchangeability of different gases. The
traditional three main importing regions can be classified by the quality of the imported LNG
(according to HHV and Wobbe-Index): Asian traditional importers (i.e. Japan and South Korea)
import rich LNG with high HHV (> 1090 BTU/scf); the US and UK networks contain natural gas with
a low HHV (< 1075 BTU/scf); Continental European terminals typically are able to accept LNG with
intermediate HHV (990 BTU/scf < HHV < 1160 BTU/scf).
Implicit premium per unit of secure energy ($)
Quantity of secure energy available 0.88 Q Q
MSC(Lithuania)total
Expected MDF
MSC(PL)total
MSC(UK)total
0.3 Q

23
In 2002, the European Association for the Streamlining of Energy Exchange (EASEE) has been
founded in order to develop and promote the simplification and streamlining of both the physical
transfer and the trading of natural gas across Europe. A common business practice has been passed in
2005, determining parameter standards for Wobbe-Index, sulphur-, oxygen-, and carbon dioxide
content, and relative density amongst others.

24
Figure 14 provides an overview on natural gas qualities in major natural gas importing regions (i.e.
Japan, North America, and EU) as well as the HHV for a number of major supplier countries.7
Figure 13: Heat content of LNG suppliers 35
,714
35,7
14
36,1
07 37,1
79 38,6
43 39,6
43
39,7
86
39,8
57
39,9
29
40,0
71
40,4
29
40,5
00
40,7
50
41,4
29
49,1
07
30,000
35,000
40,000
45,000
50,000
Norway
Egypt
Alaska
Trinidad
Algeria
(Skik
da)
NigeriaQatar
Algeria
(Arze
w)
Indonesia
Malaysia
Australi
aBrun
ei
Abu Dhabi
OmanLibya
Btu per m³
Source: Lukens (2003)
Box 2: Wobbe Index
The Wobbe Index (WI) is the main indicator of the interchangeability of fuel gases. If HHV is the
higher heating value (or calorific value) and sG the specific gravity, the Wobbe Index is defined as
sGHHVWI = .
The index is used to compare the combustion energy output of different fuel gases. For an identical
Wobbe Index and given pressure the energy output of two fuel gases will be identical.
7 These include (from the lowest values to the highest) Alaska, Trinidad and Tobago, Qatar, Indonesia (Bontang and Arun), Malaysia, Abu Dhabi, Algeria, Brunei, and Australia.

25
Figure 14: Wobbe-Index and HHV of various importing and exporting regions
Source: Own illustration based on Simmons (2005) and Kuipers (2007)
The first US LNG import terminals (i.e. Cove Point and Everett) have been constructed dedicated to
special suppliers (originally Algeria, later they also received deliveries from Nigeria and Trinidad). It
is relatively easy to equip facilities with special natural gas adaptation technology allowing for a
decrease (mainly necessary in the UK and the US) or increase (mainly Asian importers) of natural gas
quality in order to meet grid requirements; in the UK Grain LNG terminal, this is already the case:
adaptation of gas quality technically is feasible in both, liquefaction8 and regasification facilities: At
liquefaction terminals the heaviest components (LPGs = propane, butane) can be extracted making
complex LPG plants necessary. Even if these LPGs can be fully extracted, the remaining ethane
content may lead to a HHV above the acceptable value. The decrease of energy content at
regasification terminals is based on nitrogen injection (with air separation process needed). The
nitrogen content is limited to an upper value by the downstream natural gas network specifications
(5% UK, in general 3% US). In order to increase the energy content, propane can be injected.
Quality issues do play a role in the deployment of LNG in Europe, but that they can be resolved at
relatively modest cost. In countries that still have specific standards, such as the UK (appliances) the
quality issue is likely to be resolved “naturally” over time.
8 Due to increasing demand also in low HHV areas (namely UK, US) the adaptation at liquefaction facilities becomes necessary.
1240
1260
1280
1300
1320
1340
1360
1380
1400
1420
1440
1460
1480
920 940 960 980 1000 1020 1040 1060 1080 1100 1120 1140 1160 1180 1200 1220
Higher Heating Value (BTU/scf)
Wob
be In
dex
(BT
U/s
cf Japan
Mexico
US
California
EC (EASEE) LNG Exporters

26
3.3 Regulatory issues
The European regulatory framework for LNG regasification facilities plays an important role to
facilitate efficient and sufficient investment in infrastructure. The 3rd Package from the European
Commission acknowledges the need to develop a competitive and efficient natural gas market which is
far from complete. The proposal for amending existing legislation includes several measures that will
contribute to further achievements in this direction. Third party access to LNG facilities plays an
important role in achieving this goal. Clearly defined rules and a sustainable regulatory environment
for the use of these terminals are key to create an internal market.
A short-term supply disruption in a functioning internal market for natural gas will provide market-
based signals in a liquid wholesale market. Prices at these trading places will direct the flow of natural
gas to consumption centers where it achieves the highest value. The role of emergency procedures and
financial compensation thereof remains to be analyzed. Underground and LNG storage facilities can
provide additional flexible instruments to respond to short-term delivery disruptions. The long-term
adequacy of infrastructure investment, in particular importing, underlines the importance of additional
LNG regasification facilities.
In order to achieve diversification of imports and thereby reducing the risk of import dependence
initially requires substantial upfront investments. A well-developed competitive wholesale market
defines the timing and level of investment. Competitive, transparent markets deliver sufficient
information about supply and demand and therefore increase the resilience of the system. Information
on future market conditions supports investors in making economically rational decisions; more and
better information makes more efficient investments in infrastructure feasible. Competitive
(wholesale) markets and secondary trading support efficient reactions of market participants to price
movements. Taken together, these arguments indicate a positive relation between competitive markets
and supply security. Competition leads to a higher number of market participants, more diversification
of infrastructure, and attracts new investment thus improving supply security.
4 Financial Point of View
4.1 Overview: investment in LNG regasification terminals is forthcoming
Investments in LNG import capacity are forthcoming in all three importing regions worldwide, i.e. Europe, North America, and Asia. European nominal regasification capacity nearly doubled from 2000 (37 mtpa) to 2007 (72 mtpa), with capacity additions mainly in Spain and the UK. Further facilities are under discussion: Expansions at existing sites and in countries, not participating in the LNG business yet such as Germany, Croatia, and Poland.

27
Figure 15 illustrates the development of regasification capacities worldwide.
Table 1 provides data on LNG import capacity expansions in Spain and the UK, two countries facing
huge investments.

28
Figure 15: Development of regasification capacities
0
100
200
300
400
500
600
700
1964
1967
1970
1973
1976
1979
1982
1985
1988
1991
1994
1997
2000
2003
2006
2009
2012
mtp
a
Europe North America Asia
Source: Own depiction
Table 1: Development of regasification capacities in Spain and the UK
Terminal MS Start up Nominal capacity (mtpa)
Storage (m³) Operator
Huelva Phase I ES 1988 2.6 160,000 Enagas Huelva Phase II 2004 1 150,000 Enagas Huelva Phase III 2006 2.8 150,000 Enagas Cartagena Phase I 1989 3.8 160,000 Enagas Cartagena Phase II 2004 2 135,000 Enagas Cartagena Phase III 2007 1.1 135,000 Enagas Barcelona Phase I 1969 7.6 240,000 Enagas Barcelona Phase II 2005 2.9 150,000 Enagas Bilbao 2003 2.2 300,000 Bahia de Bizkaia Gas El Ferrol 2007 2.7 300,000 Regasificadora del Noreste SA Sagunto 2006 4.8 300,000 Planta de Regasification de
Sagunto Dragon/ Milford Haven
UK 2008 4.5 336,000 Dragon LNG Ltd.
Isle of Grain Phase I 2005 3.5 200,000 Grain LNG Ltd. Isle of Grain Phase II 2010 7 500,000 Grain LNG Ltd. Teeside (offshore) 2007 tba tba Excelerate South Hook Phase I 2008 7.8 465,000 South Hook Terminal Company
Ltd. South Hook Phase II 2010 7.8 310,000 South Hook Terminal Company
Ltd. Canvey Island Under
study tba tba Calor Gas

29
4.2 Case study: data
In this section we sketch out a methodology to assess the financial viability of LNG regasification
terminals. We assume that these terminals are managed commercially. Based on an assessment of the
profitability, we show that there should be no problem concerning investment incentives for European
LNG regasification terminals. Rather, these investments reach a high internal rate of return. Our case
study – South Hook currently under construction in the UK (see Figure 16) – is based on publicly
available sources (e.g. IEA Energy Prices and Taxes) and own data research.
Figure 16: Location of the considered LNG terminal
Calculating the Net Present Value (NPV) and the Internal Rate of Return (IRR), requires several
parameters. Some of these input factors are published in publicly available studies and surveys, others
are based on own estimations or assumptions. Table 2 summarizes input parameters and sources.
Investment costs account for 750 million USD for South Hook, equaling 535 million EUR (based on
an exchange rate of EUR/USD = 1.40). South Hook has a capacity of 10.5 bcm (378,000,000 MBtu);
in order to account for realistic capacity utilization, we work with an average capacity utilization of
150,000,000 MBtu.
The wholesale price for natural gas is used as benchmark for the feed-in price from the terminal into
the pipeline system. The natural gas price is 4.88 EUR/MBtu for the UK in the base year. LNG import
price as of August 2007 averaged 4.20 EUR/MBtu (UK). The spread between natural gas price and
South Hook, Milford Haven

30
LNG import price represents the profit margin of the LNG terminal. Both prices are assumed to
increase over time.9
Variable costs are included as follows: During the regasification process about 1% of the processed
gas is lost; hence 1% of natural gas import price represents these losses. Labor costs are calculated for
an estimated 15 workers per terminal. Wages are estimated at 40,000 EUR (UK), and the tax rate is
30%.
The cost-accounting interest rate has to be estimated. Due to the dependence on unknown financial
leverage of the companies we assume an equity ratio of one. To allow for the higher yield, the equity
yield rate is set up to 10% for the terminal.
Table 2: Input parameters case studies
South Hook, UK Sources
Investment costs 535 million EUR South Hook LNG Terminal Company Ltd., own data
Volume p.a. 150,000,000 MBtu South Hook LNG Terminal Company Ltd., own data
Price for natural gas 4.88 EUR/MBtu IEA Energy Prices and Taxes, 4Q2007
Price for LNG 4.20 EUR/MBtu IEA Energy Prices and Taxes, 4Q2007, August 2007 average
Price increase natural gas 0.96% p.a. EWI/Prognos: Die Entwicklung der Energiemärkte bis zum Jahr 2030
Variable costs Regasification requires 1% of processed gas
IEA, Natural Gas Transportation, 1998
Staff
15 employees; wages: 40,000 EUR/a
Own assumption, based on BP information
Tax rate 30% Tax rate for companies, survey of federal government
Calculatory interest rate 10% Depends on financial leverage, assumed for equity ratio 1
9 EWI/Prognos (2007) report in their study “ Die Entwicklung der Energiemärkte bis zum Jahr 2030“ an annual rise of 0.96% per year.

31
4.3 Traditional NPV approach
The model determines cash flows over a running period of 40 years. We use the Discounted Cash
Flow (DCF) method to calculate the NPV and internal rate of return. Depreciations are linearly split
over running time. Furthermore, the possibility of tax shields is ignored, i.e. there is no refunding of
taxes in case of a negative fiscal assessment basis. Cash flows are discounted by the assumed interest
rate and added up; these cumulated cash flows are offset by the investment costs for NPV calculation.
The internal rate of return equates to the interest rate resulting in a NPV of zero.
South Hook shows a positive NPV. With a value of 166 million EUR, it is highly economical and
legitimates the investment decision.
4.4 Real options approach
When employing the traditional NPV approach a number of relevant factors are disregarded. Due to
the static approach of determining cash flows, the decision-maker has to reach a now-or-never
decision. If the NPV of a considered project is positive, the investment will be carried out, otherwise it
will be discarded.
Flexibility of a decision-maker, hence the opportunity to delay the investment, broadens the scope. He
can await future developments, e.g. on prices or investment costs, to obtain more certainty related to
input parameters of the cost effectiveness study. Therefore, the now-or-never decision turns into a
wait-and-see decision of the project. The investment is delayed under the prospect of favorable
developments of prices or costs. This proceeding is represented by the real option approach (Dixit and
Pindyck, 1994).
To estimate this option value of waiting (delaying the investment decision), we develop several
scenarios concerning future natural gas price developments. With a certain probability (p=50%) the
natural gas price is assumed to rise with a given volatility of 20%; the price will decrease with a
probability of 25% (same volatility). With a probability of 25%, there is no additional change in
natural gas prices. The decision period is set at 5 years, so investments may occur in the base year
2005, in 2010, or in 2015. After 2015, the natural gas price is assumed to remain at the same level,
under consideration of annual price increases.
For estimating the potential value of postponing the investment and the value of the delay option, it is
necessary to calculate the NPVs of the five scenarios. These are compared to the NPV of the base
case. If the NPV of the new developed scenario is higher than the NPV of the base case the differential
expresses the value of the delay option and consequently the value of waiting. Therefore, in case of a
positive differential the option is exercised and the investment delayed for a certain number of periods.
We compute these option values for both terminals and each scenario. Results are summarized in

32
Figure 17.

33
Figure 17: Real option values in million EUR
For South Hook the real option value in later periods is highly positive, so a delay of the investment
decision is advisable to await higher natural gas prices.
This case study should be considered as representative, but not fully reflecting reality. Expert
discussions have confirmed the idea that financing does not constitute a major obstacle to the
investments in the LNG chain.
5 Conclusion We conclude that from an economic, market, and financial point of view, there is a limited case for an
LNG Action Plan at the EU level. If asked to provide a quantitative assessment on the need for an
Action Plan, it would be located it in the range of 30%. In case an Action Plan is adopted, it should
target the development of the internal market and European-wide competition, and specific problems
of supply security in some of the new member countries of Central and Eastern Europe.
6 References Dixit, Avinash K., and Robert S. Pindyck (1994): Investment under Uncertainty. Princeton University
Press, Princeton.
Ellerman, Denny A. (1996): The Competition between Coal and Natural Gas. Resources Policy, Vol.
22, No. 1/2, pp. 33-42.
Griffin, James M. and Henry B. Steele (1986): Energy Economics and Policy. Academic Press Inc.,
Orlando, Florida.
International Energy Agency (2006): World Energy Outlook. OECD, Paris.
International Energy Agency (2007a): World Energy Outlook 2007. OECD, Paris.
International Energy Agency (2007b): Energy Prices and Taxes, 4th Quarter 2007. OECD, Paris.
Jensen, James T. (2003): The LNG Revolution. Energy Journal, Vol. 24, No. 2, pp. 1-45.
Jensen, James T. (2004): The Development of a Global LNG Market. Is It Likely? If so, When? Oxford
Institute for Energy Studies, Oxford.

34
Johnson, Timothy L., and David W. Keith (2004): Fossil Electricity and CO2 Sequestration: How
Natural Gas Prices, Initial Conditions and Retrofits Determine the Cost of Controlling CO2
Emissions. Energy Policy, Vol. 32, pp. 367-382.
Kuipers, Edgar (2007): Interchangeability. Presentation.
Lukens Energy Group (2003): LNG Tutorial – Integrating LNG into the US Gas Grid.
Neumann, Anne and Christian von Hirschhausen (in print): Long-Term Contracts for Natural Gas - An
Empirical Analysis. Review of Industrial Organization, DOI: 10.1007/s11151-008-9165-0.
Neumann, Anne, Boriss Siliverstovs, and Christian von Hirschhausen (2006): Convergence of
European Spot Market Prices for Natural Gas? A Real-Time Analysis of Market Integration Using
the Kalman Filter (2006). Applied Economics Letters, Vol.13, No.11, 727-732.
Neumann, Anne (2007): Transatlantic Natural Gas Price Convergence - Is LNG Doing Its Job? TU
Dresden, Chair of Energy Economics Working Paper WP-GG-20.
Ruester, Sophia and Anne Neumann (2006): Corporate Strategies along the LNG Value Added Chain
- An Empirical Analysis of the Determinants of Vertical Integration. Dresden University of
Technology, Globalization of Natural Gas Markets Working Papers WP-GG-17.
Simmons and Company International (2005): Liquefied Natural Gas.
Stern, Jonathan (2007): European Gas Security: what does it mean and what are the most important
issues? Presentation at CESSA Conference, Cambridge, December 14, 2007.
Recommended