This thesis has been submitted in fulfilment of the requirements for a postgraduate degree
(e.g. PhD, MPhil, DClinPsychol) at the University of Edinburgh. Please note the following
terms and conditions of use:
This work is protected by copyright and other intellectual property rights, which are
retained by the thesis author, unless otherwise stated.
A copy can be downloaded for personal non-commercial research or study, without
prior permission or charge.
This thesis cannot be reproduced or quoted extensively from without first obtaining
permission in writing from the author.
The content must not be changed in any way or sold commercially in any format or
medium without the formal permission of the author.
When referring to this work, full bibliographic details including the author, title,
awarding institution and date of the thesis must be given.

Doctor of Philosophy
The University of Edinburgh
2018
Marlène Sophie Magalhaes Pinto
Adipose tissue macrophage heterogeneity and the role of Tim4+ macrophages in lipid homeostasis

i
Declaration
I hereby declare that all work carried out during this PhD was performed by myself, unless otherwise stated, under the supervision of Dr. Cécile Bénézech and Prof. Karen Chapman. This thesis has not previously been submitted for any other degree or qualification.
Marlène S. Magalhaes Pinto Date

ii
Acknowledgements First, I would like to thank Cécile Bénézech for her extraordinary support and
trust. Our meetings always nourished my thought process and developed my
motivation. You are a true inspiration for everybody, not only by your scientific
achievements but also the balance with your personal life, your kindness and your
remarkable spirit and intelligence. I would also like to thank Karen Chapman for her
great support, help and encouragement. It was greatly appreciated, coming from such
a remarkable person.
You can only feel empowered after having such great women surrounding you,
but it would not go without a huge thanks to Lucy Jackson-Jones, who was more than
a post doc in the #TeamBenezech. She has been an infinite source of science chat,
biscuits and someone to look up to. A giant Thanks, you will be a wonderful PI!
I would like to thank all the people that helped me. First Steven Jenkins, whose
enthusiasm for science and input of ideas made my PhD reviews very enjoyable.
Calum Bain and Ruairi Lynch who showed me the art of mastering BM chimera
generation and also how to truly enjoy going to conferences. Thanks to the people in
the CVS department, in particular Margaret Heck, Zoi Michailidou, Will Cawthorn
and Rod Carter for their expertise and advices. Many thanks to the Flow lab (Shonna,
Will) and the CALM facility for their technical help and for their enthusiasm at doing
their jobs. Thanks to the Ann Walker Animal Unit, who have been wonderful and
always so agreeable to be around, even after some of my last minute requests, or the
fact that I did not always understand what they were talking aboot, aye!
Thanks to the Lunch Gang who integrated me into their table since day 1 with
a special mention to Kate who stayed to enlighten my coffee breaks with good gossips
and laughs. Special thanks to some special people who I have shared more than a bench
with: Clare and Raphaël, you showed me how nerve wracking it will be to write a
thesis but that if you have good friends to support you, it will be okay. I am very proud
of Amelia who lost some hair but has finally finished writing her thesis (almost): we
should write a song about this on a Loch. MayfieldCrew: we shared laughs, salads,
plagues, bad movies, good movies, first dates (literally)… You showed me how

iii
important it was to know where the bottle opener is, especially for the thesis writing
part, and how all these little things combined can create friends for life. Huge thanks
to Cat, my favourite partner in crime. You helped me to keep sane with craft beers at
Andrew’s, music, delicious Chilli and the “bits” of yourself that you added in those
moments, you are the best. Thanks also to Loan and Corina (and their new addition
little Elliot) who have been my friends way before the start of this PhD and this might
not even have happened without them.
To finish I would like to thanks my friends and family. Merci à Cindy, tu
comprends ce que sont de longues études et à toi d’écrire ta thèse! Merci à mes potes
de toujours en particulier Laeti, Sarah et Ziad (mais si tu lies ça, tu en fait aussi partie).
Merci à Laura et Nas, vous m’avez montré la route, et quelle route (la route du Still,
du 101 et la route de thèse)! Grand merci à mes 2 super grandes « petites » sœurs Cathy
et Patricia, ainsi que ma famille. Votre soutien et confiance a été top même si vous
avez essayé de m’inviter à bien trop d’apéro et de vacances… Et enfin, merci à mes
parents, Joaquim et Maria, qui sont mes plus grands model. Votre travail acharné et
votre vie sont un exemple à suivre. Minha gratidão por vocês jamais poderá ser
demonstrada com palavras. Obrigada por fazerem de mim, a pessoa que sou hoje. Et
une pensée pour Rosa et José.

iv
TABLE OF CONTENTS DECLARATION ......................................................................................................................... I
ACKNOWLEDGEMENTS ............................................................................................................. II
ABSTRACT............................................................................................................................ VIII
LAY SUMMARY ....................................................................................................................... X
PUBLICATIONS ....................................................................................................................... XII
ABSTRACTS FROM THESIS ......................................................................................................... XII
ABBREVIATIONS .................................................................................................................... XIII
LIST OF FIGURES .................................................................................................................... XVI
LIST OF TABLES...................................................................................................................... XIX
CHAPTER 1 INTRODUCTION ............................................................................................. 1
1.1 OVERVIEW .................................................................................................................... 2
1.2 WHITE ADIPOSE TISSUE, LIPID HOMEOSTASIS AND OBESITY ..................................................... 2
1.2.1 WHITE ADIPOSE TISSUE: LOCALISATION AND ROLE ............................................................... 2
1.2.2 OBESITY, LIPID METABOLISM AND LOW GRADE INFLAMMATION .............................................. 4
1.3 MACROPHAGE HETEROGENEITY ........................................................................................ 6
1.3.1 RECRUITED AND RESIDENT MACROPHAGES ........................................................................ 6
1.3.2 ORIGIN OF TISSUE RESIDENT MACROPHAGES ...................................................................... 8
1.3.3 MACROPHAGE ACTIVATION ............................................................................................ 9
1.4 ADIPOSE TISSUE MACROPHAGES...................................................................................... 11
1.4.1 MAINTAINING A HEALTHY AT: A BALANCING ACT FOR IMMUNE CELLS .................................... 11
1.4.2 ATM ROLES AND “SWITCH” ......................................................................................... 12
1.4.3 ATM RECRUITMENT .................................................................................................. 14
1.4.4 ATM PROLIFERATION ................................................................................................. 15
1.5 MACROPHAGES AND LIPID METABOLISM........................................................................... 16
1.5.1 LIPID BUFFERING PROPERTIES OF MACROPHAGES .............................................................. 16
1.5.2 INTRINSIC LIPID METABOLISM AND LYSOSOMES ................................................................. 18
1.5.3 TIMD4, GENE CODING FOR PHOSPHATIDYLSERINE RECEPTOR ON MACROPHAGES IS ASSOCIATED
WITH DYSLIPIDAEMIA .............................................................................................................. 21
1.6 THESIS AIM AND HYPOTHESIS.......................................................................................... 24
CHAPTER 2 MATERIAL AND METHODS .......................................................................... 25

v
2.1 IN VIVO EXPERIMENTS ................................................................................................... 26
2.1.1 ANIMAL ................................................................................................................... 26
2.1.2 TIME COURSE EXPERIMENTS ......................................................................................... 26
2.1.3 HFD EXPERIMENTS .................................................................................................... 26
2.1.4 ORAL GLUCOSE TOLERANCE TEST (OGTT) ....................................................................... 26
2.1.5 GENERATION OF CHIMERAS .......................................................................................... 26
2.1.6 IN VIVO TIM4 BLOCKADE ............................................................................................. 28
2.2 CELL ISOLATION ........................................................................................................... 29
2.2.1 HUMAN ADIPOSE TISSUE ............................................................................................. 29
2.2.2 MURINE ADIPOSE TISSUE ............................................................................................. 29
2.2.3 PERITONEAL CAVITY LAVAGES ....................................................................................... 30
2.2.4 LIVER ...................................................................................................................... 30
2.3 IN VITRO EXPERIMENTS ................................................................................................. 31
2.3.1 FATTY ACIDS DOSAGE .................................................................................................. 31
2.3.2 ADHESION MEDIATED PURIFICATION OF MACROPHAGES ..................................................... 31
2.3.3 IN VITRO LDL UPTAKE BY MACROPHAGES ........................................................................ 32
2.3.4 CHYLOMICRON UPTAKE BY MACROPHAGES ...................................................................... 32
2.4 TECHNIQUES OF ANALYSIS .............................................................................................. 32
2.4.1 FLOW CYTOMETRY ..................................................................................................... 32
2.4.2 GATING STRATEGY ..................................................................................................... 34
2.4.3 CELL SORTING AND CYTOSPIN ....................................................................................... 37
2.5 MICROSCOPY .............................................................................................................. 37
2.5.1 WHOLE MOUNT IMMUNOFLUORESCENCE STAINING FOR CONFOCAL MICROSCOPY .................... 37
2.5.2 LYSOTRACKER AND LIPIDTOX STAINING ........................................................................... 38
2.5.3 FIJI ANALYSIS ............................................................................................................ 39
2.6 STATISTICS .................................................................................................................. 41
CHAPTER 3 ATM REPLENISHMENT BY BM DERIVED MONOCYTES SHOWS TISSUE
HETEROGENEITY ............................................................................................................... 42
3.1 INTRODUCTION ............................................................................................................ 43
3.2 AIM OF THIS CHAPTER ................................................................................................... 44
3.3 EXPERIMENTAL DESIGN ................................................................................................. 45

vi
3.4 RESULTS ..................................................................................................................... 46
3.4.1 NOVEL GATING STRATEGY TO CHARACTERISE ADIPOSE TISSUE MACROPHAGE SUBSETS ............... 46
3.4.2 TISSUE NON-HOST CHIMERISM OF IMMUNE CELLS IN THE ADIPOSE TISSUE ............................... 48
3.4.3 NON-HOST CHIMERISM OF ATM SUBSETS WAS HETEROGENOUS .......................................... 52
3.4.4 HEAD IRRADIATION AS A METHOD TO STUDY MACROPHAGE REPLENISHMENT IN TISSUES LOCATED IN
THE PERITONEAL CAVITY .......................................................................................................... 55
3.4.5 PHENOTYPING OF ATMS IN LEAN GAT ........................................................................... 56
3.4.6 TIM4+ ATMS WERE RESIDENT IN SUBCUTANEOUS AT AND PRESENT AT BIRTH AT A VERY LOW
PROPORTION ........................................................................................................................ 57
3.5 DISCUSSION ................................................................................................................ 60
CHAPTER 4 ATMS INCREASE BOTH BY PROLIFERATION AND RECRUITMENT IN OBESE AT
65
4.1 INTRODUCTION ............................................................................................................ 66
4.2 AIM .......................................................................................................................... 67
4.3 EXPERIMENTAL DESIGN ................................................................................................. 68
4.4 RESULTS ..................................................................................................................... 69
4.4.1 HETEROGENEITY IN WEIGHT GAIN AND MACROPHAGE NUMBER BETWEEN ADIPOSE DEPOTS ........ 69
4.4.2 HETEROGENEITY OF RECRUITMENT DURING HFD IS SEX AND DEPOT SPECIFIC .......................... 71
4.4.3 HETEROGENEITY OF ATM RECRUITMENT DURING HFD ...................................................... 72
4.4.4 ATMS HAD DYNAMIC CHANGES IN MHCII EXPRESSION AND LIPID CONTENT DURING THE COURSE OF
HFD 76
4.4.5 TIM4+ ATMS WERE FILLED WITH LIPIDS AND LYSOSOMES AT HOMEOSTASIS AND DURING OBESITY 81
4.4.6 TIM4+ ATMS WERE BETTER AT LDL UPTAKE ................................................................... 84
4.5 DISCUSSION ................................................................................................................ 85
CHAPTER 5 TIM4 BLOCKADE REDUCES LIPID UPTAKE AND LYSOSOMAL ACTIVITY OF
TIM4+ ATMS 91
5.1 INTRODUCTION ............................................................................................................ 92
5.2 AIM .......................................................................................................................... 93
5.3 EXPERIMENTAL DESIGN ................................................................................................. 93
5.4 RESULTS ..................................................................................................................... 95

vii
5.4.1 IMPACT OF IN VIVO TIM4 BLOCKADE WITH MONOCLONAL ANTIBODIES ON MACROPHAGES ......... 95
5.4.2 IMPACT OF IN VIVO TIM4 BLOCKADE COUPLED TO LONG TERM HFD ...................................... 96
5.4.3 IMPACT OF IN VIVO TIM4 BLOCKADE COUPLED TO SHORT TERM HFD .................................. 104
5.4.4 LYSOTRACKER INTENSITY AND LIPID UPTAKE WAS CORRELATED WITH TIM4 INTENSITY ON ATMS
AFTER BEING FED WITH CHYLOMICRONS .................................................................................... 107
5.5 DISCUSSION ........................................................................................................... 110
CHAPTER 6 TIM4+ MACROPHAGES ARE PRESENT IN HUMAN ADIPOSE DEPOTS ......... 115
6.1 INTRODUCTION .......................................................................................................... 116
6.2 AIM ........................................................................................................................ 117
6.3 EXPERIMENTAL DESIGN ............................................................................................... 117
6.4 RESULTS ................................................................................................................... 118
6.4.1 TIM4 IS EXPRESSED BY THE MAJORITY OF CD14+ CELLS IN THE OMENTUM AND SAT ............... 118
6.4.2 NOT ALL ATM POPULATIONS SHOW A POSITIVE CORRELATION BETWEEN THEIR NUMBER AND HIPS
TO WAIST RATIO .................................................................................................................. 120
6.4.3 HUMAN OMENTUM CONTAINED TIM4+ CELLS DISPOSED IN CROWN LIKE STRUCTURES ............. 122
6.5 DISCUSSION .............................................................................................................. 126
CHAPTER 7 DISCUSSION .............................................................................................. 129
7.1 SUMMARY ................................................................................................................ 130
7.2 HETEROGENOUS MACROPHAGES IN AT .......................................................................... 132
7.3 TIM4 IS NOT UNIQUE TO ATMS .................................................................................... 133
7.4 MECHANISM OF LIPID UPTAKE BY TIM4 .......................................................................... 133
7.5 TIM4: GOOD OR EVIL ? ................................................................................................ 136
BIBLIOGRAPHY.................................................................................................................... 138
viii
Abstract Resident macrophages are essential for the maintenance of tissue homeostasis as they
participate in clearance of apoptotic cells and tissue remodelling and repair. In recent
years, there has been an increased interest in the study of adipose tissue macrophages
(ATMs). In lean individuals, ATMs are important for the control of insulin sensitivity,
thermogenesis, angiogenesis and adipose tissue development. In obesity, the number
and phenotype of ATMs is altered, and is associated with chronic low grade systemic
and local inflammation. These “pro-inflammatory” changes are postulated to
contribute to the manifestation of metabolic syndrome. These findings have suggested
that the pool of ATMs is heterogeneous and may change, especially during obesity.
To date, the characterisation of ATMs has been limited largely to the F4/80/CD11b
markers, however the hypothesis of this thesis is that ATMs have distinct phenotype
and function that could influence, in different ways, tissue homeostasis. This thesis
aims to characterise and phenotype ATM subsets in order to better understand their
potential specific role in the tissue. During the course of this research, a novel
population of Tim4+ resident ATMs were identified. An additional aim of this thesis
was to elucidate their role in adipose tissue homeostasis.
Partial bone marrow chimeras were used to identify macrophage origin. The main AT
depots were shielded from irradiation and a donor BM was injected intravenously.
After 8 weeks, the origin of macrophages was analysed using flow cytometry. Tim4,
a phosphatidylserine receptor mediating phagocytosis of apoptotic cells and a marker
found on resident macrophages in other tissues, was used for the first time in adipose
tissue. Four subsets of ATMs were identified: F4/80highCD11c-Tim4+, F4/80highCD11c-
Tim4-; F4/80lowCD11c+Tim4-; F4/80lowCD11c-Tim4-. Interestingly, this newly
described F4/80highTim4+ ATM subset showed the lowest non-host chimerism
compared to the other ATMs, suggesting this is a main self-replenishing resident ATM
population.
To study the impact of obesity on ATM turnover, partial chimeric mice were fed HFD
for 8 weeks. This increased the number of macrophages in AT. However, the different
subsets of ATMs were differentially affected by the diet. Indeed, only a small
proportion of Tim4+ ATMs derived from the bone marrow. In contrast, replenishment

ix
of the 3 other subsets was almost fully dependent on the arrival of monocyte-derived
cells from the bone marrow.
TIMD4, the gene encoding for Tim4, has been highlighted in genetic studies as being
linked with dyslipidaemia. This suggests that Tim4+ ATMs might play a role in lipid
homeostasis. Further characterisation of Tim4 ATMs demonstrated that these Tim4+
ATMs are highly charged in neutral lipid, and also have an increased lysosomal
activity (shown by lysotracker staining) compared to the other ATM subsets. Using
blocking anti-Tim4 antibodies in vivo, I found that Tim4 contributed markedly to free
fatty acid (FFA) release into the plasma after short-term and long term HFD feeding.
In addition, in vitro and in vivo experiments demonstrated that Tim4 could be required
for the uptake of neutral lipids and their integration into lysosomes for degradation,
though this seems to be dependent on the nature of the lipid.
Collectively, these results indicate that Tim4 plays a crucial role in the control of lipid
trafficking under conditions when dietary lipid is in excess. Tim4 allows uptake of
lipids by Tim4+ ATMs and subsequent release of FFA into the circulation. Finally, the
presence of Tim4+ lipid laden ATMs was demonstrated in the human omentum. This
finding may lead to the discovery of new targets to improve metabolic health in obese
patients.
This work stresses the importance of resident ATM population in body lipid
homeostasis as they could be involved in coping with lipid availability in the body and
influence the amount of FFA in the plasma.

x
Lay Summary Obesity is a worldwide problem. It is associated with other diseases such as type 2
diabetes, cardiovascular problems (atherosclerosis, heart attack) and cancer. During
obesity, the dramatic expansion of fat tissue (which stores excess energy in a form of
fat called triglyceride) is accompanied by an increase in white blood cells that move
into the tissue from the blood in a process called inflammation. Inflammation usually
occurs at sites of injury or infection and normally involves the recruitment white blood
cells to the injured tissue so they kill the microbes or eliminate dead cells and help
repair the tissue. In the context of obesity, the capacity of the fat cells to store excess
energy (in the form of triglyceride, a lipid or fat) is exceeded and the fat cells become
dysfunctional and die. Macrophages (derived from the Greek meaning big [macro]
eater [phage]) are one of the main populations of white blood cells that are recruited
to the tissue during inflammation, notably to clear and remove the dead cells. But in
this process they also release signals that recruit more white blood cells and by doing
so they participate in the inflammatory process.
In order to understand how macrophages work during obesity and what they do in fat
tissue, it is important to know what these cells are and if (under the umbrella
description of macrophages as a key cell type), subtypes exist with different roles in
the tissue. The aim of this thesis was to identify subtypes of macrophages within
adipose tissue of mice, using specific cellular tags (markers), and to study the role of
one particular macrophage subset that was identified, tagged with Tim4. Tim4 is a
marker on the surface of macrophages that is usually involved in the recognition of
dead cells.
Normally during inflammation, the bone marrow produces fresh macrophages which
travel via the blood to enter the inflamed tissue. Here, using mice as an experimental
system, it was found that during the inflammation that is associated with obesity, not
all macrophages found in adipose tissue come from the bone marrow. Indeed,
macrophages identified by their Tim4 tag were able to multiply themselves in the
adipose tissue of mice fed a HFD. Furthermore, these Tim4-tagged cells contained an
expansion of structures within cells called lysosomes. Lysosomes are an acidic
compartment of the cell which functions as a “recycling centre”, breaking down
xi
protein and lipid molecules for re-use in other parts of the cell. Moreover, these Tim4-
tagged macrophages were able to pick up (phagocytose, or “eat”) more lipids from the
surrounding tissue than other macrophages were.
In experiments in mice, blocking Tim4 activity led to a decrease in macrophage uptake
of lipid molecules and the ability of the lysosomes in macrophages to act as recycling
centres. The ingestion of a fat-rich meal normally increases lipid (in the form of free
fatty acid) in the blood. However, blocking Tim4 activity prevented the normal
increase in free fatty acids in the blood, indicating a role for Tim4 in the release of free
fatty acids after fat feeding. These observations suggest that Tim4 tagged macrophages
in adipose tissue, by virtue of their lysosomes, can break down large lipid molecules
(such as triglycerides) into free fatty acids for release into the blood. In conclusion,
this research has identified a new pathway controlling the levels of free fatty acid in
the blood which could be targeted in the future for the treatment of obesity associated
diseases.

xii
Publications Magalhaes M.S., Jackson-Jones L.H., Bain, C., Hawley, C., Lynch, R., Michailidou,
Z., Jenkins, S.J. and Benezech C. (In preparation, 2019) Adipose tissue macrophages
and the role of Tim4 in lipid metabolism.
Jackson-Jones L.H., Duncan, S.M., Magalhaes M. S., Campbell, S., Maizels, R.M.M.,
McSorley H.J., Allen, J.E. and Benezech C.B. (2016) Fat Associated Lymphoid
Clusters are IL-33R dependent Sites of B Cell Proliferation and local IgM Production.
Nature Communications 7, 12651 DOI 10.1038/NCOMMS12651
Jackson-Jones L.H., Magalhaes M.S., Mylonas, K., Garcia, M., Mole, D. and
Benezech C. (In preparation, 2018) The omentum is a critical site for neutrophil
recruitment and NETosis during peritonitis
Abstracts from thesis Macrophage satellite symposium 2018 (Edinburgh, UK) (Oral presentation) “Adipose
tissue macrophages : hungry for fat”
Edinburgh Immunology Group Summer Symposium 2018 (Oral presentation) “The
role of Tim4+ adipose tissue macrophages in lipid metabolism”
Keystone Symposia Myeloid cells, 2018 Breckenridge USA (Poster presentation)
Macrophages in the single cell era, 2017 Ghent (poster presentation)
Edinburgh Immunology Group summer symposium, Edinburgh. UK (Poster
presentation)
British Society for Immunology Congress, Liverpool, UK, 2016 (Oral presentation)
“Defining the heterogeneity of adipose tissue macrophages at homeostasis and during
obesity” Keystone Symposia Myeloid cells, 2016 Killarney (Ireland) (Oral
presentation)

xiii
Abbreviations AA: amino acid
ABCA1: ATP-binding cassette A1
AGM: aorta-gonad-mesonephros
ALOX: arachidonate lipoxygenase
AMPK: 5′-adenosine monophosphate activated protein kinase
AT: adipose tissue
ATMs: adipose tissue macrophages
ATP: adenosine tri phosphate
BM: bone marrow
BMI: body mass index
BSA: bovine serum albumin
CCL: C-C chemokine ligand
CCR2: C-C chemokine receptor type 2
CD: control diet
CE: cholesteryl esters
CLS: crown-like structures
CM: chylomicrons
CSF1r : colony-stimulating factor receptor
DC: Dendritic cell
EdU: 5-ethynyl-2′-deoxyuridine
EMPs : erythromyeloids progenitors
FA: fatty acid
FABP: fatty acid binding protein
FACS: fluorescence activated cell sorting
FAO: fatty acid oxidation

xiv
FL: fetal liver
g: gram
GAT: gonadal adipose tissue
GLUT: glucose transporters
GWAS: genome wide association studies
HDL: high density lipoprotein
HFD: High fat diet
IFN: interferon
IL: interleukin
ip: intraperitoneal
iv: intravenous
LAL: lysosomal acid lipase
LDL: low density lipoprotein
LDLr: low density lipoprotein receptor
LO: lipoxygenase
LpL: lipoprotein lipase
LPS: lipopolysaccharide
M-CSF: macrophage colony-stimulating factor
MCP1: Monocyte chemoattractant protein 1
MERTK: myeloid-epithelial-reproductive tyrosine kinase
MES: mesenteric
NBF: neutral buffered formalin
NF: nuclear factor
oxLDL: oxidised low density lipoprotein
OXPHOS: oxidation phosphorylation
PBS: phosphate buffer saline

xv
PPAR: peroxisome proliferator-activated receptor
PS: phosphatidyl serine
RELMα: Resistin-Like Molecules
SAT: subcutaneous adipose tissue
SR: scavenger receptor
SREBP: sterol regulatory element binding proteins
STAT: Signal transducer and activator of transcription
TG: triglycerides
TGF: transforming growth factor
Tim: T-cell immunoglobulin and mucin domain containing protein
TLR4: toll like receptor 4
TNF: tumour necrosis factor
Treg: T regulatory cell
UCP1: uncoupling protein 1
VLDL: very low density lipoprotein
VLDL: very low density lipoprotein
VLDLr: very low density lipoprotein receptor
WHR: waist to hip ratio
WT: wild type
YS: yolk sac

xvi
List of figures FIGURE 1.1 LIPOPROTEINS SYNTHESIS AND USE ............................................................................................. 5 FIGURE 1.2 THREE COEXISTING MODELS OF MACROPHAGE ORIGIN IN ADULT TISSUES .............................................. 9 FIGURE 1.3 IMMUNE CELLS IN AT IN LEAN AND OBESE .................................................................................. 12 FIGURE 1.4 ATMS ENSURE TISSUE HOMEOSTASIS........................................................................................ 13 FIGURE 1.5 CLS IN VISCERAL AT IN MOUSE (A) AND HUMAN (B) .................................................................... 14 FIGURE 1.6 ATM LYSOSOMAL ACTIVITY CONTROL LIPID EFFLUX....................................................................... 17 FIGURE 1.7 LIPID METABOLISM IN MACROPHAGES OF THE ATHEROSCLEROTIC PLAQUE .......................................... 20 FIGURE 2.1 EXPERIMENTAL DESIGN OF PARTIAL BM CHIMERAS ...................................................................... 27 FIGURE 2.2 EXPERIMENTAL DESIGN OF PARTIAL BM CHIMERAS COUPLED WITH DIET TO STUDY MACROPHAGE TURN-OVER
DURING HFD. ........................................................................................................................... 28 FIGURE 2.3 EXPERIMENTAL DESIGN OF TIM4 BLOCKADE DURING LONG (A) AND SHORT HFD (B) ............................ 29 FIGURE 2.4 GATING STRATEGY USED TO DEFINE IMMUNE CELLS IN THE GAT AFTER GENERATION OF BM CHIMERIC MICE.
............................................................................................................................................. 34 FIGURE 2.5 GATING STRATEGY USED TO DEFINE MACROPHAGES IN HUMAN VISCERAL AT (OMENTUM). .................... 36 FIGURE 2.6 MOUNTING OF TISSUE FOR MICROSCOPY ANALYSIS ....................................................................... 37 FIGURE 2.7 EXAMPLE OF AUTOMATIZED MEASUREMENT OF LYSOTRACKER AND LIPID INTENSITY USING FIJI ................ 40 FIGURE 3.1 EXPERIMENTAL DESIGN OF PARTIAL BM CHIMERA GENERATION ....................................................... 45 FIGURE 3.2 GATING STRATEGY USED TO DEFINE ATM SUBSETS AND THEIR RELATIVE PROPORTION ........................... 47 FIGURE 3.3 TISSUE CHIMERISM OF IMMUNE CELLS IN GAT ............................................................................ 49 FIGURE 3.4 MICE RECONSTITUTED WITH CCR2 KNOCK-OUT (CCR2-/-) BM HAD A LOW MONOCYTE (LY6CHI) NON-HOST
CHIMERISM BUT CCR2 DEFICIENCY DID NOT AFFECT GRANULOCYTES. ...................................................... 50 FIGURE 3.5 NON-HOST CHIMERISM OF EOSINOPHILS, NEUTROPHILS, MONOCYTES AND MACROPHAGES IN GAT AND MES
AT. ........................................................................................................................................ 51 FIGURE 3.6 ATM SUBSETS IN GAT AND MES AT SHOWED AN HETEROGENEOUS NON-HOST CHIMERISM .................. 53 FIGURE 3.7 TIM4+ ATMS HAD THE LOWEST NORMALISED NON-HOST CHIMERISM WHICH COULD NOT BE DISTINGUISED
FROM THE MICE INJECTED WITH CCR2 KO WHEN COMPARED TO OTHER ATM SUBSETS. .............................. 54 FIGURE 3.8 HEAD IRRADIATION DECREASED DIFFERENCES OF TIM4+ NON-HOST CHIMERISM BETWEEN THE GAT AND THE
MES AT, AND WAS A BETTER OPTION TO STUDY ATM REPLENISHMENT USING PARTIAL BM CHIMERA ............. 55 FIGURE 3.9 HISTOGRAMS SHOWING CD64, CD206, CSF1R AND RELMΑ EXPRESSION ON ATMS MACROPHAGES ....... 56 FIGURE 3.10 SAT MACROPHAGES WERE HETEROGENEOUS AND TIM4+ ATMS HAD A LOW BM DEPENDENCY. ............ 57 FIGURE 3.11 EVOLUTION OF SAT WEIGHT DURING MOUSE DEVELOPMENT ........................................................ 59 FIGURE 3.12 SAT CONTAINS YOLK SAC DERIVED F4/80HIGHMHCIILOW MACROPHAGES AT BIRTH .............................. 59 FIGURE 4.1 EXPERIMENTAL DESIGN OF PARTIAL BM CHIMERAS COUPLED WITH DIET TO STUDY MACROPHAGE TURN-OVER
DURING HFD. ........................................................................................................................... 68
xvii
FIGURE 4.2 MALES ACCUMULATED MORE GAT AND SAT THAN FEMALES AFTER 8 WEEKS OF HFD BUT WHEN COMPARED
TO BODY WEIGHT, THE DIFFERENCES WERE NULL................................................................................. 70 FIGURE 4.3 THE TOTAL NUMBER OF MACROPHAGES IN THE GAT INCREASED IN MALE BUT NOT IN FEMALE MICE NOR THE
SAT AFTER 8 WEEKS OF HFD. ....................................................................................................... 71 FIGURE 4.4 DN F4/80HIGH AND TIM4+ NON-HOST CHIMERISM SHOWED THE HIGHEST SEX SPECIFICITY, IN THE GAT (A)
AND SAT (B), AFTER 8 WEEKS OF HFD (RED) .................................................................................... 72 FIGURE 4.5 ATM NON-HOST CHIMERISM WAS INCREASED DURING HFD IN THE GAT OF MALE MICE........................ 73 FIGURE 4.6 TIM4+ ATMS DID NOT RELY ON THE BM TO INCREASE IN NUMBER DURING HFD BUT THEIR OVERALL
PROPORTION DECREASES DUE TO THE ARRIVAL OF BM DERIVED ATMS IN THE GAT AFTER 8 WEEKS OF HFD
(MALES)................................................................................................................................... 75 FIGURE 4.7 TIM4 MACROPHAGES PROLIFERATED IN THE GAT DURING HFD, AS MEASURED BY KI67. ....................... 76 FIGURE 4.8 TIM4+ ATM MHCII EXPRESSION DECREASED AFTER 8 WEEKS OF HFD.............................................. 77 FIGURE 4.9 SSC-AHIGH MACROPHAGES ARE MORE ABUNDANT DURING HFD AND CONTAIN MORE NEUTRAL LIPIDS ....... 78 FIGURE 4.10 TIM4+ ATMS FROM LEAN AND OBESE MICE TENDED TO HAVE THE HIGHEST LIPID CONTENT................... 79 FIGURE 4.11 SSC-A AND MHC-II EXPRESSION ON ADIPOSE TISSUE MACROPHAGES ............................................. 80 FIGURE 4.12 TIM4+ ATM MORPHOLOGY IN LEAN AND OBESE GAT ................................................................. 82 FIGURE 4.13 TIM4 ATMS TENDED TO HAVE MORE LYSOSOMES, AS SHOWN BY LAMP1 EXPRESSION, COMPARED TO OTHER
MACROPHAGE POPULATIONS IN LEAN AND OBESE GAT ........................................................................ 83 FIGURE 4.14 TIM4+ ATMS UPTAKED MORE LDL AND EXPRESSED MORE CD36 COMPARED TO TIM4- ATMS. ............ 84 FIGURE 5.1 EXPERIMENTAL DESIGN OF TIM4 BLOCKADE DURING LONG (A) AND SHORT HFD (B) ............................ 94 FIGURE 5.2 TIM4 BLOCKADE TWICE A WEEK FOR 4 WEEKS DURING A LONG HFD BLOCKED TIM4 IN ATMS BUT ONLY
PARTIALLY IN THE PEC ................................................................................................................. 95 FIGURE 5.3 WEIGHT GAIN AND GAT WEIGHT OF C57BL/6 MALE MICE FED A CONTROL DIET OR A HFD FOR 8 WEEKS,
WITH OR WITHOUT TIM4 BLOCKADE................................................................................................ 96 FIGURE 5.4 PLASMA GLUCOSE LEVEL AFTER ADMINISTRATION OF A GLUCOSE BOLUS TO MICE FED A CONTROL DIET OR A
HFD FOR 8 WEEKS, WITH OR WITHOUT TIM4 BLOCKADE. ..................................................................... 97 FIGURE 5.5 FFA LEVELS IN PLASMA OF MICE FED A HFD FOR 8 WEEKS WAS DECREASED BY ATIM4 TREATMENT. ......... 98 FIGURE 5.6 TIM4 BLOCKADE DECREASED LYSOTRACKER MFI IN TIM4+ MACROPHAGES FROM THE GAT, PEC AND LIVER,
IN BOTH LEAN AND OBESE MICE (8 WEEKS HFD). ............................................................................. 100 FIGURE 5.7 LDL UPTAKE BY ATMS SEEN BY CONFOCAL MICROSCOPY (X100) .................................................. 101 FIGURE 5.8 LYSOTRACKER WAS INCREASED IN TIM4+ ATMS BY ADDITION OF LDL ONLY WHEN THE RECEPTOR WAS NOT
BLOCKED ................................................................................................................................ 101 FIGURE 5.9 TIM4 BLOCKADE REDUCED LDL UPTAKE (A) AND LYSOTRACKER MFI (B) IN TIM4+ MACROPHAGES FROM THE
GAT, PEC AND LIVER, BOTH IN LEAN AND OBESE MICE FED A HFD FOR 12-14 WEEKS. ............................ 103 FIGURE 5.10 TIM4 BLOCKADE DECREASED FFA IN THE PLASMA OF MICE FED A HFD FOR 3 DAYS COMPARED TO MICE
INJECTED WITH ISOTYPE ............................................................................................................. 104

xviii
FIGURE 5.11 TIM4 BLOCKADE DECREASED FFA IN THE PLASMA OF MICE FED 1 DAY OF HFD COMPARED TO MICE
INJECTED WITH ISOTYPE CONTROL ................................................................................................. 105 FIGURE 5.12 TIM4 BLOCKADE ON TIM4+ MACROPHAGES FROM GAT, PEC, AND LIVER DECREASED LYSOTRACKER MFI IN
ALL GROUPS INDEPENDENTLY OF THE DIET AND DECREASED LIPID CONTENT IN THE GAT (CONTROL AND HFD), AND
THE PEC (HFD ONLY). .............................................................................................................. 106 FIGURE 5.13 TIM4 BLOCKADE DECREASED LIPID UPTAKE AND LYSOSOMAL ACTIVITY IN THE GAT BUT NOT IN THE PEC
MACROPHAGES ........................................................................................................................ 108 FIGURE 5.14 TIM4 CORRELATES POSITIVELY WITH LYSOTRACKER AND LIPIDTOX CONTENT AFTER CHYLOMICRON
CHALLENGE. ............................................................................................................................ 109 FIGURE 6.1 TIM4 IS EXPRESSED ON CD14+ ATMS ALONGSIDE WITH OTHER MACROPHAGE MARKERS. .................... 119 FIGURE 6.2 CD163+ ATMS HAD A HIGHER TIM4 FLUORESCENCE INTENSITY .................................................... 120 FIGURE 6.3 NOT ALL ATM POPULATIONS SHOW A POSITIVE CORRELATION BETWEEN THEIR NUMBER AND HIPS TO WAIST
RATIO. ................................................................................................................................... 121 FIGURE 6.4 HUMAN OMENTUM HAD TIM4+ ATMS THAT CONTAINED LYSOSOMES AND WERE LIPID LADEN. ............. 122 FIGURE 6.5 HUMAN SAT HAD LIPID LADEN TIM4+ ATMS THAT CONTAINED LYSOSOMES ..................................... 123 FIGURE 6.6 OBESE HUMAN SAT CONTAINED TIM4+ ATMS, WHICH SOME WERE FILLED WITH LYSOSOMES .............. 124 FIGURE 6.7 TIM4+ ATMS (OMENTUM) WERE ABLE TO PICK UP LDL IN VITRO ................................................... 125 FIGURE 7.1 PROPOSED MECHANISM OF ACTION OF TIM4+ MACROPHAGES ...................................................... 131

xix
List of tables TABLE 1-1 M1/M2 MARKERS ASSOCIATED WITH ATMS IN MOUSE AND HUMAN 10 TABLE 1-2 GENOME WIDE ASSOCIATION STUDY INVOLVING TIMD4 22 TABLE 2-1 ENZYMES NECESSARY FOR LIVER MURINE LIVER DIGESTION 31 TABLE 2-2 LIST OF BUFFERS 33 TABLE 2-3 FLOW CYTOMETRY ANTIBODY CLONES, MANUFACTURER AND TITRATION (MOUSE) 35 TABLE 2-4 FLOW CYTOMETRY ANTIBODY CLONES, MANUFACTURER AND TITRATION (HUMAN) 36 TABLE 2-5 ANTIBODIES USED FOR IMMUNOFLUORESCENCE STAINING 38 TABLE 3-1 SUMMARY OF FINDINGS FROM CHAPTER 3 60 TABLE 4-1 SUMMARY OF FINDINGS FROM CHAPTER 4 85 TABLE 5-1 SUMMARY OF FINDINGS FROM CHAPTER 5 110

1
CHAPTER 1 INTRODUCTION

Chapter 1 Introduction
2
1.1 Overview
The last decade brought to macrophage biology a revolution in terms of what
researchers thought they knew about these innate immune cells. Historically,
macrophages were believed to derive from bone marrow (BM) recruited monocytes
differentiating in tissues (Davies et al. 2013). However, astonishingly, studies pointed
out that macrophages can proliferate and be maintained independently from the BM,
which gave rise to further questions about the initial origin of these resident cells
(Davies et al. 2013). Adipose tissue macrophages (ATM) have been highlighted in
studies about obesity, both in human and mice, as they represent the main subset of
immune cells in the fat tissue and that their increase in number has been linked to the
low grade inflammation associated with the metabolic complications of obesity
(Weisberg et al. 2003; Carey N Lumeng, Bodzin, and Saltiel 2007 ). However, ATMs
are still lacking from the most recent reviews about resident macrophages in tissues :
it is not clear if all macrophages are recruited to the tissue (monocyte derived) or if a
resident self-replenishing population exist. Moreover, ATMs fulfil different roles, and
their heterogeneity of function in the tissue seem unappreciated(Thomas and Apovian
2017). After defining what is adipose tissue and obesity, this introductory chapter will
give an insight into what we know of the role of macrophage in adipose tissue but also
what we can learn about macrophage biology, origin and metabolism in other tissues
that can be transposed to AT.
1.2 White adipose tissue, lipid homeostasis and obesity
1.2.1 White adipose tissue: localisation and role
White adipose tissue (WAT) is the principal site of energy storage in mammals. In
healthy men and women, WAT represent 20 and 30%, respectively, of the body mass
(Morigny et al. 2016). The energy is stored as fat in adipocytes, each one containing a
unilocular lipid droplet made of triglycerides (TG) which are 3 fatty acids (FA)
esterified on 1 glycerol. The rest of the tissue is composed of various other cell types
such as preadipocytes, immune cells, endothelial cells, fibroblasts and nerves,
collectively named stromal vascular fraction (SVF). WAT depots are found across the
human and mouse body, the main depot being the visceral adipose tissue (VAT) and

Chapter 1 Introduction
3
the subcutaneous adipose tissue (SAT). In mouse, the VAT can be divided into gonadal
AT (GAT) also called epididymal AT, mesenteric AT (Mes AT), omental AT,
retroperitoneal AT, mediastinal AT and pericardial AT.
If there is a positive energy balance, the role of WAT is to store lipids and avoid ectopic
storage. A prolonged excessive energy intake, which exceeds energy expenditure,
results in obesity which is defined as an enlargement of the fat mass detrimental to
health (WHO definition). The World Health Organisation recognised that in 2016, 650
million adults were obese (“WHO | Obesity and Overweight” 2018). A body mass
index (BMI) superior to 30 kg/m2 is an indicator of obesity, however fat distribution
is also an important factor, as measured by the waist to hip ratio (WHR). The “pear
shape” characterises people with WAT accumulation around the hips (below the waist)
while the “apple shape” is a central accumulation (above the waist). After being
adjusted to the BMI, central WAT accumulation (or VAT accumulation in the
abdomen), is more often associated with chronic diseases such as type 2 diabetes and
cardiovascular diseases (Matsuzawa et al. 1995; Fu, Hofker, and Wijmenga 2015).
Indeed, the “Framingham Heart Study” gathered data of around 3000 people and
showed a stronger correlation between VAT, compared to SAT, with different health
risk factors, such as hypertension and increased fasting glucose (Fox et al. 2007;
McLaughlin et al. 2011). As such, obese VAT has been at the centre of numerous
studies. In humans the VAT is mostly represented by the omental AT (omentum). In
comparison, mouse omental AT is a small tissue that only minimally store fat but have
important immunological functions (Benezech et al. 2015; Jackson-Jones et al. 2016).
The murine VAT studied during obesity is the GAT, as this is the one expanding the
most with high fat diet (HFD) and linked with metabolic disorder (van Beek et al.
2015).
WAT responds to negative energy balance through lipolysis. Lipolysis is an enzymatic
process by which AT releases the FFA contained in their lipid droplets to the
bloodstream to accommodate organ energy demand. Indeed FA can be oxidised (FAO)
by tissues to produce ATP (Stern, Rutkowski, and Scherer 2016; Duncan et al. 2007).
How FFA are exported from adipocytes is not very clear yet, but fatty acid binding
protein (FABP) 4 guide FFA to the plasma membrane for secretion (Nielsen et al.

Chapter 1 Introduction
4
2014). Insulin acts as an anti-lipolytic signal, favouring glucose uptake by tissues, by
upregulating glucose transporters (GLUT) 1 and 4 (Stern, Rutkowski, and Scherer
2016). Obesity is often associated with insulin resistance and elevated glycemia. Obese
individuals have abnormally elevated basal lipolysis which results in elevated
circulating FFA (Stern, Rutkowski, and Scherer 2016). But this is not the only lipid
found to be in abnormal levels during obesity.
1.2.2 Obesity, lipid metabolism and low grade inflammation
The main dietary lipids found are TG, cholesterols, phospholipids (PL),
cholesterols esters (CE) and FFA. FFA are brought to the tissue either directly as short
chain, or in chylomicrons (CM) which are synthetized by enterocytes in the small
intestine (Feingold and Grunfeld 2000). CMs gain the bloodstream via the lymphatics
and once in circulation, go to the peripheral tissues where they are hydrolysed by
lipoprotein lipases (LpL) in order to diffuse and be used by the cells (oxidation). The
CM remnants (CMr), now richer in cholesterol as they lose TG, go back to the liver,
which secretes in exchange very low density lipoproteins (VLDL) back to the
circulation. The remnants VLDL are hydrolysed by the liver, to become low density
lipoproteins (LDL) very rich in cholesterol and pro-atherogenic if in excess (Figure
1.1). LDL are internalised via binding to the LDL-Receptor (LDL-R) at the cellular
membrane before being hydrolysed into cholesterol in acidic organelles, called
lysosomes. The transcription factor SREBP (sterol regulatory element binding
proteins) will stimulate LDL-R synthesis when low levels of cellular cholesterol are
detected (Horton, Goldstein, and Brown 2002). Finally, remaining cholesterol excess
is returned to the liver by high density lipoproteins (HDL) in order to be excreted
(Feingold and Grunfeld 2000; Jaishy and Abel 2016).
Fifty to 60% of obese patients present dyslipidaemia (increased plasma levels of
TG, LDL and VLDL and a decrease in HDL), and this represents a major risk factor
for the development of cardiovascular disease (Feingold and Grunfeld 2000)
(Mittendorfer 2011). Excess LDL and more generally hyperlipidaemia, can lead to
lipid accumulation in arteries that cause fatty steak formation and atherosclerosis.
Macrophages in these atherosclerotic plaques form lipid rich cells called foam cells
and participate in inflammation (Moore and Freeman 2006). Additionally, the reduced

Chapter 1 Introduction
5
suppression of AT lipolysis and the increase in FFA coming from the diet results in
elevated plasma FFA in obese individuals compared to lean subjects, which is linked
with insulin resistance (Boden 2008). Lowering plasma FFA can restore insulin
sensitivity (Boden 2008).
Figure 1.1 Lipoproteins synthesis and use
Obesity is also accompanied by a chronic low grade inflammation which favours
the development of non-alcoholic fatty liver disease, type 2 diabetes and
cardiovascular diseases, all factors linked with an increase in morbidity (Reilly and
Saltiel 2017). The primary trigger of inflammation is uncertain and probably
multifactorial. Pathological AT expansion, by hypertrophy or hyperplasia, is
associated with increased apoptosis, increase release of pro-inflammatory cytokines
such as IL-6 and IL1β and a toxic uncontrolled lipid spill over which can then
accumulate in other tissues (Kanneganti and Dixit 2012). FFA themselves can trigger
SMALLINTESTINE
LIVER
CM
PERIPHERAL TISSUES
CM.r V
L
LPL
FFA
Receptors
ARTERY
Stored TG
energy
Foam cell formation
ADIPOSE TISSUE
After a meal, enterocytes synthesize CM which quickly enter the blood circulation to be distributed to organs. The CM remnants go to the liver where they are used to create VLDL. VLDL in the circulation are used as energy or transformed as LDL. Excess lipids are brought to the adipose tissue to be stored as an energy source which can be mobilised when needed. Excessive levels of LDL in the blood can cause accumulation of foam cells in artery walls (atherosclerosis). CM: chylomicron; CM.r: chylomicron remnant; V : VLDL; L : LDL;LPL : lipoprotein lipases; FA: Fatty acid; TG: triglycerides

Chapter 1 Introduction
6
inflammation by binding toll like receptors (TLR) which promotes expression of genes
involved in inflammation via the nuclear factor (NF) κB signalling pathway (Reilly
and Saltiel 2017). Numerous studies mentioned a drastic upsurge of macrophages in
AT that appear to be one driver of inflammation (Weisberg et al. 2003; M. T. A.
Nguyen et al. 2007; A. A. Hill, Reid Bolus, and Hasty 2014; Ferrante 2013). The
understanding of AT macrophage biology is still in progress and majorly linked to
their role during obesity. First I will review some general knowledge about
macrophage biology and then focus on adipose tissue macrophages (ATMs), as many
elements can be transposed.
1.3 Macrophage heterogeneity
1.3.1 Recruited and resident macrophages
The first description by Elie Metchnikoff of macrophages was simple: large
cells (macro) capable of eating (phage). He described those cells as the “balayeur”
(translated as “sweeper”), related to their great ability of phagocytosis (Metchnikoff
1892). Traditionally, macrophages were designated as being exclusively derived from
blood circulating monocytes coming from the bone marrow (BM) and entering the
tissue (van Furth and Cohn 1968). Circulating monocytes are short lived and their
number in the blood is dependent on the C-C chemokine receptor type 2 (CCR2).
Indeed, Ccr2-/- mice have a drastic reduction in circulating monocytes, as they fail to
exit the bone marrow upon CCL2/CCL7 (CC-chemokine ligand 2 and 7) mediated
recruitment (Tsou et al. 2007). Those 2 chemokines (also known as MCP1 and MCP3),
released by tissues, target inflammatory Ly6chigh monocytes to go to inflamed sites
(Epelman, Lavine, and Randolph 2014a; Shi and Pamer 2011). Infiltrated Ly6c+
monocytes downregulate Ly6c and upregulate the major histocompatibility complex
class II (MHCII) (Tamoutounour et al. 2012; C C Bain et al. 2013). In Human, 3
subsets of monocytes are characterised using CD14 (LPS co-receptor) and CD16
(FcγRIIIA): classical (CD14++CD16-), intermediate (CD14++CD16+) and non-classical
(CD16++CD14+) monocytes (Geissmann, Jung, and Littman 2003). “Recruited”
macrophages appear mainly during the innate phase of infection to fight pathogens
with, notably, the production of proinflammatory factors (Helming 2011). However,
characterising macrophages and macrophage role(s) in tissues and during infection led

Chapter 1 Introduction
7
to acknowledgement of their heterogeneity and notably the presence of tissue resident
macrophages (Wynn and Vannella 2016). For instance, resident macrophages show a
distinct gene expression profile compared to BM recruited macrophages, as well as
distinct functions (Gundra et al. 2014). Resident macrophages play important roles
during wound healing, resolution of inflammation, development, and maintain tissue
homeostasis (Epelman, Lavine, and Randolph 2014b). In some cases, monocytes do
participate in resident macrophage expansion in tissues, notably in the intestine, dermis
and heart in a CCR2 dependent manner (Calum C Bain et al. 2014; Epelman et al.
2014). However the origin of these residents cells in adult tissues has been shown to
be more complex than the classical monocyte to macrophage transition as studies
showed that macrophages can be maintained independently from the BM and have an
intrinsic capacity to self-renew in tissues, notably dependent on IL-4 and colony
stimulating factor 1 (CSF1) (Jenkins et al. 2011; Komornik 1985; Davies et al. 2011;
Jenkins et al. 2013a). Recently, researchers emphasized the fact that macrophages from
a tissue can have various origins but to determine this, distinguishing subsets is
primordial (Shaw et al. 2018). Indeed, using CD4 and Tim4 as surface markers, they
realised that the gut does have a subset of CD4-Tim4- macrophages highly dependent
on the BM, while CD4-Tim4+ had a low dependency and the CD4+Tim4+ subset was
maintained independently from the BM(Shaw et al. 2018). Interestingly, early during
the course of inflammation, resident macrophages are partially depleted (known as the
“disappearance reaction”), notably in the liver, the epidermis, the lungs and the
peritoneal cavity. Surviving macrophages then go through a high proliferative activity
to repopulate the tissue (Davies et al. 2013, 2011). During obesity, AT is considered
as a site of sterile inflammation, raising the question of whether a disappearance
reaction exists too. In the past decade, a paradigm shift occurred in the macrophage
field as the embryonic origin of resident tissue macrophages was discovered, first in
brain and epidermis (Davies and Taylor 2015). Macrophage tissue origin is a
fascinating topic, and most tissues have their ontogeny covered, with the exception of
ATMs which are still missing from major recent reviews (Hoeffel and Ginhoux 2015;
Ginhoux and Guilliams 2016; Epelman, Lavine, and Randolph 2014b). However, we
can still learn from these tissues to grasp an idea of the possible origin of ATMs.

Chapter 1 Introduction
8
1.3.2 Origin of tissue resident macrophages
Method of study: generation of BM chimeras
To understand the origin of tissue macrophages, during inflammation for
example, BM chimeras can be generated. This method consists of the irradiation of a
recipient/host followed by intravenous (iv) transplantation of histocompatible donor
bone marrow, generally isolated from femurs. The donor’s cells re-populate the
irradiated hematopoietic system and, after 2 to 3 weeks, leukocytes from the donor are
detected in the host (Duran-Struuck and Dysko 2009). Total body irradiation uses a
dose of gamma of about 9.5 Gray. A modified protocol includes the protection of body
cavities from irradiation, inducing chimerism in blood monocytes, but sparing resident
macrophage eradication (Aparicio-Vergara et al. 2010). Engraftment can then be
followed over time: if the rates stay low, it is very likely that the macrophage
population persists independently from the BM / blood monocytes. Other method of
study exists, such as fate mapping, which are more relevant to understand embryonic
origins of cells as I will describe in the following paragraph.
Ontogeny
M. Naito and K. Takahashi described immature macrophages (F4/80 “weak” and
lacking phagocytic activity) by microscopy, localised in the blood islands of the
embryonic mouse yolk sac (YS), a membranous vesicle attached to the embryo, at
embryonic day 9 (E9) and the foetal liver (FL), which is the main hemopoietic organ
in the embryo, at E10 (K. Takahashi, Yamamura, and Naito 1989). The first fate
mapping studies showed that in the adult, brain macrophages (microglia) had a YS
origin (Ginhoux et al. 2010) while Langerhans cells (skin macrophages) were coming
from the FL, with a minor participation of YS progenitors (Hoeffel et al. 2012). Later
on, the embryonic origins of liver, spleen, lung and peritoneal macrophages were also
confirmed (Yona et al. 2013). Typically, macrophages issued from the YS acquire a
F4/80high (or bright) phenotype in contrast with HSC derived macrophages that are
F4/80low (Schulz et al. 2012a). Most tissues retain pre-natal macrophages that persist
in the tissue by proliferation. Nonetheless, these populations are replaced in a time,
organ and sex dependent manner by HSC derived cells (Perdiguero and Geissmann
2016). In a nutshell, macrophage generation in adults seems to be relying on either YS

Chapter 1 Introduction
9
erythromyeloid progenitors (EMPs), FL derived monocytes, or embryonic
hematopoietic stem cells (HSC) (Gomez Perdiguero et al. 2014; Hoeffel and Ginhoux
2015; Sheng, Ruedl, and Karjalainen 2015) (Figure 1.2).
Figure 1.2 Three coexisting models of macrophage origin in adult tissues Three models of macrophage ontogeny have been hypothesised. Macrophages in
adult tissue can originate from (1) YS EMPs (Gomez Perdiguero et al. 2014), (2) FL monocytes (Hoeffel and Ginhoux 2015), or (3) FL HSC (Sheng, Ruedl, and Karjalainen 2015). These embryonically derived macrophages persist in tissues by proliferation. HSCs are generated in the aorta-gonad-mesonephros (AGM) region prior to seed the FL. HSCs colonise the BM at E15, where haematopoiesis is detected from E17 and give rise to monocytes in adults mouse which will replace embryonic derived macrophages in a time and organ specific manner.
1.3.3 Macrophage activation
External stimuli can “activate” macrophages, skewing their response towards
the synthesis of pro-inflammatory or anti-inflammatory cytokines. Macrophages are
generally classified as M1 (classically activated) or M2 (alternatively activated). The
M1/M2 nomenclature comes from older studies which defined macrophage
populations based on their cytokine production, mainly done in vitro (Mackaness
1962; Stein et al. 1992). M1 polarisation occurs when macrophages are stimulated with
LPS or IFN γ. These macrophages produce pro-inflammatory cytokines (e.g.: IL-6,
TNFα, IL-1β) and are microbicidal (Martinez and Gordon 2014). On the other hand,
proliferation
differentiation
Foetal Liver
Yolk sac
AGM
placentaEMP
HSC Bone marrow
Resident tissue macrophages
In adults
Hematopoiesis
1
2
3

Chapter 1 Introduction
10
M2 polarisation occurs when macrophages are stimulated with IL-4 or IL-13 which
result in anti-inflammatory cytokine production such as IL-10 and TGF. M2
macrophages promote tissue remodelling, angiogenesis and tumour growth (Martinez
and Gordon 2014). From there, researchers described macrophages in tissues to be
more M1 or M2 like and associate them with specific markers, which are still widely
used in AT (Martinez and Gordon 2014). For example the M1/M2 markers applied by
flow cytometry and fluorescence activated cell sorting (FACS) to ATMs are
represented in the table below (Table 1-1)
Table 1-1 M1/M2 markers associated with ATMs in mouse and human ATM (pan markers) M1 M2
Mouse
Proteins F4/80; CD64;
CD115; CD68
CD11c; TLR4; CCR2; CCL2
CD206 ; CD301 ;
Ym1 ;Arg1;
Genes Emr1 CD68 Tnfα; Il6;
Ccl2, Nos2 Il10 ; Arg1, Mrc2, Mgl2, Clec7a, Stat6, Vegf
Human Proteins CD14; CD68 CD11c;
TLR4; CCR2 CD206;
CD163; IL10
Genes Mcp1; Tnfα ; Il10; Tgfβ
Adapted from Hill et al. 2014 (A. A. Hill, Reid Bolus, and Hasty 2014)
However, this convenient nomenclature does not reflect the real complexity of the in
vivo biology. The entrance in the genomic era and the advance characterisation of
macrophages in tissues shows that macrophages can indeed express both “M1” and
“M2” markers (Davies and Taylor 2015).

Chapter 1 Introduction
11
1.4 Adipose tissue macrophages
1.4.1 Maintaining a healthy AT: a balancing act for immune cells
Healthy AT is home to various immune cells that act to remodel the tissue and maintain
its functions. Lean AT contains anti-inflammatory (Th2-like) cells such as M2
macrophages, eosinophils, T regulatory cells (Treg) and invariant Natural Killer T
(iNKT) cells. They generally produce IL-10 which can repress tumor necrosis factor
(TNF) α and control inflammation (Ferrante 2013). Discovered only recently in AT,
iNKT are present in the murine and human AT and maintain tissue homeostasis
(Lynch et al. 2012). Obesity reduces their number in the tissue but restoring or
activating them shows positive outcomes such as insulin and glucose sensitivity
improvement (Lynch 2014). AT Foxp3+CD4+ Tregs express high levels of
peroxisomes proliferator activated receptors (PPAR) γ compared to lymphoid organ
Tregs. Their specific deletion inhibits drug-induced insulin sensitizing (Cipolletta et
al. 2012). AT Tregs reduce AT inflammation and promote insulin sensitivity notably
by their action on macrophages, adipocytes and T cells. Their loss, in obese AT,
aggravates insulin resistance (Feuerer et al. 2009; Tiemessen et al. 2007). Eosinophils
are important IL-4 producers, link to the promotion of M2 activation via the signal
transducer and activator of transcription 6 (STAT6), the improvement of insulin
sensitivity (Wu et al. 2011; Odegaard et al. 2007), but also the reduction of AT
inflammation, decrease body weight and AT mass (Ricardo-Gonzalez et al. 2010).
Surprisingly, helminth infection promotes eosinophilia and M2 macrophages in WAT
and consequently improves metabolic function and notably, insulin sensitivity and
glucose tolerance in HFD fed mice (Hussaarts et al. 2015).
During obesity, the immune balance is disturbed and leans towards inflammation,
notably with a “switch” of macrophage phenotype that I will further describe (Schipper
et al. 2012; Ferrante 2013). Figure 1.3 summarises the principal changes in immune
cells and cytokines produced during obesity.

Chapter 1 Introduction
12
Figure 1.3 Immune cells in AT in lean and obese Lean AT contains various anti-inflammatory immune cells, such as eosinophils, resident macrophages, Th2 cells, Treg cells important for AT homeostasis. In obese AT, pro-inflammatory immune cells infiltrate the tissue and promote cytokines production that perturb AT functions. Adapted from Choe et. al (Choe et al. 2016).
1.4.2 ATM roles and “switch”
ATMs in lean AT promote insulin sensitivity notably because they are able to secrete
IL-10, but also by removing dead cells and maintaining a healthy tissue (Osborn and
Olefsky 2012; Lumeng, Deyoung, and Saltiel 2007). Macrophage infiltration in AT
during obesity is one of the major elements occurring during the course of fat
expansion (Weisberg et al. 2003). Most studies have focussed on ATMs in the context
of obesity and on their pro-or anti-inflammatory properties. However, other beneficial
roles for ATMs in the maintenance of AT homeostasis have more recently emerged
(Figure 1.4)(Thomas and Apovian 2017). ATMs are involved in thermogenesis after
cold exposure or β adrenergic stimulation, by promoting FA mobilisation in WAT and
increasing uncoupling protein 1 (UCP1) gene expression (Wu et al. 2011; K. D.
Nguyen et al. 2011; Qiu et al. 2014). ATMs promote adipogenesis and angiogenesis
by secretion of platelet-derived growth factor and vascular endothelial growth factor.
Furthermore, depleting macrophages during adipogenesis limits AT development
Crown like structure
M2 macrophages
eosinophilsTreg M1 macrophages
neutrophilsTh1Th2
IL-10
M2 macrophageseosinophils
TregM1 macrophages
neutrophilsTh1
Th2
# #
IFN-yIL-6TNFα
Healthy AT AT dysfunction
NK cells

Chapter 1 Introduction
13
(Martinez-Santibañez and Nien-Kai Lumeng 2014). Most importantly, recent studies
showed a role for ATMs in the control of lipid efflux from AT, highlighting the fact
that the net release of FFA from AT might rely on ATMs lipid buffering ability, which
will be one of the axis of my thesis (Kosteli et al. 2010a; X. Xu et al. 2013; Boutens
and Stienstra 2016).
Figure 1.4 ATMs ensure tissue homeostasis ATMs are involved in lipid buffering, removal of dead cells, thermogenesis in beige
subcutaneous adipose tissue, adipose tissue development and insulin sensitivity. Their
presence ensures AT homeostasis.
Usually, macrophages represent 5-10% of the stromal vascular fraction (SVF) in lean
GAT, but can be multiplied by 5 in obese murine GAT, and by 3 in omental AT in
human (from 4% to 12%) (Harman-Boehm et al. 2007; Ferrante 2013). Compared to
lean AT, where ATMs are spread out in the tissue, during obesity, 90% of ATMs are
regrouped around apoptotic or necrotic adipocytes, in what is called “crown-like”
structures (CLS) (Figure 1.5). These structures appear in both mice and humans with
obesity (Cinti et al. 2005; Murano et al. 2008; Bigornia et al. 2012).

Chapter 1 Introduction
14
Figure 1.5 CLS in visceral AT in mouse (A) and human (B) Histological illustrations showing adipocytes surrounded by ATMs, forming CLS
(indicated by arrows). A From Murano et al., 2008. Scale bar 50 µm B From Bigornia
et al. 2012 (× 40).
As just mentioned, the existence of two states in adipose tissue: lean non inflammatory
and obese inflammatory led to the notion of ATM switch from M2 to M1 during
obesity (C. N. Lumeng et al. 2008). Lean AT has increased expression of genes
associated with an M2 signature such as Chi3l3, Arg1, Il10. In contrast, obese AT
contains a subset of CD11c+ macrophages, associated with inflammation (Tnfα, Nos2)
(Carey N Lumeng, Bodzin, and Saltiel 2007). Diphtheria toxin (DT) inducible
depletion of CD11c+ cells in obese mice reduced inflammation and the recruitment of
ATMs in the WAT and ameliorated insulin sensitivity (Patsouris et al. 2008b), thus
revealing the role of inflammatory macrophages in the deregulation of insulin
sensitivity during obesity. This raised the important question of the exact nature of
these ATMs and their origin (recruited or resident).
1.4.3 ATM Recruitment
It was first shown in the early 2000s by Weisberg and colleagues, that in mice
prone to obesity, a third of the transcripts coming from the GAT were genes related to
macrophages, notably Csf1r (also known as CD115) and Cd68. By generating fully
irradiated chimeric mice, they also showed that 85% of ATMs were coming from the
BM (Weisberg et al. 2003). However, full irradiation compromises the tissue as it
artificially increases recruitment as explained in 1.3.2. Following this important
publication, researchers got interested in the mechanisms controlling macrophage
recruitment in obese AT. MCP1 (CCL2) was shown to be elevated in murine obese
BA
CLSCLS

Chapter 1 Introduction
15
GAT (Kanda et al. 2006a). Similarly, in human, several other chemokines, including
CCL2, were also found increased in the omentum and serum of obese patients (Huber
et al. 2008). MCP1 is produced by a multitude of cells including adipocytes. When
FFA arrive in AT, they trigger adipocyte TLR4 activation which initiates an
inflammatory response, via NF-κB, and increases MCP1 expression by adipocytes
(Reilly and Saltiel 2017). ATMs themselves can produce MCP1 via the same
mechanisms (Catrysse and van Loo 2018). MCP1 receptor (CCR2) is expressed by
monocytes and recruited macrophages (C. N. Lumeng et al. 2007). Recruitment of
monocytes into tissues is CCR2 dependent and Ccr2-/- mice exhibit a low monocyte
count in their bloodstream, as they fail to exit the bone marrow to be recruited to tissues
(Tsou et al. 2007). CCR2 recruited monocytes in AT are pro-inflammatory (M1). They
express high level of IL-6, a pro-inflammatory cytokine. However, in Ccr2-/- mice,
ATMs are still present in the tissue, either as they rely on other recruitment signals or
because they could be resident. These cells showed a distinct gene profile (M2-like)
compared to the CCR2 recruited macrophages, the latter being more pro-inflammatory
(C. N. Lumeng et al. 2007). This study pointed to the fact that ATMs might not all be
CCR2 dependent.
1.4.4 ATM Proliferation
Recent studies showed that in addition to increased recruitment of BM derived
monocytes, there is an in situ proliferation of ATMs during obesity. This was measured
by 5-ethynyl-2′-deoxyuridine (EdU) injection, which labelled proliferating cells, 3h
before the cull in mice fed with HFD for 7 weeks. EdU labelled 1% of the
F480+CD11b+ cells (ATMs) in lean AT, whereas it labelled 4.5% in obese AT (Amano
et al., 2014). They confirmed this proliferation data by using an intracellular staining
of Ki67, a protein expressed during mitosis. Another group strengthened these results
and added that the IL-4/STAT6 pathway was one driver of ATM proliferation (Zheng
et al. 2016a). Consistently across these publications, proliferating macrophages
resided near CLS (Amano et al. 2014; Zheng et al. 2016a). One study showed that
these ATMs express M2 (CD206;CD301) rather than M1 markers and the authors
found proliferative CD68+ ATMs in obese patients, located in CLS (Haase et al.
2014a). The limitation of all these studies is that (i) the relative amount of recruited

Chapter 1 Introduction
16
and/or proliferative macrophages is hard to determine, (ii) macrophages are analysed
as a whole and this does not take into account that ATMs may be heterogenous in
terms of their BM dependency and their proliferative capacity. Therefore, there is still
clearly a debate about ATM origin during obesity that this thesis will explore.
1.5 Macrophages and lipid metabolism
1.5.1 Lipid buffering properties of macrophages
During fasting, lipolysis is increased to meet organ’s demand in energy. (Kosteli et al.
2010b; Fitzgibbons and Czech 2016). Obese mice put on calorie restriction
accumulated ATMs at day 3, which was quantified by CD68 and Emr1 (F4/80) gene
expression, but was not associated with inflammation nor accumulation of pro-
inflammatory CD11c+ ATMs or CLS (Kosteli et al. 2010b). ATMs accumulated lipids
in response to lipolysis, and became lipid laden, similarly to foam cell formation
during atherosclerosis (Babaev et al. 1999). The authors highlighted a relationship
between ATM content in GAT and FFA in the plasma of these mice, implying that
fasting is linked with a surge in ATMs to respond to the increase in FFA efflux from
AT. To support the buffering properties of ATMs, they transiently depleted
macrophages via injection of clodronate encapsulated liposomes (i.p.) which increased
FFA in the plasma. However, this technique ablates all macrophages, and by doing so
it is not clear if all macrophages can buffer lipids or just a specific subset (Kosteli et
al. 2010b). As mentioned in 1.2.1, basal lipolysis is also increased during obesity.
Staining with Nile red after adherence on plates showed that ATMs can uptake lipids
during HFD (C. N. Lumeng et al. 2007). Two other studies demonstrated that, contrary
to fasting, CD11c+ ATMs accumulated during HFD feeding and have the highest lipid
content when compared to CD11c- ATMs. CD11c+ ATMs represent, in some cases,
33% of ATMs in the tissue of obese mice, and assessing all CD11c- ATMs together
(67% of all ATMs) might mask a potential subset that would be more efficient than
CD11c+ cells at picking up lipids (Prieur et al. 2011; Grijalva et al. 2016). There is
thus an urgent need to acknowledge ATM heterogeneity of function.
Xu et al. move the concept forward by hypothesising that lysosomal lipolysis (the
hydrolysis of TG in FFA by the lysosomal acidic lipase, LAL) in ATMs played an

Chapter 1 Introduction
17
important role in lipid trafficking (Figure 1.6). To test this, they used chloroquine, a
strong inhibitor of lysosomal acidification which impairs LAL activity and thus stop
lipid degradation (Emanuel et al. 2014). Chloroquine increased the lipid content in
BM-derived-ATMs in vitro, and when added to obese AT explants, FFA efflux in
media was decreased. First, they concluded that AT lipolysis was ATM dependent.
The same observation was observed in vivo with decrease of serum FFA after injection
of chloroquine in obese mice. This action was totally reversed when macrophages were
depleted using clodronate liposomes (X. Xu et al. 2013). They concluded that there is
an increased lysosomal activity in ATMs to buffer lipids that are released from
apoptotic adipocytes during obesity. However the origin of these lipids was only
hypothetical and could be expanded to lipids from the circulation. Moreover, in their
model, all macrophages were depleted using chlodronate. Importantly, the authors
highlighted that lysosomal activation was not linked with a M1 ATM polarisation state
like during obesity (X. Xu et al. 2013). It is thus possible that macrophage origin
(recruited vs resident) dictates macrophage lipid handling, one being more
metabolically inclined to degrade lipids by fatty acid oxidation (FAO) for example.
Also, ATMs contained in CLS can liberate lysosomal enzymes by exocytosis to pre-
digest adipocytes needed to be phagocytised and be a source of lipids (Haka et al.
2016).
Figure 1.6 ATM lysosomal activity control lipid efflux. Obese adipose tissue release lipids that can be buffered by ATMs. A short
inhibition of lysosomal activity using chloroquine blocks lipid catabolism, induces lipids retention in ATMs, and decreases FFA efflux in the circulation. Adapted from Xu et al 2013
ADIPOCYTES
apoptosis
hypertrophy
FFATG
MACROPHAGES
LIPID EFFLUX
+ Chloroquine(inhibits lysosome)
Lipid retention
lysosomes
Short inhibition

Chapter 1 Introduction
18
1.5.2 Intrinsic lipid metabolism and lysosomes
Experiments in which BM macrophages were polarised toward M2 or M1
demonstrated that the energy need of M2 and M1 are highly different and that their
polarisation requires a different type of metabolic adaptation. Indeed, M2 rely heavily
on FA uptake and their oxidation in the mitochondria, while M1 favour glycolysis
(O’Neill, Kishton, and Rathmell 2016). In M2, FA are obtained by hydrolysis of TG
rich lipoproteins such as CM, LDL and VLDL. The scavenger protein CD36, located
at the macrophage’s surface, internalised TG which are catabolised by LAL in
lysosomes as described by Xu et al. (S. C.-C. Huang et al. 2014). CD36 dependent TG
uptake leads to increased oxidative phosphorylation (OXPHOS) rates. Blocking with
orlistat, a lipase inhibitor, decreases lipolysis and OXPHOS, and leads to a marked
reduction of M2 markers (such as CD206, CD301 and RELMα), indicating that M2
polarisation is dependent on lipid oxidation (Heck, Yanovski, and Calis 2000).
Targeting LAL induce lipid accumulation in M2 and decreased FAO, as measured by
a decrease in oxygen consumption rates (SeaHorse technology) (S. C.-C. Huang et al.
2014).
Lysosomes are abundant and active in ATMs from obese mice. They accumulate in
lipid laden macrophages, and do not corelate with a M1 phenotype (X. Xu et al. 2013).
A recent publication acknowledge that there rather is a “metabolic activation” of
ATMs during obesity, that does not resemble M1 or M activation (Boutens et al.
2018). Interestingly, ATMs contained in CLS upregulate glucose transporter (GLUT)
1 (Appari, Channon, and McNeill 2018). Micro-array analysis of ATMs revealed that
during obesity, ATMs showed an enrichment for set of genes involved in carbon
metabolism (glycolysis) and OXPHOS (Boutens et al. 2018). Although, this could
indicate that different types of ATMs coexist, and this is not as simple as ATMs
switching from M2 to M1. The field is thus starting to move forward. In addition, work
in the branch of atherosclerosis can give us some insight in the mechanism regulating
lipid cellular metabolism in ATMs.
Foam cell formation
Little is known about foam cell biology in ATMs but atherosclerosis has been more
largely studied. In atherosclerosis, macrophages uptake lipoproteins from the plaque

Chapter 1 Introduction
19
and its environment, notably oxidised LDL (oxLDL). LDL oxidation is promoted by
free radicals, 12/15-lipoxygenase (LO), and myeloperoxidase present in the arterial
wall. Tissue macrophages express scavenger receptors such as SR-A, LOX1, MARCO
and CD36 and can internalise and hydrolyse oxLDL in their lysosomes (Kunjathoor et
al. 2002). Lysosomes are guarantor of the degradation of vesicles coming from
phagocytosis (Jaishy and Abel 2016; Lim and Zoncu 2016). They contain proteases,
nucleases and lipases, enabling the digestion a wide range of molecules, including
lipids. After lysosomes catabolise lipoprotein into free cholesterol and FFA. FFA are
ligands of peroxisomes proliferator activated receptors PPARs (α, γ, δ). In vitro
activation of PPARs results in a rise in cholesterol efflux via increasing the number of
ABCA1 transporters (Rader and Puré 2005). Indeed, cellular free cholesterol can either
exit macrophages via these ABCA1 transporters, or traffic to the endoplasmic
reticulum (ER) to undergo modifications and form cholesteryl esters (CE) (Figure 1.7)
(Jeong, Lee, and Oh 2017). CE are packaged into lipid droplets that can be hydrolysed
via creation of autophagosomes, which are fused to lysosomes and hydrolysed by
LAL. The free cholesterol can then also exit via ABCA1 transporter (Emanuel et al.
2014). During the progression of atherosclerosis and diabetes, lipids are in excess and
more lipid droplets accumulate in the macrophage, but also into dysfunctional
lysosomes, which give its “foamy” appearance to the macrophage (Ouimet et al.
2011).

Chapter 1 Introduction
20
Figure 1.7 Lipid metabolism in macrophages of the atherosclerotic plaque Uptake of lipids and lipoproteines occurs via multiple receptors. Once in the macrophage, the lipid microparticles are degraded by the lysosomes into free cholesterol and FFA for ABCA1- dependent efflux. Free cholesterol traffic to the ER where it is esterified into CE and packaged into lipid droplets. Lipid droplets are integrated into autophagosome which fuse with lysosomes to be degraded into free cholesterol and FFA which can exit the cell (lipid efflux). Accumuation of CE in the macrophage give it its foamy appearance characteritic of the progress of atherosclerosis. Adapted from Moore, Shedy and Fisher Nat Review Immunology 2013
It is possible that saturation of lysosomal lipolysis in ATMs leads to the formation of
foam cells which become more inflammatory. Thus, there is a real importance of
studying ATM metabolism to understand obesity, lipid and meta-inflammation.
Interestingly, a receptor expressed on murine macrophages and dendritic cells has been
linked in numerous studies with dyslipidaemia in human (Kathiresan et al. 2009b;
Weissglas-Volkov et al. 2013). However the study of this receptor regarding metabolic
disease has been very poor.
Cholesterol EFFLUX
endosomelysosome
AUTOPHAGY
HETEROPHAGY
ER
RECEPTORS
Lipids
Free cholesterol
RECEPTORSCD36, LOX1, SRA1, SRB1, CD36/TLR4-TLR6,MARCO
Lipid dropletsLipoprotein
Cholesteryl ester
+FFACholesterol EFFLUX
CE

Chapter 1 Introduction
21
1.5.3 Timd4, gene coding for phosphatidylserine receptor on macrophages is associated with dyslipidaemia
The phosphatidylserine receptor Tim4 (T-cell immunoglobulin and mucin domain
containing protein 4), is present on macrophages of various tissues including spleen
macrophages, Kupffer cells in the liver and the resident large peritoneal macrophages
(Rosas et al. 2014; Davies and Taylor 2015). When cells die, they expose their
phosphatidylserine (PS) on their surface. This “eat me” signal is recognised by Tim4
macrophages for their engulfment (Miyanishi et al. 2007). The “Tim” family plays a
role in immune regulation , notably in allergy, asthma and autoimmunity (Freeman et
al. 2010). It contains 8 members (Tim1-8) in mouse and 3 in human. The murine Tim4
is an orthologue of the human Tim4. The Tim structure is made of an N
immunoglobulin-like extracellular domain, a mucin domain, a transmembrane domain
and a cytoplasmic region. The extracellular domain binds PS via a metal ion-dependent
ligand-binding site (Santiago et al. 2007). This part of the interaction in hydrophilic,
while the fatty acid and glycerol composing the rest of the PS interact with
hydrophobic residues on Tim4. The engulfment mediated by Tim4 is an ATP
dependent process (Park, Hochreiter-Hufford, and Ravichandran 2009). Tim4+ and
MerTK+ (myeloid-epithelial-reproductive tyrosine kinase) are required for the correct
engulfment of apoptotic bodies by peritoneal macrophages. Tim4 acts as a tethering
receptor and if blocked, the engulfment process is drastically reduced (Nishi et al.
2014). Tim4 resident macrophages in the peritoneal cavity synthesise the enzyme
12/15-lipoxygenase (12/15-LO) which directs the uptake of apoptotic cells towards
Tim4+ macrophages themselves and block their uptake by inflammatory monocytes,
indicating a key regulatory role for these macrophages in the control of phagocytosis
(Uderhardt et al. 2012). The 12/15 LO can oxidase lipids such as LDL, but no link yet
has been made between Tim4 and oxLDL uptake or any other lipids. Interestingly,
TLR4 activation (which can act with CD36 to uptake lipids) promotes Tim4 expression
(Ji et al. 2014). As said, TIMD4, the gene coding for Tim4, is found in humans.
Genome-wide association study (GWAS) showed association of TIMD4 (5q23 loci)
with blood LDL cholesterol in multiple studies, reviewed in Table 1-2 (Weissglas-
Volkov et al. 2013; Kathiresan et al. 2009a; Spracklen et al. 2017; Surakka et al. 2015;
Teslovich et al. 2010; Willer et al. 2013). However, these studies do not mention if the

Chapter 1 Introduction
22
single nucleotide polymorphisms (SNPs) found in the gene modify the protein
structure or function. In human, Tim4 macrophages are present in the spleen and tonsil
(Kobayashi et al. 2007). But there is no reported studies of human Tim4 ATMs.
Table 1-2 Genome wide association study involving Timd4
Single nucleotide polymorphisms (SNPS) reported in the chromosome 5, region 5q33.3, corresponding to Timd4 have been associated in several studies with traits such as cholesterol, LDL, triglycerides, hypertriglyceridemia. The P-value indicates the genome wide significance, and the OR (odd ratio) or BETA indicates the coefficient.

Chapter 1 Introduction
23
Contrary to other Tims, Tim4 does not contain tyrosine phosphorylation motif and
little is known about the intracellular signalling of this receptor (Freeman et al. 2010).
Despite the fact that the study from Park in 2009 showed that Tim4 doesn’t have a
direct signalling pathway, other studies mention an intracellular interaction between
Tim4 and AMPKα1 (Park, Hochreiter-Hufford, and Ravichandran 2009; Baghdadi et
al. 2013). Interestingly, AMPKα1 signalling promote M2 activation, reduce the
production of pro-inflammatory cytokines by macrophages and a global KO of
AMPKα1 enhance lipid accumulation in adipocytes suggesting a role of AMPKα1 in
lipid metabolism (W. Zhang et al. 2012). Indeed AMPK activates FAO in cells,
indicating that Tim4 macrophages could oxidise lipids (Jeon 2016). The GWAS
directed the interest of a team towards Tim4 blockade in atherosclerosis, pathology
linked with high level of LDL in the plasma. They showed that in ldlr-/- mice fed for 4
weeks with HFD, blocking Tim4, aggravated atherosclerosis as apoptotic cells
accumulates in the lesion and the blood, but also increased the proportion of activated
T cells in the bloodstream (Foks et al. 2016). This is the only study, to my knowledge,
studying the role of Tim4 in the setting of dyslipidaemia. Tim4 macrophages are
present in the peritoneal cavity on F4/80high “large” resident population (Rosas et al.
2014; Davies and Taylor 2015), but are also resident in the liver (Kupffer cells) and
the gut (Scott and Guilliams 2018; Shaw et al. 2018). At the onset of this PhD, it has
not been established if Tim4+ macrophages exist in AT (of human and mouse) and if
they could play a role in the control of lipid homeostasis which could explain the traits
found in GWAS.

Chapter 1 Introduction
24
1.6 Thesis aim and hypothesis
Defining the origin and the heterogeneity of ATMs is key to identify potential targets
against tissue inflammation and dyslipidaemia that occurs during obesity or HFD
stress. My overarching hypothesis is that ATMs are an heterogenous population and
that it encompasses populations of macrophages with various functions particularly
regarding lipid uptake and catabolism.
Therefore, this thesis aims to characterise and phenotype ATM subsets in order to
better understand their potential specific role in the tissue in lean (Chapter 3) and obese
(Chapter 4) AT. During the course of this research, a novel population of Tim4+
resident ATMs was identified. An additional aim of this thesis is thus to elucidate the
role of Tim4+ ATMs and Tim4 in adipose tissue homeostasis (Chapter 5). Finally, the
last aim of this thesis is to verify the existence of Tim4+ ATMs in human adipose
tissue.

25
CHAPTER 2 MATERIAL AND METHODS

Chapter 2 Material and methods
26
2.1 In vivo experiments
2.1.1 Animal
All animal experiments were carried out in accordance with the Animal (Scientific
Procedures) Act, UK 1986 following approval by the University of Edinburgh Animal
Ethical Review Committee and Vets through Experimental Request Forms. Mice were
housed in standard cages (except stated otherwise) and given food and water ab
libitum.
2.1.2 Time course experiments
C57BL/6J pups, bred in house, were taken and culled by neck dislocation.
2.1.3 HFD experiments
6-8 week old C57BL/6J males were put on a control diet (CD) (11kcal%Fat and corn
starch, Research diet, D12328i) or a high fat diet (HFD) (58Kcal%Fat and sucrose,
Research diet, D12331i) for variable periods of time (from 1 day to 14 weeks).
2.1.4 Oral glucose tolerance test (OGTT)
After 8 weeks of CD or HFD, mice were given a bolus of glucose to test their glucose
tolerance. Mice were fasted from 5-6 hours and put in the room where the OGTT was
conducted to limit stress. First basal fasting glucose was measured after blood was
taken by venesection. To read the measure, a commercially available glucometer was
used (Roche, Accu-Chek Performa Nano). Then mice were given a bolus of glucose
by gavage (2g/kg body mass) and blood was sampled at 15, 30,60 and 120 minutes
post-glucose to read the level of glucose.
2.1.5 Generation of chimeras
General
Protected/partial bone marrow irradiation was realised in collaboration with Dr
Stephen Jenkins and his team following a protocol they developed (Centre for
Inflammation Research, Queen’s Medical Research Institute, Edinburgh). First, mice
were sedated/anaesthetised and the upper half of the body (head, thorax and front set
of legs) exposed to lethal levels of gamma-irradiation (12Gy) for 19 min 30 seconds.
Mice were irradiated on a Perspex sheet over laying a 2 inch thick block of lead, with

Chapter 2 Material and methods
27
only the upper half (or the lower half) of the body uncovered, this for the maximum
protection of the adipose tissue. After irradiation, the mice were injected s.c. with
antisedan to reverse the sedation, and keep in a warm cage (30°C) up until awareness
was found again. Then they were randomly put in individually ventilated cages (5 by
cage). The next day, mice received 2 to 5 millions donor bone marrow cells iv obtained
in house. Mice were kept on mash for 2 weeks then put back on normal diet for 2
weeks. They received baytril for 4 weeks following irradiation to limit infection.
Chimeras and macrophage origin
Eight weeks old C57BL/6J Ly5.1 female mice were partially irradiated as described
in 2.1.5. Mice were reconstituted after radiation with congenic CD45.2+ WT BM or
Ccr2-/- BM obtained in house. After 8 weeks’ recovery, the gonadal and mesenteric
adipose tissue were collected for flow cytometry analysis (Figure 2.1). Irradiations
were conducted by Dr Stephen Jenkins lab.
Figure 2.1 Experimental design of partial BM chimeras After irradiation of the head, Ly5.1 host females (expressing CD45.1 and CD45.2), were injected i.v. with CD45.2+ donor BM or Ccr2-/- BM. After recovery, mice were then put on a control diet or a HFD (60% fat) for 8 weeks.
Chimeras and HFD
Eight weeks old Ly5.1 male and female mice were partially irradiated as described in
2.1.5, and reconstituted with congenic CD45.2+ WT BM. After 4 weeks of baytril and
mash + normal diet, mice were put on either a control diet (11kcal%Fat and corn

Chapter 2 Material and methods
28
starch, Research diet, D12328i) or a HFD (58Kcal%Fat and sucrose, Research diet,
D12331i). After 8 weeks of diet, mice were sacrificed by exsanguination under
terminal anaesthesia (Figure 2.2). Irradiations were conducted by Dr Stephen Jenkins
lab.
Figure 2.2 Experimental design of partial BM chimeras coupled with diet to study macrophage turn-over during HFD. After irradiation of the head, Ly5.1 host mice (expressing CD45.1 and CD45.2), both males and females, were injected i.v. with CD45.2+ donor BM. After recovery, mice were then put on a control diet or a HFD (60% fat) for 8 weeks.
2.1.6 In vivo Tim4 blockade
Mice were i.p. injected with 100µl of PBS containing either 200ng of monoclonal
antibody anti mouse Tim4 (aTim4) (clone RMT4-53, Rat IgG2a, BE0171 from
BioXCell) or 200ng of of rat IgG2a isotype control (Isotype) (BE0089 from BioXcell).
These concentrations were based on a publication from 2016 (Foks et al. 2016). The
experiments coupled with HFD were performed as shown in Figure 2.3

Chapter 2 Material and methods
29
Figure 2.3 Experimental design of Tim4 blockade during long (A) and short HFD (B) Male mice were given a HFD for 8 weeks (w: weeks) or for a shorter period of time (D: day). A After 4 weeks of diet, mice from both groups were i.p. injected twice a week for the rest of the experiment with 100µl of PBS containing either 200ng of blocking anti-Tim4 IgG2a or 200ng of isotype IgG2a control (plain arrow). An oral glucose tolerance test (OGTT) was performed 2 to 3 days before the cull. B Short HFD with injection of 100µl of PBS containing either 200ng of blocking anti-Tim4 IgG2a or 200ng of isotype IgG2a control (plain arrow)
2.2 Cell isolation
2.2.1 Human adipose tissue
Omentum or SAT were collected by surgeon in PBS. Shortly after collection ,tissues
were digested using the gentleMACS dissociator (Miltenyi Biotec). Tissues were put
in tubes containing 5ml of PBS BSA 2% and collagenase I (2mg/ml) (Worthington
LS004196), and after mechanical dissociation, were incubated in a water bath at 37°C
for 30 minutes, with a shake after 15 minutes. The reaction was stopped by using 25µl
of EDTA (0.5M). After filtration (100µm), tubes were spun at 700g for 10 minutes at
4°C to dissociate adipocytes from the stromal vascular fraction.
2.2.2 Murine adipose tissue
Adipose tissue were harvested in RPMI and kept at room temperature. Shortly after
the harvest, the tissues were weighed and put into the digestion media (Collagenase D

Chapter 2 Material and methods
30
10mg/ml in RPMI 1% FCS) (500µl/tubes). Each tissue was pre-cut with scissors to
facilitate the collagenase digestion, and put at 37°C for 30 minutes to 45 minutes. A
gentle mixing with pipetting up and down a few times after 15 minutes of incubation
was done. At the end of the incubation, EDTA (50mM) was added to the digests
(5µl/ml) to stop the enzyme by ion chelation. RPMI 1% FCS was added on top and
the digests were filtered (100µm – 75 µm) and centrifuged at 700g for 10 minutes at
4°C in order to separate the stromal vascular fraction (SVF ; containing leukocytes,
pre-adipocytes, fibroblasts) from the floating fraction (containing mainly adipocytes)
. If the floating fraction was needed, the centrifugation was done at room temperature
to avoid it to freeze. After separation, cells from the SVF was counted in 2 ml of RPMI
1% FCS with the Biorad cell counter.
2.2.3 Peritoneal cavity lavages
In order to retrieve the cells of the peritoneal cavity, mice were euthanised in a CO2
chamber. Quickly following death, 2ml of RPMI was injected in the cavity of
C57BL/6J mice. After a short shake of the cavity, the media was taken back and put
in falcon tubes on ice. Cells were then spun at 1200g for 5 minutes at 4°C. The pellet
contained immune cells for further analysis.
2.2.4 Liver
Livers were perfused with PBS to eliminate blood from vessels, and put on a tube on
ice. Using a razor blade, livers were chopped in small petri dishes with a few drops of
RPMI up until full homogenisation. Then, they were put in a 50ml Falcon tube with
the cocktail of enzyme described in Table 2-1 prepared in warm RPMI (5ml per liver).
The Falcons were placed in a water bath at 37°C for 22 minutes, with vigorous shaking
every 5 minutes. At the end of the 22 minutes, cold RPMI (30ml) was poured on top
of the liver digest and the mixture was filtered (100µm filter). Tubes were spun at 300g
for 5 mins, 4°C. For better results, a second filtration was done with a 70µm filter after
cell resuspension in 30ml of RPMI. Tubes were spun again at 300g for 5 mins and the
digests were resuspended in 5 to 10 ml and cells were counted.

Chapter 2 Material and methods
31
Table 2-1 Enzymes necessary for liver murine liver digestion Enzyme Concentration Suppliers
Collagnease V 0.8mg/ml Sigma Cat. No. C9263-1G
Collagenase D 0.625mg/ml Roche Cat. No. 11 088 882 001
Dispase 1mg/ml Gibco Cat. No 17105-041
DNase 30mg/ml Roche Cat. No. 101 104 159 001
2.3 In vitro experiments
2.3.1 Fatty acids dosage
Samples of blood were taken from a brachial exsanguination in tubes (BD Vacutained)
and spun at 1800g for 10 minutes to separate the plasma from the rest. FFA was
measure using a WAKO Kit ( reagent 1 : 434-91795; reagent 2: 436-91995) and
WAKO standard (4270-77000). A slightly modified protocol was used:
- Add 10µl of plasma in wells after gentle mixing to homogenise the sample
- Add of 150µl of reagent 1 for 3minutes (at 37°C)
- Add 75µl of reagent 2 for 4 minutes (at 37°C)
- Reading at 546nm and 660nm
2.3.2 Adhesion mediated purification of macrophages
Cells obtained from AT, PEC or liver were resuspended in serum free RPMI and
placed on a 24 well plate, up to 500 000 cells per well for AT and PEC, 1 million for
the liver (due to the fact that more cells (non-macrophages) are in the digests compared
to the other tissues). Each well contained a 13 mm coverslip to be able to analyse the
cells later by microscopy. After 30 minutes to 1h at 37°C in 5% CO2, the cells were
washed in RPMI (room temperature) 3 times. Macrophages are able to adhere to the
coverslip, and other cells are washed away (Davies and Gordon 2005).

Chapter 2 Material and methods
32
2.3.3 In vitro LDL uptake by macrophages
After adhesion mediated purification of macrophages, 300µl of media containing
50ng anti Tim4 or Isotype control for 30 minutes to 1h, then LDL-Bodipy (Invitrogen
BodipyTM FL low-density lipoprotein, 50ng/ml) was added. After 6 hours, lysotracker
(DND99) was added (500nM) for 30 minutes at 37°C to stain the lysosomes. The
coverslips were washed 2 times in PBS and fixed with 2-5% NBF for 10 min at RT.
2.3.4 Chylomicron uptake by macrophages
After adhesion mediated purification of macrophages, 300µl of media containing
50ng anti Tim4 or Isotype control for 30 minutes to 1 hour, then chylomicrons (Human
plasma CM, CMIC15-N from Alpha Diagnostic, 83µg/ml) was added for 3 hours.
Before the end of the incubation, Lysotracker (DND99, 500nM) was added for 30
minutes at 37°C to stain the lysosomes. The coverslips were washed 2 times in PBS
and fixed with 2-5% NBF for 10 min at RT.
2.4 Techniques of analysis
2.4.1 Flow cytometry
Staining
Cells were plated in 96 well plate and the staining was realised in a total volume of
50µl/well. If no intracellular staining was required, the cells were stained in 2 steps
(on ice):
• 10 minutes in blocking buffer (25µl per well)
• 30 minutes in antibody mix (25µl per well), made in FACS buffer
• Wash 2 times in FACS buffer and resuspend in 200µl of FACS
• Add 2µl of DAPI before flow acquisition (Sigma Aldrich;1mg/ml stock)
If fixation and/or intracellular staining was needed, the following steps were followed
for each samples:
• 10µl of Live/Dead (Thermofisher) diluted in PBS, 10 minutes at room
temperature in the dark

Chapter 2 Material and methods
33
• 15µl of blocking buffer for 10 minutes on ice
• 25µl of antibody mix
• Wash 2 times in FACS buffer
• Fixation/permeabilization 1 hour (eBioscience) or fixation with 5% NBF for
10 minutes followed by permeabilization (eBioscience) 30minutes and intra-
cellular staining in permeabilization buffer.
Samples were acquired using a BD LSR 5 Fortessa and analysed with FlowJo software
(Tree Star).
Table 2-2 List of buffers BUFFER NAME COMPOSITION Manufacturer Blocking buffer 1x FACS Buffer
20% rat and mouse serum FcR CD16/32 (1/300)
Biolegend 10x FACs Buffer 50 ml of PBS
2.5g Bovine Serum Albumin 2 ml of 0.5M EDTA
Sigma Sigma Sigma

Chapter 2 Material and methods
34
2.4.2 Gating strategy
Bone marrow chimeras
Figure 2.4 Gating strategy used to define immune cells in the GAT after generation of BM chimeric mice. After generation of BM chimeras as decribed in 2.1.5, GAT and MES imune cells were
analysed by flow cytometry and imune subsets were gated as presented (A). To define
the non-host chimerism, cells were gated on CD45.2+ cells as shown in B.

Chapter 2 Material and methods
35
Table 2-3 Flow cytometry antibody clones, manufacturer and titration (mouse) Antigen Name
Conju-gate
Clone Isotype Manu-facturer Concen-tration
Titra-tion
CD11b PE Dazzle
M1/70 Rat IgG2b Biolegend 0.2 mg/ml 1/1200
CD11c BV605 N418 Armenian Hamster IgG
Biolegend 0.2 mg/ml 1/200
CD19 BV421 6D5 Rat IgG2a
Biolegend 0.2 mg/ml 1/200
CD206 FITC MCA2235FA
Rat Miltenyi 1/200
CD45.1 PE/Cy7 A20 Mouse IgG2a Biolegend 0.2 mg/ml
1/200
CD45.2 BV650 104 Mouse IgG2a
Biolegend 0.2 mg/ml
1/200
F4/80 PE/Cy7 BM8 Rat IgG2a Biolegend 0.2 mg/ml
1/200
KI-67 FITC REA183 recombinant human IgG1
Miltenyi 100 tests /ml
Live/dead
(405nm)
Thermo-Fisher (Stock
diluted in 12.5µl DMSO)
1/300
Ly6C AF700 HK1.4 Rat IgG2c Biolegend 0.5 mg/ml 1/200
Ly6G BV421 1A8 Rat IgG2a
Biolegend 0.2 mg/ml
1/200
MHCII IIA/IE
APCe780
M5/114.15.2
Rat / IgG2b ebiosciences 0.2 mg/ml
1/600
Siglec F BV421 E50-2440 Rat LOU BD 0.2 mg/ml 1/200
TCRb BV421 h57-597 Armenian Hamster IgG
Biolegend 0.2 mg/ml 1/200
Tim4 PE RMT4-54 Rat IgG2 ebiosciences 0.2 mg/ml 1/1200
Lysotra-cker
(DND99)
RED
577⁄590
ThermoFisher 1mM 1/1500

Chapter 2 Material and methods
36
Figure 2.5 Gating strategy used to define macrophages in human visceral AT (omentum). Flow cytometry plots showing the gating strategy used to define ATM in human.
Macrophages were gated on Live cells (DAPI negative), singlets, CD45+, CD15-Lin-
CD11b+ cells then divided according their CD16 and CD14 expression.
Table 2-4 Flow cytometry antibody clones, manufacturer and titration (human) Antigen Name
Conjugate Clone Manufacturer Isotype Titration
CD14 e 450 HCD14 Biolegend Mouse IgG1 1/25 CD163 BV605 Biolegend Mouse IgG1 1/20 CD45 BV650 HI30 Biolegend Mouse
IgG2a 1/20
Tim4 PE/Cy7 9F4 Biolegend Mouse IgG1 1/10 HLA-DR FITC L243 Biolegend Mouse IgG2 1/20 CD19 PE HIB19 Biolegend Mouse IgG1 1/40 NCAM PE MEM-
188 Biolegend Mouse
IgG2a 1/40
CD3 PE HIT3a Biolegend Mouse IgG2a
1/40
CD15 PEDazzle 594
W6D3 Biologend Mouse IgG1 1/40
CD62L PerCPcy55 DREG-56
Biolegend Mouse IgG1 1/20
CD16 BV711 3G8 Biolegend Mouse IgG1 1/20 CD11b AF700 M1/70 Biolegend Rat IgG2b 1/200 CD64 APCcy7 10.1 Biolegend Mouse IgG1 1/20 CD206 AF647 15_2 Biolegend Mouse IgG1 1/20

Chapter 2 Material and methods
37
2.4.3 Cell sorting and cytospin
Cells were stained as described in 2.4.1. Cells were then sorted (FACS ARIA) in tubes
containing RPMI complemented with 10% FCS. 100µl of the cell suspension were
transferred to a cytocentrifuge cytofunnel containing a slide and a filter card. Cells
were cytospined for 3min at 300g onto the slide (X. Zhang, Goncalves, and Mosser
2008). Shandon™ Kwik-Diff™ (Thermofisher) staining solutions was used to stain
the cells according to the manufacturer’s instructions.
2.5 Microscopy
2.5.1 Whole mount immunofluorescence staining for confocal microscopy
The samples were fixed in 10% neutral buffered formalin (NBF, Sigma) for 2 hours
on ice then transferred in PBS. The tissues were cut in smal pieces to facilitate the
staining and the mounting. The staining was realised in 3 steps:
• Permeabilization with Triton 1% (Sigma) for 30 min *
• Antibody mix in 1%Triton*/PBS BSA 1% (1:1) for 2 hours on a shaking plate
(room temperature) or overnight at 4°C
• Wash 3 times in PBS
*To visualise lipids or lysosomes in macrophages, triton 0.1% or no triton at all was
added.
The tissues were mounted in a mounting media (Fluoromount, Sigma Aldrich) as
shown in Figure 2.6 (Wang, Scherer, and Gupta 2014).
Figure 2.6 Mounting of tissue for microscopy analysis The tissues were place in the middle with mounting media. Vaseline was placed
and a coverslip was added on top. To seal the coverslip, nail varnish was added around, or in some cases superglue.

Chapter 2 Material and methods
38
The antibodies used for immunofluorescence microscopy are listed in the table below
Table 2-5 Antibodies used for immunofluorescence staining Antigen Name Conjugate Manufacturer Titration
Tim4 anti mouse APC Biolegend 1/50
CD11b PB Biolegend 1/200
Anti-rat IgG AF 647 Invitrogen 1/400
Tim4 anti human APC Biolegend 1/50
Lysotracker RED ThermoFisher 75 to 500nM
2.5.2 Lysotracker and LipidTox staining
Lysotracker staining. Lysotracker red (577/590; Lysotracker red DND99 from
TermoFisher) was used on live cells (500nM) and tissues (1/1000). The dye was
diluted in warm RPMI, and put with the cells/tissues for at least 30 minutes. Then the
tissues were fixed in formalin neutral buffer (10%) followed by wholemount staining.
The cells were fixed in formalin neutral buffer 2-5% and kept in PBS in the fridge for
following staining.
LipidTox staining. HCS LipidTox Green Neutral lipid stain from Invitrogen was used
to stain neutral lipids after fixation. If used on cells the concentration was of 1/500 and
on tissues 1/100. Permeabilization reduced the dye intensity, so only a gentle
permeabilization (0.1% Triton) should be done or none at all.

Chapter 2 Material and methods
39
2.5.3 Fiji analysis
Intensity measurement in single cell
In order to analyse the intensity of lysotracker and lipid content for each cell, I created
a macro to run on FIJI, a free image processing software:
run("Duplicate...", "duplicate channels=4"); run("16-bit"); setAutoThreshold("Default dark"); //run("Threshold..."); setThreshold(30, 255); run("Analyze Particles...", "size=10-Infinity display exclude clear add in_situ");
The first step included the duplication of the channel 4 (with Tim4 APC staining), then
the identification and count of positive cells, and to finish the measurement of
fluorescence intensity. The threshold to identify Tim4+ macrophages was defined on
the first image and was not changed. The lysotracker and lipid intensities were
measured on raw images, with no change of threshold or image modification (Figure
2.7).

Chapter 2 Material and methods
40
Figure 2.7 Example of automatized measurement of lysotracker and lipid intensity using FIJI After taking images using the LEICA SP5 microscope (x40) (A), images were analysed using FIJI software (B). The macro created in FIJI (bottom panel), allowed to select Tim4+ cells, according to a set Threshold (upper left panel). The area was stored in the “region of interest” manager. Then the intensity for each channel could be measured within each Tim4+ cells (upper right panel).

Chapter 2 Material and methods
41
2.6 Statistics
Statistical analyses were performed using GraphPad Prism 7 software (GraphPad
Sotware Inc., La Jolla, CA). Differences between two groups or two cell populations
were determined in two steps : D'Agostino-Pearson omnibus normality test was done
to rule on the distribution of the data then a nonparametric unpaired Mann-Whitney t
tests was done (non-gaussian distribution). One way ANOVA on ranks (Krustal-
Wallis H Test) was used to compare two or more groups. Two way ANOVA, with
multiple comparisons made using Tukey post-hoc tests, was used for analysis of
variables of two factors (for example sex and diet / treatment and diet), and their
interaction. Data are shown as mean ± SEM. Full details of analyses are described
within each figure legend.

42
CHAPTER 3 ATM REPLENISHMENT BY BM DERIVED MONOCYTES SHOWS TISSUE
HETEROGENEITY
Chapter 3 ATM replenishment by BM derived monocytes shows tissue heterogeneity
43
3.1 Introduction
WAT is the primary site of lipid storage in the body, and can represent from 5
to 50% of human body weight. Despite adipocytes being voluminous, immune cells
constitute the second major component of the tissue, infiltrated between adipocytes.
AT macrophages (ATMs) have been highlighted during obesity, especially in the
visceral adipose tissue, as they can expand 10 times in number (Weisberg et al. 2003).
Most study have then focused on determining the pro-inflammatory phenotype of
ATMs (Catrysse and van Loo 2018). Nonetheless ATMs represent the most abundant
immune cells in lean AT, constituting around 5% of the tissue, and their maintenance
is essential for AT function as ATMs contribute to AT expansion, tissue remodelling,
lipid buffering, removal of apoptotic adipocytes and non–shivering thermogenesis
(Ferrante 2013; Thomas and Apovian 2017; Catrysse and van Loo 2018). In lean fat
depots, F4/80+ ATMs are viewed in the current scientific literature as being anti-
inflammatory M2-macrophages, in contrast with macrophages in obese AT which are
frequently classified as being inflammatory M1-macrophages (Lumeng et al., 2008).
These M2 ATMs can express CD206+, CD301+ and encode anti-inflammatory proteins
(C. N. Lumeng et al. 2008). Despite this M1/M2 classification, ATMs are often
considered as one group of cells instead of acknowledging their inherent heterogeneity
of function and/or origin, as seen in other tissues. For instance, the developmental
origin of ATMs had still not been elucidated and the existence of any local
maintenance mechanisms had not been investigated which was reflected by the lack
of ATMs in the biggest reviews on macrophage origin in tissues in the recent years
(Hoeffel and Ginhoux 2015; Ginhoux and Guilliams 2016). In tissues, resident
macrophages, which support homeostatic functions, are distinguished from newly
recruited CCR2+ macrophages which are considered as inflammatory macrophages
(Davies et al. 2013; Ginhoux and Guilliams 2016). Indeed, inflammation triggers the
recruitment of Ly6chigh monocytes, which by expressing CCR2, enter the tissues and
differentiate into ‘recruited’ macrophages (Komornik 1985; Shi and Pamer 2011).
Conversely, resident macrophages can be embryonically derived, and/or proliferate
independently from the bone marrow (BM) (Davies and Taylor 2015; Hoeffel and
Ginhoux 2015; Epelman, Lavine, and Randolph 2014b). To determine the origin of
tissue macrophages in adults, generation of partial bone marrow (BM) chimeric mice

Chapter 3 ATM replenishment by BM derived monocytes shows tissue heterogeneity
44
is now widely used (Jenkins et al. 2011; Komornik 1985; Calum C Bain et al. 2014).
By injecting donor BM into a host after partial irradiation, where the tissues of interest
are shielded, it is possible to follow these cells 8 weeks after reconstitution to evaluate
the BM dependency of the macrophage population. Injecting Ccr2-/- BM alongside in
control mice allow to verify the monocytic origin of macrophage in tissues (Calum C
Bain et al. 2014; Serbina and Pamer 2006; Epelman et al. 2014). One study of this kind
was done on AT, where authors showed that 85% of ATMs were coming from the BM
but the researchers used total irradiation which is known now to artificially increase
the number of cells coming from the BM (Weisberg et al. 2003). Thus, it is important
to use new technique to investigate ATM BM dependency. In rodent, SAT appears
before the GAT, and can be studied from birth (Berry et al. 2013). However, SAT
macrophage composition at birth is not known but could be an indicator of macrophage
embryonic origin, notably by the study of their F4/80 and MHCII expression (Schulz
et al. 2012b).
3.2 Aim of this chapter
• Determine the origin of ATMs in lean adipose depots of adult mice using
partial bone marrow chimeras to define resident and recruited macrophages.
• Follow AT development after birth to study the dynamics of macrophage
recruitment to the subcutaneous AT (SAT)

Chapter 3 ATM replenishment by BM derived monocytes shows tissue heterogeneity
45
3.3 Experimental design
Partial bone marrow chimeras. To study the contribution of monocytes to the
development of adipose tissue macrophage (ATMs) populations we used adipose
tissue protected BM chimera in collaboration with the laboratory of Dr Stephen
Jenkins. Host Ly5.1 female mice (CD45.1+CD45.2+) were partially irradiated (either
leg irradiation or head irradiation), with a shield covering ¾ of the body and then
reconstituted with congenic WT BM (CD45.2+) or Ccr2-/- BM. After 8 weeks’
recovery, GAT, MES AT and SAT were collected to study the non-host chimerism by
flow cytometry.
Figure 3.1 Experimental design of partial BM chimera generation

Chapter 3 ATM replenishment by BM derived monocytes shows tissue heterogeneity
46
3.4 Results
3.4.1 Novel gating strategy to characterise adipose tissue macrophage subsets
In AT, macrophages were generally described as being “F4/80+CD11b+” cells.
However, the gating strategy used by flow cytometry could be refined notably by
looking at the levels of F4/80 (high or low) and by using Tim4, a phosphatidylserine
receptor generally used to define resident macrophages in the peritoneal cavity (K.
Wong et al. 2010). Using F4/80, Tim4 and CD11c, generally used to characterise
recruited inflammatory ATMs, (Carey N Lumeng, Bodzin, and Saltiel 2007), four
subsets of ATMs could be distinguished (Figure 3.2A):
- F4/80+CD11b+Tim4+ CD11c- (named Tim4+ subset)
- F4/80+CD11b+Tim4+CD11c+ (named CD11c+ subset)
- F4/80highCD11b+Tim4-CD11c- (named double negative F4/80high subset)
- F4/80lowCD11b+Tim4-CD11c- (named DN F4/80low subset)
As seen in Figure 3.2B-C, DN F4/80high represented 71% of the ATMs, so the vast
majority of ATMs. The Tim4+ ATMs were also F4/80high, representing 11% of the
total ATMs, the CD11c+ were majorly F4/80low (6% of the ATMs), with a negligible
proportion F4/80high.. To finish the DN F4/80low only represented 12% of the ATMs.

Chapter 3 ATM replenishment by BM derived monocytes shows tissue heterogeneity
47
Figure 3.2 Gating strategy used to define ATM subsets and their relative proportion A. Density plot showing expression of Tim4 and CD11c (left) on F4/80+CD11b+ ATMs and the gating used to define Tim4+ ATMs, CD11c+ ATMs and the expression of F4/80 and CD11b on Tim4- CD11c- ATMs (right) and the gating used to define Tim4- CD11c- F4/80 high and Tim4- CD11c- F4/80low ATM populations. B. Histogram showing Mean Fluorescence Intensity of F4/80 on ATM populations as gated in A. C. Proportion of each subset within ATM.

Chapter 3 ATM replenishment by BM derived monocytes shows tissue heterogeneity
48
3.4.2 Tissue non-host chimerism of immune cells in the adipose tissue
The model of protected BM chimeras was used to elucidate the origin of ATMs
based upon studies released previously in the peritoneal cavity (Jenkins et al. 2011;
Murphy et al. 2008). In brief, after partial irradiation, Ly5.1 recipient mice (expressing
CD45.1 and CD45.2) were injected iv with CD45.2 wild type (WT) or Ccr2-/- KO
donor BM. Chimerism of immune cell populations was studied 8 weeks later in the
blood. GAT and mesenteric AT (MES AT) were taken to study the replenishment
(non-host chimerism) of the ATM populations. This was performed by analysing the
proportion of CD45.2 donor cells for each subset as presented in Figure 3.3. ATMs
(F4/80+CD11b+) were further divided according to their CD11c and Tim4 expression
as shown in Figure 3.2.

Chapter 3 ATM replenishment by BM derived monocytes shows tissue heterogeneity
49
Figure 3.3 Tissue chimerism of immune cells in GAT After irradiation of the legs, Ly5.1 recipient mice (expressing CD45.1and CD45.2) were injected iv with CD45.2 wild type (WT) or Ccr2-/- KO donor BM. Non-host chimerism was studied by flow-cytometry 8 weeks after irradiation. Dot plot analysis showing gating of CD45.1 donor cells in CD45+SiglecF+CD11b+MHCII- eosinophils, Ly6c+CD11b+MHCII- monocytes, CD45+Gr1+CD11b+MHCII- neutrophils and CD45+F4/80+CD11b+MHCII+ macrophages (left). Chimerism of ATM subsets were further analysed using gating defined in Figure 3.2 (right).
In this model of partial irradiation, granulocytes and monocytes, short lived
immune cell populations entirely replenished in 8 weeks, showed a non-host
chimerism of 30%. This percentage was in agreement with the percentage of body
surface irradiated. As expected, Ly6chi monocytes non-host chimerism was dependent
on CCR2 as shown by the decrease in non-host chimerism in mice reconstituted with
Ccr2-/- BM, but the granulocytes were not (Figure 3.4).
CD45.2

Chapter 3 ATM replenishment by BM derived monocytes shows tissue heterogeneity
50
Figure 3.4 Mice reconstituted with Ccr2 knock-out (Ccr2-/-) BM had a low monocyte (Ly6Chi) non-host chimerism but CCR2 deficiency did not affect granulocytes. Partial BM chimeras were set up as described in Figure 3.3. Graph showing non-host chimerism of granulocytes (left) and monocytes (right). Data pooled from 3 independent experiments (n=3-5 mice per experiments) and given by Calum Bain in Steven Jenkins lab. Bar represents the mean. Student t test ****: P<0.0001
In AT, the non-host chimerisms of eosinophils, neutrophils and monocytes
were similar to the non-host chimerism of granulocytes and monocytes in the blood
(Figure 3.5). As expected only the Ly6Chigh monocyte compartment non-host
chimerism was dependent on CCR2 (Figure 3.5). When looking at F4/80+CD11b+
ATMs, independently of their Tim4 or CD11c expression, the ATM non-host
chimerism was lower (14%) compared to the granulocytes and monocytes, but CCR2
dependent, confirming their monocytic origin. Non-host chimerism in the GAT and
MES AT were comparable, thus indicating that both tissues had similar degrees of BM
dependency for these cells (Figure 1.4B).

Chapter 3 ATM replenishment by BM derived monocytes shows tissue heterogeneity
51
Figure 3.5 Non-host chimerism of eosinophils, neutrophils, monocytes and macrophages in GAT and MES AT. Partial BM chimeras were set up as described in Figure 3.3. Graph showing non-host chimerism of eosinophils, neutrophils, Ly6chigh monocytes and ATMs in the GAT (A) and MES AT (B). Data pooled from 2 or 3 independent experiments (n=3-5 per group per experiments). Bar represents the mean. Student t test ***: p<0.001, ****: p<0.0001

Chapter 3 ATM replenishment by BM derived monocytes shows tissue heterogeneity
52
3.4.3 Non-host chimerism of ATM subsets was heterogenous
ATMs were further divided according to their F4/80, Tim4 and CD11c
expression, as shown in Figure 3.2. Both DN F4/80low and CD11c+ ATM subsets
showed a non-host chimerism comparable to blood monocyte (29%) (Figure 3.6). In
contrast, the DN F4/80high subset showed an intermediate non-host chimerism (10%)
and the Tim4+ subset a low non-host chimerism (5%). All non-host chimerisms for
these ATM subsets were dependent on CCR2 apart from the MES AT where the non-
host chimerism in the Tim4+ population was too low to allow detection of a defect in
replenishment in Ccr2-/- reconstituted mice.
To take into account variability in the degree of irradiation that each individual
mouse was exposed to, the non-host chimerism of each ATM subsets was normalised
to the WT non-host chimerism of blood monocytes. While CD11c+ and DN F4/80low
showed a replenishment of up to 100% by host derived cells, dependent on CCR2, and
the F4/80high subset showed only 40% turnover after 8 weeks which was also dependent
on CCR2, the Tim4+ ATMs had the slowest turnover of 10% of cells replaced by
donor cells after 8 weeks. Once adjusted to blood chimerism, the slow turnover of
Tim4+ ATMs was not significantly different in mice reconstituted by WT or Ccr2-/-
BM indicating that replenishment was maybe not dependent on CCR2 expression by
monocytes or only very slowly replenished by the BM and could not be detected after
8 weeks (Figure 3.7). F4/80low ATMs (CD11c+ of or not) were significantly more BM
dependent than F4/80high ATMs. The “waterfall” transition from monocytes to
macrophages (F4/80 and MHCII acquisition and loss of Ly6c ) can be observed in this
gate and is the illustration of their BM dependency (data not shown).

Chapter 3 ATM replenishment by BM derived monocytes shows tissue heterogeneity
53
Figure 3.6 ATM subsets in GAT and MES AT showed an heterogeneous non-host chimerism Partial BM chimeras were set up as described in Figure 3.3. Data reprensent the non-host chimerism for each ATM subsets, described in Figure 3.2. Data pooled from 2 independent experiments (n=3-5 per group per experiment). Bar represents the mean. Student t test ****: p<0.0001; *** p<0.001

Chapter 3 ATM replenishment by BM derived monocytes shows tissue heterogeneity
54
Figure 3.7 Tim4+ ATMs had the lowest normalised non-host chimerism which could not be distinguised from the mice injected with CCR2 KO when compared to other ATM subsets. Partial BM chimeras were set up as described in Figure 3.3. Non-host chimerism of each ATM subsets, gated in Figure 3.2, was normalised by the non-host chimerism of blood monocytes of the WT mice. Data pooled from 3 independent experiments (n=3-5 per group per experiment). Column shows the mean for each group. One-way Anova (non-parametric) ****: p<0.0001; ns: non-significant
CD11c+
DN F4/80low
DN F4/80h
igh
Tim4+
norm
alis
ed b
y W
T bl
ood
chim
eris
m
0
50
100
150
200**
****
********
ns
WTCCR2 KO

Chapter 3 ATM replenishment by BM derived monocytes shows tissue heterogeneity
55
3.4.4 Head irradiation as a method to study macrophage replenishment in tissues located in the peritoneal cavity
The difference between MES AT and GAT non host chimerism in the resident
Tim4+ subset suggested that irradiation of the back legs may have partially exposed
the GAT to irradiation, as this depot is located lower than the MES AT. By doing so,
it is possible that it displaced the Tim4 ATMs and increased the non-host chimerism
artificially. In collaboration with the laboratory of Dr Stephen Jenkins, head
irradiations were conducted to verify this hypothesis (Figure 3.8). After normalisation
to the chimerism of the blood monocytes for each mouse, the leg irradiation led to a
low non-host chimerism for the Tim4+ subset as found previously. However by
irradiating the head, the percentage of chimerism in the Tim4+ subset in the GAT was
not different from the MES AT (Figure 3.8). Furthermore, during this experiment, the
subcutaneous ATMs population was also studied. The Tim4+ ATM subset in the
subcutaneous AT (SAT) had a similarly low non-host chimerism compared to the MES
and GAT. Thus head irradiation is a safer option to study ATM replenishment.
Figure 3.8 Head irradiation decreased differences of Tim4+ non-host chimerism between the GAT and the MES AT, and was a better option to study ATM replenishment using partial BM chimera Partial BM chimeras were set up as described in Figure 3.3, except that some mice were head irradiated, while some mice were leg irradiated. The non-host chimerism of Tim4+ ATMs, as gated in Figure 3.2, was normalised by the non-host chimerism of blood monocytes for each mouse. Tim4+ macrophages from GAT, MES AT and Subcutaneous AT (SAT) were analysed. Data from 1 experiment (n=5). Student t test *: p<0.05
GATMES SC
GAT HMES H
SC H0
20
40
60
80
100
**ns
Nor
mal
ised
by b
lood
ch
imer
ism
GAT MES
SATGAT
MESSAT
Legs Head
A

Chapter 3 ATM replenishment by BM derived monocytes shows tissue heterogeneity
56
3.4.5 Phenotyping of ATMs in lean GAT
Having established the existence of at least 4 subsets of ATMs with various
degrees of dependency on BM monocyte for their replenishment, these subsets were
further characterised by using other macrophage markers used broadly in the literature
(Figure 3.9). All subsets expressed CD115 or colony stimulating factor-1 receptor
(Csf1R), which is expressed by all macrophages in tissues and control their
development and differentiation (Jenkins and Hume 2014). Interestingly all ATMs
expressed Relma (resistin-like molecule alpha), a marker associated with repair.
F4/80high macrophages (Tim4+ and Tim4-) expressed CD206 and CD301 (data not
shown), markers associated with endocytosis, phagocytosis, repair and alternative
activation (Haase et al. 2014b). CD64, a Fc-gamma receptor, is used to differentiate
ATMs from dendritic cells (DCs) in AT (Cho et al. 2016). F4/80high ATMs expressed
CD64 in greater proportion than F4/80low ATMs, indicating than the latest could be
freshly differentiating from monocytes in the tissue.
Figure 3.9 Histograms showing CD64, CD206, Csf1R and Relmα expression on ATMs macrophages ATMs from GAT were stained for CD64, CD206, CD115 and Relma. The negative control (fluorescence minus one) is represented in plain grey for each subset.

Chapter 3 ATM replenishment by BM derived monocytes shows tissue heterogeneity
57
3.4.6 Tim4+ ATMs were resident in subcutaneous AT and present at birth at a very low proportion
SAT macrophage description is still limited and, as for the visceral AT, their
origin is not known. SAT is present at birth, contrary to the GAT (Wang et al. 2013).
Therefore combining both chimeras (in adults) and time course in new born could be
a simple method to follow macrophages dynamic during development, when other
methods are not available. It was not always possible to distinguish a clear F4/80high
and F4/80low population in adult SAT. This was possibly due to the lower number of
ATMs recovered from the SAT compared to GAT and MES AT. Therefore ATMs in
the SAT were divided in 3 subsets, disregarding their F4/80 expression, as shown in
Figure 3.10 : Tim4+, CD11c+ and Tim4-CD11c- (double negative: DN). After head
irradiation, the three subsets of ATMs showed the same pattern of non-host chimerism
as ATMs in the GAT. CD11c+ cells showed a high non-host chimerism comparable to
blood monocyte and Tim4+ cells showed a low non-host chimerism.
Figure 3.10 SAT macrophages were heterogeneous and Tim4+ ATMs had a low BM dependency. After head radiation, wild type CD45.1 bone marrow was injected intraveneously to CD45.1/.2 mice, and followed after 8 weeks of replenishment. The non-host chimerism is the percentage of CD45.1 cells within each subsets. A. Cells were gated on live CD45+SiglecF-Ly6c-MHCII+F4/80+CD11b+ and divided
on their Tim4 and CD11c expression. (B). Tissue non-host chimerism. Data from 1
experiment (n=5) ± SD. One way anova *: p<0.05.
C+ DN T+0
20
40
60
80
SC CHIMERISM HEADSAT
macrophages
Tiss
ue ch
imer
ism
*Tim-4+
DN CD11c+
Tim
4
CD11b
A B
CD11c

Chapter 3 ATM replenishment by BM derived monocytes shows tissue heterogeneity
58
To study the origin of the resident Tim4+ ATMs, SAT was taken from pups
and analysed by flow cytometry over a time course from birth to adulthood. Typically,
yolk sac derived macrophages present a F4/80bright phenotype, contrary to F4/80low
cells, derived from HSC, thus this could be an indicator of ATM origin (Schulz et al.
2012b). At birth, SAT was void of lipids (data not shown) and weighing aroung 5 mg
(Figure 3.11). Quickly, the size of the fat pads expanded (ten-fold heavier after 1 week)
and reached around 230 mg at 4 weeks and remained stable up to adulthood. At birth
all macrophages were F4/80high , suggesting a YS origin. Shortly after, during SAT
expansion, a F4/80low population was distinguished up until 4 weeks, then the frontier
between the F4/80low and F4/80high ATMs was less clear (Figure 3.12A). Moreover, as
shown in Figure 3.12B, shortly after birth (postnatal day 1: P1) the F4/80high
macrophages present were MHC-IIlow (population IV), again resembling what have
been described in the literature as being YS derived macrophages (Ginhoux and
Guilliams 2016). At the first week of life (P7), MHC-IIhigh cells appeared (population
I) and this pool kept growing to finally become the majority of adult SAT macrophages
(population I and II). The resident Tim4+ ATMs appeared between P1 and P7
(population III) and they acquired MHC-II (population II) after weaning (P21). In
terms of relative proportion, Tim4+ ATMs in the SAT reached a peak around weaning
(P21) and then their proportion remained stable (pop II + III), with a mix of MHC-
IIhigh and MHC-IIlow cells (Figure 3.12C). There might be a mix origin of macrophage
in the SAT, with YS derived cells at first and then participation of BM derived cells
(F4/80low) that acquired MHCII. However without lineage tracing it would be difficult
to confirm these findings.

Chapter 3 ATM replenishment by BM derived monocytes shows tissue heterogeneity
59
Figure 3.11 Evolution of SAT weight during mouse development SAT was taken from mice and weighed to follow fat mass evolution from P1
(post-natal day 1) to adulthood (8w = 8 weeks). Data representative of 2 independent experiment (n=4).
Figure 3.12 SAT contains yolk sac derived F4/80highMHCIIlow macrophages at birth A Density plot showing SAT ATMs (CD45+F4/80+CD11b+ cells; circled) during a time course: P1 (post-natal day 1), P7 (post-natal day 7), P21 (post-natal day 21), and at 4 weeks and 8 weeks after birth B. Density plot showing the evolution of MHCII and Tim4 expression in the F4/80high macrophage population during SAT development. C. Relative proportion of each subsets represented in B. Data representative of 2 independent experiment (n=3-4). I : MHCIIhighTim4- ; II : MHCIIhighTim4+ ; III: MHCIIlowTim4+ ; IV: MHCIIlowTim4-
.
P1 P7P21 4w 8w
050
100150200250300
mg
SAT (weight)
F4/8
0
CD11b
P1 P7 P21 4 weeks 8 weeks
Tim-4
MH
C-II
IV III
I II
IV III
I II
P1 P7 P21 4 weeks 8 weeks
A
B

Chapter 3 ATM replenishment by BM derived monocytes shows tissue heterogeneity
60
3.5 Discussion
The main results of this chapter are summarised in the Table 3-1.
Table 3-1 Summary of findings from chapter 3
Subsets CCR2 dependency
Non-host chimerism after
8 weeks
Replenishment by monocyte after 8
weeks
Proportion in the tissue
Tim4+ low Low Very slow 11% of ATMs
CD11c+ Yes High Quick 6% of ATMs
F4/80high Yes Intermediate Slow 71% of ATMs
F4/80low Yes High Quick 12% of ATMs
Importance of partial body irradiation and gating strategy to study ATMs
In previous studies, partial body irradiation (legs irradiation) used to study
macrophages in the peritoneal cavity, showed the same blood non-host chimerism to
the one in the set of experiment realised for this chapter (of about 30%) (Jenkins et al.
2011). This reflects a good reproducibility of the technique. However, unintentional
irradiation of some tissue can lead to an artificial increase in non-host chimerism. This
can be explained by the niche competition between recruited and resident macrophages
(Guilliams and Scott 2017). Indeed, irradiating the tissue can deplete resident ATMs
thus, the “niche” being free, these macrophages could be replaced by recruited
monocytes in order to restore their number (Guilliams and Scott 2017). However,
resident macrophages can repopulate a tissue by proliferation, in a M-CSF dependent
manner (Hashimoto et al. 2013). Head irradiation seemed to be a good alternative to
the irradiation of the legs, so the tissues are untouched and studies of residency can be
performed.
By only defining ATMs as being F4/80+CD11b+ cells, the non-host chimerism
8 weeks post-legs irradiation was of 12% in GAT and MES (around 41% once

Chapter 3 ATM replenishment by BM derived monocytes shows tissue heterogeneity
61
normalised). It was only by dividing F4/80+CD11b+ ATMs into subsets that the
diversity in BM dependency appeared which emphasis the need of characterising
better ATMs to understand their origin. Recently, an another group used partial BM
chimera with head irradiation to study ATMs in the GAT, and found a ATM non-host
chimerism of 3.57% 15 weeks post-irradiation, then 14% 19 weeks post irradiation
(Zheng et al. 2016a). In their study, ATMs were defined as Siglec-F-F4/80+ cells.
Differences between their groups (3.57% vs 14% in only few weeks apart), but also
with results presented in this chapter could be due to two things: first, their gating
strategy based on Siglec-F-F4/80+ seemed limited. Secondly, the consistency of the
operators to performed irradiation could be questioned. As shown by the legs versus
head irradiation, how irradiations are performed can artificially increase non-host
chimerism. Normalisation by blood chimerism could potentially decrease differences
between independent experiments, assuming that tissues of interest are not irradiated.
Macrophages were recruited at homeostasis in lean AT
The current dogma is that ATMs recruitment occurs mainly during obesity
(Weisberg et al. 2003; Reilly and Saltiel 2014; Patsouris et al. 2008a). However, our
results suggested that, in lean AT, at least 18% of ATMs (CD11c+ and DN F4/80low)
were highly dependent on the BM and 71% (DN F4/80high ) were partially dependent.
If only looking at the literature, recruited ATMs are characterised as M1 macrophages,
pro-inflammatory, thus their presence in lean healthy tissue could be a paradox (C. N.
Lumeng et al. 2007). The M1/M2 classification has to be challenged as, even though
it could work in vitro after supervised stimulations with LPS or IL4, the in vivo reality
is different. These recruited M1 macrophages did express what the literature classifies
as M2 markers (Martinez and Gordon 2014). Indeed, by adding more markers to the
panel, it was to notice that macrophages with higher chimerism, also expressed Relm-
α, a M2 marker according to the literature (Zheng et al. 2016b). Actually, Relm-α was
uniformly expressed by the CD11c+ subset, while this marker showed some
heterogeneity in expression in the resident subset. In the murine serous cavity, Relm-
α defines macrophages with a high non-host chimerism, CCR2 dependent, thus
monocyte derived (Calum C Bain et al. 2016). Interestingly, the authors suggest that
the fraction of F4/80high macrophages expressing Relm-α derive from F4/80low
Chapter 3 ATM replenishment by BM derived monocytes shows tissue heterogeneity
62
macrophages. This could indicate that Relm-α could also delimit other subtypes of
ATMs within the DN F4/80high and Tim4 subsets with different BM dependency. More
markers would be needed to dissociate them or, ideally, techniques such as single cell
RNA sequencing.
Tim4+ were resident macrophages which may not require CCR2 to enter the tissue in adults GAT and MES AT
Tim4+ is a PS receptor that recognise apoptotic cells, which typically express
PS at their surface as a “eat me” signal to be recognised and engulfed by macrophages
(Miyanishi et al. 2007; Nishi et al. 2014). Tim4 is expressed on resident peritoneal
macrophages, spleen macrophages, gut macrophages and Kupffer cells (Davies et al.
2013; Shaw et al. 2018). Eight weeks post irradiation, Tim4+ ATMs showed a very
low non-host chimerism. If compared with mice injected with CCR2 KO BM, the
difference in normalised chimerism between WT and CCR2 KO donor groups was
non-significant, which could mean that CCR2 is dispensable for their entry to the
tissue. CCR2 is the receptor for monocyte chemoattractant protein 1(MCP1 / also
known as CCL2) produced by tissues. CCR2 is usually expressed by monocytes and
recruited macrophages (C. N. Lumeng et al. 2007). In Ccr2-/- mice, fewer monocytes
are present in the bloodstream, as they fail to exit the BM and be recruited to tissues
upon MCP-1 release (Tsou et al. 2007). However, Ccr2-/- mice still contain ATMs (C.
N. Lumeng et al. 2007). Either the remaining ATMs rely on other recruitment signals
to enter the tissue or, resident macrophages are evolving independently from the BM,
by proliferation. For example, in the small intestine, Tim4+ macrophages were
dominant in Ccr2-/- mice (Shaw et al. 2018). They were present at birth in high
proportion, and the authors hypothesised these to be FL derived or from an early BM
influx of monocytes. These cells were also found to be maintained independently from
the BM (Shaw et al. 2018). Similarly, Kupffer cells are also maintained independently
from the BM, however, monocytes contribute to their pool during liver development
as well as embryonically derived macrophages (Scott et al. 2016). Looking at these
data together, Tim4+ ATMs could potentially be a self-replenishing population that
might find their origins in early monocyte recruitment to the GAT.

Chapter 3 ATM replenishment by BM derived monocytes shows tissue heterogeneity
63
Tim4+ ATMs could be yolk sac derived in the SAT at birth
Macrophage origins have been thoroughly described in the literature, with the
exception of ATMs. GAT is absent in the murine embryo, however the subcutaneous
AT develops in utero (Wang et al. 2013) which allowed the study of possible
embryonic macrophages seeding this tissue and persisting with age. SAT was
populated by F4/80high macrophages at P1, which were mainly Tim4-MHCIIlow.
F4/80high (also called “bright”) macrophages are characteristic of yolk sac (YS) derived
macrophages in tissues thus indicating that macrophages present at birth in the SAT
might also be of YS origin (Schulz et al. 2012b; Hoeffel et al. 2012). F4/80low
macrophages entered the tissue around P7, certainly coming from the BM. These
macrophages could be monocyte derived and indicate that SAT has a mix population
of macrophages during the first week(s) of life.
A small proportion of Tim4 ATMs was present at birth and grew in number
during SAT development. Either these Tim4+ ATMs are recruited from the BM or
derived from the F4/80high macrophages present at birth. In the heart, MHC-IIhigh
macrophages are derived from embryonic MHC-IIlow macrophages (Epelman et al.
2014), which indicated that embryonic macrophages can acquire more markers with
time which could also be the case for the Tim4+ SAT macrophages. F4/80high YS
macrophages might acquire Tim4+ and MHCII over time and persist in the tissue by
self-renewal which would explain the low chimerism in adult. Nonetheless,
F4/80lowMHC-IIhigh ATMs could replace the YS derived cell over time, acquire Tim4
and proliferate in the tissue. For example, in the peritoneal cavity, newly recruited cells
from the BM acquire in fine the same phenotype as the previous F4/80bright embryonic
macrophages but first they undergo a F4/80lowMHCII+ stage (Calum C Bain et al.
2016). Lineage tracing such as injection of tamoxifen at E.8 in Csf1r-mer-iCre-mer
crossed with Rosa26-LSL-YFP reporter mice pregnant female would label embryos
YS derived macrophages with YFP and the follow up of these cells by flow cytometry
could give more definite informations about macrophage origin in the SAT (Schulz et
al. 2012b). Interestingly Tim4+ ATM population seem to expand at a time where lipids
started to fill adipocytes in the SAT (around P4) certainly inducing an important tissue
remodelling and cell death which require Tim4+ ATMs to clear the tissue.

Chapter 3 ATM replenishment by BM derived monocytes shows tissue heterogeneity
64
Conclusion
We identified 4 populations of ATMs in adipose tissue showing different degree of
dependency on the BM for their maintenance in adult GAT and SAT. In the next
chapter we will analyse how HFD affects the turnover of these populations

65
CHAPTER 4 ATMS INCREASE BOTH BY PROLIFERATION AND RECRUITMENT IN OBESE AT

Chapter 4 ATMs increase both by proliferation and recruitment in obese AT
66
4.1 Introduction
Obesity has become a worldwide epidemic affecting around 650 million
individuals (“WHO | Obesity and Overweight” 2018). Obesity causes a low grade
inflammation, related to the excessive AT expansion (Ye 2013). Visceral AT
accumulation is associated with an increased risk of developing insulin resistance and
type 2 diabetes. In contrast, accumulation of AT below the waist, in the subcutaneous
AT, appears to be less detrimental (Pereira and Alvarez-Leite 2014; Fu, Hofker, and
Wijmenga 2015). Interestingly females accumulate less VAT than males during HFD,
which is also associated with less macrophage infiltration and less inflammation
(Fuente-Martín et al. 2013). The link between AT inflammation during obesity and
macrophages recruitment was established in the early 2000s. Weisberg et al. revealed
that macrophage numbers were multiplied by 5 in obese mice and were linked with
pro-inflammatory cytokine release (Carey N Lumeng, Bodzin, and Saltiel 2007). By
creating chimeras with full body irradiation, they showed that most ATMs were
recruited from the BM during obesity (Weisberg et al. 2003). However a later study
showed that after 7 weeks of HFD, local macrophage proliferation occurred and
contributed to ATM number increase (Amano et al. 2014). These two conflicting
results show the necessity to further study ATMs to understand their origins in the
tissue. Moreover, these studies mainly considered macrophages as a whole instead of
defining functional subsets, with the novel exception of CD11c expressing
macrophages (Patsouris et al. 2008a; Li et al. 2010; Carey N Lumeng, Bodzin, and
Saltiel 2007). Indeed CD11c+ ATMs have been linked with insulin resistance, AT
inflammation and whole body low-grade inflammation during obesity (Patsouris et al.
2008b; Carey N Lumeng, Bodzin, and Saltiel 2007; J. M. Wentworth et al. 2010). The
discovery of a novel resident Tim4+ macrophage population that was discussed in
chapter 3, plus the fact that ATM recruitment is very heterogeneous, raises the question
of how each subset would change during HFD feeding. As females and males do not
seem to have the same AT expansion and macrophage recruitment dynamic, sex
differences in ATM phenotype will also be considered.

Chapter 4 ATMs increase both by proliferation and recruitment in obese AT
67
4.2 Aim
In the previous chapter, four ATM subsets were found in the GAT, including
a Tim4+ population with a very low BM dependency, DN F4/80high subset with an
intermediate BM dependency and two subsets (CD11c+ and DN F4/80low) with a high
BM dependency. In the SAT, due to lower cell number, it was more difficult to find a
clear distinction between DN F4/80high and DN F4/80low so these subsets were
considered as one population defined as DN.
The aims of this chapter are:
- To follow the changes in ATM recruitment after 8 weeks of HFD using
partial BM chimeras (head irradiation), in SAT and GAT.
- To compare macrophage recruitment dynamics within male and female
adipose depots during HFD feeding.
- To investigate the impact of HFD on the novel resident Tim4+ ATM
population

Chapter 4 ATMs increase both by proliferation and recruitment in obese AT
68
4.3 Experimental design
Partial BM chimeras coupled with HFD. To study the contribution of monocytes to
the development of ATM populations we used adipose tissue protected BM chimera
in collaboration with the laboratory of Dr Stephen Jenkins. Host mice (males and
females) (CD45.1+CD45.2+) were partially irradiated (head irradiation), with a shield
covering ¾ of the body and then reconstituted with congenic WT BM (CD45.2+). After
4 weeks of recovery, a control diet (CD) or a HFD (HFD; 60% fat) was provided ad
libitum for 8 weeks. GAT and SAT were collected to study the non-host chimerism by
flow cytometry.
Figure 4.1 Experimental design of partial BM chimeras coupled with diet to study macrophage turn-over during HFD. After irradiation of the head, Ly5.1 host mice (expressing CD45.1 and CD45.2), both males and females, were injected i.v. with CD45.2+ donor BM. After recovery, mice were then put on a control diet or a HFD (60% fat) for 8 weeks. Non-host chimerism was studied at the cull in the blood, GAT and SAT.

Chapter 4 ATMs increase both by proliferation and recruitment in obese AT
69
4.4 Results
4.4.1 Heterogeneity in weight gain and macrophage number between adipose depots
Males accumulated similar amount of GAT than females when compared to body weight
After generation of BM chimeras (as shown in Figure 2.2), and 8 weeks of
either a control diet or HFD, mice (males and females) were sacrificed. As anticipated,
after 8 weeks of HFD, both males and females put on weight significantly compared
to the control groups (Figure 4.2A). Both the subcutaneous and gonadal adipose depots
were heavier in mice fed on a HFD compared to the control mice in both male and
female mice (Figure 4.2). Nonetheless, female adipose depots were smaller when
compared with their male counterparts (Figure 4.2 A). However, if normalised by body
weight (BW), there was no more sex differences (Figure 4.2 B). Therefore, the GAT
expansion was proportional to the weight gain in males and females, even if males
contained more GAT than females.
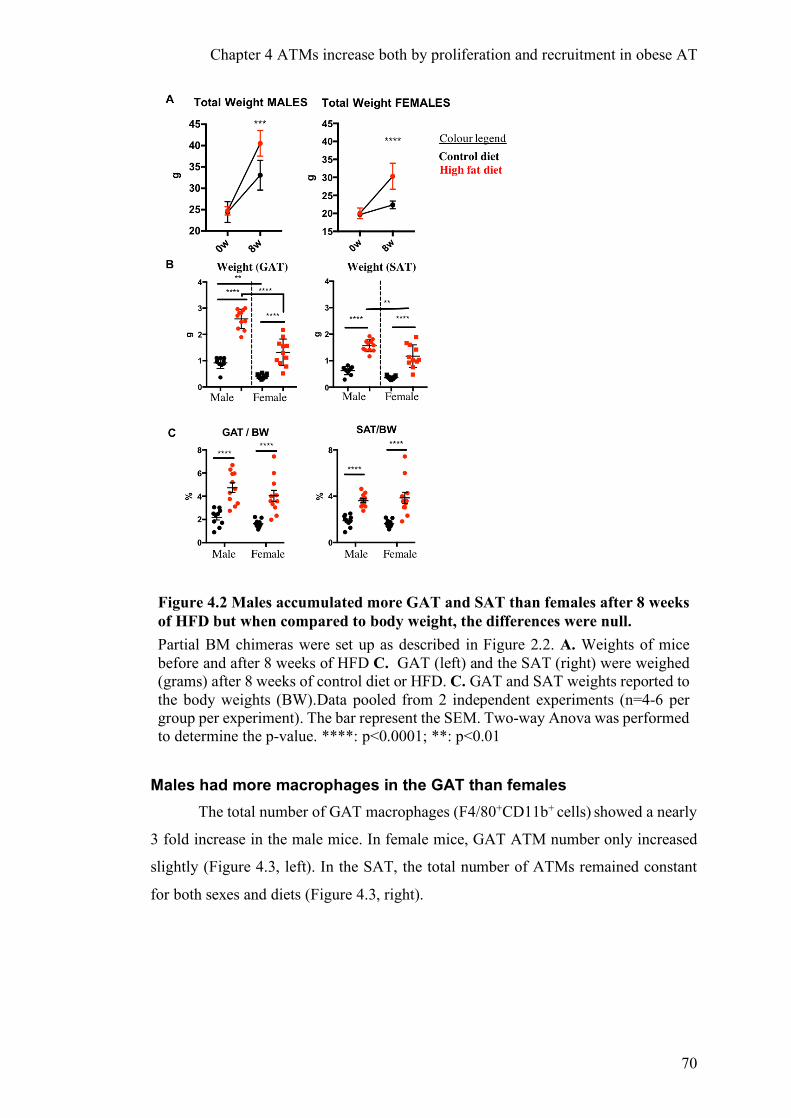
Chapter 4 ATMs increase both by proliferation and recruitment in obese AT
70
Figure 4.2 Males accumulated more GAT and SAT than females after 8 weeks of HFD but when compared to body weight, the differences were null. Partial BM chimeras were set up as described in Figure 2.2. A. Weights of mice before and after 8 weeks of HFD C. GAT (left) and the SAT (right) were weighed (grams) after 8 weeks of control diet or HFD. C. GAT and SAT weights reported to the body weights (BW).Data pooled from 2 independent experiments (n=4-6 per group per experiment). The bar represent the SEM. Two-way Anova was performed to determine the p-value. ****: p<0.0001; **: p<0.01
Males had more macrophages in the GAT than females
The total number of GAT macrophages (F4/80+CD11b+ cells) showed a nearly
3 fold increase in the male mice. In female mice, GAT ATM number only increased
slightly (Figure 4.3, left). In the SAT, the total number of ATMs remained constant
for both sexes and diets (Figure 4.3, right).

Chapter 4 ATMs increase both by proliferation and recruitment in obese AT
71
Figure 4.3 The total number of macrophages in the GAT increased in male but not in female mice nor the SAT after 8 weeks of HFD. Partial BM chimeras were set up as described in Figure 2.2. The total number of ATMs per fat pad was assessed in the GAT (left) and the SAT (right) using live cell count of the stromal vascular fraction and flow cytometry. Data pooled from 2 independent experiments (n=4-6 per group per experiment) for SAT and male GAT, 1 experiment for female GAT (n=5). Two-way Anova was performed to determine the p-value. ****: p<0.0001
4.4.2 Heterogeneity of recruitment during HFD is sex and depot specific
First, male and female ATM turnover were compared by analysis of the non-host
chimerism. In the GAT, there was no significant differences in non-host chimerism
between males and females independently of the diet for the CD11c+ and DN F4/80low
subsets (Figure 4.4). However changes occurred within the subsets with lower
chimerism. The DN F4/80high and Tim4+ macrophages had a higher chimerism in lean
male compared to lean female. With HFD, DN F4/80high non host chimerism increased
in males, but not in females, implying a higher turnover of these cells during obesity
in males but not females. Even though the chimerism of Tim4+ macrophages did not
increase with HFD in both sex, male Tim4+ macrophages had a higher non-chimerism
after HFD compared to the females fed with the same diet. This suggested than Tim4+
macrophages in females were more slowly replaced.
In the SAT (Figure 4.4B), the DN subset non-host chimerism increased in
obese males and was significantly higher than in the obese females. Although the
Tim4+ non-host chimerism was slightly increased in males after HFD (non-
Control dietHigh fat diet
Colour legend
Male Male Female
Macrophages(GAT)
Cel
l num
ber
Macrophages(SAT)
0.0
5.0×10⁵
1.0×10⁶
1.5×10⁶
Total Macropahages /fat pad
********
Female0
1×1042×1043×1044×1045×104
5.0×1051.0×1061.5×106

Chapter 4 ATMs increase both by proliferation and recruitment in obese AT
72
significant), the obese females showed a significant increase in chimerism. Implying
that the Tim4+ population in the SAT relied more on the BM for its replenishment.
Figure 4.4 DN F4/80high and Tim4+ non-host chimerism showed the highest sex specificity, in the GAT (A) and SAT (B), after 8 weeks of HFD (red) Partial BM chimeras were set up as described in Figure 2.2. The percentage of chimerism was normalised by the Ly6chigh chimerism in the blood for each mouse. Data pooled from 2 independent experiments (n=4-6 per group per experiment) for SAT and male GAT, 1 experiment for female GAT (n=5). In black : control diet; in red : HFD. Bars represent mean v. Two-way Anova was performed to determine the p-value **** : p<0.0001; **: p<0.01; *: p<0.05
4.4.3 Heterogeneity of ATM recruitment during HFD
Non-host chimerism of Tim4+ ATMs did not increase with HFD
To better compare the impact of HFD on non-host chimerism, male mice were
utilised as they gained more weight and had the most striking increase in macrophage
number. Their non-host chimerism was normalised by the Ly6chigh monocyte non-host
chimerism in the blood for each mouse and the control group was compared to the
0
50
100
150
CD11c+
ns
0
50
100
150
****
*
DN F4/80high
0
50
100
150
DN F4/80low
*
0
50
100
150
Tim4+
ns ns
Male Female Male Female Male Female Male Female
Nor
mal
ised
ch
imer
ism
CD11c+ Tim4+DN F4/80low DN F4/80high
Gonadal adipose tissueA
0
50
100
150SAT Tim4+
*
ns
0
50
100
150
0
50
100
150SAT DN
**
*
CD11c+ Tim4+DN
Nor
mal
ised
ch
imer
ism
Male Female Male Female Male Female
B Subcutaneous adipose tissueCD m
ale
HFD male
s CDHFD
0
10
20
30
40
50
Tim4+
nsns

Chapter 4 ATMs increase both by proliferation and recruitment in obese AT
73
HFD group. When considering ATMs (F4/80+CD11b+ cells) as one population, the
normalised chimerism was 39.5% (± 6.3) in mice fed a control diet, and 71.5% (± 9.5)
in mice fed a HFD (Figure 4.5).
Figure 4.5 ATM non-host chimerism was increased during HFD in the GAT of male mice. Partial BM chimeras were set up as described in Figure 2.2. Non-host chimerism was measured as showed on the FACS plot, by gating on CD45.2 cells within the F4/80+CD11b+ gate (after exclusion of eosinophils, neutrophils, monocytes). The percentage of chimerism was normalised by the Ly6chigh chimerism in the blood for each mouse and is represented in the between bracket as mean ± SEM . Representative data from 1 of 2 independent experiments (n=4-5 per group per experiment).
As seen in chapter 3, it was only when the ATM population was considered as
defined subsets delineated using surface expression of CD11c, CD11b, F4/80 and
Tim4 that the heterogeneous ATM recruitment dynamics could be unveiled. The DN
F4/80high subset had the highest non-host chimerism increase due to HFD. Although
CD11c+ and DN F4/80low ATMs also increased due to input from the donor BM., the
changes were not statistically significant. However, both subsets were already nearing
maximum turnover of 100% in the lean state. As for the Tim4+ ATMs, they conserved
their low BM chimerism, irrespective of the diet that the mice were fed (Figure 4.6A).
The number of recruited macrophages increased in the GAT during HFD
The number of cells within each subset raised during HFD : F4/80low had a 13.6
fold increase, CD11c+ a 12.9 fold increase, DN F4/80high a 6.4 fold increase and Tim4+
a 5 fold increase. For each subset, when comparing the total number of ATMs in the
tissue with the number of cells coming from the BM, Tim4+ macrophages showed the
lowest number of cells coming from the BM. While the Tim4+ macrophage numbers
in the tissue increased, the input of BM derived cells was very minimal, suggesting
Chapter 4 ATMs increase both by proliferation and recruitment in obese AT
74
that this population was increasing via proliferation expansion (Figure 4.6B), which
was confirmed by a later experiment. In contrast, the total number of CD11c+ cells in
the AT was equivalent to the number of CD11c coming from the BM indicating that
this population was entirely dependent on BM derived cells for its increase during
HFD. ATM recruitment during HFD seemed to outnumber Tim4+ ATMs, as their
relative proportion went from 24% in lean mice to only 16% of ATMs in obese mice
(Figure 4.6C). CD11c+ macrophages, who were linked with inflammation in previous
studies, had an increase of 64% (from representing 14% in control mice to 23% in
obese mice). This increase was the highest increase in proportion in the tissue.

Chapter 4 ATMs increase both by proliferation and recruitment in obese AT
75
Figure 4.6 Tim4+ ATMs did not rely on the BM to increase in number during HFD but their overall proportion decreases due to the arrival of BM derived ATMs in the GAT after 8 weeks of HFD (males). Partial BM chimeras were set up as described in Figure 2.2. Non-host chimerism was assessed in GAT from male mice (A) after a control diet (black dots) or HFD (red dots) (data pooled from 2 independent experiments, n= 4-6 per group per experiment ; student t test ** p<0.001) B. The number of macrophages for each subset in the tissue compared to the number of cells coming from the BM in mice fed a CD or a HFD C. Proportion of each subset in lean or obese mice (Data representative of 1 from 2 independent experiments).
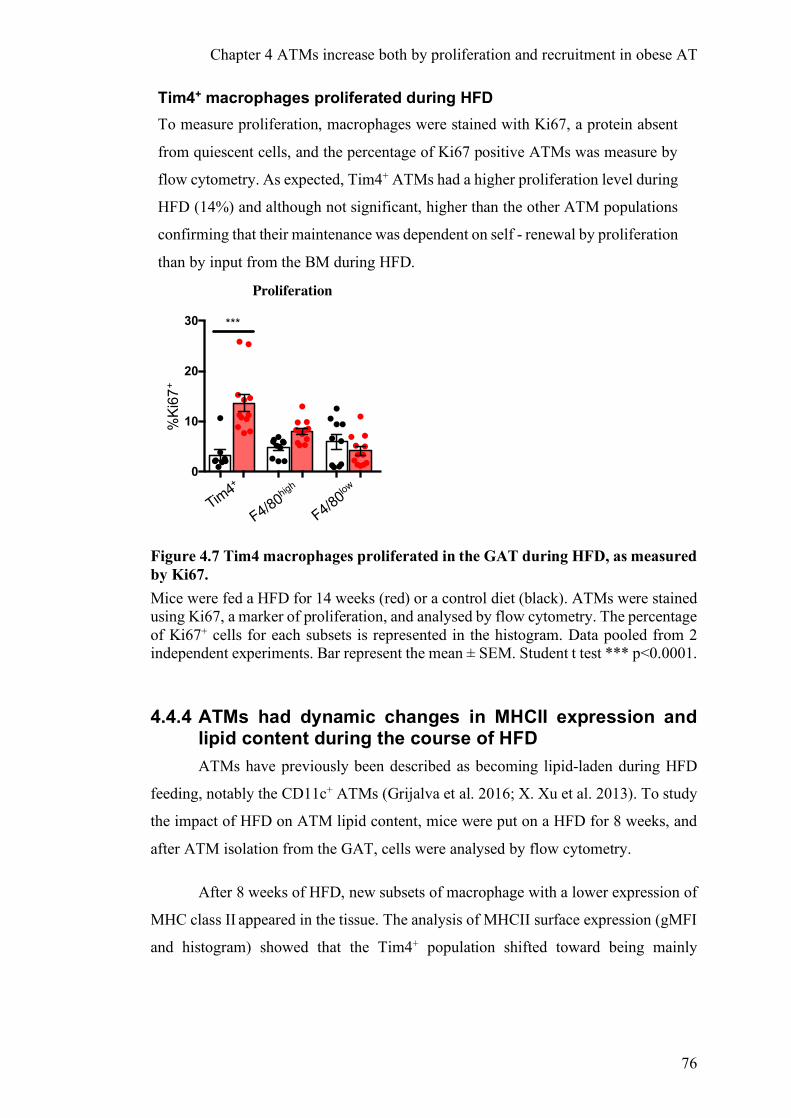
Chapter 4 ATMs increase both by proliferation and recruitment in obese AT
76
Tim4+ macrophages proliferated during HFD
To measure proliferation, macrophages were stained with Ki67, a protein absent
from quiescent cells, and the percentage of Ki67 positive ATMs was measure by
flow cytometry. As expected, Tim4+ ATMs had a higher proliferation level during
HFD (14%) and although not significant, higher than the other ATM populations
confirming that their maintenance was dependent on self - renewal by proliferation
than by input from the BM during HFD.
Figure 4.7 Tim4 macrophages proliferated in the GAT during HFD, as measured by Ki67. Mice were fed a HFD for 14 weeks (red) or a control diet (black). ATMs were stained using Ki67, a marker of proliferation, and analysed by flow cytometry. The percentage of Ki67+ cells for each subsets is represented in the histogram. Data pooled from 2 independent experiments. Bar represent the mean ± SEM. Student t test *** p<0.0001.
4.4.4 ATMs had dynamic changes in MHCII expression and lipid content during the course of HFD
ATMs have previously been described as becoming lipid-laden during HFD
feeding, notably the CD11c+ ATMs (Grijalva et al. 2016; X. Xu et al. 2013). To study
the impact of HFD on ATM lipid content, mice were put on a HFD for 8 weeks, and
after ATM isolation from the GAT, cells were analysed by flow cytometry.
After 8 weeks of HFD, new subsets of macrophage with a lower expression of
MHC class II appeared in the tissue. The analysis of MHCII surface expression (gMFI
and histogram) showed that the Tim4+ population shifted toward being mainly
F4/80high
%Ki67
+
Tim4+
Tim4+
HFD
F480h
i
F480h
i HFD
F480lo
w
F480lo
w HFD
0
10
20
30
%K
i67+
***
ProliferationProliferation
Tim4+
F4/80low

Chapter 4 ATMs increase both by proliferation and recruitment in obese AT
77
MHCIIlow in obese mice (Figure 4.8). The non-host BM chimerism of these subsets
was unchanged compared to the MHCIIhigh cells within the same subset (data not
shown).
Figure 4.8 Tim4+ ATM MHCII expression decreased after 8 weeks of HFD After 8 weeks of HFD, GAT macrophages were analysed after staining by flow cytometry. A. FACS plot of MHCII expression on Tim4 macrophages in lean and obese mice and (B) geometric mean fluorescence intensity and histograms of MHCII expression on ATM subsets during control diet (black) or HFD (red). Student’s t test : *:p<0.05; **p<0.01

Chapter 4 ATMs increase both by proliferation and recruitment in obese AT
78
Macrophage granularity was also assessed by looking at the side scatter area
(SSC-A), a higher SSC-A correlating with a higher granularity or internal complexity.
ATMs (F4/80+CD11b+) from obese GAT had a higher percentage of cells with an SSC-
Ahigh phenotype, notably within the CD11c+ and Tim4+ subset (Figure 4.9A-B). The
analysis of the geometric mean fluorescence intensity (gMFI), a measure of per-cell
fluorescence levels, of Lipidtox, a dye for neutral lipid content, showed that the higher
the SSC-A, the higher the neutral lipid content of these macrophages was (Figure
4.9C). Moreover, analysis of lipid content within each ATM subset, as opposed to the
whole population, showed that in lean and obese AT, Tim4+ macrophages, tended to
contain more lipids than the 3 other subsets, in both lean and obese mice (Figure 4.10).
Figure 4.9 SSC-Ahigh macrophages are more abundant during HFD and contain more neutral lipids After 8 weeks of HFD, ATMs from GAT were analysed by flow cytometry to measure their lipid content after LipidTox staining. SSC-Ahigh ATMs (F4/80+CD11b+) were distinguished from SSC-Alow (A) and were quantified (B) as a percentage of SSC-Ahigh cell within the subset. C. ATM lipid content analysed using LipidTox staining by flow cytometry (geometric mean fluorescence intensity: gMFI). In black: ATMs from control diet mice; in red: macrophages from HFD mice. Data representative of 2 experiments (n=4-5 mouse per group). Student t test : *:p<0.05; **p<0.01
SSC-Ahigh
SSC-Alow
SSC-Ahigh
SSC-Alow
SSChigh
SSclow
HFD high
HFD low
0
1×10⁴
2×10⁴
3×10⁴
gMFI
lipi
dtox
F4/80CD11b Macrophages
*
**
CD45
SSC-A
F4/80+CD11b+
SSC-Ahigh
A B
C+high
low t+0
10
20
30
% S
SC-A
hig
h
CD11c+
Tim4+
DN F4/80low
DN F4/80h
igh
C Lipid content% SSC-Ahigh

Chapter 4 ATMs increase both by proliferation and recruitment in obese AT
79
Figure 4.10 Tim4+ ATMs from lean and obese mice tended to have the highest lipid content. After 8 weeks of HFD or control diet, ATMs from GAT were analysed by flow cytometry to measure their lipid content after LipidTox staining. The gMFI (geometric mean of intensity) was used to compare the 4 different ATM subsets (n=3 to 4 mice per diet). Data representative of 1 from 2 independent experiments.
After 14 weeks of HFD, all ATMs significantly increased their proportion of lipid
filled SSC-Ahigh cells (Figure 4.11A). CD11c+ macrophages had the highest proportion
of SSC-Ahigh cells, followed by the Tim4+ macrophages. By sub-dividing subsets
according to their MHCII expression (high and low), it was interesting to see that
Tim4+ SSC-Ahigh macrophages were mainly MHCIIlow meanwhile the CD11c+ SSC-
Ahigh were MHCIIhigh (Figure 4.11B and C). As a whole, the Tim4+ MHCIIlow
macrophages had a higher SSC-A than their counterpart MHCIIhigh (data not shown)
cells, indicating that this subset would be a good lipid scavenger without increasing
antigen presentation.
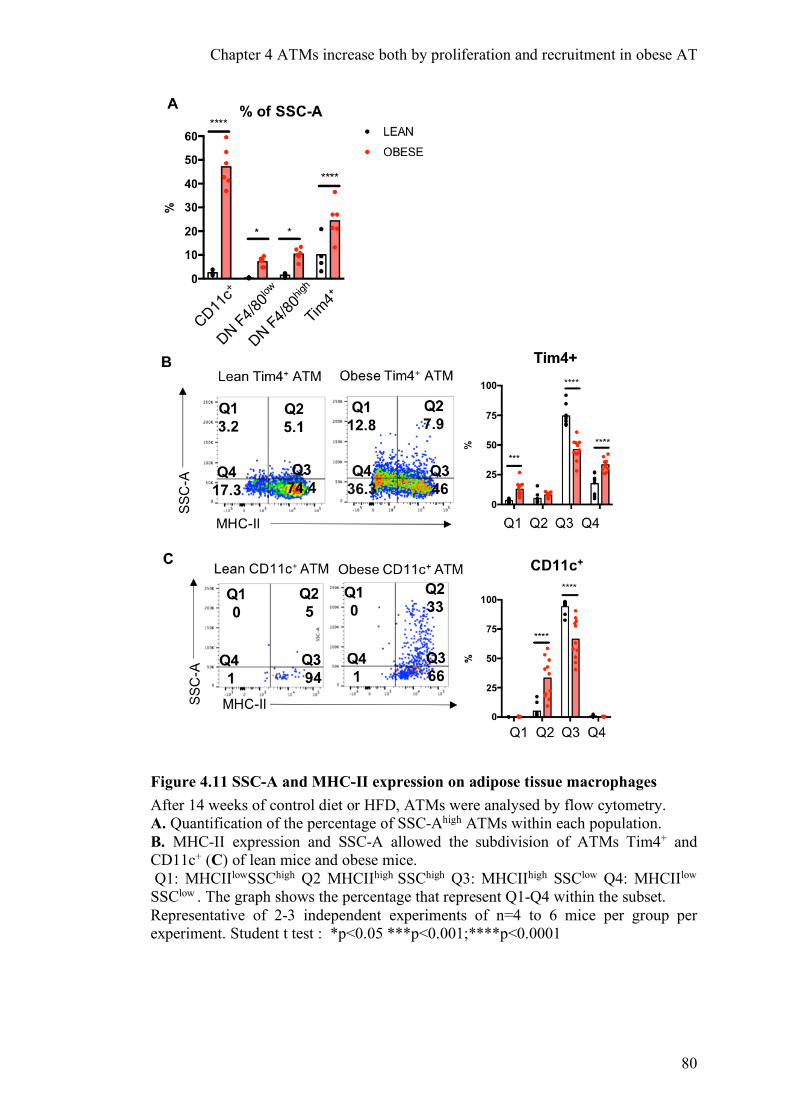
Chapter 4 ATMs increase both by proliferation and recruitment in obese AT
80
Figure 4.11 SSC-A and MHC-II expression on adipose tissue macrophages After 14 weeks of control diet or HFD, ATMs were analysed by flow cytometry. A. Quantification of the percentage of SSC-Ahigh ATMs within each population. B. MHC-II expression and SSC-A allowed the subdivision of ATMs Tim4+ and CD11c+ (C) of lean mice and obese mice. Q1: MHCIIlowSSChigh Q2 MHCIIhigh SSChigh Q3: MHCIIhigh SSClow Q4: MHCIIlow
SSClow . The graph shows the percentage that represent Q1-Q4 within the subset. Representative of 2-3 independent experiments of n=4 to 6 mice per group per experiment. Student t test : *p<0.05 ***p<0.001;****p<0.0001

Chapter 4 ATMs increase both by proliferation and recruitment in obese AT
81
4.4.5 Tim4+ ATMs were filled with lipids and lysosomes at homeostasis and during obesity
As shown previously (Figure 4.10), Tim4+ macrophages were filled with lipid
during HFD, but also on control diet. Morphologically, after fluorescence activated
cell sorting and H&E staining, they appeared to contain vesicles, reflecting their higher
internal complexity. Utilising whole mount staining of GAT, the internal vesicles of
Tim4+ ATMs were confirmed to contain lipids (lipidtox staining), these droplets could
be distinguished within ATMs, in both lean (Figure 4.12B) and obese mice (Figure
4.12C), supporting the data acquired by flow cytometry and presented in Figure 4.9
and Figure 4.10.

Chapter 4 ATMs increase both by proliferation and recruitment in obese AT
82
Figure 4.12 Tim4+ ATM morphology in lean and obese GAT A. H&E staining after FACS sort of Tim4+ macrophages from digested GAT (scale bar: 5µm) B. Whole mount staining (objective x40) of lean GAT and obese adipose tissue (C), showing neutral lipids (Lipidtox (green)), CD11b (magenta) and Tim4 (grey). Scale bar: 20 µm

Chapter 4 ATMs increase both by proliferation and recruitment in obese AT
83
The high granularity could also be explained by the presence of lysosomes
within the cells. Tim4+ ATMs contained numerous active lysosomes, as shown by
lysotracker staining (Figure 4.12B). To confirm these results, ATMs were also stained
with Lamp1, a protein found at the lysosome’s surface and commonly used for flow
cytometry. Analysis showed that similarly to lysotracker, Tim4+ ATMs contained
more Lamp1 fluorescence (Figure 4.13). Due to the absence of CD11c staining during
the experiment, ATMs were divided in F4/80high and F4/80low. Most of the CD11c+
macrophages are F4/80low as seen previously in chapter 3. F4/80low macrophages had
the lowest Lamp1 gMFI, the F4/80highTim4- ATMs had an intermediate Lamp 1
content (Figure 4.13). There was no difference in Lamp 1 gMFI between the lean and
obese GAT.
Figure 4.13 Tim4 ATMs tended to have more lysosomes, as shown by Lamp1 expression, compared to other macrophage populations in lean and obese GAT Male mice were put on HFD or control diet for 14 weeks. Cells were stained and analysed by flow cytometry. Lysosomal-associated membrane protein 1 (Lamp1) geometric mean fluorescence intensity (gMFI) was used to measure lysosomal content within F4/80high, F4/80low and Tim4+ macrophages. Data representative of 2 independent experiments

Chapter 4 ATMs increase both by proliferation and recruitment in obese AT
84
4.4.6 Tim4+ ATMs were better at LDL uptake
As Tim4 ATMs contained more lipids and more lysosomes, their capacity to
uptake lipids was tested in comparison to other ATMs. LDL, a low density lipoprotein,
was added to wells containing ATMs. LDL was coupled with a fluorescent dye,
BODIPY, so it was possible to quantify its uptake by macrophages using flow
cytometry. It is known that CD36 is a class B scavenger receptor, expressed by
macrophages and involved in lipid uptake (Kunjathoor et al. 2002; Aouadi et al. 2014).
In lean AT, CD36 had a similar expression on all the macrophage subsets (data not
shown). CD36 expression was also analysed after LDL addition. After 2 hours, Tim4+
ATMs contained more LDL than other ATMs, and this difference increased over time.
CD36 expression peaked at 4h but surprisingly was decreased at 6h post LDL feeding.
CD36 tended to be higher on Tim4+ macrophages which could be linked to the higher
LDL uptake by those macrophages.
Figure 4.14 Tim4+ ATMs uptaked more LDL and expressed more CD36 compared to Tim4- ATMs. After immune cell isolation from GAT, ATMs were fed with LDL-BODIPY for 2h, 4h and 6h. ATMs content (left) and CD36 expression (right) were then analysed by flow cytometry. A control well was left with no LDL addition. Results represent 1 experiment with triplicates.

Chapter 4 ATMs increase both by proliferation and recruitment in obese AT
85
4.5 Discussion
The main results of this chapter are summarised in the table below.
Table 4-1 Summary of findings from chapter 4 Impact of 8w HFD Lipid uptake
ATM
Subsets
On non-host
chimerism
On cell numbers
(fold increase) 8w HFD 14w HFD
Tim4+ No impact +5 +++ +++
DN F4/80high Increased
(significant) +6.4 ++ +
DN F4/80low already maximal
at CD +12.9 + +
CD11c+ already maximal
at CD +13.6 ++ ++++
In this chapter, macrophage heterogeneity in recruitment, sex specificity and
differences between depots during HFD were highlighted. Males were more
susceptible to macrophage recruitment than females (Figure 4.3). Macrophage number
increase during HFD occurred via different mechanisms, with subsets highly
dependent upon BM derived cells for their expansion and one particular subset, the
resident population Tim4+, which was increasing in number without any input from
the BM (Figure 4.6-7). These “true” resident ATMs were notably distinguishable from
the other cells by their ability to pick up lipids, their high lysosomal content, and their
MHCII downregulation during HFD (Figure 4.12-13).
Differences in weight increase between depots
In this chapter, the comparison of weight and macrophage content between
GAT and SAT after 8 weeks of HFD showed that GAT was subject to a greater mass

Chapter 4 ATMs increase both by proliferation and recruitment in obese AT
86
increase than SAT, as well as an increase in ATM number, which remained stable
between lean and obese SAT. These results were similar from those previously
described in studies including both human and mouse adipose depots (Altintas et al.
2011; Murano et al. 2008). A lower number of macrophages were found in lean and
obese SAT, compared to visceral depots (Harman-Boehm et al. 2007). MCP1 (also
known as CCL2), a potent chemokine regulating monocyte infiltration, increases in
human omental fat proportionally to weight gain, however, no association has been
found with the SAT (Harman-Boehm et al. 2007). In mouse, the same relationships
were observed (Kanda et al. 2006b; Amano et al. 2014). Thus, the current literature
would suggest that the SAT does not increase MCP1 expression during obesity,
explaining the minimal macrophage recruitment to this tissue.
Sex differences in non-host chimerism
In the GAT, female non-host chimerism within the DN F4/80 high and Tim4+
ATM was lower compared to the same subset in the male GAT, in both obese and lean
mice (Figure 4.4). Gender also influences F4/80high resident macrophage recruitment
within the peritoneal cavity and kidney (Calum C Bain et al. 2016). In male mice, after
partial BM chimera, where the peritoneal cavity was protected, the peritoneal
macrophages normalised non-host chimerism after 9-11 weeks reconstitution was of
70% whereas in females it was only around 11%. This lower macrophage turnover
does not have any clear explanation but could be linked with the reproductive organs.
Indeed, ovaries play a role in macrophage phenotype and number in the peritoneal
cavity by their hormonal production (notably the 17β-estradiol) (Scotland et al. 2011).
Surprisingly, in the SAT, female Tim4+ATM non-host chimerism was increased by
HFD and was even higher than the same population within obese males (Figure 4.4).
The number of cells for analysis in the SAT was very low compared to the GAT. Cells
could have been lost, as the SAT was more difficult to digest and seemed to contain
more “undigested” deposition, maybe reflecting matrix deposition or entities that
could not be digested by collagenase D. However, Tim4+ macrophages are important
for apoptotic cell uptake (Miyanishi et al. 2007; Nishi et al. 2014). Female SAT could
have increased BM derived macrophages that acquire Tim4 in situ to control AT
inflammation. Thus it could be interesting to measure IL6, IL10 and other cytokines

Chapter 4 ATMs increase both by proliferation and recruitment in obese AT
87
in SAT to compare female and male inflammation status. Moreover, a study showed
that after 9 weeks of HFD, GAT creates new adipocytes (hyperplasia growth) after a
hypertrophy phase, while SAT remains with the same number of adipocytes, only
growing by hypertrophy (Wang et al. 2013). It is possible that in the SAT of females,
Tim4+ ATMs are necessary to inhibit adipocyte proliferation, as seen with CD206+
ATMs in a recent study which shows that these macrophages play a role in the
modulation of adipocyte progenitors proliferation (Nawaz et al. 2017).
Tim4+ resident macrophages are outnumbered by BM derived cells during obesity.
This chapter showed that recruited and resident macrophages both coexist in
the AT tissue of lean and obese mice. If considering the ATM population as a whole,
during partial BM chimera, lean males had a normalised non-host chimerism in the
GAT of 39.5%, obese males 71.5%, lean females 22.5% and obese females 34.5%
suggesting that the contribution of the bone marrow to ATMs increased during obesity
(Figure 4.5). Tim4+ ATMs were the exception, as this subset showed no significant
increase in BM input and was proliferating (14%). Amano and colleagues showed that
4.5% of ATMs in the GAT of obese mice were proliferating vs 1% in the lean GAT
(Amano et al. 2014). This was shown using a pulse of 5-ethynyl-2′-deoxyuridine
(EdU), which is incorporated into DNA only exclusively if a cell is in S phase
(proliferating cells). Previously, a team showed that BrDu incorporation, an alternative
to Edu, corresponds to Ki67high cells (Jenkins et al. 2013b). In my experiment, I could
not distinguished high from low Ki67+ ATMs and using Edu or BrDU might be more
specific. IL6, IL4 and IL13 drives ATM proliferation in AT explants, and could be a
driver for Tim4 proliferation in vivo (Braune et al. 2017).
Another group recently used partial BM chimera to study impact of HFD on
macrophages, but did not see any non-host chimerism increase in GAT macrophages
after 8 weeks of HFD (1.87%) but rather later. By 12 weeks, an increase in chimerism
of 21.66% was found (Zheng et al. 2016b). Their gating was very different of mine as
they considered macrophages as an homogenous population (F4/80+). Their control
group also largely increased their non-host chimerism at 12 weeks (14.2% at 12 weeks
vs 2% at 8 weeks). Moreover the non-host chimerism of blood monocytes seems to

Chapter 4 ATMs increase both by proliferation and recruitment in obese AT
88
vary between groups, as such, normalisation should have been used. As no statistic
were showed and it seems that there was no replication of these experiments, it uplifts
the question of their reproducibility or the trust to have in these results (Zheng et al.
2016b). However, they did show proliferation (on a group of 3-4 mice) of ATMs
during HFD.
Lipid buffering properties of macrophages
After 8 or 14 weeks of HFD, although all macrophages were able to uptake
lipids, Tim4+ ATMs were able to internalise more lipids per cell as shown by their
higher lipid content in both lean and obese AT (Figure 4.10). Furthermore, Tim4+
macrophages had increased lysosomal activity, suggesting that these macrophages
may preferentially degrade the phagocytosed lipids. As they are long lived cells, it is
possible that Tim4+ ATMs metabolise fatty acids to assure functionality, as shown for
M2 macrophages (O’Neill, Kishton, and Rathmell 2016). Indeed, M2 macrophages
preferentially use fatty acid to fuel mitochondrial oxidative phosphorylation which
leads to ATP production in large quantity (Van Den Bossche, Neill, and Menon 2017;
O’Neill, Kishton, and Rathmell 2016; Gaber, Strehl, and Buttgereit 2017).
Lipid buffering by macrophages has also been shown in mice prone to obesity
(ob/ob mice) after 6 weeks of HFD (Aouadi et al. 2014). Aouadi and colleagues
showed that expression of lipoprotein lipase (LpL) by macrophages mediated their
ability to uptake lipids; silencing LpL reversed lipid accumulation. Other studies using
also obese ob/ob mice, showed that CD11c+ ATMs have the highest lipid content when
compared to CD11c- ATMs (Grijalva, Xu, and Ferrante 2016), and that ATMs
accumulates free cholesterol and saturated triglycerides (Prieur et al. 2011). However,
in both studies, a global gating on CD11c- might have hidden the importance of
Tim4+ATMs in lipid uptake. Our results suggested that the longer the mice were on
HFD the more CD11c+ ATMs increases their lipid content. This might be due to the
fact that Tim4+ ATMs were overloaded and not able to increase in number
proportionally with the increase of lipids to buffer in the tissue. It would be interesting
to study if Tim4 ATMs produce cytokines dictating recruitment of monocytes in the
tissue.
Chapter 4 ATMs increase both by proliferation and recruitment in obese AT
89
Tim4+ ATMs seemed able to uptake more LDL than other macrophages in vitro
and expressed more CD36 (Figure 4.14). A study from 2009 showed that F4/80high
ATMs express the peroxisome proliferator-activated receptor γ (PPAR γ) and CD36
in large quantity, combined with a higher number of SSC-Ahigh cells (Bassaganya-
Riera et al. 2009). These data and the data presented in this chapter suggest that
F4/80high, which includes the F4/80highTim4+ ATMs, have a greater capacity to uptake
and metabolise lipids. Indeed, PPAR γ is a transcription factor which induce CD36
and increases oxidized low density lipoproteins (oxLDL) uptake by macrophages
(Tontonoz et al. 1998). A specific deletion of PPARγ in macrophages, thus a decrease
in CD36 expression, increases weight gain and insulin resistance in mice (Odegaard et
al. 2007). Therefore macrophage ability to uptake lipids is important to maintain body
lipid and glucose homeostasis during HFD. Tim4 ATMs could be a central actor in
these processes.
Tim4, inflammation silencer ?
CD11c+ ATMs have been linked to AT inflammation (Patsouris et al. 2008a;
Carey N Lumeng, Bodzin, and Saltiel 2007; M. T. A. Nguyen et al. 2007). HFD
markedly increases their number in the tissue within crown like structures around
dying adipocytes, and has been linked with pro inflammatory gene expression (John
M Wentworth et al. 2010; Patsouris et al. 2008b; Carey N Lumeng, Bodzin, and Saltiel
2007). In this study, the CD11c+ ATMs which were uptaking lipids expressed high
levels of MHCII, whereas the Tim4+ ATMs which were uptaking lipids expressed low
levels of MHCII. CD11c+ ATMs might be associated with antigen presentation, after
lipid engulfment, to T cells and thus could promote their proliferation. ATMs, and
notably CD11c+, have been linked with interferon-γ-producing CD4 T cell
proliferation during HFD (Morris et al. 2013). In contrast, Tim4+, which seem to
partially downregulate MHCII might act as inflammation silencer. In the context of
cancer, tumor associated macrophages expressing Tim4 are able to phagocytes dying
cells and decrease antigen presentation following Tim4 uptake of dead tumor cells
(Baghdadi et al. 2013). Indeed they showed that Tim4 induces autophagic vesicles that
“over-digest” any left particles which has for effect to reduce antigen presentation
(Baghdadi et al. 2013). Tim4 intervention in removing apoptotic cells appears to be

Chapter 4 ATMs increase both by proliferation and recruitment in obese AT
90
finely controlled. Indeed, directed apoptotic cells clearance through Tim4 expressing
cells rather than recruited inflammatory monocytes controls inflammation (Uderhardt
et al. 2012). They showed that if Tim4 macrophages in the peritoneal cavity sequester
MFG-E8 (milk fat globule E8), which is a molecule “adapter” between PS and
macrophages that do not express Tim4. By sequestering MFG-E8, Tim4+ macrophages
rend impossible for inflammatory macrophages to uptake dying cells which in turn
reduce inflammation (Uderhardt et al. 2012). A recent study showed that a new class
of ATM BM derived CD9+ are lipid laden but have a pro-inflammatory phenotype (D.
A. Hill et al. 2018). In contrast, Tim4 might have an anti-inflammatory phenotype.
Conclusion
Tim4 is a new subset of ATMs, which increase in number by proliferation
rather than recruitment. However BM derived ATMs outnumber them during obesity.
Since this subset had a higher amount of lipids and lysotracker compared to other
macrophages, and seemed better at uptaking LDL, I then choose to study how Tim4
macrophages handle lipids during obesity.

91
CHAPTER 5 TIM4 BLOCKADE REDUCES LIPID UPTAKE AND LYSOSOMAL ACTIVITY OF TIM4+ ATMS

Chapter 5 Tim4 blockade reduces lipid uptake and lysosomal activity of Tim4+ ATMs
92
5.1 Introduction
The ATMs micro-environment is quite singular due to their lipid rich
neighbours: the adipocytes. During fasting periods, adipocyte lipolysis is activated in
order to release energy (free fatty acids) to other tissues by lysis of their triglyceride
(Stern, Rutkowski, and Scherer 2016). Local lipid influxes are then increased and lipid
laden macrophages are found in the AT (Kosteli et al. 2010a). During obesity, there is
an increase in basal rates of lipolysis, as the tissue become insulin resistant and
dysfunctional, which increases the number of lipid laden macrophages in the tissue
(Duncan et al. 2007). Notably, the pro-inflammatory CD11c+ ATMs were found to
have a higher lipid content compared to CD11c- cells (Carey N Lumeng, Bodzin, and
Saltiel 2007). Fast and obesity are opposite states but in both cases macrophages seem
to be able to respond to lipid availability in the tissue. In addition to simply containing
lipids, ATMs have the ability to activate a lysosomal program which can cause lipid
catabolism (X. Xu et al. 2013). Blocking lysosomal activity, using chloroquine, a drug
which penetrates the lysosomes and inhibits their acidification, resulted in an increase
in ATM lipid content and a decrease in net free fatty acid release by the AT in vitro
(X. Xu et al. 2013). However, chloroquine targets all macrophages, so it is unclear if
all macrophages are able to release FFA or if it is subset specific. Excessive release of
FFA by AT to the liver and elevated triglyceride and LDL cholesterol are key features
of obesity, and concomitantly increase the risk of cardiovascular disease (Klop, Elte,
and Cabezas 2013). Lowering plasma LDL, using commercially available drugs, or
reducing FFA levels in the plasma is sufficient to improve insulin resistance (Boden
2008). The fact that ATMs are involved in FFA release could potentially lead to the
development of new drugs to lower the lipid content of the plasma (X. Xu et al. 2013).
In the previous chapter, Tim4 ATMs were found to have the highest lipid content, the
highest lysosomal content and also a greater ability to pick up LDL compared to other
ATMs. This indicates that Tim4+ ATMs are well equipped to perform lysosomal
lipolysis and predicts the involvement of these cells in FFA release during HFD
challenge. Importantly, several genome wide association studies (GWAS) have shown
an association between timd4, the gene encoding TIM4, with blood lipid content
(cholesterol, LDL, TG) (Kathiresan et al. 2009b; Teslovich et al. 2010; Do et al. 2013;
Surakka et al. 2015). Nonetheless, the role of Tim4 has never been discussed in the

Chapter 5 Tim4 blockade reduces lipid uptake and lysosomal activity of Tim4+ ATMs
93
setting of HFD and obesity. Thus, I hypothesised that, out of all ATMs, Tim4+ ATMs
are the subset of macrophages controlling FFA in the plasma during HFD challenge.
5.2 Aim
In the previous chapters of this thesis, a resident population Tim4+ was
characterised which seemed to contain more lipids and lysosomes than the other
macrophages, notably in lean and at the early onset of obesity. Since ATMs were
shown to be involved in lipid metabolism, due to lipid degradation via their lysosomes,
the aim of this chapter is to test the hypothesis that Tim4+ macrophages are the subset
of ATMs that specifically control lipid metabolism and participate in FFA release into
the bloodstream. To do this, experiments were performed as follow :
In vivo blockade of Tim4 to study its impact on FFA in the blood and other
metabolic parameters such as glucose tolerance.
In vitro blockade of Tim4 to study the role of Tim4 in lipid uptake and
lysosomal activation.
5.3 Experimental design
To study the impact of the phosphatidylserine receptor Tim4, in vivo blockade
of Tim4 was carried out as shown in Figure 2.3. Eight week-old C57BL/6 males were
placed on either HFD or control diet (CD) for 8 weeks. After 4 weeks of diet, mice
from both groups were i.p. injected twice a week for the rest of the experiment with
100µl of PBS containing either 200ng of blocking anti-Tim4 IgG2a or 200ng of
isotype IgG2a control. During the last week of the diet, an oral glucose tolerance test
was performed and the mice were culled 2 days later. For short term HFD challenge,
mice were only injected once with either anti-Tim4 IgG2a or isotype IgG2a control
the day before the start of the diet (D0), then placed on either CD or HFD for an
additional 3 days (Figure 1.1B).

Chapter 5 Tim4 blockade reduces lipid uptake and lysosomal activity of Tim4+ ATMs
94
Figure 5.1 Experimental design of Tim4 blockade during long (A) and short HFD (B) Male mice were given a HFD for 8 weeks (w: weeks) or for a shorter period of time (D: day). A After 4 weeks of diet, mice from both groups were i.p. injected twice a week for the rest of the experiment with 100µl of PBS containing either 200ng of blocking anti-Tim4 IgG2a or 200ng of isotype IgG2a control (plain arrow). An oral glucose tolerance test (OGTT) was performed 2 to 3 days before the cull. B Short HFD with injection of 100µl of PBS containing either 200ng of blocking anti-Tim4 IgG2a or 200ng of isotype IgG2a control (plain arrow)
InjectionaTim4 or Isotype (200ng; i.p.)
D-1 D1 (9am) Harvest
Control diet or high fat diet
InjectionaTim4 or Isotype (200ng; i.p.)
D0 Harvest
Control diet or high fat diet
4w 8w
OGTT
A
B
5w 6w 7w
D-0 (3pm)

Chapter 5 Tim4 blockade reduces lipid uptake and lysosomal activity of Tim4+ ATMs
95
5.4 Results
5.4.1 Impact of in vivo Tim4 blockade with monoclonal antibodies on macrophages
To study the impact of Tim4+ macrophages on lipid homeostasis, mice were
injected (i.p.) twice a week, from week 4 to the cull, with a monoclonal IgG2a antibody
against Tim4 (aTim4). Control mice were injected with IgG control antibodies
(Isotype) (Figure 2.3). Flow cytometry analysis of CD45+F480+ cells in the GAT and
the peritoneal exudate cells (PEC) showed that injection of anti Tim4 antibody totally
blocked its recognition by flow cytometry in the GAT (Figure 5.2, upper graph) but
not totally in the PEC (Figure 5.2, lower graph) where some cells were still presenting
Tim 4 at their surface, even if the intensity was decreased. Few F4/80-CD11b- cells
expressing Tim4 and MHC-II, probably dendritic cells, were also blocked in this
process. But their number in AT was very low (data not shown).
Figure 5.2 Tim4 blockade twice a week for 4 weeks during a long HFD blocked Tim4 in ATMs but only partially in the PEC Mice were fed ad libitum either control diet or a HFD for 8 weeks and injected (200 ng i.p) with an isotype control or an anti-Tim4 (aTim4) blocking antibody as shown in Figure 2.3A. Flow cytometry analysis on GAT and peritoneal exudate cells showed Tim4 expression on CD45+Lin-F4/80+ cells at the time of the cull. Images representative of 1 experiment (n=5 per group).

Chapter 5 Tim4 blockade reduces lipid uptake and lysosomal activity of Tim4+ ATMs
96
5.4.2 Impact of in vivo Tim4 blockade coupled to long term HFD
Tim4 blockade had no effect on body and GAT weight
To study the impact of Tim4+ macrophages on lipid homeostasis during
obesity, mice were given HFD composed of 60% fat (Reseach Diet) and were injected
(i.p.) twice a week, from week 4 to the cull, with a monoclonal IgG2a antibody against
Tim4 (aTim4). Control mice were injected with IgG control antibodies (Isotype)
(Figure 2.3). After 8 week of HFD, mice gained a significant amount of body weight
and had a higher GAT fat mass compared to controls. The aTim4 treatment had no
impact on weight gain.
Figure 5.3 Weight gain and GAT weight of C57BL/6 male mice fed a control diet or a HFD for 8 weeks, with or without Tim4 blockade. Mice were fed ad libitum either control diet or a HFD for 8 weeks and injected (200 ng i.p) with an isotype control or an anti-Tim4 (aTim4) blocking antibody as shown in Figure 2.3A. Percentage of weight gain is shown in (A) and weight of the GAT is shown in (B) Data are representative of 2 experiments. Each data point represents a mouse and the column the mean. Two-way-Anova was performed ***: p<0.001.
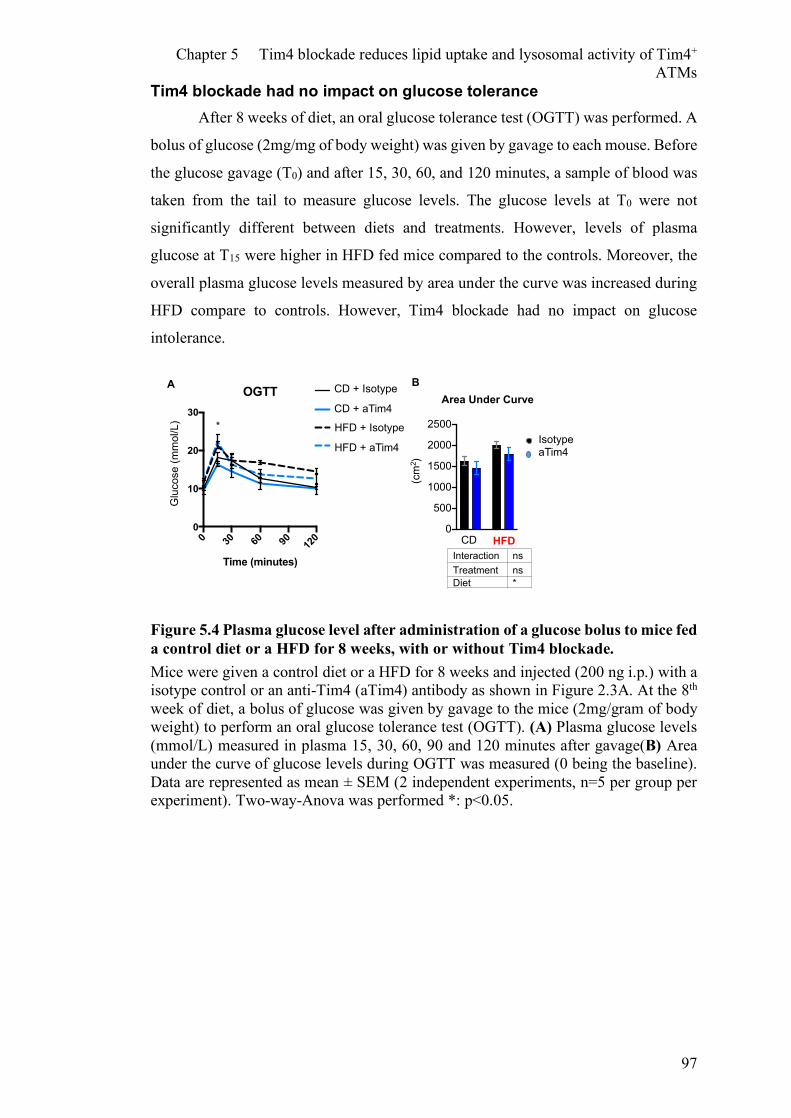
Chapter 5 Tim4 blockade reduces lipid uptake and lysosomal activity of Tim4+ ATMs
97
Tim4 blockade had no impact on glucose tolerance
After 8 weeks of diet, an oral glucose tolerance test (OGTT) was performed. A
bolus of glucose (2mg/mg of body weight) was given by gavage to each mouse. Before
the glucose gavage (T0) and after 15, 30, 60, and 120 minutes, a sample of blood was
taken from the tail to measure glucose levels. The glucose levels at T0 were not
significantly different between diets and treatments. However, levels of plasma
glucose at T15 were higher in HFD fed mice compared to the controls. Moreover, the
overall plasma glucose levels measured by area under the curve was increased during
HFD compare to controls. However, Tim4 blockade had no impact on glucose
intolerance.
Figure 5.4 Plasma glucose level after administration of a glucose bolus to mice fed a control diet or a HFD for 8 weeks, with or without Tim4 blockade. Mice were given a control diet or a HFD for 8 weeks and injected (200 ng i.p.) with a isotype control or an anti-Tim4 (aTim4) antibody as shown in Figure 2.3A. At the 8th week of diet, a bolus of glucose was given by gavage to the mice (2mg/gram of body weight) to perform an oral glucose tolerance test (OGTT). (A) Plasma glucose levels (mmol/L) measured in plasma 15, 30, 60, 90 and 120 minutes after gavage(B) Area under the curve of glucose levels during OGTT was measured (0 being the baseline). Data are represented as mean ± SEM (2 independent experiments, n=5 per group per experiment). Two-way-Anova was performed *: p<0.05.
Interaction nsTreatment nsDiet *
IsotypeaTim4
0
500
1000
1500
2000
2500
Area Under Curve
HFD
(cm
2 )
Glu
cose
(mm
ol/L
)
A B
CD0 30 60 90 120
0
10
20
30
OGTT
Time (minutes)
CD
CD + aTim4HFD
HFD + aTIM4
*
CD + Isotype
CD + aTim4
HFD + Isotype
HFD + aTim4

Chapter 5 Tim4 blockade reduces lipid uptake and lysosomal activity of Tim4+ ATMs
98
In vivo Tim4 blockade decreased free fatty acid in the plasma of obese mice after 8 weeks of HFD
FFA in the plasma was measured on blood withdrawn from mice just before
cull (non-fasted mice). Eight weeks of HFD significantly increased FFA in the plasma
compared to control mice, however mice treated with aTim4 antibodies had lower FFA
levels than control mice (Figure 5.5), thus indicating that Tim4 was involved in lipid
metabolism during HFD challenge.
Figure 5.5 FFA levels in plasma of mice fed a HFD for 8 weeks was decreased by aTim4 treatment. Mice were given a control diet or a HFD for 8 weeks and injected (200 ng i.p.) with a isotype control or an anti-Tim4 (aTim4) as shown in Figure 2.3A. FFA was measured in the plasma. Data pooled from 2 independent experiments (n=4-5 per group per experiment). Each dot represents a mouse and the mean is represented by the black bar for each group. Two-way-Anova was performed.
Interaction nsTreatment *Diet ***
0
200
400
600
800
1000
8wHFDCD
FFA
µEq/
L
IsotypeaTim4

Chapter 5 Tim4 blockade reduces lipid uptake and lysosomal activity of Tim4+ ATMs
99
HFD led to increased lysosomal activity in Tim4+ ATMs and blocking Tim4 abrogated lysosomal activity
In a previous study by Xu et. al, a macrophage lysosomal program was
observed to be activated after HFD feeding, which the authors concluded was
responsible for the release of FFA by macrophages, following lipid degradation within
the lysosomes (X. Xu et al. 2013). As blocking Tim4 reduced FFA level in the serum
(Figure 5.5), I next assessed the lysosomal activity of Tim4+ macrophages. Injection
of anti-Tim4 antibodies was not targeting adipose macrophages specifically, and other
Tim4+ macrophages could be targeted (Figure 5.2). Indeed, Tim4+ is expressed by
resident peritoneal cavity macrophages, resident Kuppfer cells in the liver. Since
Kupffer cells, are the largest resident population in the body (Miyanishi et al. 2007;
Zigmond et al. 2014; Nishi et al. 2014), it was critical to assess if the diet and/or Tim4
blockade could impact lysosomal activation in this important macrophage population.
To look at lysosomal activity and assess the impact of Tim4 blockade, macrophages
from GAT, peritoneal lavage and liver were taken after 12-14 weeks of HFD. After
purification of macrophages by adhesion method, cells were stained with lysotracker
to quantify lysosomal activity within Tim4+ cells after 6h in culture. HFD led to an
increase of lysosomal MFI in Tim4+ ATMs (Figure 5.6). This increase was unique to
ATMs as no changes were observed in Tim4+ macrophages from the liver or the PEC
due to HFD. However, Tim4 blockade decreased lysotracker MFI in both control and
high fat fed mice, and this occured independently from macrophage tissue origin
(Figure 5.6). Therefore the main effect of Tim4 was to decrease lysosomal activity in
all tim4 expressing macrophage populations assessed.

Chapter 5 Tim4 blockade reduces lipid uptake and lysosomal activity of Tim4+ ATMs
100
Figure 5.6 Tim4 blockade decreased lysotracker MFI in Tim4+ macrophages from the GAT, PEC and liver, in both lean and obese mice (8 weeks HFD). Tim4 blockade was achieved as shown in Figure 2.3A. After adhesion-purification, macrophages were stained with lysotracker (500nM). Images were acquired using a Leica SP5 confocal microscope and the mean fluorescence intensity was quantified for each Tim4+ macrophage population, either blocked with aTim4 or not. The bar represent the mean intensity. Each dot represent one Tim4+ macrophage. One Way Anova was performed. *: p<0.05; **: p<0.01; ****: p<0.0001.
Tim4 blockade decreased LDL uptake by adipose, PEC and liver Tim4+ macrophages
As Tim4 blockade reduced lysosomal activity in macrophages
extracted from both lean and obese mice, I then compared the ability of Tim4+
macrophages from AT, liver and PEC to uptake lipids, specifically low densitiy
lipoproteins (LDL). LDL are lipoproteins composed mainly of cholesterol. LDL,
coupled with Bodipy (a fluorescent dye), was added for 6h to wells containing
adhesion purified macrophages isolated from the GAT, PEC and liver of either lean or
obese mice (12-14 weeks of HFD), and blocked or not with aTim4 in vitro. Images
were taken by confocal microscopy (Figure 5.7) and LDL and lysotracker fluorescence
intensities were quantify for each cells (Figure 5.8 and Figure 5.9). By adding LDL in
the wells, macrophages increased their lysosomal activity as seen by the increase in
lysotracker intensity in the control and HFD groups. However, this was not observed
in the wells blocked with aTim4 antibodies (Figure 5.8).
0
20
40
60
80
****
******
CD HFD
SVF
0
20
40
60
CD HFD
* ****
LIVER
0
20
40
60
80
****
CD HFD
PEC
MFI
Lys
otra
cker
IsotypeaTim4
CD HFD CD HFD CD HFD
GAT

Chapter 5 Tim4 blockade reduces lipid uptake and lysosomal activity of Tim4+ ATMs
101
Figure 5.7 LDL uptake by ATMS seen by confocal microscopy (x100) LDL- Bodipy was added for 6h to wells containing plate purified macrophages isolated from the GAT then stained with Lysotracker (lysosomes) and Tim4. This is a representation of ATMS from obese mice (12-14 weeks of HFD). Scale bar 10µm.
Figure 5.8 Lysotracker was increased in Tim4+ ATMS by addition of LDL only when the receptor was not blocked Tim4 blockade was performed as shown in Figure 2.3A. After adhesion-purification, macrophages were cultured with LDL-Bodipy for 6h (50µg/ml) and stained with lysotracker (500nM). Images were acquired using a Leica SP5 confocal microscope and the MFI was quantified for individual Tim4+ macrophages, either blocked with aTim4 or not. Bars represent the mean intensity. Each dot represents one Tim4+ macrophage. Reprensentative of 1 experiment. Student t test ****: p<0.0001.

Chapter 5 Tim4 blockade reduces lipid uptake and lysosomal activity of Tim4+ ATMs
102
The ability of Tim4+ macrophages to uptake LDL was increased in ATMS of
obese mice compared to lean mice (Figure 5.9 A, left). In contrast, there was a
significant deficit in the ability of liver macrophages purified from obese animals to
acquire LDL in vitro compared to liver macrophages isolated from the livers of lean
mice. However, there was a striking increase in lysotracker activity within
macrophages isolated from both GAT and liver of obese mice compared to lean
controls (Figure 5.9 B). Tim4+ macrophages from the PEC did not increase their ability
to uptake lipid nor to activate their lysosomes following HFD feeding (Figure 5.9 A-
B). Remarkably, Tim4 blockade consistently decreased LDL uptake and lysotracker
intensity in all tissues selected, independently of the diet (Figure 5.9 A-B).
Since I found that a short in vitro blockade impacted lipid uptake and lysosomal
activity, I then assessed the impact of a short in vivo blockade associated with a short
HFD to mimic an excessive lipid rich meal.

Chapter 5 Tim4 blockade reduces lipid uptake and lysosomal activity of Tim4+ ATMs
103
Figure 5.9 Tim4 blockade reduced LDL uptake (A) and lysotracker MFI (B) in Tim4+ macrophages from the GAT, PEC and LIVER, both in lean and obese mice fed a HFD for 12-14 weeks. Tim4 blockade was performed as shown in Figure 2.3A. After adhesion-purification, macrophages were cultured with LDL-Bodipy for 6h (50µg/ml) and stained with lysotracker (500nM). Images were acquired using a Leica SP5 confocal microscope and the MFI was quantified for individual Tim4+ macrophages, either blocked with aTim4 or not. Bars represent the mean intensity. Each dot represents one Tim4+
macrophage. One Way Anova was performed for statistical analysis. *: p<0.05; **: p<0.01; ****: p<0.0001.

Chapter 5 Tim4 blockade reduces lipid uptake and lysosomal activity of Tim4+ ATMs
104
5.4.3 Impact of in vivo Tim4 blockade coupled to short term HFD
Interestingly, short term HFD, as little as 3 days, can increase the number of
macrophages in the visceral AT and increase glucose intolerance, which could be
easily reproduced by human by a large lipid rich meal or couple of days of lipid rich
food (Lee et al. 2011). As 8 weeks of HFD only influenced the levels of plasma FFA
and did not alter glucose tolerance, it was interesting to determine if this impact was
dependent of the length of diet or simply the presence of a high fat meal. Mice were
given HFD for 3 days or 1 day, with 1 injection of aTim4 at D0 or D-1 respectively.
Blocking Tim4 decreased FFA in the plasma after a short HFD
After 3 days of HFD, mice showed increased level of FFA in the plasma
compared to the control mice. Tim4 blockade led to a noticeable decrease in FFA
levels in HFD fed mice but this failed to reach significance (p=0.056) (Figure 5.10 A).
Figure 5.10 Tim4 blockade decreased FFA in the plasma of mice fed a HFD for 3 days compared to mice injected with isotype Mice were given a control diet or a HFD for 3 days with or without Tim4 blockade, as shown in Figure 2.3. The free fatty acid in the plasma was measured in non-fasted mice using WAKO kit (µEq/L). Data grouped from 3-4 independent experiments (n=5 per group per experiment). Two-way-Anova was performed for statistical analysis : ***: p<0.001
IsotypeaTim4
0
200
400
600
800
1000 0.0560
3dHFDCD
Interaction nsTreatment nsDiet ***

Chapter 5 Tim4 blockade reduces lipid uptake and lysosomal activity of Tim4+ ATMs
105
As the Tim4 treatment tended towards a decrease in FFA in the blood of HFD mice
compared to untreated controls, independently of the length of the diet (8 weeks and 3
days), I then hypothesised that the blocking impact might be due to the meal itself and
not the length of the diet.
One day of HFD was sufficient to increase FFA in the blood and was blocked by Tim4 blockade.
Mice were given a single day of HFD; mice were given access to HFD ad
libitum at 3pm and culled the next day at 9am prior to assessment of FFA in terminal
blood. One day of HFD was sufficient to increase FFA in the blood, however Tim4
treatment lowered this effect neatly (Figure 5.11).
Figure 5.11 Tim4 blockade decreased FFA in the plasma of mice fed 1 day of HFD compared to mice injected with isotype control Mice were given a control diet or a HFD for 3 days with or without Tim4 blockade, as shown in Figure 2.3. The free fatty acid in the plasma was measured in non-fasted mice using WAKO kit (µEq/L). Data grouped from 2 independent experiments for the HFD group (n=5 per group per experiment) and 1 experiment for the control group. Two-way-Anova was performed for statistical analysis : *: p<0.5; ***: p<0.001
As FFA was decreased, macrophages taken from these mice were analysed to
verify their lysosomal activity., as seen with macrophages for the long HFD (Figure
5.6)
Interaction nsTreatment *Diet ***
0
200
400
600
800
1000
1dHFDCD
IsotypeaTim4
FFA
µEq/
L

Chapter 5 Tim4 blockade reduces lipid uptake and lysosomal activity of Tim4+ ATMs
106
One day of HFD increased lipid content in Tim4+ ATMs and was sufficient to increase FFA in the blood; this increase was inhibited by Tim4 blockade.
As 1 day of HFD significantly reduced FFA in the plasma, lipid content and
lysosomal activity of macrophages from these mice were also analysed after adhesion
mediated purification. One day HFD increased neutral lipid content in GAT, PEC but
not liver Tim4+ macrophages (Figure 5.12A). This increase was blocked by Tim4
blockade. Surprisingly, I found that 1 day HFD decreased lysosomal activity in GAT
and liver (Figure 5.12B). Tim4 blockade decreased lysosomal activity in all tissues
and for each diet.
Figure 5.12 Tim4 blockade on Tim4+ macrophages from GAT, PEC, and Liver decreased lysotracker MFI in all groups independently of the diet and decreased lipid content in the GAT (control and HFD), and the PEC (HFD only). Tim4 blockade was realised as shown in Figure 2.3. After adhesion-purification, macrophages were stained with lysotracker (500nM) and lipidtox. Images were acquired using a Leica SP5 confocal microscope and the MFI was quantified for each Tim4+ macrophage, either blocked with aTim4 or not. Bars represent the mean intensity. Each dot represents one Tim4+ macrophage. One Way Anova was performed for statistical analysis. *: p<0.05; **: p<0.01; ***: p<0.001 ****: p<0.0001
B
A
0
50
100
******
***
0
50
100
**** ****
0
50
100
****
****
***
MFI
Lys
otra
cker
GAT PEC Liver
CD 1dHFD CD 1dHFD CD 1dHFD
0
50
100
150
200
250
ns***
****
PEC
0
50
100
150
200
250Liver
ns ns
ns
0
50
100
150
200
250 ***
******
GAT
MFI
Lip
idTo
x
CD 1dHFD CD 1dHFD CD 1dHFD
IsotypeaTim4

Chapter 5 Tim4 blockade reduces lipid uptake and lysosomal activity of Tim4+ ATMs
107
5.4.4 Lysotracker intensity and lipid uptake was correlated with Tim4 intensity on ATMs after being fed with chylomicrons
To test the ability of macrophages to uptake lipids other than LDL,
macrophages from the GAT and PEC were exposed to chylomicrons (CM) after, or
not, in vitro Tim4 blockade. The media used was serum free so the only fatty acids
found or lipids would be coming from the CM and intracellular lipids. CM composition
is very different from LDL, as they contain triglycerides at a high level and only a few
molecule of cholesterol. As the CM used were not coupled with a dye, LipidTox
Neutral lipid staining was added to stain lipids contained within the cells following
fixation. Therefore, this staining was not specific to CM and included endogenous
lipids already present within the cells. Adding CM increased the lipid content of Tim4+
ATMs as seen by the increase of LipidTox MFI (+42) when compared to control
macrophages that were not exposed to CM (Figure 5.13A). Nonetheless, CM had no
impact on Tim4+ PEC lipid content. Therefore, CM uptake was more specific to Tim4+
ATMs. CM uptake by ATMs was accompanied by an increase in lysosomal activity
(+15) (Figure 5.13B). Tim4 blockade decreased lipid content within ATMs and
reversed the lysosomal activity increase caused by addition of CM (Figure 5.13A-B).

Chapter 5 Tim4 blockade reduces lipid uptake and lysosomal activity of Tim4+ ATMs
108
Figure 5.13 Tim4 blockade decreased lipid uptake and lysosomal activity in the GAT but not in the PEC macrophages After purification of macrophages by adhesion method on a coverslip, macrophages from the GAT or the PEC were blocked or not with anti-Tim4 antibodies. Then they were given chylomicrons (83µg/ml) for 3h at 37°C. The cells were stained with Lipidtox (A) and lysotracker (B). The white number in columns represents the absolute difference between the control column with no CM, only if the difference reached significance (indicated above the column). One way anova was performed for statistical analysis. *: p<0.05; ***: p<0.001 ****: p<0.0001.

Chapter 5 Tim4 blockade reduces lipid uptake and lysosomal activity of Tim4+ ATMs
109
Moreover, statistical linear regression showed that the amount of lipids and
lysotracker was positively correlated to Tim4 MFI after CM challenge. A weak
positive correlation (R2 = 0.28) existed between the amount of lipids inside
macrophages and the presence of Tim4 (Figure 5.14A). This relationship was almost
cancelled by Tim4 blockade (R2 = 0.07) (Figure 5.14B). A moderate correlation
existed between lysotracker MFI and Tim4 MFI (r2>0.50) which became weaker with
Tim4 blockade ( r2=0.14) (Figure 5.14 A-B). To conclude, Tim4 seemed to be
moderately linked with lipid uptake and more strongly with lysosomal activity.
Figure 5.14 Tim4 correlates positively with lysotracker and lipidtox content after chylomicron challenge. After purification of macrophages by adhesion method on a coverslip, macrophages were blocked or not with anti-Tim4 antibodies. Then they were given chylomicrons (83µg/ml) for 3h at 37°C. The cells were stained with lysotracker (lysosomes) and lipidtox (Lipid). Lipid content and lysotracker was measured in each F4/80+ macrophage (MFI) and correlated to Tim4 intensity non-blocked (A) and blocked (B) conditions. Pearson product-moment correlation (R2) and the P value were calculated and presented in the table.
Lipid
R2 = 0.07
P<0.001
Lysotracker
R2 = 0.14
P<0.001
Lipid
R2 = 0.28
P<0.001
Lysotracker
R2 = 0.55
P<0.001
0 50 100 1500
50
100
150
200
Tim4
MFI
Tim4 correlation
LIPID
LYSO
LIPID0.2821
LYSO0.5467
0 50 100 150 200 2500
50
100
150
200
250
atim4 aTim4
Tim4
MFI
LIPID
LYSO
LIPID0.07401
LYSO0.1353
Tim4 intensity
Tim4 intensity
A
B Blocked

Chapter 5 Tim4 blockade reduces lipid uptake and lysosomal activity of Tim4+ ATMs
110
5.5 DISCUSSION
In this chapter, I analysed the impact of Tim4 blockade on lipid handling. The main
results are presented in the table below (Table 5-1).
Table 5-1 Summary of findings from chapter 5 Tim 4 blockade (compare to control)
After long HFD After short HFD
In vitro blockade
Glucose tolerance Unchanged N/A N/A
FFA (blood) Decreased Decreased N/A
Lipid content
GAT N/A Decreased Decreased
PEC N/A Decreased Decreased
LIVER N/A Decreased Decreased
Lysotracker
(lysosomal acidification)
GAT Decreased Decreased Decreased
PEC Decreased Decreased Decreased
LIVER Decreased Decreased Decreased
LDL uptake GAT Decreased+ Lyso. decreased
N/A N/A
PEC Decreased+ Lyso. decreased
N/A N/A
LIVER Decreased+ Lyso. decreased
N/A N/A
CM uptake GAT N/A N/A Decreased+ lyso. decreased
PEC N/A N/A No effect

Chapter 5 Tim4 blockade reduces lipid uptake and lysosomal activity of Tim4+ ATMs
111
Lysosomal activity during HFD
In the present study, following 14 weeks of HFD, lysosomal activity in Tim4+
ATMs was increased (Figure 5.6). A previous study demonstrated that HFD increased
lysosomal activity in ATMs and its inhibition (using chloroquine) increased lipid
content in ATMs (X. Xu et al. 2013). To add, they also showed that blocking lysosomal
activity decreased the release of FFA from fat tissue in vitro. In this chapter, long and
short term Tim4 blockade reduced the amount of lysosomal activity and was
accompanied by a decrease of FFA levels in the plasma of mice. This decrease was
not accompanied by an improvement of glucose tolerance (OGTT) (Figure 5.4).
Insulin levels were not measure in these experiments but could be a further indication
of the general metabolic states of mice, notably if the mice developed insulin resistance
(Boden 2008). Moreover, more lipids could be measured in the blood, notably levels
of LDL and cholesterol, which were correlated with timd4 SNP in genome wide
association studies in human (Kathiresan et al. 2009a).
ATMs accumulate lipids after 1 day of HFD however, I did not find any sign
of lysosomal activation (Figure 5.12), which could mean that increase of lysosomal
activity in ATMs might take several days or weeks to take place. However, caution
must be used in the interpretation of the data as I encountered some technical
challenges in the design of this experiment. The first technical challenge to overcome
would be to control the timing of the last meal eaten by the mice prior to harvest. For
all experiments, mice were culled at the same period of time (between 9 am and 10am),
and the mice were not fasted beforehand as fasting can also increase lipolysis and lipid
uptake by macrophages (Kosteli et al. 2010b). However, depending on mice, it is
possible that some differences between the last meal and the time of the cull occurred.
The use of metabolic cages would be interesting to follow the overall mice activity per
hour and track the food and water intake, the physical activity, O2 consumed and CO2
produced. Secondly, Tim4 macrophages are charged with lipids. This can potentially
make them less dense and result in floatation during the cell preparation as observed
in other studies for F4/80+ macrophages (Weisberg et al. 2003; X. Xu et al. 2013). A
preliminary experiment showed that indeed, Tim4+ macrophages and F4/80high
macrophages were found in the floating fraction of adipose digest and both represented
around 40% of CD45+. The floating fraction could not be analysed during long HFD

Chapter 5 Tim4 blockade reduces lipid uptake and lysosomal activity of Tim4+ ATMs
112
due to the amount of lipids present in the fraction that rendered impossible flow
cytometry analysis.
Tim4 and lipid uptake
Blocking Tim4 blocked LDL (Figure 5.9) and CM uptake (Figure 5.13). This
explains the decrease in lysotracker staining as macrophages were not able to pick up
more lipids. The source of lipids present in Tim4+ ATMs could be various. Firstly,
Tim4 could participate in the engulfment of apoptotic adipocytes through the
recognition of PS on dead cells (Miyanishi et al. 2007; Kobayashi et al. 2007; K.
Wong et al. 2010). Secondly, PS are found on the surface of lipid particles. Indeed
phospholipids are hydrophilic and are at the surface of the lipoprotein to encapsulate
hydrophobic lipids, allowing transport in the circulation (Feingold and Grunfeld
2000). Tim4 could participate in the recognition and uptake of excess PS+ lipid
particles coming from the bloodstream and that can’t be picked up by adipocytes after
a fat rich meal. In this chapter, it was demonstrated that compared to the PEC, Tim4+
ATMs had a higher affinity for CM (Figure 5.13) which could suggest that Tim4+
ATMs are specialised in the uptake of CM when the AT is saturated as happens after
a HFD meal. Shin et al. showed that very low density lipoprotein receptor (VLDLR)
mRNA expression is increased in ATMs with HFD, but no increase in LDLR is
observed (Shin et al. 2017). VLDLR is involved in CM metabolism and would explain
the affinity of ATMs with CM but further analysis would be required (Goudriaan et
al. 2004).
It is possible that after Tim4 recognises phospholipids , it allows its uptake to
the lysosome and its degradation. Analysis of images taken with confocal microscope,
such as in Figure 5.7, suggesting that Tim4 colocalised with lysosomes. The same
observation was done in a study where the authors showed that Tim4 colocalised with
Lamp1+ phagosomes after apoptotic tumour engulfment (Baghdadi et al. 2013). They
further showed that Tim4 phagocytic activity was linked to an AMPK pathway. More
images need to be analysed with higher resolution to confirm these results, but Tim4
seem to carry lipids to the lysosomes via translocation. The mechanisms linked with
Tim4 are still not fully understood. Tim4 could act as a tethering receptor, with no
direct signalling to the cell, and might rely on other surface receptor to assure its

Chapter 5 Tim4 blockade reduces lipid uptake and lysosomal activity of Tim4+ ATMs
113
phagocytic role (Park, Hochreiter-Hufford, and Ravichandran 2009). However
Baghdadi et al. suggested that Tim4 mediates an AMP-activated protein kinase
(AMPK) activation (Baghdadi et al. 2013). AMPK is a known activator of
transcription factor regulating lysosomal and autophagic genes (Hipolito, Ospina-
Escobar, and Botelho 2018). Therefore, Tim4 might upregulate indirectly lysosomal
synthesis.
Tim4+ macrophages from different tissues don’t show the same affinity
to lipids
Here, I demonstrated that ATMs, PEC and Liver have various affinity to lipids
(LDL or CM) and various associated lysosomal activities and particularly that . Tim4+
ATMs had a higher lysotracker intensity compared to PEC and liver, in lean mice (data
not shown). This stresses the importance on analysing “real life” tissue macrophage
populations and highlights the limitations of the use of PEC or bone marrow derived
macrophages to illustrate mechanisms relating to a specific organ as environment can
prime microphages to express certain receptors more than others. For example in the
study of Shin et. al in 2017 about VLDLR, they characterised the receptor on ATMs
but they used PEC and BMDM to study the impact of VLDL on cytokines production
and inflammation (Shin et al. 2017). Some authors highlighted the difference between
PEC and ATMs by looking at gene expression and linked obesity with a metabolic
activation in ATMs but not in PEC (Boutens et al. 2018). This could explain the
differences in lysotracker activity (Figure 5.6) and LDL uptake (Figure 5.9) during
long term HFD. At homeostasis, Tim4+ ATMs are naturally dealing with lipid spill-
over and lipid influxes from adipocytes, which is increased by HFD or fasting (Kosteli
et al. 2010a; C. N. Lumeng et al. 2007). In the same way, Kupffer cells are also in
contact with lipids as the liver synthesises VLDL, but also have receptors for molecule
rich in cholesterol such as LDL and HDL (Krenkel and Tacke 2017; Remmerie and
Scott 2018). Kupffer cells are indeed enriched in genes involved in cholesterol
metabolism (Scott and Guilliams 2018). In the liver, recruited macrophages
accumulate lipids coming from oxLDL within their lysosomes. These macrophages
generate hepatic inflammation and fibrosis which are linked with the promotion of
non-alcoholic liver diseases (Houben et al. 2017). The role of Tim4+ macrophages in

Chapter 5 Tim4 blockade reduces lipid uptake and lysosomal activity of Tim4+ ATMs
114
this context needs to be explored as they might have higher lysosomal capacity of
degradation and do not accumulate lipids. Acute HFD is sufficient for liver to
accumulate lipids, to induce hepatic insulin resistance (Samuel et al. 2004) and AT
inflammation (Lee et al. 2011) so it could be an easy and good model to study Tim4
blockade. The intestines also contains Tim4 resident macrophages (Shaw et al. 2018).
This organ is particularly involved with lipid handling and release FFA to the portal
circulation as well as liposaccharides from its microbiota. The gut microbiota is
heavily influenced by diet (Konrad and Wueest 2014) and only few days after a change
of diet, the microbiome can be changed (David et al. 2014). The impact of Tim4
blockade on this organ could be useful to understand inflammation but also how lipid
availability can be altered if Tim4 is blocked and how it could impact bacteria.
Conclusion
Tim4 capacity to engulf apoptotic cells have been largely explored. However,
Tim4 signalling is not very clear. Here, I found a novel role for this PS receptor,
notably in lipid handling. Tim4 is involved in lipid and lysosomal degradation of
lipids, and the release of FFA in the bloodstream in vivo. This leads to more questions
about the mode of action and the exact nature of the lipids that Tim4 is up taking. As
Tim4 is also present in the gut, which is a hub for dietary lipid absorption and
chylomicrons synthesis, it would be interesting to study the impact of Tim4 blockade
in this organ.

115
CHAPTER 6 TIM4+ MACROPHAGES ARE PRESENT IN HUMAN ADIPOSE DEPOTS

Chapter 6 Tim4+ macrophages are present in human AT
116
6.1 Introduction
The World Health Organisation recognised that in 2016, 650 millions of adults
were obese (“WHO | Obesity and Overweight” 2018). A body mass index (BMI)
superior to 30 kg/m2 is an indicator of obesity, however fat distribution is also an
important factor, as measured by the waist to hip ratio (WHR). The “pear shape”
characterises people with WAT accumulation around the hips, in the subcutaneous
depot, while the “apple shape” is a central accumulation, in the visceral AT. After
being adjusted to the BMI, central WAT accumulation, otherwise said VAT
accumulation in the abdomen, is more often associated with chronic diseases such as
type 2 diabetes and cardiovascular diseases (Matsuzawa et al. 1995; Fu, Hofker, and
Wijmenga 2015). A ratio above 0.85 in woman and 0.90 in man defined obesity
according to the World Health organisation (“WHO | Waist Circumference and Waist–
Hip Ratio” 2018). Accumulation of macrophages in the visceral depot, the main depot
being called omentum in human, is a feature of obesity (Weisberg et al. 2003; H. Xu
et al. 2003). The accumulation of ATMs in the omentum and subcutaneous AT is
positively associated with insulin resistance and AT inflammation (Koppaka et al.
2013; Cinti et al. 2005; John M Wentworth et al. 2010). Early study described the
presence of lipid laden CD14+CD64+ ATMs around apoptotic adipocytes, in “crown
like structures” (CLS) (Cinti et al. 2005). Later, CD14+CD11c+ proinflammatory
ATMs were also found in human AT and were particularly expressed by ATMs within
CLS (John M Wentworth et al. 2010). The quest to understand ATM biology during
obesity led to the discovery of macrophages alternatively activated in high numbers in
obese AT, such as CD163+ ATMs (scavenging receptor), but also CD206+ ATMs
(mannose receptor) (Kristiansen et al. 2001; John M Wentworth et al. 2010; Fjeldborg
et al. 2014). The presence of subsets that can have different functions in human AT
has to be investigated further. My study of mouse AT revealed the existence of a lipid
laden Tim4+ ATM population with a have a high lysosomal activity (chapter 3&4). Up
to this date, there is no study showing the presence of Tim4+ ATMs in human.
Interestingly, timd4, the gene coding for Tim4, has been highlighted to be associated
with dyslipidaemia in genome wide association studies (Kathiresan et al. 2009a;
Weissglas-Volkov et al. 2013; Teslovich et al. 2010). In mouse, ATMs seem to

Chapter 6 Tim4+ macrophages are present in human AT
117
influence the level of FFA in the blood, thus it is important to determine if Tim4+
ATMs are also present in human and could influence lipid homeostasis.
6.2 Aim
The aim of this chapter is to gather preliminary evidences that Tim4+
macrophages are also present in human adipose tissue and if they are to verify that
human Tim4+ ATMs present with the same high lipid content and lysosomal activity
characteristic of mouse Tim4+ ATMs.
6.3 Experimental design
In collaboration with Mr Damian Mole (University of Edinburgh, CIR), I
obtained omental adipose tissue samples from patients who were undergoing
laparoscopic surgery for laparoscopic cholecystectomy for biliary colic (surgery for
gallstones without active inflammation). In collaboration with Dr Roland Stimson
(University of Edinburgh, CVS), I obtained subcutaneous and omental adipose tissue
from patients undergoing hernia repair or laparoscopic gastric bypass. This was done
under Research Ethics Committee approval and after gaining informed consent in
collaboration with the Clinical Research Facility (CRF). All cell numbers coming from
this study were given after analysis by Dr Lucy Jackson-Jones (University of
Edinburgh, CVS / now in Lancaster). All subjects were considered as non-inflamed
patients.

Chapter 6 Tim4+ macrophages are present in human AT
118
6.4 Results
6.4.1 Tim4 is expressed by the majority of CD14+ cells in the omentum and SAT
To better study ATM population, flow cytometry analysis of omentum and
subcutaneous AT was done using markers defining monocytes and macrophages. I
used the markers CD14 and CD16 which define in the blood three distinct populations:
CD16+CD14- non-classical monocytes (P1), CD16+CD14+ intermediate monocytes
(P2) and CD16-CD14+ classical monocytes (P3) (K. L. Wong et al. 2011; Patel et al.
2017). All three populations could be found in human VAT and SAT (Figure 6.1A).
P2 and P3 expressed Tim4 (Figure 6.1B) and had other macrophage characteristics
such as the expression of HLA-DR, CD206, CD163, CD64 and CD62L (Figure 6.1C).
CD16+CD14- cells expressed none of these macrophage markers thus appeared to be
different from the population found in the blood (K. L. Wong et al. 2011; Patel et al.
2017). CD16+CD14+ cells had intermediate expression of these markers and CD16-
CD14+ had the highest expression of these markers. Hence, this indicated that Tim4 is
expressed on CD16-CD14+ ATMs and that potentially its expression is induced on
“intermediate monocytes” as they differentiate into ATMs in situ.

Chapter 6 Tim4+ macrophages are present in human AT
119
Figure 6.1 Tim4 is expressed on CD14+ ATMs alongside with other macrophage markers. A Density plot representative of CD45+Lin-CD11b+ cells in omentum of obese male (BMI 34) showing 3 populations of macrophages in the tissue : CD16+ CD14- (P1), CD16+CD14+ (P2) and CD16- CD14+ (P3). B Histograms showing Tim4 expression on these subsets and the fluorescence minus one (FMO) as a negative control. C Histograms showing the expression of other macrophage markers on these subsets. The histograms y axis represent the percentage of maximum intensity.
P1 P2
P3

Chapter 6 Tim4+ macrophages are present in human AT
120
ATMs could be further separated by subsets according to CD163 and CD206
expression. Four subsets of ATMs were found: CD163+CD206+, CD163+CD206- ,
CD163-CD206+ , CD163-CD206- . Overall, Tim4 was more highly expressed in the
CD163+ subsets, independently of CD206 expression and was only lowly expressed in
CD163-CD206+ (Figure 6.2). Thus CD163 could be used as a marker for Tim4 ATMs.
Figure 6.2 CD163+ ATMs had a higher Tim4 fluorescence intensity Density plot representative of CD45+Lin-CD11b+CD14+ cells in omentum of obese male showing Tim4 expression on different subsets and the fluorescence minus one (FMO) as a negative control. The histograms y axis represent the percentage of maximum intensity
6.4.2 Not all ATM populations show a positive correlation between their number and hips to waist ratio
Visceral adipose tissue expansion during obesity is associated with
macrophage recruitment in human (Weisberg et al. 2003). Notably CD11c+CD163+
ATMs and CD11c+CD206+ ATMs were found positively associated with the BMI
(Nakajima et al. 2016; J. M. Wentworth et al. 2010). ATM number can be related to
BMI, but the WHR is a better indicator of risks to develop metabolic disease (Smith
2015). Hence, the ATM subsets were reported to the WHR.
Study of ATM cell number according to subsets revealed heterogeneity in
number increase with waist to hips ratio (Figure 6.3). Tim4 was not on the panel during
this study but as mentioned in 6.4.1, CD163+ ATMs are Tim4+. As reported, we found
that the total number of CD163+ ATMs was highest in obese individuals (waist to hips

Chapter 6 Tim4+ macrophages are present in human AT
121
ratio >0.9 (Obese individuals) (cell number given by Lucy Jackson-Jones). However,
a sub-population of CD163+CD206- ATMs tended to stay stable. All CD206+ ATMs
were increased with obesity, independently of their expression of CD163 (Figure 6.3).
Figure 6.3 Not all ATM populations show a positive correlation between their number and hips to waist ratio. Human omentum were digested and cells were analysed by flow cytometry (n= 7). The number of cells was correlated to the waist to hips ratio for each subject. Correlations were assessed with the Pearson correlation coefficient with p value>0.05 considered as significant.
0.7 0.8 0.9 1.0 1.1 1.20
500
1000
1500
2000
2500
Correlation WHR Omentum cells no/g
WHR
Cel
ls/g
r2: 0.7552p = 0.005
Total CD163+
Waist:Hips0.8 0.9 1.0 1.1 1.2
-500
0
500
1000
1500
2000
2500
Correlation WHR Omentum cells no/g
WHR
CD206+CD163+ CD206-CD163+
0.7 0.8 0.9 1.0 1.1 1.20
500
1000
1500
2000
2500
WHR
Correlation WHR Omentum cells no/g
Waist:Hips Waist:Hips
r2: 0.247p = 0.21r2: 0.95
p = <0.0001
0.7 0.8 0.9 1.0 1.1 1.20
500
1000
1500
2000
2500
WHR
Correlation WHR Omentum cells no/gCD206+CD163-
r2: 0.855p = 0.001
Waist:Hips
Cel
ls/g
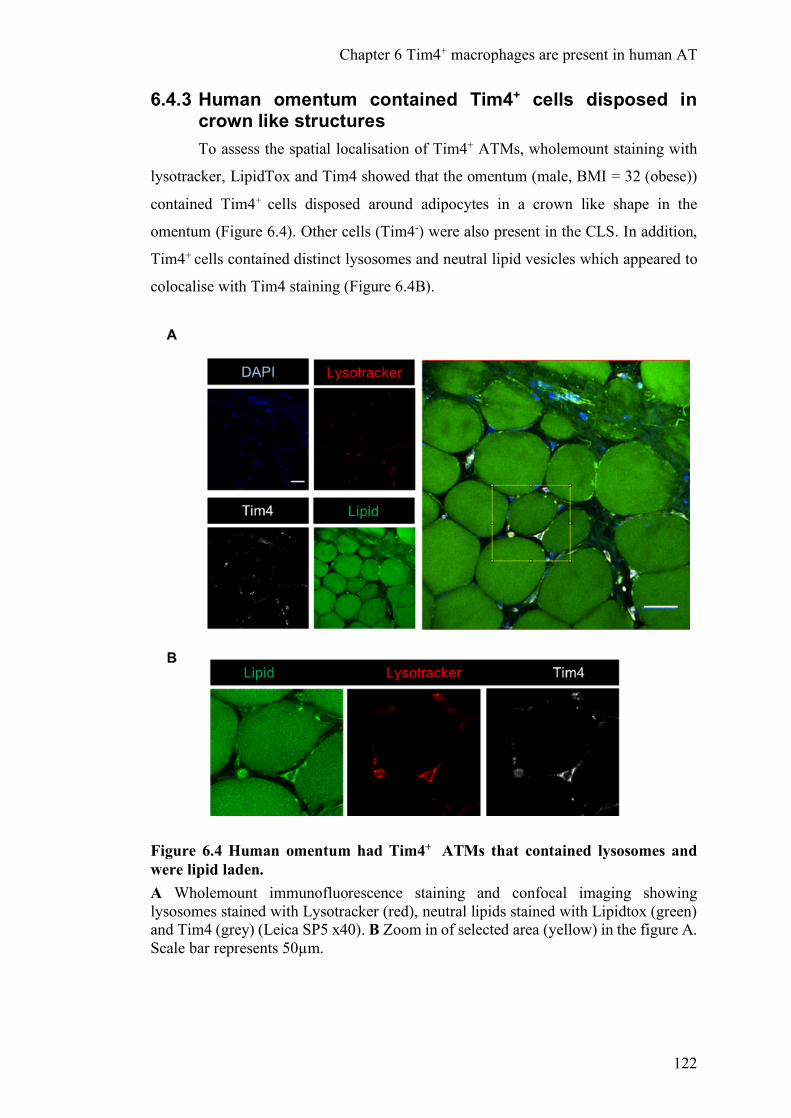
Chapter 6 Tim4+ macrophages are present in human AT
122
6.4.3 Human omentum contained Tim4+ cells disposed in crown like structures
To assess the spatial localisation of Tim4+ ATMs, wholemount staining with
lysotracker, LipidTox and Tim4 showed that the omentum (male, BMI = 32 (obese))
contained Tim4+ cells disposed around adipocytes in a crown like shape in the
omentum (Figure 6.4). Other cells (Tim4-) were also present in the CLS. In addition,
Tim4+ cells contained distinct lysosomes and neutral lipid vesicles which appeared to
colocalise with Tim4 staining (Figure 6.4B).
Figure 6.4 Human omentum had Tim4+ ATMs that contained lysosomes and were lipid laden. A Wholemount immunofluorescence staining and confocal imaging showing lysosomes stained with Lysotracker (red), neutral lipids stained with Lipidtox (green) and Tim4 (grey) (Leica SP5 x40). B Zoom in of selected area (yellow) in the figure A. Scale bar represents 50µm.

Chapter 6 Tim4+ macrophages are present in human AT
123
The SAT also contained lipid laden Tim4+ cells with very active lysosomes
(Figure 6.5 and Figure 6.6). Some Tim4+ ATMs appeared to contains lysosomes
(Figure 6.6B, number 1 and 2), but some did not (Figure 6.6B, number 3), suggesting
that lysosomes might by inducible or that subsets of macrophages exist within the
Tim4 population, some being more active than others.
Figure 6.5 Human SAT had lipid laden Tim4+ ATMs that contained lysosomes Wholemount immunofluorescence staining and confocal imaging showing lysosomes stained with Lysotracker (red), neutral lipids stained with Lipidtox (green) and Tim4 (grey) (Leica SP5 x40). Scale bar represents 25µm. Images from SAT taken from 2 obese (BMI>32) subjects.

Chapter 6 Tim4+ macrophages are present in human AT
124
Figure 6.6 Obese human SAT contained Tim4+ ATMs, which some were filled with lysosomes A Wholemount immunofluorescence staining and confocal imaging showing lysosomes stained with Lysotracker (red) and Tim4 (grey) (Spin disk x40). B Zoom in of selected macrophage in the figure A.
In all pictures analysed from omentum and SAT, the staining for Tim4 did not
seem to be restricted to the cell surface and had a punctuated appearance partially
overlaying with the lysosomal staining (Figure 6.4-6.6)
To test the ability of ATMs to uptake lipids, after purification of macrophages
by adhesion method of omental SVF, ATMs were fed with LDL-Bodipy (50µg/ml)
for 4h. Only few macrophages could be found on the plate, which could be improved
in the future. Tim4+ ATMs were charged in LDL and lysosomes (Figure 6.7, ATM
number 2-4). However some Tim4- ATMs presented lysosomes but no LDL (number
1). Hence, lysosomal activity might not be restricted to Tim4+ ATMs, but it seems

Chapter 6 Tim4+ macrophages are present in human AT
125
these macrophages had an affinity for LDL uptake. Moreover, lipids lysosomes and
Tim4 colocalised in some ATMs (number 2).
Figure 6.7 Tim4+ ATMs (omentum) were able to pick up LDL in vitro Adhesion purified ATMs from omentum sample from an obese patient were incubated with LDL-Bodipy (green) for 4 hours previous to immunofluorescence staining and confocal analysis showing nuclei stained with Dapi (blue), lysosomes stained with Lysotracker (red), Tim4 (grey), LDL-Bodipy (green) (Leica SP5).

Chapter 6 Tim4+ macrophages are present in human AT
126
6.5 Discussion
I confirmed using microscopy and flow cytometry that human omentum and SAT
contained Tim4+ ATMs (Figure 6.1). Tim4 was expressed heterogeneously across
macrophages however CD163+ ATMs expressed it the most, independently of CD206
expression (Figure 6.2). Moreover, Tim4+ ATMs were lipid laden, contained
lysosomes and take up LDL, similarly to what was described in mice in previous
chapters (4 and 5) (Figure 6.6 - Figure 6.7).
Contrary to murine Tim4+ ATMs that were resident, humans Tim4+ ATMs seem
to come from the CD16+CD14+ (P2) population, which are intermediate monocytes,
and thus might have a monocytic origin (Figure 6.1). Some macrophages in human are
known to be self-replenishing. Indeed, following macrophages at different time points
after human organ transplant showed that Langerhans cells, alveolar macrophages and
Kupffer cells from donors could be still present in the recipients years after transplant
(Schlitzer and Schultze 2017; Davies et al. 2013). Knowing macrophage origin in
human’s tissues is challenging as there is no specific methods or markers allocated to
this purpose. Even if ATMs in human contained resident self-replenishing cells, the
inflammatory status of the patients might skewed the results. The samples collected
from the analysis of Tim4 ATMs were coming from obese patients (BMI > 30). As
shown in mouse in chapter 4, obesity increases the amount of cells coming from the
BM so much that resident cells decrease in proportion in the tissue.
Multiple studies showed that ATM content correlates with the amount of fat in
human and their BMI (Curat et al. 2006; Weisberg et al. 2003; Nakajima et al. 2016).
Here, I showed that even though the cell number of most subsets increased in parallel
with the WHR, the CD163+CD206- ATM subset did not (Figure 6.3). The WHR,
compared to the BMI, acknowledges the fact that not only fat accumulation is a risk
factor to develop diseases but AT distribution is important too (Smith 2015). Indeed,
waist accumulation leads to higher risks of cardiovascular diseases and diabetes (Smith
2015).
Macrophages accumulate specifically in CLS with obesity in mouse and human
(Murano et al. 2008). Tim4+ ATMs could be found in what could qualify as CLS in

Chapter 6 Tim4+ macrophages are present in human AT
127
the omentum (Figure 6.4), however they seemed quite sparse in the SAT (Figure 6.6).
It is reported that other subsets expressing CD11c (CD11c+CD206+) are spatially
restricted to CLS, while CD11c-CD206+ are found with no defined spatial arrangement
(John M Wentworth et al. 2010). CD11c+ ATMs can also express CD163 (Nakajima
et al. 2016). While both CD206 and CD163 are considered as M2-like macrophage
markers, they have both been shown to be expressed on inflammatory CD11c+ ATMs
(Martinez and Gordon 2014) which secretes large amount of TNF, MCP1 and IL 6,
cytokines inducing AT inflammation during obesity (Zeyda et al. 2007). Therefore, at
this stage of the study, I can’t exclude that Tim4 could also be expressed by CD11c+
ATMs, as it was present on both CD206+ and CD163+ ATMs (Figure 6.2).
The intense Lipidtox staining found in Tim4+ ATMs is reminiscent of the
foamy CD14+CD64+ ATMs described in the omentum of obese human (Shapiro et al.
2013) and of the lipid laden CD11c+ ATMs described in human omentum (J. M.
Wentworth et al. 2010). This raises the question of the exact nature of the lipid staining
found in Tim4+ ATMs: Is it an accumulation of lipid droplets characteristics of foamy
ATMs or is it lipid vesicles transiting to the lysosomes for their catabolism as described
by Xu et al? The frequent association of Tim4, lipid neutral staining and lysosomal
staining in Tim4 ATMs would indicate that Tim4 is associated with the second type
of lipid laden ATMs. Interestingly, CD11c+CD206+ contains more transcript related to
lipid handling and lipid oxidation, as well as mRNA coding for lysosomes (J. M.
Wentworth et al. 2010). More work needs to be done to determine whether Tim4 is
associated with a lysosomal lipolysis signature in human.
The correct degradation of lipids by lysosomes is critical. Lysosomal acid
lipase deficiency (LAL-D, also known as Wolman disease) is a genetic disorder in
human, arising from a mutation in the LIPA gene. It results in accumulation of lipids,
notably cholesterol esters and TG, in the liver, arteries, spleen… (Reiner et al. 2014)
Indeed, cells can’t break down LDL into free cholesterol and FFA and lipids
accumulate within lysosomes. LAL-D patients present dyslipidaemia ( elevated TG
and LDL) and enlarged lipid laden hepatocytes, as hepatocytes can’t lyse LDL via
their lysosomes, but also lipid laden Kupffer cells. BM transplant had successfully
treated few patients with LAL-D but the procedure is risky (Krivit et al. 2000).

Chapter 6 Tim4+ macrophages are present in human AT
128
However, it suggest the importance of HSC derived cells, and potentially BM derived
macrophages in human lipid metabolism via LAL, which was also the case in mouse
(Ouimet et al. 2011; Chistiakov, Bobryshev, and Orekhov 2016; S. C.-C. Huang et al.
2014).
Conclusion
In this chapter, I presented preliminary data confirming the existence of Tim4+
ATMs in human omentum and SAT. More experiments need to be done to carefully
assess the expression of Tim4 on the various ATM subsets previously described in the
literature and that I identified. In vitro experimentation could be conducted from
patient AT explants combined with Tim4 blockade and the measurement of net
lipolysis to have an idea of the role of these ATMs in lipid metabolism. The limitation
of this chapter is the low number of patients recruited across WHR and sexes.

129
CHAPTER 7 DISCUSSION

Chapter 7 Discussion
130
7.1 Summary
In this thesis, I investigated the heterogeneity of ATMs in a murine model and
identified several subsets of ATMs expressing distinct surface markers. Notably, these
subsets showed a great heterogeneity in the mechanisms controlling their turnover in
the AT. After partial body irradiation and i.v. reconstitution with donor mice, I showed
that Tim4+ ATMs had a very low input from the donor BM after 8 weeks, contrary to
CD11c+ ATM. Therefore, the expression of Tim4 characterised resident ATMs in the
mesenteric, subcutaneous and gonadal AT. This newly described subset did not rely
on monocyte derived macrophages to increase its pool during HFD induced obesity,
but increase in number by proliferation. Even though their number increased during
AT expansion, monocyte derived macrophages colonised the tissue and accounted for
most of the increase in macrophage number during HFD.
Interestingly, Tim4+ ATMs were lipid laden in lean and obese GAT, raising the
question of their role in the control of lipid influx. Indeed, macrophages are known to
participate in AT lipolysis and FFA release, via an intracellular process of lysosomal
activation and catabolism of lipids taken up by ATM (X. Xu et al. 2013). Tim4+ ATMs
had a high lysosomal activity which correlated with their ability to uptake lipids. In
vivo blockade of Tim4 with monoclonal antibodies affected the levels of FFA in the
plasma of mice. Indeed, compared to control mice fed the same HFD for 1 day or 8
weeks, the mice injected with aTim4 blocking antibodies had lower plasmatic FFA
levels. Examination of the content and lysosomal activity of Tim4+ macrophages
coming from different tissues revealed that blocking Tim4 blocked lipid uptake and
reduced lysosomal activity, thus could explain a decrease in lipid catabolism and the
decrease on FFA in the plasma. Interestingly, there was some difference in lipid uptake
dependent on the tissues from which macrophages were taken, with ATMs and liver
macrophages being more efficient at taking up lipids than peritoneal macrophages. The
exact mechanism of the involvement of Tim4 and lipid uptake has still to be
determined, but it seemed that Tim4 colocalised with lysosomes and might be involved
in the internalisation of lipids and formation of phago-lysosomes, maybe in
conjunction with other receptors. Tim4+ ATMs were also present in humans (omentum
and SAT), in rather large proportions, and did also contain lipids and lysosomes. Their

Chapter 7 Discussion
131
role in lipid metabolism in human will be of interest as already several GWAS pointed
at timd4 and its association with dyslipidaemia.
The proposed mechanism of action of Tim4 macrophages is summarised in the figure
below (Figure 7.1).
Figure 7.1 Proposed mechanism of action of Tim4+ macrophages After a meal, lipids enter the bloodstream, mainly in the form of TG rich
lipoproteins which are taken up by cells to sustain their need for energy and anabolism, while excess TG are stored by adipocytes. A Tim4+ macrophages in AT and liver are able to pick up excess TG from the environment to buffer TG in the tissue and to release FFA which will become available for other organs. Tim4 is involved in the uptake of lipid particles and their progress to the lysosomes where they are hydrolysed into FFA and released from the tissue to the bloodstream. Blocking Tim4 (B) decreases lipid uptake by macrophages and their lysosomal degradation which reduces FFA release in the bloodstream.
PEC?
ADIPOSE TISSUE
FFA
lysosomesFFA
Tim4
BLOOD
LIPIDS
LIVER
BLOCKED TIM4
FFA
Tim4
B.
A.
TISSUE
MACROPHAGES
MEAL
Storage

Chapter 7 Discussion
132
7.2 Heterogenous macrophages in AT
Using partial BM chimeras , I showed the heterogeneity of recruitment of ATMs
in the tissue. While a number of studies have now shown that ATM can fulfil a number
of different and sometimes antagonist functions, there is a critical lack of
characterisation of ATM subsets. I hope that my study will contribute to the
establishment of a universal gating strategy by flow cytometry for ATMs that would
help make future work on ATMs more easily transferable from one lab to another.
Amano and colleagues showed that 8 weeks of HFD induce (in male C57Bl/6J)
macrophages proliferation (Amano et al. 2014). In their gating strategy they use
CD45+Siglec-F−CD11b+F4/80+ to define ATMs. They don’t segregate F4/80high or
F4/80low ATMs, and in my opinion, missed some ATMs in their gating (notably some
F4/80low, which, if included, could lower their number of proliferative cells). They do
acknowledge that there is a basal ATM proliferation in lean mice (Amano et al. 2014).
Adding Tim4 in their study could have revealed that these were the ones proliferating,
as well as some F4/80high ATMs. A recent study demonstrated that ATM recruitment
was CCR2 independent at the early stage of HFD (2 weeks) and that these CD11c-
ATMs were proliferating, as measured by PKH26, a dye injected i.p. that is
phagocytosed by macrophages and is diluted with time (Muir et al. 2018). In this
thesis, I propose that Tim4+ ATMs are a critical subset for the homeostasis of AT,
mopping fat spill-over coming from dead adipocytes and high fat rich meals, but that
they rapidly become saturated during long term high fat feeding. Excess fat that can’t
be processed by Tim4+ ATMs are taken up by CD11c+ ATMs that accumulate
progressively more lipids (Carey N Lumeng, Bodzin, and Saltiel 2007; Morris et al.
2013). However Tim4 uptake of lipids could dampen inflammation, as my data show
that MHCIIlowTim4+ ATMs uptake lipids. When put in culture, PEC macrophages
from Tim4 KO mice produce more TNFα than WT (K. Wong et al. 2010). The reduced
capacity of Tim4+ ATMs to buffer lipids in HFD, may be due to their slower turnover
compared to BM derived macrophages. The era of single cell sequencing is allowing
the definition of more subsets and moving towards defining subset link with specific
functions will be critical in the future.

Chapter 7 Discussion
133
7.3 Tim4 is not unique to ATMs
A number of studies showed that ATMs are involved in lipid trafficking (X. Xu
et al. 2013; Reilly and Saltiel 2014; Kosteli et al. 2010a; Prieur et al. 2011). This thesis
implies that Tim4 expressing macrophages alone might play a big role in lipid
trafficking, as in vivo blockade was sufficient to decrease FFA in the plasma of mice
after HFD. Tim4 is expressed by a macrophages in various organs but also on other
cell types. Dendritic cells (DCs) also express Tim 4 and can become lipid laden in
tumour bearing mice (DCs from spleen) and results in default of antigen presentation
(Gardner et al. 2014; Pearce and Everts 2015). However no studies have been done on
a possible role of DCs in lipid metabolism. Tim4 expressing macrophages are present
in several murine organs: for example, spleen, liver, peritoneal cavity, gut and skin (K.
Wong et al. 2010; Shaw et al. 2018; Yanagihashi et al. 2017). Other than AT, gut and
liver are the organs which have a role in lipid metabolism: the gut for digestion of
dietary lipids and formation of chylomicrons and the liver for formation of other
lipoproteins and in cholesterol metabolism (Feingold and Grunfeld 2000). Blocking of
Tim4 using anti-Tim4 antibodies did not specifically targeted ATMs so I can’t attribute
the decrease in FFA only to ATMs. Blocking Tim4 in vivo targeted the receptor on
GAT and PEC macrophages, but also on Kupffer cells (data not shown). Kupffer cells
have a transcriptional profile enriched with genes involved in lipid metabolism, and
the liver is central in the control of LDL levels in the bloodstream (Remmerie and
Scott 2018). Chronic release of FFA by AT can lead to ectopic accumulation of fat in
the liver (non-alcoholic fatty liver disease). In the setting of HFD, it would be
interesting to test whether blocking Tim4 also affect the amount of fat deposition in
the liver.
7.4 Mechanism of lipid uptake by Tim4
Tim4 blockade in vitro decreases LDL and CM uptake by ATMs. The fact that
less lipids are taken up could explain the decrease in lysotracker activity observed. But
in vivo, it is not clear what lipids Tim4 ATMs would uptake.
Apoptotic cells
In vivo Tim4 blockade has been performed in ldlr-/- mice fed a HFD for 4
weeks. Tim4 blockade increased apoptotic cell numbers in atherosclerotic areas and

Chapter 7 Discussion
134
as they accumulated, the tissue became necrotic (Foks et al. 2016). Hence Tim4+
macrophages in this setting, seem to be mainly involved in clearance of apoptotic cells
containing large amounts of lipids (foam cells) (Foks et al. 2016). No impact on
cholesterol or TG levels was observed in the plasma of these mice, however the levels
of FFA were not assessed. In addition, the experiments were performed in ldlr-/- mice
which are highly dyslipidemic which could have masked the effect of blocking Tim4
on lipidemia. It would be interesting to look at atherosclerotic lesions in C57Bl/6 mice
after Tim4 blockade. To develop atherosclerosis these mice need 14 weeks of high
cholesterol diet (Schreyer, Wilson, and LeBoeuf 1998).
In the atherosclerotic plaque Tim4+ macrophages internalised apoptotic
macrophages that had engulfed oxLDL. This could suggest that Tim4+ macrophages
acquire their lipids by ingesting lipid laden cells and not LDL directly in this case. In
AT, apoptotic adipocytes are surrounded by macrophages (CLS) (Murano et al. 2008).
It was demonstrated in vitro that macrophages can exocytose their lysosomes to
facilitate adipocyte degradation (exophagy) (Haka et al. 2016). Macrophages can then
degrade large amount of lipids, and rapidly become foamy (24 hours) (Haka et al.
2016). It is possible that all macrophages are able to uptake apoptotic cells, but it is
unclear what becomes of the lipids (degraded via lysosomes or stored as lipid droplet
/ CE). Either Tim4+ macrophages also become foamy and accumulate lipids or they
are present in these areas to clear the foamy cells.
Direct uptake of lipids
PS is a glycerophospholipid recognised by a metal ion-dependent pocket on
the N-terminal immunoglobulin-fold extracellular domain of Tim4 (Santiago et al.
2007). Very little has been done on Tim4 signalling. In contrast, other PS receptors,
its intracellular domain does not have any tyrosine kinase activity. Lipoproteins
naturally contain phospholipids, including PS. Tim4 can interreact with glycerol and
fatty acid after PS recognition on dead cells (Santiago et al. 2007). It would be
interesting to block PS on lipids and look at their uptake by Tim4 ATMs to identify
what is recognised by these macrophages.

Chapter 7 Discussion
135
Macrophages produce lipase (LpL) to facilitate the uptake of TG rich
lipoproteins (Aouadi et al. 2014; M. Takahashi et al. 2013; Babaev et al. 1999).
Silencing LpL expression in ob/ob mice ATMs, using siRNA, decreased the amount
of lipid laden macrophages and increased FFA levels in the blood as well as glucose
intolerance (Aouadi et al. 2014). In addition, LpL silencing reduced CD36 expression
on macrophages. Therefore LpL could facilitate lipid uptake by AT and ATMs
themselves, and control FFA levels in the blood. Interestingly in this experiment, the
fact that LpL was silenced in all macrophages increased FFA levels in the blood
whereas blocking Tim4 decreased the amount of FFA. It is possible that lipids that are
not taken up by Tim4 are phagocytosed by other macrophages which are unable to
process lipids, either due to a lack of lysosomal biogenesis proportional to the amount
of lipid taken, or because there metabolism is shifted from OXPHOS, and they don’t
use FA as a source of energy. Using SeaHorse technology could inform about the
mitochondrial activity (OCR) of Tim4 ATMs, in comparison to other subsets.
CD36 expression was higher on Tim4+ ATMs challenged with LDL compared
to other ATMs, suggesting that these macrophages could be more efficient at lipid
uptake. After IL-4 stimulation of BMDM, macrophages (M2) express more CD36 and
take up more LDL and VLDL than unstimulated BMDM (M0) (X. Xu et al. 2013).
However, BMDM from CD36-/- treated with IL-4 picked up less LDL and VLDL than
M2 and M0 macrophages, suggesting the role of CD36 for lipoproteins uptake (X. Xu
et al. 2013). These in vitro experiments, after differentiation of BMDM, do not
integrate the environment “imprinting” that I observed during experiments involving
macrophages from the GAT, PEC and liver. It would be interesting to do the same
kind of experiments on CD36-/- but using primary macrophage coming from the GAT,
PEC and liver, and looking at the differential lipid uptake by the different subsets.
Directed uptake of oxidised lipids
LDL oxidation (oxLDL) or acetylation increase their uptake by macrophages
(Miller et al. 2010). These modifications also allow LDL to be scavenged by other
receptor than the classical LDL-receptor, which is a receptor ubiquitously expressed
(Miller et al. 2010). For example, CD36 is involved in oxLDL uptake (Sheedy et al.
2013; Jay et al. 2015). The presence of a lipoxygenase (12/15LO) on Tim4+

Chapter 7 Discussion
136
macrophages directs apoptotic body uptake to those macrophages (Uderhardt et al.
2012). Indeed, 12/15LO oxidise esterified fatty acids (phosphatidyl ethanolamine PE)
which interferes with the ability of other macrophages to bind apoptotic cells by
binding MFG-E8. Indeed, MFG-E8 creates a bridge between apoptotic cells and other
macrophages, not expressing Tim4 thus enabling them to engulf them. In arachidonate
15 LO (ALOX15) KO mice, the absence of ALOX15 during induced peritonitis,
allows the uptake of apoptotic cells by Ly6chigh monocytes, via MFG-E8, and
enhanced inflammation (Uderhardt et al. 2012). Hypothetically, 12/15 LO could also
oxidise lipids such as LDL and enhance a targeted engulfment by Tim4 macrophages,
with the help of CD36. 12/15 LO can induce CD36 expression in macrophages after
IL-4 stimulation. (J. T. Huang et al. 1999). The need of ALOX15 in ATMs to clear
dead cells was also demonstrated recently. Co-culture of F4/80+ ATMs with apoptotic
adipocytes increased ALOX15 expression and if ALOX15 was pharmacologically
inhibited, there was a delay in lipid clearance from adipocytes, by ATMs (Kwon et al.
2016). It is not known if all macrophages express ALOX15, but since the expression
of ALOX15 is associated with the expression of Tim4 in peritoneal macrophages, it is
possible that the expression of ALOX15 is also restricted to Tim4+ ATMs in AT.
7.5 Tim4: good or evil ?
Tim4 blockade limited the amount of FFA release in the bloodstream after
HFD (in the non-fasted state). This could potentially improve the metabolic status of
patients with dyslipidaemia, as lowering FFA can improve insulin resistance (Boden
2008). SNPs in TIMD4 in GWAS have been linked with dyslipidaemia. The SNP
rs1553318, present in 65% of the studied population, was associated with an increase
in TG, LDL and cholesterol in the plasma (Surakka et al. 2015), while other SNPs
(rs6882076, rs4704727, rs1501908, rs2036402) were associated with a decrease of the
same parameters (Kathiresan et al. 2009b; Spracklen et al. 2017; Teslovich et al. 2010;
Willer et al. 2013). None of the SNP found in Timd4 are found in a coding region and
therefore are more likely to affect the gene expression level of Tim4 than its structure
(except if the SNP alters the splicing of Timd4 mRNA). Since I found that Tim4 was
expressed by the majority of ATM in the 3 obese subjects I studied, it would be critical
to study if there are any variability in the frequency of Tim4+ ATM or the level of

Chapter 7 Discussion
137
expression of Tim4 in subjects of varying BMI and metabolic dysfunction and
correlate this with the genotype of this subjects. Tim4 and TIMD4 could be involved
in a “lean phenotype” to limit AT expansion by directing lipid efflux to the
bloodstream for muscle use after a meal. However, evolution of society and western
lipid rich diet means that Tim4 activity may now be more linked to cardiovascular
diseases via excess FFA release in the circulation due to our lipid rich diet and their
deposition in liver, muscle and arteries.
To conclude, exploring and exploiting the heterogeneity of macrophages in
adipose tissue and other compartments could lead to the development of efficient
therapeutic treatments targeting lipid metabolism in macrophages to improve
dyslipidaemia.

138
Bibliography Altintas, Mehmet M., Adiba Azad, Behzad Nayer, Gabriel Contreras, Julia Zaias, Christian
Faul, Jochen Reiser, and Ali Nayer. 2011. “Mast Cells, Macrophages, and Crown-like
Structures Distinguish Subcutaneous from Visceral Fat in Mice.” Journal of Lipid
Research 52 (3): 480–88. https://doi.org/10.1194/jlr.M011338.
Amano, Shinya U., Jessica L. Cohen, Pranitha Vangala, Michaela Tencerova, Sarah M.
Nicoloro, Joseph C. Yawe, Yuefei Shen, Michael P. Czech, and Myriam Aouadi. 2014.
“Local Proliferation of Macrophages Contributes to Obesity-Associated Adipose Tissue
Inflammation.” Cell Metabolism 19 (1): 162–71.
https://doi.org/10.1016/J.CMET.2013.11.017.
Aouadi, Myriam, Pranitha Vangala, Joseph C. Yawe, Michaela Tencerova, Sarah M. Nicoloro,
Jessica L. Cohen, Yuefei Shen, and Michael P. Czech. 2014. “Lipid Storage by Adipose
Tissue Macrophages Regulates Systemic Glucose Tolerance.” American Journal of
Physiology-Endocrinology and Metabolism 307 (4): E374–83.
https://doi.org/10.1152/ajpendo.00187.2014.
Aparicio-Vergara, Marcela, Ronit Shiri-Sverdlov, Gerald de Haan, and Marten H Hofker.
2010. “Bone Marrow Transplantation in Mice as a Tool for Studying the Role of
Hematopoietic Cells in Metabolic and Cardiovascular Diseases.” Atherosclerosis 213
(2): 335–44. https://doi.org/10.1016/j.atherosclerosis.2010.05.030.
Appari, Mahesh, Keith M Channon, and Eileen McNeill. 2018. “Metabolic Regulation of
Adipose Tissue Macrophage Function in Obesity and Diabetes.” Antioxidants & Redox
Signaling 29 (3): 297–312. https://doi.org/10.1089/ars.2017.7060.
Babaev, Vladimir R., Sergio Fazio, Linda A. Gleaves, Kathy J. Carter, Clay F. Semenkovich,
and MacRae F. Linton. 1999. “Macrophage Lipoprotein Lipase Promotes Foam Cell
Formation and Atherosclerosis in Vivo.” Journal of Clinical Investigation 103 (12):
1697–1705. https://doi.org/10.1172/JCI6117.
Baghdadi, Muhammad, Akihiro Yoneda, Tsunaki Yamashina, Hiroko Nagao, Yoshihiro
Komohara, Shigenori Nagai, Hisaya Akiba, et al. 2013. “TIM-4 Glycoprotein-Mediated
Degradation of Dying Tumor Cells by Autophagy Leads to Reduced Antigen
Presentation and Increased Immune Tolerance.” Immunity 39 (6): 1070–81.
https://doi.org/10.1016/j.immuni.2013.09.014.

139
Bain, C C, C L Scott, H Uronen-Hansson, S Gudjonsson, O Jansson, O Grip, M Guilliams, B
Malissen, W W Agace, and A McI Mowat. 2013. “Resident and Pro-Inflammatory
Macrophages in the Colon Represent Alternative Context-Dependent Fates of the Same
Ly6Chi Monocyte Precursors.” Mucosal Immunology 6 (3): 498–510.
https://doi.org/10.1038/mi.2012.89.
Bain, Calum C, Alberto Bravo-Blas, Charlotte L Scott, Elisa Gomez Perdiguero, Frederic
Geissmann, Sandrine Henri, Bernard Malissen, Lisa C Osborne, David Artis, and Allan
McI Mowat. 2014. “Constant Replenishment from Circulating Monocytes Maintains the
Macrophage Pool in the Intestine of Adult Mice.” Nature Immunology 15 (10): 929–37.
https://doi.org/10.1038/ni.2967.
Bain, Calum C, Catherine A Hawley, Hannah Garner, Charlotte L Scott, Anika Schridde,
Nicholas J Steers, Matthias Mack, et al. 2016. “Long-Lived Self-Renewing Bone
Marrow-Derived Macrophages Displace Embryo-Derived Cells to Inhabit Adult Serous
Cavities.” Nature Communications 7 (June): ncomms11852.
https://doi.org/10.1038/ncomms11852.
Bassaganya-Riera, Josep, Sarah Misyak, Amir J. Guri, and Raquel Hontecillas. 2009. “PPAR
γ Is Highly Expressed in F4/80hi Adipose Tissue Macrophages and Dampens Adipose-
Tissue Inflammation.” Cellular Immunology 258 (2): 138–46.
https://doi.org/10.1016/j.cellimm.2009.04.003.
Beek, Lianne van, Jan B van Klinken, Amanda C M Pronk, Andrea D van Dam, Eline Dirven,
Patrick C N Rensen, Frits Koning, Ko Willems van Dijk, and Vanessa van Harmelen.
2015. “The Limited Storage Capacity of Gonadal Adipose Tissue Directs the
Development of Metabolic Disorders in Male C57Bl/6J Mice.” Diabetologia 58 (7):
1601–9. https://doi.org/10.1007/s00125-015-3594-8.
Benezech, C, N T Luu, J A Walker, A A Kruglov, Y Loo, K Nakamura, Y Zhang, et al. 2015.
“Inflammation-Induced Formation of Fat-Associated Lymphoid Clusters.” Nat Immunol
16 (8): 819–28. https://doi.org/10.1038/ni.3215.
Berry, Daniel C, Drew Stenesen, Daniel Zeve, and Jonathan M Graff. 2013. “The
Developmental Origins of Adipose Tissue.” Development (Cambridge, England) 140
(19): 3939–49. https://doi.org/10.1242/dev.080549.
Bigornia, S J, M G Farb, M M Mott, D T Hess, B Carmine, A Fiscale, L Joseph, C M Apovian,

140
and N Gokce. 2012. “Relation of Depot-Specific Adipose Inflammation to Insulin
Resistance in Human Obesity.” Nutrition & Diabetes 2 (3): e30–e30.
https://doi.org/10.1038/nutd.2012.3.
Boden, Guenther. 2008. “Obesity and Free Fatty Acids.” Endocrinology and Metabolism
Clinics of North America 37 (3): 635–46, viii–ix.
https://doi.org/10.1016/j.ecl.2008.06.007.
Bossche, Jan Van Den, Luke A O ’ Neill, and Deepthi Menon. 2017. “Macrophage
Immunometabolism: Where Are We (Going)?” Trends in Immunology 38: 395–406.
https://doi.org/10.1016/j.it.2017.03.001.
Boutens, Lily, Guido J. Hooiveld, Sourabh Dhingra, Robert A. Cramer, Mihai G. Netea, and
Rinke Stienstra. 2018. “Unique Metabolic Activation of Adipose Tissue Macrophages in
Obesity Promotes Inflammatory Responses.” Diabetologia, January.
https://doi.org/10.1007/s00125-017-4526-6.
Boutens, Lily, and Rinke Stienstra. 2016. “Adipose Tissue Macrophages: Going off Track
during Obesity.” Diabetologia 59 (5): 879–94. https://doi.org/10.1007/s00125-016-
3904-9.
Braune, Julia, Ulrike Weyer, Constance Hobusch, Jan Mauer, Jens C Brüning, Ingo
Bechmann, and Martin Gericke. 2017. “IL-6 Regulates M2 Polarization and Local
Proliferation of Adipose Tissue Macrophages in Obesity.” Journal of Immunology
(Baltimore, Md. : 1950) 198 (7): 2927–34. https://doi.org/10.4049/jimmunol.1600476.
Catrysse, Leen, and Geert van Loo. 2018. “Adipose Tissue Macrophages and Their
Polarization in Health and Obesity.” Cellular Immunology, March.
https://doi.org/10.1016/J.CELLIMM.2018.03.001.
Chistiakov, Dimitry A, Yuri V Bobryshev, and Alexander N Orekhov. 2016. “Macrophage-
Mediated Cholesterol Handling in Atherosclerosis.” Journal of Cellular and Molecular
Medicine 20 (1): 17–28. https://doi.org/10.1111/jcmm.12689.
Cho, Kae Won, Brian F. Zamarron, Lindsey A. Muir, Kanakadurga Singer, Cara E. Porsche,
Jennifer B. DelProposto, Lynn Geletka, Kevin A. Meyer, Robert W. O’Rourke, and
Carey N. Lumeng. 2016. “Adipose Tissue Dendritic Cells Are Independent Contributors
to Obesity-Induced Inflammation and Insulin Resistance.” The Journal of Immunology

141
197 (9): 3650–61. https://doi.org/10.4049/jimmunol.1600820.
Choe, Sung Sik, Jin Young Huh, In Jae Hwang, Jong In Kim, and Jae Bum Kim. 2016.
“Adipose Tissue Remodeling: Its Role in Energy Metabolism and Metabolic Disorders.”
Frontiers in Endocrinology 7 (April): 30. https://doi.org/10.3389/fendo.2016.00030.
Cinti, Saverio, Grant Mitchell, Giorgio Barbatelli, Incoronata Murano, Enzo Ceresi, Emanuela
Faloia, Shupei Wang, Melanie Fortier, Andrew S. Greenberg, and Martin S. Obin. 2005.
“Adipocyte Death Defines Macrophage Localization and Function in Adipose Tissue of
Obese Mice and Humans.” Journal of Lipid Research 46 (11): 2347–55.
https://doi.org/10.1194/jlr.M500294-JLR200.
Cipolletta, Daniela, Markus Feuerer, Amy Li, Nozomu Kamei, Jongsoon Lee, Steven E.
Shoelson, Christophe Benoist, and Diane Mathis. 2012. “PPAR-γ Is a Major Driver of
the Accumulation and Phenotype of Adipose Tissue Treg Cells.” Nature 486 (7404):
549–53. https://doi.org/10.1038/nature11132.
Curat, C. A., V. Wegner, C. Sengenès, A. Miranville, C. Tonus, R. Busse, and A. Bouloumié.
2006. “Macrophages in Human Visceral Adipose Tissue: Increased Accumulation in
Obesity and a Source of Resistin and Visfatin.” Diabetologia 49 (4): 744–47.
https://doi.org/10.1007/s00125-006-0173-z.
David, Lawrence A., Corinne F. Maurice, Rachel N. Carmody, David B. Gootenberg, Julie E.
Button, Benjamin E. Wolfe, Alisha V. Ling, et al. 2014. “Diet Rapidly and Reproducibly
Alters the Human Gut Microbiome.” Nature 505 (7484): 559–63.
https://doi.org/10.1038/nature12820.
Davies, John Q, and Siamon Gordon. 2005. “Isolation and Culture of Human Macrophages.”
Methods in Molecular Biology (Clifton, N.J.) 290: 105–16.
http://www.ncbi.nlm.nih.gov/pubmed/15361658.
Davies, Luke, Stephen J Jenkins, Judith E Allen, and Philip R Taylor. 2013. “Tissue-Resident
Macrophages.” Nature Immunology 14 (10): 986–95. https://doi.org/10.1038/ni.2705.
Davies, Luke, Marcela Rosas, Paul J. Smith, Donald J. Fraser, Simon A. Jones, and Philip R.
Taylor. 2011. “A Quantifiable Proliferative Burst of Tissue Macrophages Restores
Homeostatic Macrophage Populations after Acute Inflammation.” European Journal of
Immunology 41 (8): 2155–64. https://doi.org/10.1002/eji.201141817.

142
Davies, Luke, and Philip R Taylor. 2015. “Tissue-Resident Macrophages: Then and Now.”
Immunology 144 (4): 541–48. https://doi.org/10.1111/imm.12451.
Do, Ron, Cristen J Willer, Ellen M Schmidt, and Et. Al. 2013. “Common Variants Associated
with Plasma Triglycerides and Risk for Coronary Artery Disease.” Nature Genetics 45
(11): 1345–52. https://doi.org/10.1038/ng.2795.
Duncan, Robin E, Maryam Ahmadian, Kathy Jaworski, Eszter Sarkadi-Nagy, and Hei Sook
Sul. 2007. “Regulation of Lipolysis in Adipocytes.” Annual Review of Nutrition 27: 79–
101. https://doi.org/10.1146/annurev.nutr.27.061406.093734.
Duran-Struuck, Raimon, and Robert C Dysko. 2009. “Principles of Bone Marrow
Transplantation (BMT): Providing Optimal Veterinary and Husbandry Care to Irradiated
Mice in BMT Studies.” Journal of the American Association for Laboratory Animal
Science : JAALAS 48 (1): 11–22. http://www.ncbi.nlm.nih.gov/pubmed/19245745.
Emanuel, Roy, Ismail Sergin, Somashubhra Bhattacharya, Jaleisa Turner, Slava Epelman,
Carmine Settembre, Abhinav Diwan, Andrea Ballabio, and Babak Razani. 2014.
“Induction of Lysosomal Biogenesis in Atherosclerotic Macrophages Can Rescue Lipid-
Induced Lysosomal Dysfunction and Downstream Sequelae.” Arteriosclerosis,
Thrombosis, and Vascular Biology 34 (9): 1942–52.
https://doi.org/10.1161/ATVBAHA.114.303342.
Epelman, Slava, Kory J. Lavine, Anna E. Beaudin, Dorothy K. Sojka, Javier A. Carrero, Boris
Calderon, Thaddeus Brija, et al. 2014. “Embryonic and Adult-Derived Resident Cardiac
Macrophages Are Maintained through Distinct Mechanisms at Steady State and during
Inflammation.” Immunity 40 (1): 91–104. https://doi.org/10.1016/j.immuni.2013.11.019.
Epelman, Slava, Kory J Lavine, and Gwendalyn J Randolph. 2014a. “Origin and Functions of
Tissue Macrophages.” Immunity 41 (1): 21–35.
https://doi.org/10.1016/j.immuni.2014.06.013.
———. 2014b. “Origin and Functions of Tissue Macrophages.” Immunity 41 (1): 21–35.
https://doi.org/10.1016/j.immuni.2014.06.013.
Feingold, Kenneth R, and Carl Grunfeld. 2000. Introduction to Lipids and Lipoproteins.
Endotext. MDText.com, Inc. http://www.ncbi.nlm.nih.gov/pubmed/26247089.
143
Ferrante, A W. 2013. “The Immune Cells in Adipose Tissue.” Diabetes, Obesity & Metabolism
15 Suppl 3 (0 3): 34–38. https://doi.org/10.1111/dom.12154.
Feuerer, Markus, Laura Herrero, Daniela Cipolletta, Afia Naaz, Jamie Wong, Ali Nayer,
Jongsoon Lee, et al. 2009. “Lean, but Not Obese, Fat Is Enriched for a Unique Population
of Regulatory T Cells That Affect Metabolic Parameters.” Nature Medicine 15 (8): 930–
39. https://doi.org/10.1038/nm.2002.
Fitzgibbons, Timothy P, and Michael P Czech. 2016. “Emerging Evidence for Beneficial
Macrophage Functions in Atherosclerosis and Obesity-Induced Insulin Resistance.”
Journal of Molecular Medicine (Berlin, Germany) 94 (3): 267–75.
https://doi.org/10.1007/s00109-016-1385-4.
Fjeldborg, Karen, Steen B Pedersen, Holger J Møller, Tore Christiansen, Marianne Bennetzen,
and Bjørn Richelsen. 2014. “Human Adipose Tissue Macrophages Are Enhanced but
Changed to an Anti-Inflammatory Profile in Obesity.” Journal of Immunology Research
2014: 309548. https://doi.org/10.1155/2014/309548.
Foks, Amanda C., Daniel Engelbertsen, Felicia Kuperwaser, Noah Alberts-Grill, Ayelet
Gonen, Joseph L. Witztum, James Lederer, et al. 2016. “Blockade of Tim-1 and Tim-4
Enhances Atherosclerosis in Low-Density Lipoprotein Receptor-Deficient Mice.”
Arteriosclerosis, Thrombosis, and Vascular Biology 36 (3): 456–65.
https://doi.org/10.1161/ATVBAHA.115.306860.
Fox, Caroline S, Joseph M Massaro, Udo Hoffmann, Karla M Pou, Pal Maurovich-Horvat,
Chun-Yu Liu, Ramachandran S Vasan, et al. 2007. “Abdominal Visceral and
Subcutaneous Adipose Tissue Compartments: Association with Metabolic Risk Factors
in the Framingham Heart Study.” Circulation 116 (1): 39–48.
https://doi.org/10.1161/CIRCULATIONAHA.106.675355.
Freeman, Gordon J, Jose M Casasnovas, Dale T Umetsu, and Rosemarie H DeKruyff. 2010.
“TIM Genes: A Family of Cell Surface Phosphatidylserine Receptors That Regulate
Innate and Adaptive Immunity.” Immunological Reviews 235 (1): 172–89.
https://doi.org/10.1111/j.0105-2896.2010.00903.x.
Fu, Jingyuan, Marten Hofker, and Cisca Wijmenga. 2015. “Apple or Pear: Size and Shape
Matter.” Cell Metabolism 21 (4): 507–8. https://doi.org/10.1016/j.cmet.2015.03.016.

144
Fuente-Martín, Esther, Pilar Argente-Arizón, Purificación Ros, Jesús Argente, and Julie A
Chowen. 2013. “Sex Differences in Adipose Tissue: It Is Not Only a Question of
Quantity and Distribution.” Adipocyte 2 (3): 128–34. https://doi.org/10.4161/adip.24075.
Furth, R van, and Z A Cohn. 1968. “The Origin and Kinetics of Mononuclear Phagocytes.”
The Journal of Experimental Medicine 128 (3): 415–35.
http://www.ncbi.nlm.nih.gov/pubmed/5666958.
Gaber, Timo, Cindy Strehl, and Frank Buttgereit. 2017. “Metabolic Regulation of
Inflammation.” Nature Reviews Rheumatology 13 (5): 267–79.
https://doi.org/10.1038/nrrheum.2017.37.
Gardner, Joanne K, Cyril Ds Mamotte, Terrence McGonigle, Danielle E Dye, Connie
Jackaman, and Delia J Nelson. 2014. “Lipid-Laden Partially-Activated Plasmacytoid and
CD4(-)CD8α(+) Dendritic Cells Accumulate in Tissues in Elderly Mice.” Immunity &
Ageing : I & A 11: 11. https://doi.org/10.1186/1742-4933-11-11.
Geissmann, Frederic, Steffen Jung, and Dan R Littman. 2003. “Blood Monocytes Consist of
Two Principal Subsets with Distinct Migratory Properties.” Immunity 19 (1): 71–82.
http://www.ncbi.nlm.nih.gov/pubmed/12871640.
Ginhoux, Florent, Melanie Greter, Marylene Leboeuf, Sayan Nandi, Peter See, Solen Gokhan,
Mark F Mehler, et al. 2010. “Fate Mapping Analysis Reveals That Adult Microglia
Derive from Primitive Macrophages.” Science (New York, N.Y.) 330 (6005): 841–45.
https://doi.org/10.1126/science.1194637.
Ginhoux, Florent, and Martin Guilliams. 2016. “Tissue-Resident Macrophage Ontogeny and
Homeostasis.” Immunity 44 (3): 439–49. https://doi.org/10.1016/j.immuni.2016.02.024.
Gomez Perdiguero, Elisa, Kay Klapproth, Christian Schulz, Katrin Busch, Emanuele Azzoni,
Lucile Crozet, Hannah Garner, et al. 2014. “Tissue-Resident Macrophages Originate
from Yolk-Sac-Derived Erythro-Myeloid Progenitors.” Nature 518 (7540): 547–51.
https://doi.org/10.1038/nature13989.
Goudriaan, Jeltje R, Sonia M S Espirito Santo, Peter J Voshol, Bas Teusink, Ko Willems van
Dijk, Bart J M van Vlijmen, Johannes A Romijn, Louis M Havekes, and Patrick C N
Rensen. 2004. “The VLDL Receptor Plays a Major Role in Chylomicron Metabolism by
Enhancing LPL-Mediated Triglyceride Hydrolysis.” Journal of Lipid Research 45 (8):

145
1475–81. https://doi.org/10.1194/jlr.M400009-JLR200.
Grijalva, Ambar, Xiaoyuan Xu, and Anthony W Ferrante. 2016. “Autophagy Is Dispensable
for Macrophage-Mediated Lipid Homeostasis in Adipose Tissue.” Diabetes 65 (4): 967–
80. https://doi.org/10.2337/db15-1219.
Grijalva, Ambar, Xiaoyuan Xu, Anthony W Ferrante, and Jr. 2016. “Autophagy Is Dispensable
for Macrophage-Mediated Lipid Homeostasis in Adipose Tissue.” Diabetes 65 (4): 967–
80. https://doi.org/10.2337/db15-1219.
Guilliams, Martin, and Charlotte L. Scott. 2017. “Does Niche Competition Determine the
Origin of Tissue-Resident Macrophages?” Nature Reviews Immunology 17 (7): 451–60.
https://doi.org/10.1038/nri.2017.42.
Gundra, Uma Mahesh, Natasha M Girgis, Dominik Ruckerl, Stephen Jenkins, Lauren N Ward,
Zachary D Kurtz, Kirsten E Wiens, et al. 2014. “Alternatively Activated Macrophages
Derived from Monocytes and Tissue Macrophages Are Phenotypically and Functionally
Distinct.” Blood 123 (20): e110-22. https://doi.org/10.1182/blood-2013-08-520619.
Haase, Julia, Ulrike Weyer, Kerstin Immig, Nora Klöting, Matthias Blüher, Jens Eilers, Ingo
Bechmann, and Martin Gericke. 2014a. “Local Proliferation of Macrophages in Adipose
Tissue during Obesity-Induced Inflammation.” Diabetologia 57 (3): 562–71.
https://doi.org/10.1007/s00125-013-3139-y.
———. 2014b. “Local Proliferation of Macrophages in Adipose Tissue during Obesity-
Induced Inflammation.” Diabetologia 57 (3): 562–71. https://doi.org/10.1007/s00125-
013-3139-y.
Haka, Abigail S, Valéria C Barbosa-Lorenzi, Hyuek Jong Lee, Domenick J Falcone, Clifford
A Hudis, Andrew J Dannenberg, and Frederick R Maxfield. 2016. “Exocytosis of
Macrophage Lysosomes Leads to Digestion of Apoptotic Adipocytes and Foam Cell
Formation.” Journal of Lipid Research 57 (6): 980–92.
https://doi.org/10.1194/jlr.M064089.
Harman-Boehm, Ilana, Matthias Blüher, Henry Redel, Netta Sion-Vardy, Shira Ovadia,
Eliezer Avinoach, Iris Shai, et al. 2007. “Macrophage Infiltration into Omental Versus
Subcutaneous Fat across Different Populations: Effect of Regional Adiposity and the
Comorbidities of Obesity.” The Journal of Clinical Endocrinology & Metabolism 92 (6):

146
2240–47. https://doi.org/10.1210/jc.2006-1811.
Hashimoto, Daigo, Andrew Chow, Clara Noizat, Pearline Teo, Mary Beth Beasley, Marylene
Leboeuf, Christian D Becker, et al. 2013. “Tissue-Resident Macrophages Self-Maintain
Locally throughout Adult Life with Minimal Contribution from Circulating Monocytes.”
Immunity 38 (4): 792–804. https://doi.org/10.1016/j.immuni.2013.04.004.
Heck, A M, J A Yanovski, and K A Calis. 2000. “Orlistat, a New Lipase Inhibitor for the
Management of Obesity.” Pharmacotherapy 20 (3): 270–79.
http://www.ncbi.nlm.nih.gov/pubmed/10730683.
Helming, Laura. 2011. “Inflammation: Cell Recruitment versus Local Proliferation.” Current
Biology 21 (14): R548–50. https://doi.org/10.1016/J.CUB.2011.06.005.
Hill, Andrea A, W Reid Bolus, and Alyssa H Hasty. 2014. “A Decade of Progress in Adipose
Tissue Macrophage Biology.” Immunological Reviews 262 (1): 134–52.
https://doi.org/10.1111/imr.12216.
Hill, David A, Hee-Woong Lim, Yong Hoon Kim, Wesley Y Ho, Yee Hoon Foong, Victoria
L Nelson, Hoang C B Nguyen, et al. 2018. “Distinct Macrophage Populations Direct
Inflammatory versus Physiological Changes in Adipose Tissue.” Proceedings of the
National Academy of Sciences of the United States of America 115 (22): E5096–5105.
https://doi.org/10.1073/pnas.1802611115.
Hipolito, Victoria E B, Erika Ospina-Escobar, and Roberto J Botelho. 2018. “Lysosome
Remodelling and Adaptation during Phagocyte Activation.”
https://doi.org/10.1111/cmi.12824.
Hoeffel, Guillaume, and Florent Ginhoux. 2015. “Ontogeny of Tissue-Resident
Macrophages.” Frontiers in Immunology 6 (SEP).
https://doi.org/10.3389/fimmu.2015.00486.
Hoeffel, Guillaume, Yilin Wang, Melanie Greter, Peter See, Pearline Teo, Benoit Malleret,
Marylène Leboeuf, et al. 2012. “Adult Langerhans Cells Derive Predominantly from
Embryonic Fetal Liver Monocytes with a Minor Contribution of Yolk Sac–Derived
Macrophages.” The Journal of Experimental Medicine 209 (6): 1167–81.
https://doi.org/10.1084/jem.20120340.

147
Horton, Jay D, Joseph L Goldstein, and Michael S Brown. 2002. “SREBPs: Activators of the
Complete Program of Cholesterol and Fatty Acid Synthesis in the Liver.” The Journal
of Clinical Investigation 109 (9): 1125–31. https://doi.org/10.1172/JCI15593.
Houben, Tom, Yvonne Oligschlaeger, Albert V. Bitorina, Tim Hendrikx, Sofie M. A.
Walenbergh, Marie-Hélène Lenders, Marion J. J. Gijbels, et al. 2017. “Blood-Derived
Macrophages Prone to Accumulate Lysosomal Lipids Trigger OxLDL-Dependent
Murine Hepatic Inflammation.” Scientific Reports 7 (1): 12550.
https://doi.org/10.1038/s41598-017-13058-z.
Huang, Jannet T., John S. Welch, Mercedes Ricote, Christoph J. Binder, Timothy M. Willson,
Carolyn Kelly, Joseph L. Witztum, Colin D. Funk, Douglas Conrad, and Christopher K.
Glass. 1999. “Interleukin-4-Dependent Production of PPAR-γ Ligands in Macrophages
by 12/15-Lipoxygenase.” Nature 400 (6742): 378–82. https://doi.org/10.1038/22572.
Huang, Stanley Ching-Cheng, Bart Everts, Yulia Ivanova, David O’Sullivan, Marcia
Nascimento, Amber M Smith, Wandy Beatty, et al. 2014. “Cell-Intrinsic Lysosomal
Lipolysis Is Essential for Alternative Activation of Macrophages.” Nature Immunology
15 (9): 846–55. https://doi.org/10.1038/ni.2956.
Huber, Joakim, Florian W. Kiefer, Maximilian Zeyda, Bernhard Ludvik, Gerd R. Silberhumer,
Gerhard Prager, Gerhard J. Zlabinger, and Thomas M. Stulnig. 2008. “CC Chemokine
and CC Chemokine Receptor Profiles in Visceral and Subcutaneous Adipose Tissue Are
Altered in Human Obesity.” The Journal of Clinical Endocrinology & Metabolism 93
(8): 3215–21. https://doi.org/10.1210/jc.2007-2630.
Hussaarts, Leonie, Noemí García-Tardón, Lianne van Beek, Mattijs M. Heemskerk, Simone
Haeberlein, Gerard C. van der Zon, Arifa Ozir-Fazalalikhan, et al. 2015. “Chronic
Helminth Infection and Helminth-Derived Egg Antigens Promote Adipose Tissue M2
Macrophages and Improve Insulin Sensitivity in Obese Mice.” The FASEB Journal 29
(7): 3027–39. https://doi.org/10.1096/fj.14-266239.
Jackson-Jones, Lucy H., Sheelagh M. Duncan, Marlène S. Magalhaes, Sharon M. Campbell,
Rick M. Maizels, Henry J. McSorley, Judith E. Allen, and Cécile Bénézech. 2016. “Fat-
Associated Lymphoid Clusters Control Local IgM Secretion during Pleural Infection and
Lung Inflammation.” Nature Communications 7 (September): 12651.
https://doi.org/10.1038/ncomms12651.

148
Jaishy, Bharat, and E Dale Abel. 2016. “Lipids, Lysosomes, and Autophagy.” Journal of Lipid
Research 57 (9): 1619–35. https://doi.org/10.1194/jlr.R067520.
Jay, Anthony G, Alexander N Chen, Miguel A Paz, Justin P Hung, and James A Hamilton.
2015. “CD36 Binds Oxidized Low Density Lipoprotein (LDL) in a Mechanism
Dependent upon Fatty Acid Binding.” The Journal of Biological Chemistry 290 (8):
4590–4603. https://doi.org/10.1074/jbc.M114.627026.
Jenkins, Stephen J., and David A. Hume. 2014. “Homeostasis in the Mononuclear Phagocyte
System.” Trends in Immunology 35 (8): 358–67.
https://doi.org/10.1016/J.IT.2014.06.006.
Jenkins, Stephen J, Dominik Ruckerl, Peter C Cook, Lucy H Jones, Fred D Finkelman, Nico
van Rooijen, Andrew S MacDonald, and Judith E Allen. 2011. “Local Macrophage
Proliferation, Rather than Recruitment from the Blood, Is a Signature of TH2
Inflammation.” Science (New York, N.Y.) 332 (6035): 1284–88.
https://doi.org/10.1126/science.1204351.
Jenkins, Stephen J, Dominik Ruckerl, Graham D Thomas, James P Hewitson, Sheelagh
Duncan, Frank Brombacher, Rick M Maizels, David A Hume, and Judith E Allen. 2013a.
“IL-4 Directly Signals Tissue-Resident Macrophages to Proliferate beyond Homeostatic
Levels Controlled by CSF-1.” The Journal of Experimental Medicine 210 (11): 2477–
91. https://doi.org/10.1084/jem.20121999.
———. 2013b. “IL-4 Directly Signals Tissue-Resident Macrophages to Proliferate beyond
Homeostatic Levels Controlled by CSF-1.” The Journal of Experimental Medicine 210
(11): 2477–91. https://doi.org/10.1084/jem.20121999.
Jeon, Sang-Min. 2016. “Regulation and Function of AMPK in Physiology and Diseases.”
Experimental & Molecular Medicine 48 (7): e245–e245.
https://doi.org/10.1038/emm.2016.81.
Jeong, Se Jin, Mi Ni Lee, and Goo Taeg Oh. 2017. “The Role of Macrophage Lipophagy in
Reverse Cholesterol Transport.” Endocrinology and Metabolism (Seoul, Korea) 32 (1):
41–46. https://doi.org/10.3803/EnM.2017.32.1.41.
Ji, Haofeng, Yuanxing Liu, Yu Zhang, Xiu-da Shen, Feng Gao, Ronald W Busuttil, Vijay K
Kuchroo, and Jerzy W Kupiec-Weglinski. 2014. “T-Cell Immunoglobulin and Mucin

149
Domain 4 (TIM-4) Signaling in Innate Immune-Mediated Liver Ischemia-Reperfusion
Injury.” Hepatology (Baltimore, Md.) 60 (6): 2052–64.
https://doi.org/10.1002/hep.27334.
Kanda, Hajime, Sanshiro Tateya, Yoshikazu Tamori, Ko Kotani, Ken-ichi Hiasa, Riko
Kitazawa, Sohei Kitazawa, et al. 2006a. “MCP-1 Contributes to Macrophage Infiltration
into Adipose Tissue, Insulin Resistance, and Hepatic Steatosis in Obesity.” The Journal
of Clinical Investigation 116 (6): 1494–1505. https://doi.org/10.1172/JCI26498.
———. 2006b. “MCP-1 Contributes to Macrophage Infiltration into Adipose Tissue, Insulin
Resistance, and Hepatic Steatosis in Obesity.” The Journal of Clinical Investigation 116
(6): 1494–1505. https://doi.org/10.1172/JCI26498.
Kanneganti, Thirumala-Devi, and Vishwa Deep Dixit. 2012. “Immunological Complications
of Obesity.” Nature Immunology 13 (8): 707–12. https://doi.org/10.1038/ni.2343.
Kathiresan, Sekar, Cristen J Willer, Gina M Peloso, Serkalem Demissie, Kiran Musunuru, Eric
E Schadt, Lee Kaplan, et al. 2009a. “Common Variants at 30 Loci Contribute to
Polygenic Dyslipidemia.” Nature Genetics 41 (1): 56–65.
https://doi.org/10.1038/ng.291.
———. 2009b. “Common Variants at 30 Loci Contribute to Polygenic Dyslipidemia.” Nature
Genetics 41 (1): 56–65. https://doi.org/10.1038/ng.291.
Klop, Boudewijn, Jan Willem F Elte, and Manuel Castro Cabezas. 2013. “Dyslipidemia in
Obesity: Mechanisms and Potential Targets.” Nutrients 5 (4): 1218–40.
https://doi.org/10.3390/nu5041218.
Kobayashi, Norimoto, Piia Karisola, Victor Peña-Cruz, David M Dorfman, Masahisa Jinushi,
Sarah E Umetsu, Manish J Butte, et al. 2007. “TIM-1 and TIM-4 Glycoproteins Bind
Phosphatidylserine and Mediate Uptake of Apoptotic Cells.” Immunity 27 (6): 927–40.
https://doi.org/10.1016/j.immuni.2007.11.011.
Komornik, V. 1985. “Some New Estimates for the Eigenfunctions of Higher Order of a Linear
Differential Operator.” Acta Mathematica Hungarica 45 (3–4): 451–57.
https://doi.org/10.1038/ncomms2877.
Konrad, Daniel, and Stephan Wueest. 2014. “The Gut-Adipose-Liver Axis in the Metabolic

150
Syndrome.” Physiology 29 (5): 304–13. https://doi.org/10.1152/physiol.00014.2014.
Koppaka, S., S. Kehlenbrink, M. Carey, W. Li, E. Sanchez, D.-E. Lee, H. Lee, et al. 2013.
“Reduced Adipose Tissue Macrophage Content Is Associated With Improved Insulin
Sensitivity in Thiazolidinedione-Treated Diabetic Humans.” Diabetes 62 (6): 1843–54.
https://doi.org/10.2337/db12-0868.
Kosteli, Aliki, Eiji Sugaru, Guenter Haemmerle, Jayne F. Martin, Jason Lei, Rudolf Zechner,
and Anthony W. Ferrante. 2010a. “Weight Loss and Lipolysis Promote a Dynamic
Immune Response in Murine Adipose Tissue.” Journal of Clinical Investigation 120
(10): 3466–79. https://doi.org/10.1172/JCI42845.
———. 2010b. “Weight Loss and Lipolysis Promote a Dynamic Immune Response in Murine
Adipose Tissue.” Journal of Clinical Investigation 120 (10): 3466–79.
https://doi.org/10.1172/JCI42845.
Krenkel, Oliver, and Frank Tacke. 2017. “Liver Macrophages in Tissue Homeostasis and
Disease.” Nature Reviews Immunology. https://doi.org/10.1038/nri.2017.11.
Kristiansen, Mette, Jonas H. Graversen, Christian Jacobsen, Ole Sonne, Hans-Jürgen
Hoffman, S.K. Alex Law, and Søren K. Moestrup. 2001. “Identification of the
Haemoglobin Scavenger Receptor.” Nature 409 (6817): 198–201.
https://doi.org/10.1038/35051594.
Krivit, W, C Peters, K Dusenbery, Y Ben-Yoseph, NKC Ramsay, JE Wagner, and R Anderson.
2000. “Wolman Disease Successfully Treated by Bone Marrow Transplantation.” Bone
Marrow Transplantation 26 (5): 567–70. https://doi.org/10.1038/sj.bmt.1702557.
Kunjathoor, Vidya V, Maria Febbraio, Eugene A Podrez, Kathryn J Moore, Lorna Andersson,
Stephanie Koehn, Jeongmi S Rhee, Roy Silverstein, Henry F Hoff, and Mason W
Freeman. 2002. “Scavenger Receptors Class A-I/II and CD36 Are the Principal
Receptors Responsible for the Uptake of Modified Low Density Lipoprotein Leading to
Lipid Loading in Macrophages.” The Journal of Biological Chemistry 277 (51): 49982–
88. https://doi.org/10.1074/jbc.M209649200.
Kwon, H-J, S-N Kim, Y-A Kim, and Y-H Lee. 2016. “The Contribution of Arachidonate 15-
Lipoxygenase in Tissue Macrophages to Adipose Tissue Remodeling.” Cell Death &
Disease 7 (6): e2285–e2285. https://doi.org/10.1038/cddis.2016.190.

151
Lee, Yun Sok, Pingping Li, Jin Young Huh, In Jae Hwang, Min Lu, Jong In Kim, Mira Ham,
et al. 2011. “Inflammation Is Necessary for Long-Term but Not Short-Term High-Fat
Diet-Induced Insulin Resistance.” Diabetes 60 (10): 2474–83.
https://doi.org/10.2337/db11-0194.
Li, Pingping, Min Lu, M T Audrey Nguyen, Eun Ju Bae, Justin Chapman, Daorong Feng,
Meredith Hawkins, et al. 2010. “Functional Heterogeneity of CD11c-Positive Adipose
Tissue Macrophages in Diet-Induced Obese Mice.” The Journal of Biological Chemistry
285 (20): 15333–45. https://doi.org/10.1074/jbc.M110.100263.
Lim, Chun-Yan, and Roberto Zoncu. 2016. “The Lysosome as a Command-and-Control
Center for Cellular Metabolism.” The Journal of Cell Biology 214 (6): 653–64.
https://doi.org/10.1083/jcb.201607005.
Lumeng, C. N., J. B. DelProposto, D. J. Westcott, and A. R. Saltiel. 2008. “Phenotypic
Switching of Adipose Tissue Macrophages With Obesity Is Generated by Spatiotemporal
Differences in Macrophage Subtypes.” Diabetes 57 (12): 3239–46.
https://doi.org/10.2337/db08-0872.
Lumeng, C. N., S. M. DeYoung, J. L. Bodzin, and A. R. Saltiel. 2007. “Increased
Inflammatory Properties of Adipose Tissue Macrophages Recruited During Diet-
Induced Obesity.” Diabetes 56 (1): 16–23. https://doi.org/10.2337/db06-1076.
Lumeng, Carey N., Stephanie M. Deyoung, and Alan R. Saltiel. 2007. “Macrophages Block
Insulin Action in Adipocytes by Altering Expression of Signaling and Glucose Transport
Proteins.” American Journal of Physiology-Endocrinology and Metabolism 292 (1):
E166–74. https://doi.org/10.1152/ajpendo.00284.2006.
Lumeng, Carey N, Jennifer L Bodzin, and Alan R Saltiel. 2007. “Obesity Induces a Phenotypic
Switch in Adipose Tissue Macrophage Polarization.” The Journal of Clinical
Investigation 117 (1): 175–84. https://doi.org/10.1172/JCI29881.
Lynch, Lydia. 2014. “Adipose Invariant Natural Killer T Cells.” Immunology 142 (3): 337–
46. https://doi.org/10.1111/imm.12269.
Lynch, Lydia, Michael Nowak, Bindu Varghese, Justice Clark, Andrew E. Hogan, Vasillis
Toxavidis, Steven P. Balk, Donal O’Shea, Cliona O’Farrelly, and Mark A. Exley. 2012.
“Adipose Tissue Invariant NKT Cells Protect against Diet-Induced Obesity and

152
Metabolic Disorder through Regulatory Cytokine Production.” Immunity 37 (3): 574–87.
https://doi.org/10.1016/j.immuni.2012.06.016.
Mackaness, G B. 1962. “Cellular Resistance to Infection.” The Journal of Experimental
Medicine 116 (3): 381–406. https://doi.org/10.1084/jem.116.3.381.
Martinez-Santibañez, Gabriel, and Carey Nien-Kai Lumeng. 2014. “Macrophages and the
Regulation of Adipose Tissue Remodeling.” Annual Review of Nutrition 34 (1): 57–76.
https://doi.org/10.1146/annurev-nutr-071812-161113.
Martinez, Fernando O, and Siamon Gordon. 2014. “The M1 and M2 Paradigm of Macrophage
Activation: Time for Reassessment.” F1000prime Reports 6: 13.
https://doi.org/10.12703/P6-13.
Matsuzawa, Y, I Shimomura, T Nakamura, Y Keno, K Kotani, and K Tokunaga. 1995.
“Pathophysiology and Pathogenesis of Visceral Fat Obesity.” Obesity Research 3 Suppl
2 (September): 187S–194S. http://www.ncbi.nlm.nih.gov/pubmed/8581775.
McLaughlin, Tracey, Cindy Lamendola, Alice Liu, and Fahim Abbasi. 2011. “Preferential Fat
Deposition in Subcutaneous Versus Visceral Depots Is Associated with Insulin
Sensitivity.” The Journal of Clinical Endocrinology & Metabolism 96 (11): E1756–60.
https://doi.org/10.1210/jc.2011-0615.
Metchnikoff, E. 1892. Lecons Sur La Pathologies Comparee de l’inflammation. Masson.
https://ia800708.us.archive.org/3/items/leonssurlapathol00metc/leonssurlapathol00met
c.pdf.
Miller, Yury I., Soo-Ho Choi, Longhou Fang, and Sotirios Tsimikas. 2010. “Lipoprotein
Modification and Macrophage Uptake: Role of Pathologic Cholesterol Transport in
Atherogenesis.” In , 229–51. Springer, Dordrecht. https://doi.org/10.1007/978-90-481-
8622-8_8.
Mittendorfer, Bettina. 2011. “Origins of Metabolic Complications in Obesity: Adipose Tissue
and Free Fatty Acid Trafficking.” Current Opinion in Clinical Nutrition and Metabolic
Care 14 (6): 535–41. https://doi.org/10.1097/MCO.0b013e32834ad8b6.
Miyanishi, Masanori, Kazutoshi Tada, Masato Koike, Yasuo Uchiyama, Toshio Kitamura, and
Shigekazu Nagata. 2007. “Identification of Tim4 as a Phosphatidylserine Receptor.”

153
Nature 450 (7168): 435–39. https://doi.org/10.1038/nature06307.
Moore, Kathryn J, and Mason W Freeman. 2006. “Scavenger Receptors in Atherosclerosis:
Beyond Lipid Uptake.” Arteriosclerosis, Thrombosis, and Vascular Biology 26 (8):
1702–11. https://doi.org/10.1161/01.ATV.0000229218.97976.43.
Morigny, Pauline, Marianne Houssier, Etienne Mouisel, and Dominique Langin. 2016.
“Adipocyte Lipolysis and Insulin Resistance.” Biochimie 125 (June): 259–66.
https://doi.org/10.1016/J.BIOCHI.2015.10.024.
Morris, David L., Kae Won Cho, Jennifer L. DelProposto, Kelsie E. Oatmen, Lynn M.
Geletka, Gabriel Martinez-Santibanez, Kanakadurga Singer, and Carey N. Lumeng.
2013. “Adipose Tissue Macrophages Function as Antigen Presenting Cells and Regulate
Adipose Tissue CD4+ T Cells in Mice.” Diabetes 62 (MHC II): 2762–72.
https://doi.org/10.2337/db12-1404.
Muir, Lindsey A., Samadhi Kiridena, Cameron Griffin, Jennifer B. DelProposto, Lynn
Geletka, Gabriel Martinez-Santibañez, Brian F. Zamarron, et al. 2018. “Frontline
Science: Rapid Adipose Tissue Expansion Triggers Unique Proliferation and Lipid
Accumulation Profiles in Adipose Tissue Macrophages.” Journal of Leukocyte Biology
103 (4): 615–28. https://doi.org/10.1002/JLB.3HI1017-422R.
Murano, I, G Barbatelli, V Parisani, C Latini, G Muzzonigro, M Castellucci, and S Cinti. 2008.
“Dead Adipocytes, Detected as Crown-like Structures, Are Prevalent in Visceral Fat
Depots of Genetically Obese Mice.” Journal of Lipid Research 49 (7): 1562–68.
https://doi.org/10.1194/jlr.M800019-JLR200.
Murphy, Jaime, Ross Summer, Andrew A Wilson, Darrell N Kotton, and Alan Fine. 2008.
“The Prolonged Life-Span of Alveolar Macrophages.” American Journal of Respiratory
Cell and Molecular Biology 38 (4): 380–85. https://doi.org/10.1165/rcmb.2007-0224RC.
Nakajima, Shotaro, Vivien Koh, Ley-Fang Kua, Jimmy So, Lomanto Davide, Kee Siang Lim,
Sven Hans Petersen, Wei-Peng Yong, Asim Shabbir, and Koji Kono. 2016.
“Accumulation of CD11c+CD163+ Adipose Tissue Macrophages through Upregulation
of Intracellular 11β-HSD1 in Human Obesity.” Journal of Immunology (Baltimore, Md. :
1950) 197 (9): 3735–45. https://doi.org/10.4049/jimmunol.1600895.
Nawaz, Allah, Aminuddin Aminuddin, Tomonobu Kado, Akiko Takikawa, Seiji Yamamoto,
154
Koichi Tsuneyama, Yoshiko Igarashi, et al. 2017. “CD206+ M2-like Macrophages
Regulate Systemic Glucose Metabolism by Inhibiting Proliferation of Adipocyte
Progenitors.” Nature Communications 8 (1): 286. https://doi.org/10.1038/s41467-017-
00231-1.
Nguyen, Khoa D., Yifu Qiu, Xiaojin Cui, Y. P. Sharon Goh, Julia Mwangi, Tovo David, Lata
Mukundan, Frank Brombacher, Richard M. Locksley, and Ajay Chawla. 2011.
“Alternatively Activated Macrophages Produce Catecholamines to Sustain Adaptive
Thermogenesis.” Nature 480 (7375): 104–8. https://doi.org/10.1038/nature10653.
Nguyen, M. T. Audrey, Svetlana Favelyukis, Anh-Khoi Nguyen, Donna Reichart, Peter A.
Scott, Alan Jenn, Ru Liu-Bryan, Christopher K. Glass, Jaap G. Neels, and Jerrold M.
Olefsky. 2007. “A Subpopulation of Macrophages Infiltrates Hypertrophic Adipose
Tissue and Is Activated by Free Fatty Acids via Toll-like Receptors 2 and 4 and JNK-
Dependent Pathways.” Journal of Biological Chemistry 282 (48): 35279–92.
https://doi.org/10.1074/jbc.M706762200.
Nielsen, Thomas Svava, Niels Jessen, Jens Otto L Jørgensen, Niels Møller, and Sten Lund.
2014. “Dissecting Adipose Tissue Lipolysis: Molecular Regulation and Implications for
Metabolic Disease.” Journal of Molecular Endocrinology 52 (3): R199-222.
https://doi.org/10.1530/JME-13-0277.
Nishi, Chihiro, Satoshi Toda, Katsumori Segawa, and Shigekazu Nagata. 2014. “Tim4- and
MerTK-Mediated Engulfment of Apoptotic Cells by Mouse Resident Peritoneal
Macrophages.” Molecular and Cellular Biology 34 (8): 1512–20.
https://doi.org/10.1128/MCB.01394-13.
O’Neill, Luke A. J., Rigel J. Kishton, and Jeff Rathmell. 2016. “A Guide to
Immunometabolism for Immunologists.” Nature Reviews Immunology 16 (9): 553–65.
https://doi.org/10.1038/nri.2016.70.
Odegaard, Justin I, Roberto R Ricardo-Gonzalez, Matthew H Goforth, Christine R Morel,
Vidya Subramanian, Lata Mukundan, Alex Red Eagle, et al. 2007. “Macrophage-
Specific PPARgamma Controls Alternative Activation and Improves Insulin
Resistance.” Nature 447 (7148): 1116–20. https://doi.org/10.1038/nature05894.
Osborn, Olivia, and Jerrold M Olefsky. 2012. “The Cellular and Signaling Networks Linking
the Immune System and Metabolism in Disease.” Nature Medicine 18 (3): 363–74.

155
https://doi.org/10.1038/nm.2627.
Ouimet, Mireille, Vivian Franklin, Esther Mak, Xianghai Liao, Ira Tabas, and Yves L. Marcel.
2011. “Autophagy Regulates Cholesterol Efflux from Macrophage Foam Cells via
Lysosomal Acid Lipase.” Cell Metabolism 13 (6): 655–67.
https://doi.org/10.1016/J.CMET.2011.03.023.
Park, Daeho, Amelia Hochreiter-Hufford, and Kodi S. Ravichandran. 2009. “The
Phosphatidylserine Receptor TIM-4 Does Not Mediate Direct Signaling.” Current
Biology 19 (4): 346–51. https://doi.org/10.1016/J.CUB.2009.01.042.
Patel, Amit A, Yan Zhang, James N Fullerton, Lies Boelen, Anthony Rongvaux, Alexander A
Maini, Venetia Bigley, et al. 2017. “The Fate and Lifespan of Human Monocyte Subsets
in Steady State and Systemic Inflammation.” The Journal of Experimental Medicine 214
(7): 1913–23. https://doi.org/10.1084/jem.20170355.
Patsouris, David, Ping-Ping Li, Divya Thapar, Justin Chapman, Jerrold M. Olefsky, and Jaap
G. Neels. 2008a. “Ablation of CD11c-Positive Cells Normalizes Insulin Sensitivity in
Obese Insulin Resistant Animals.” Cell Metabolism 8 (4): 301–9.
https://doi.org/10.1016/j.cmet.2008.08.015.
Pearce, Edward J, and Bart Everts. 2015. “Dendritic Cell Metabolism.” Nature Reviews.
Immunology 15 (1): 18–29. https://doi.org/10.1038/nri3771.
Perdiguero, Elisa Gomez, and Frederic Geissmann. 2016. “The Development and Maintenance
of Resident Macrophages.” Nature Immunology 17 (1): 2–8.
https://doi.org/10.1038/ni.3341.
Pereira, Solange S., and Jacqueline I. Alvarez-Leite. 2014. “Low-Grade Inflammation,
Obesity, and Diabetes.” Current Obesity Reports 3 (4): 422–31.
https://doi.org/10.1007/s13679-014-0124-9.
Prieur, Xavier, Crystal Y.L. Mok, Vidya R. Velagapudi, Vanessa Núñez, Lucía Fuentes, David
Montaner, Ko Ishikawa, et al. 2011. “Differential Lipid Partitioning Between Adipocytes
and Tissue Macrophages Modulates Macrophage Lipotoxicity and M2/M1 Polarization
in Obese Mice.” Diabetes 60 (3): 797–809. https://doi.org/10.2337/db10-0705.
Qiu, Yifu, Khoa D. Nguyen, Justin I. Odegaard, Xiaojin Cui, Xiaoyu Tian, Richard M.

156
Locksley, Richard D. Palmiter, and Ajay Chawla. 2014. “Eosinophils and Type 2
Cytokine Signaling in Macrophages Orchestrate Development of Functional Beige Fat.”
Cell 157 (6): 1292–1308. https://doi.org/10.1016/j.cell.2014.03.066.
Rader, Daniel J., and Ellen Puré. 2005. “Lipoproteins, Macrophage Function, and
Atherosclerosis: Beyond the Foam Cell?” Cell Metabolism 1 (4): 223–30.
https://doi.org/10.1016/J.CMET.2005.03.005.
Reilly, Shannon M., and Alan R. Saltiel. 2014. “A Complex Role for Adipose Tissue
Macrophages.” Nature Reviews Endocrinology 10 (4): 193–94.
https://doi.org/10.1038/nrendo.2014.12.
———. 2017. “Adapting to Obesity with Adipose Tissue Inflammation.” Nature Reviews
Endocrinology 13 (11): 633–43. https://doi.org/10.1038/nrendo.2017.90.
Reiner, Željko, Ornella Guardamagna, Devaki Nair, Handrean Soran, Kees Hovingh, Stefano
Bertolini, Simon Jones, et al. 2014. “Lysosomal Acid Lipase Deficiency--an under-
Recognized Cause of Dyslipidaemia and Liver Dysfunction.” Atherosclerosis 235 (1):
21–30. https://doi.org/10.1016/j.atherosclerosis.2014.04.003.
Remmerie, Anneleen, and Charlotte L. Scott. 2018. “Macrophages and Lipid Metabolism.”
Cellular Immunology, February. https://doi.org/10.1016/J.CELLIMM.2018.01.020.
Ricardo-Gonzalez, Roberto R, Alex Red Eagle, Justin I Odegaard, Hani Jouihan, Christine R
Morel, Jose E Heredia, Lata Mukundan, Davina Wu, Richard M Locksley, and Ajay
Chawla. 2010. “IL-4/STAT6 Immune Axis Regulates Peripheral Nutrient Metabolism
and Insulin Sensitivity.” Proceedings of the National Academy of Sciences of the United
States of America 107 (52): 22617–22. https://doi.org/10.1073/pnas.1009152108.
Rosas, M., L. C. Davies, P. J. Giles, C.-T. Liao, B. Kharfan, T. C. Stone, V. B. O’Donnell, D.
J. Fraser, S. A. Jones, and P. R. Taylor. 2014. “The Transcription Factor Gata6 Links
Tissue Macrophage Phenotype and Proliferative Renewal.” Science 344 (6184): 645–48.
https://doi.org/10.1126/science.1251414.
Samuel, Varman T, Zhen-Xiang Liu, Xianqin Qu, Benjamin D Elder, Stefan Bilz, Douglas
Befroy, Anthony J Romanelli, and Gerald I Shulman. 2004. “Mechanism of Hepatic
Insulin Resistance in Non-Alcoholic Fatty Liver Disease.” The Journal of Biological
Chemistry 279 (31): 32345–53. https://doi.org/10.1074/jbc.M313478200.

157
Santiago, César, Angela Ballesteros, Laura Martínez-Muñoz, Mario Mellado, Gerardo G.
Kaplan, Gordon J. Freeman, and José M. Casasnovas. 2007. “Structures of T Cell
Immunoglobulin Mucin Protein 4 Show a Metal-Ion-Dependent Ligand Binding Site
Where Phosphatidylserine Binds.” Immunity 27 (6): 941–51.
https://doi.org/10.1016/j.immuni.2007.11.008.
Schipper, Henk S., Berent Prakken, Eric Kalkhoven, and Marianne Boes. 2012. “Adipose
Tissue-Resident Immune Cells: Key Players in Immunometabolism.” Trends in
Endocrinology & Metabolism 23 (8): 407–15.
https://doi.org/10.1016/J.TEM.2012.05.011.
Schlitzer, Andreas, and Joachim L Schultze. 2017. “Tissue-Resident Macrophages - How to
Humanize Our Knowledge.” Immunology and Cell Biology 95 (2): 173–77.
https://doi.org/10.1038/icb.2016.82.
Schreyer, S A, D L Wilson, and R C LeBoeuf. 1998. “C57BL/6 Mice Fed High Fat Diets as
Models for Diabetes-Accelerated Atherosclerosis.” Atherosclerosis 136 (1): 17–24.
https://doi.org/10.1016/S0021-9150(97)00165-2.
Schulz, C., E. G. Perdiguero, L. Chorro, H. Szabo-Rogers, N. Cagnard, K. Kierdorf, M. Prinz,
et al. 2012a. “A Lineage of Myeloid Cells Independent of Myb and Hematopoietic Stem
Cells.” Science 336 (6077): 86–90. https://doi.org/10.1126/science.1219179.
Scotland, R. S., M. J. Stables, S. Madalli, P. Watson, and D. W. Gilroy. 2011. “Sex Differences
in Resident Immune Cell Phenotype Underlie More Efficient Acute Inflammatory
Responses in Female Mice.” Blood 118 (22): 5918–27. https://doi.org/10.1182/blood-
2011-03-340281.
Scott, Charlotte L, and Martin Guilliams. 2018. “The Role of Kupffer Cells in Hepatic Iron
and Lipid Metabolism.” Journal of Hepatology 0 (0).
https://doi.org/10.1016/j.jhep.2018.02.013.
Scott, Charlotte L, Fang Zheng, Patrick De Baetselier, Liesbet Martens, Yvan Saeys, Sofie De
Prijck, Saskia Lippens, et al. 2016. “Bone Marrow-Derived Monocytes Give Rise to Self-
Renewing and Fully Differentiated Kupffer Cells.” Nature Communications 7 (January):
10321. https://doi.org/10.1038/ncomms10321.
Serbina, Natalya V, and Eric G Pamer. 2006. “Monocyte Emigration from Bone Marrow

158
during Bacterial Infection Requires Signals Mediated by Chemokine Receptor CCR2.”
Nature Immunology 7 (3): 311–17. https://doi.org/10.1038/ni1309.
Shapiro, Hagit, Tal Pecht, Ruthy Shaco-Levy, Ilana Harman-Boehm, Boris Kirshtein, Yael
Kuperman, Alon Chen, Matthias Blüher, Iris Shai, and Assaf Rudich. 2013. “Adipose
Tissue Foam Cells Are Present in Human Obesity.” The Journal of Clinical
Endocrinology & Metabolism 98 (3): 1173–81. https://doi.org/10.1210/jc.2012-2745.
Shaw, Tovah N, Stephanie A Houston, Kelly Wemyss, Hayley M Bridgeman, Thomas A
Barbera, Tamsin Zangerle-Murray, Patrick Strangward, et al. 2018. “Tissue-Resident
Macrophages in the Intestine Are Long Lived and Defined by Tim-4 and CD4
Expression.” The Journal of Experimental Medicine 215 (6): 1507–18.
https://doi.org/10.1084/jem.20180019.
Sheedy, Frederick J, Alena Grebe, Katey J Rayner, Parisa Kalantari, Bhama Ramkhelawon,
Susan B Carpenter, Christine E Becker, et al. 2013. “CD36 Coordinates NLRP3
Inflammasome Activation by Facilitating Intracellular Nucleation of Soluble Ligands
into Particulate Ligands in Sterile Inflammation.” Nature Immunology 14 (8): 812–20.
https://doi.org/10.1038/ni.2639.
Sheng, Jianpeng, Christiane Ruedl, and Klaus Karjalainen. 2015. “Most Tissue-Resident
Macrophages Except Microglia Are Derived from Fetal Hematopoietic Stem Cells.”
Immunity 43 (2): 382–93. https://doi.org/10.1016/J.IMMUNI.2015.07.016.
Shi, Chao, and Eric G Pamer. 2011. “Monocyte Recruitment during Infection and
Inflammation.” Nature Reviews. Immunology 11 (11): 762–74.
https://doi.org/10.1038/nri3070.
Shin, Kyung Cheul, Injae Hwang, Sung Sik Choe, Jeu Park, Yul Ji, Jong In Kim, Gha Young
Lee, et al. 2017. “Macrophage VLDLR Mediates Obesity-Induced Insulin Resistance
with Adipose Tissue Inflammation.” Nature Communications 8 (1): 1087.
https://doi.org/10.1038/s41467-017-01232-w.
Smith, Ulf. 2015. “Abdominal Obesity: A Marker of Ectopic Fat Accumulation.” Journal of
Clinical Investigation 125 (5): 1790–92. https://doi.org/10.1172/JCI81507.
Spracklen, Cassandra N., Peng Chen, Young Jin Kim, Xu Wang, Hui Cai, Shengxu Li, Jirong
Long, et al. 2017. “Association Analyses of East Asian Individuals and Trans-Ancestry

159
Analyses with European Individuals Reveal New Loci Associated with Cholesterol and
Triglyceride Levels.” Human Molecular Genetics 26 (9): 1770–84.
https://doi.org/10.1093/hmg/ddx062.
Stein, M, S Keshav, N Harris, and S Gordon. 1992. “Interleukin 4 Potently Enhances Murine
Macrophage Mannose Receptor Activity: A Marker of Alternative Immunologic
Macrophage Activation.” The Journal of Experimental Medicine 176 (1): 287–92.
http://www.ncbi.nlm.nih.gov/pubmed/1613462.
Stern, Jennifer H, Joseph M Rutkowski, and Philipp E Scherer. 2016. “Cell Metabolism
Review Adiponectin, Leptin, and Fatty Acids in the Maintenance of Metabolic
Homeostasis through Adipose Tissue Crosstalk.”
https://doi.org/10.1016/j.cmet.2016.04.011.
Surakka, Ida, Momoko Horikoshi, Reedik Mägi, Antti Pekka Sarin, Anubha Mahajan, Vasiliki
Lagou, Letizia Marullo, et al. 2015. “The Impact of Low-Frequency and Rare Variants
on Lipid Levels.” Nature Genetics 47 (6): 589–97. https://doi.org/10.1038/ng.3300.
Takahashi, K, F Yamamura, and M Naito. 1989. “Differentiation, Maturation, and
Proliferation of Macrophages in the Mouse Yolk Sac: A Light-Microscopic, Enzyme-
Cytochemical, Immunohistochemical, and Ultrastructural Study.” Journal of Leukocyte
Biology 45 (2): 87–96. http://www.ncbi.nlm.nih.gov/pubmed/2536795.
Takahashi, Manabu, Hiroaki Yagyu, Fumiko Tazoe, Shuichi Nagashima, Taichi Ohshiro,
Kenta Okada, Jun-ichi Osuga, Ira J. Goldberg, and Shun Ishibashi. 2013. “Macrophage
Lipoprotein Lipase Modulates the Development of Atherosclerosis but Not Adiposity.”
Journal of Lipid Research 54 (4): 1124–34. https://doi.org/10.1194/jlr.M035568.
Tamoutounour, Samira, Sandrine Henri, Hugues Lelouard, Béatrice de Bovis, Colin de Haar,
C. Janneke van der Woude, Andrea M. Woltman, et al. 2012. “CD64 Distinguishes
Macrophages from Dendritic Cells in the Gut and Reveals the Th1-Inducing Role of
Mesenteric Lymph Node Macrophages during Colitis.” European Journal of
Immunology 42 (12): 3150–66. https://doi.org/10.1002/eji.201242847.
Teslovich, Tanya M., Kiran Musunuru, Albert V. Smith, Andrew C. Edmondson, Ioannis M.
Stylianou, Masahiro Koseki, James P. Pirruccello, et al. 2010. “Biological, Clinical and
Population Relevance of 95 Loci for Blood Lipids.” Nature 466 (7307): 707–13.
https://doi.org/10.1038/nature09270.

160
Thomas, Dylan, and Caroline Apovian. 2017. “Macrophage Functions in Lean and Obese
Adipose Tissue.” Metabolism 72 (July): 120–43.
https://doi.org/10.1016/J.METABOL.2017.04.005.
Tiemessen, M. M., A. L. Jagger, H. G. Evans, M. J. C. van Herwijnen, S. John, and L. S.
Taams. 2007. “CD4+CD25+Foxp3+ Regulatory T Cells Induce Alternative Activation
of Human Monocytes/Macrophages.” Proceedings of the National Academy of Sciences
104 (49): 19446–51. https://doi.org/10.1073/pnas.0706832104.
Tontonoz, P, L Nagy, J G Alvarez, V A Thomazy, and R M Evans. 1998. “PPARgamma
Promotes Monocyte/Macrophage Differentiation and Uptake of Oxidized LDL.” Cell 93
(2): 241–52. http://www.ncbi.nlm.nih.gov/pubmed/9568716.
Tsou, Chia-Lin, Wendy Peters, Yue Si, Sarah Slaymaker, Ara M Aslanian, Stuart P Weisberg,
Matthias Mack, and Israel F Charo. 2007. “Critical Roles for CCR2 and MCP-3 in
Monocyte Mobilization from Bone Marrow and Recruitment to Inflammatory Sites.” The
Journal of Clinical Investigation 117 (4): 902–9. https://doi.org/10.1172/JCI29919.
Uderhardt, Stefan, Martin Herrmann, Olga V. Oskolkova, Susanne Aschermann, Wolfgang
Bicker, Natacha Ipseiz, Kerstin Sarter, et al. 2012. “12/15-Lipoxygenase Orchestrates
the Clearance of Apoptotic Cells and Maintains Immunologic Tolerance.” Immunity 36
(5): 834–46. https://doi.org/10.1016/J.IMMUNI.2012.03.010.
Wang, Qiong A, Philipp E Scherer, and Rana K Gupta. 2014. “Improved Methodologies for
the Study of Adipose Biology: Insights Gained and Opportunities Ahead.” Journal of
Lipid Research 55 (4): 605–24. https://doi.org/10.1194/jlr.R046441.
Wang, Qiong A, Caroline Tao, Rana K Gupta, and Philipp E Scherer. 2013. “Tracking
Adipogenesis during White Adipose Tissue Development, Expansion and
Regeneration.” Nature Medicine 19 (10): 1338–44. https://doi.org/10.1038/nm.3324.
Weisberg, Stuart P, Daniel McCann, Manisha Desai, Michael Rosenbaum, Rudolph L Leibel,
Anthony W Ferrante, and Jr. 2003. “Obesity Is Associated with Macrophage
Accumulation in Adipose Tissue.” The Journal of Clinical Investigation 112 (12): 1796–
1808. https://doi.org/10.1172/JCI19246.
Weissglas-Volkov, Daphna, Carlos A Aguilar-Salinas, Elina Nikkola, Kerry A Deere, Ivette
Cruz-Bautista, Olimpia Arellano-Campos, Linda Liliana Muñoz-Hernandez, et al. 2013.

161
“Genomic Study in Mexicans Identifies a New Locus for Triglycerides and Refines
European Lipid Loci.” Journal of Medical Genetics 50 (5): 298–308.
https://doi.org/10.1136/jmedgenet-2012-101461.
Wentworth, J. M., G. Naselli, W. A. Brown, L. Doyle, B. Phipson, G. K. Smyth, M. Wabitsch,
P. E. O’Brien, and L. C. Harrison. 2010. “Pro-Inflammatory CD11c+CD206+ Adipose
Tissue Macrophages Are Associated With Insulin Resistance in Human Obesity.”
Diabetes 59 (7): 1648–56. https://doi.org/10.2337/db09-0287.
Wentworth, John M, Gaetano Naselli, Wendy A Brown, Lisa Doyle, Belinda Phipson, Gordon
K Smyth, Martin Wabitsch, Paul E O’Brien, and Leonard C Harrison. 2010. “Pro-
Inflammatory CD11c+CD206+ Adipose Tissue Macrophages Are Associated with
Insulin Resistance in Human Obesity.” Diabetes 59 (7): 1648–56.
https://doi.org/10.2337/db09-0287.
“WHO | Obesity and Overweight.” 2018. WHO.
http://www.who.int/mediacentre/factsheets/fs311/en/.
“WHO | Waist Circumference and Waist–Hip Ratio.” 2018. WHO.
Willer, Cristen J, Ellen M Schmidt, Sebanti Sengupta, Gonçalo R Abecasis, and Global Lipids
Genetics Consortium. 2013. “Discovery and Refinement of Loci Associated with Lipid
Levels.” Nature Genetics 45 (11): 1274–83. https://doi.org/10.1038/ng.2797.
Wong, K. L., J. J.-Y. Tai, W.-C. Wong, H. Han, X. Sem, W.-H. Yeap, P. Kourilsky, and S.-C.
Wong. 2011. “Gene Expression Profiling Reveals the Defining Features of the Classical,
Intermediate, and Nonclassical Human Monocyte Subsets.” Blood 118 (5): e16–31.
https://doi.org/10.1182/blood-2010-12-326355.
Wong, Kit, Patricia A Valdez, Christine Tan, Sherry Yeh, Jo-Anne Hongo, and Wenjun
Ouyang. 2010. “Phosphatidylserine Receptor Tim-4 Is Essential for the Maintenance of
the Homeostatic State of Resident Peritoneal Macrophages.” Proceedings of the National
Academy of Sciences of the United States of America 107 (19): 8712–17.
https://doi.org/10.1073/pnas.0910929107.
Wu, D., A. B. Molofsky, H.-E. Liang, R. R. Ricardo-Gonzalez, H. A. Jouihan, J. K. Bando,
A. Chawla, and R. M. Locksley. 2011. “Eosinophils Sustain Adipose Alternatively
Activated Macrophages Associated with Glucose Homeostasis.” Science 332 (6026):

162
243–47. https://doi.org/10.1126/science.1201475.
Wynn, Thomas A, and Kevin M Vannella. 2016. “Macrophages in Tissue Repair,
Regeneration, and Fibrosis.” Immunity 44 (3): 450–62.
https://doi.org/10.1016/j.immuni.2016.02.015.
Xu, Haiyan, Glenn T. Barnes, Qing Yang, Guo Tan, Daseng Yang, Chieh J. Chou, Jason Sole,
et al. 2003. “Chronic Inflammation in Fat Plays a Crucial Role in the Development of
Obesity-Related Insulin Resistance.” Journal of Clinical Investigation 112 (12): 1821–
30. https://doi.org/10.1172/JCI19451.
Xu, Xiaoyuan, Ambar Grijalva, Alicja Skowronski, Marco van Eijk, Mireille J. Serlie, and
Anthony W. Ferrante. 2013. “Obesity Activates a Program of Lysosomal-Dependent
Lipid Metabolism in Adipose Tissue Macrophages Independently of Classic Activation.”
Cell Metabolism 18 (6): 816–30. https://doi.org/10.1016/J.CMET.2013.11.001.
Yanagihashi, Yuichi, Katsumori Segawa, Ryota Maeda, Yo-Ichi Nabeshima, and Shigekazu
Nagata. 2017. “Mouse Macrophages Show Different Requirements for
Phosphatidylserine Receptor Tim4 in Efferocytosis.” Proceedings of the National
Academy of Sciences of the United States of America 114 (33): 8800–8805.
https://doi.org/10.1073/pnas.1705365114.
Ye, Jianping. 2013. “Mechanisms of Insulin Resistance in Obesity.” Frontiers of Medicine 7
(1): 14–24. https://doi.org/10.1007/s11684-013-0262-6.
Yona, Simon, Ki-Wook Kim, Yochai Wolf, Alexander Mildner, Diana Varol, Michal Breker,
Dalit Strauss-Ayali, et al. 2013. “Fate Mapping Reveals Origins and Dynamics of
Monocytes and Tissue Macrophages under Homeostasis.” Immunity 38 (1): 79–91.
https://doi.org/10.1016/j.immuni.2012.12.001.
Zeyda, M, D Farmer, J Todoric, O Aszmann, M Speiser, G Györi, G J Zlabinger, and T M
Stulnig. 2007. “Human Adipose Tissue Macrophages Are of an Anti-Inflammatory
Phenotype but Capable of Excessive pro-Inflammatory Mediator Production.”
International Journal of Obesity 31 (9): 1420–28. https://doi.org/10.1038/sj.ijo.0803632.
Zhang, Weiyu, Xianling Zhang, Huan Wang, Xin Guo, Honggui Li, Ying Wang, Xin Xu, et
al. 2012. “AMP-Activated Protein Kinase A1 Protects Against Diet-Induced Insulin
Resistance and Obesity.” https://doi.org/10.2337/db11-1373doi:10.2337/db11-1373/-

163
/DC1.
Zhang, Xia, Ricardo Goncalves, and David M Mosser. 2008. “The Isolation and
Characterization of Murine Macrophages.” Current Protocols in Immunology Chapter
14 (November): Unit 14.1. https://doi.org/10.1002/0471142735.im1401s83.
Zheng, C, Q Yang, J Cao, N Xie, K Liu, P Shou, F Qian, Y Wang, and Y Shi. 2016a. “Local
Proliferation Initiates Macrophage Accumulation in Adipose Tissue during Obesity.”
Cell Death & Disease 7 (3): e2167. https://doi.org/10.1038/cddis.2016.54.
Zigmond, E., S. Samia-Grinberg, M. Pasmanik-Chor, E. Brazowski, O. Shibolet, Z. Halpern,
and C. Varol. 2014. “Infiltrating Monocyte-Derived Macrophages and Resident Kupffer
Cells Display Different Ontogeny and Functions in Acute Liver Injury.” The Journal of
Immunology 193 (1): 344–53. https://doi.org/10.4049/jimmunol.1400574.
Recommended