Embed Size (px)
Citation preview
Research article
TheJournalofClinicalInvestigation http://www.jci.org Volume 119 Number 3 March 2009 531
Macrophage-derived human resistin exacerbates adipose tissue inflammation
and insulin resistance in miceMohammed Qatanani,1 Nava R. Szwergold,1 David R. Greaves,2
Rexford S. Ahima,1 and Mitchell A. Lazar1
1Division of Endocrinology, Diabetes, and Metabolism, Department of Medicine, and Institute for Diabetes, Obesity, and Metabolism, University of Pennsylvania School of Medicine, Philadelphia, Pennsylvania, USA. 2Sir William Dunn School of Pathology,
University of Oxford, Oxford, United Kingdom.
Resistinisanadipokinethatcontributestoinsulinresistanceinmice.Inhumans,however,studiesinvestigat-ingthelinkbetweenresistinandmetabolicdiseaseareconflicting.Furthercomplicatingthematter,humanresistinisproducedmainlybymacrophagesratherthanadipocytes.Toaddressthisimportantissue,wegen-eratedmicethatlackadipocyte-derivedmouseresistinbutproducehumanresistininapatternsimilartothatfoundinhumans,i.e.,inmacrophages(humanizedresistinmice).Whenplacedonahigh-fatdiet,thehumanizedresistinmicerapidlydevelopedacceleratedwhiteadiposetissue(WAT)inflammation,leadingtoincreasedlipolysisandincreasedserumfreefattyacids.Overtime,thesemiceaccumulatedlipids,includingdiacylglycerols,inmuscle.WefoundthatthisresultedinincreasedPkcqpathwayactivity,leadingtoincreasedserinephosphorylationofIrs-1andinsulinresistance.Thus,althoughthesiteofresistinproductiondiffersbetweenspecies,humanresistinexacerbatesWATinflammationandcontributestoinsulinresistance.
IntroductionThe number of obese individuals worldwide has reached 2.1 bil-lion, leading to an explosion of obesity-related health problems associated with increased morbidity and mortality (1, 2). The increase in the prevalence of obesity is strongly correlated with an increase in type II diabetes mellitus (T2DM), which has reached epidemic proportions in the United States (3, 4). A key etiologi-cal factor linking obesity to T2DM is insulin resistance (5, 6). The pathophysiological mechanisms connecting obesity to insulin resistance have received intense investigation in recent years and include ectopic lipid accumulation in liver and muscle, increased circulating serum FFAs, altered production of various adipocyte-derived factors (adipokines), and low-grade inflammation of white adipose tissue (WAT) resulting from chronic activation of the innate immune system (reviewed in ref. 7).
Of the described adipokines, resistin seems to assert its effects on both inflammatory and insulin signaling pathways (reviewed in ref. 8). Resistin, also known as found in inflammatory zone 3 (Fizz3) and adipocyte-specific secretory factor, belongs to a fam-ily of small, cysteine-rich secreted proteins (9–11). In rodents, evi-dence is accumulating that resistin impairs insulin sensitivity. Cir-culating levels of resistin are increased in obesity, and an increase in serum resistin levels has been shown to induce insulin resistance in several rat and mouse models (11–15). These studies suggest that hyperresistinemia causes insulin resistance and predisposes to T2DM. Consistent with the conclusions from gain-of-func-tion studies, loss of resistin signaling improves insulin sensitiv-
ity and glucose homeostasis in several rodent models (11, 16–18). The majority of in vivo studies show that resistin has a negative effect on insulin signaling in the liver, although more recent stud-ies implicate a negative effect of resistin on insulin signaling in adipose as well as muscle tissues (19, 20).
Although animal studies have given us a great deal of under-standing of the major roles that resistin plays in normal glucose homeostasis as well as the pathophysiology of insulin resistance in rodents, the role of resistin in humans is less certain. Some studies have shown significant relationships between resistin levels and obesity, insulin resistance, or T2DM (21–27). However, other stud-ies failed to identify changes in resistin levels in one or more of these conditions (28–30). Intriguingly, recent studies in humans show a very strong and consistent association between resistin and inflammation and/or inflammatory diseases (31–34).
Given the tremendous potential value of translating the mouse data to the human, it is critical to determine whether levels of resistin are increased in human obesity, insulin resis-tance, and/or T2DM and whether hyperresistinemia is a con-tributing factor to these pathophysiological states in humans. However, translating the biology of murine resistin to the human situation is complicated by interspecies differences that exist between the major site of resistin production in rodents (exclusively from adipocyte tissue) and that in humans (mainly macrophages) (11, 30, 35). To test the hypothesis that human resistin produced by monocytes and macrophages contributes to insulin resistance, we generated and characterized what we believe is a novel transgenic mouse model that has macrophage-specific expression of human resistin but lacks murine resistin (“humanized resistin mice”). In the setting of diet-induced obe-sity, insulin resistance and WAT inflammation were worsened in the humanized resistin mice. Thus, macrophage-derived human resistin is capable of exacerbating the pathophysiological consequences of obesity.
Conflictofinterest: The authors have declared that no conflict of interest exists.
Nonstandardabbreviationsused: DAG, diacylglycerol; GIR, glucose-infusion rate; GTT, glucose-tolerance test; HSL, hormone-sensitive lipase; LPL, lipoprotein lipase; MCP-1, monocyte chemotactic protein-1; PDE3b, phosphodiesterase 3b; PTH, para-thyroid hormone; Retn, resistin; ser307, serine 307; SVF, stromal vascular fraction; T2DM, type II diabetes mellitus; WAT, white adipose tissue.
Citationforthisarticle: J. Clin. Invest. 119:531–539 (2009). doi:10.1172/JCI37273.
research article
532 TheJournalofClinicalInvestigation http://www.jci.org Volume 119 Number 3 March 2009
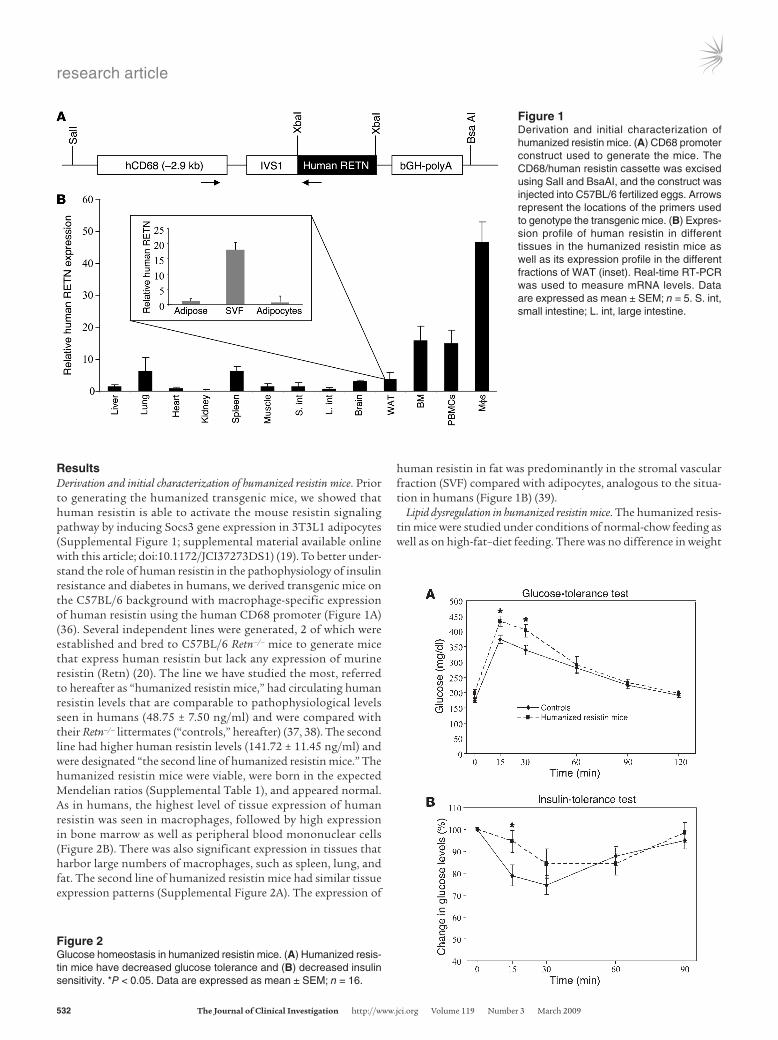
ResultsDerivation and initial characterization of humanized resistin mice. Prior to generating the humanized transgenic mice, we showed that human resistin is able to activate the mouse resistin signaling pathway by inducing Socs3 gene expression in 3T3L1 adipocytes (Supplemental Figure 1; supplemental material available online with this article; doi:10.1172/JCI37273DS1) (19). To better under-stand the role of human resistin in the pathophysiology of insulin resistance and diabetes in humans, we derived transgenic mice on the C57BL/6 background with macrophage-specific expression of human resistin using the human CD68 promoter (Figure 1A) (36). Several independent lines were generated, 2 of which were established and bred to C57BL/6 Retn–/– mice to generate mice that express human resistin but lack any expression of murine resistin (Retn) (20). The line we have studied the most, referred to hereafter as “humanized resistin mice,” had circulating human resistin levels that are comparable to pathophysiological levels seen in humans (48.75 ± 7.50 ng/ml) and were compared with their Retn–/– littermates (“controls,” hereafter) (37, 38). The second line had higher human resistin levels (141.72 ± 11.45 ng/ml) and were designated “the second line of humanized resistin mice.” The humanized resistin mice were viable, were born in the expected Mendelian ratios (Supplemental Table 1), and appeared normal. As in humans, the highest level of tissue expression of human resistin was seen in macrophages, followed by high expression in bone marrow as well as peripheral blood mononuclear cells (Figure 2B). There was also significant expression in tissues that harbor large numbers of macrophages, such as spleen, lung, and fat. The second line of humanized resistin mice had similar tissue expression patterns (Supplemental Figure 2A). The expression of
human resistin in fat was predominantly in the stromal vascular fraction (SVF) compared with adipocytes, analogous to the situa-tion in humans (Figure 1B) (39).
Lipid dysregulation in humanized resistin mice. The humanized resis-tin mice were studied under conditions of normal-chow feeding as well as on high-fat–diet feeding. There was no difference in weight
Figure 1Derivation and initial characterization of humanized resistin mice. (A) CD68 promoter construct used to generate the mice. The CD68/human resistin cassette was excised using SalI and BsaAI, and the construct was injected into C57BL/6 fertilized eggs. Arrows represent the locations of the primers used to genotype the transgenic mice. (B) Expres-sion profile of human resistin in different tissues in the humanized resistin mice as well as its expression profile in the different fractions of WAT (inset). Real-time RT-PCR was used to measure mRNA levels. Data are expressed as mean ± SEM; n = 5. S. int, small intestine; L. int, large intestine.
Figure 2Glucose homeostasis in humanized resistin mice. (A) Humanized resis-tin mice have decreased glucose tolerance and (B) decreased insulin sensitivity. *P < 0.05. Data are expressed as mean ± SEM; n = 16.
research article
TheJournalofClinicalInvestigation http://www.jci.org Volume 119 Number 3 March 2009 533
gain or adiposity between the humanized resistin mice and the controls during the time frame of our experiments (Supplemental Figure 3). In the normal-chow–fed mice, there were also no appre-ciable differences in serum metabolic parameters, including serum triglycerides, FFAs, glycerol, and blood glucose and insulin levels (data not shown). However, with high-fat feeding, serum insulin levels were significantly higher in the humanized resistin mice, while serum glucose levels were higher, but the difference did not reach statistical significance (Table 1). Moreover, the humanized resistin mice had significantly higher serum levels of FFAs and glycerol, suggestive of increased lipolysis in these animals. Similar results were obtained with the second line of humanized resistin mice (Supplemental Figure 2B). The humanized resistin mice also had significantly lower triglycerides compared with the control animals, which may be explained by increased skeletal muscle lipo-protein lipase (Lpl) activity (see below).
Insulin resistance and decreased glucose disposal rate in the human-ized resistin mice. There was no difference in glucose homeostasis between genotypes in the normal-chow–fed mice (Supplemental Figure 4). However, with high-fat feeding, glucose-tolerance test (GTT) revealed that the humanized resistin mice had impaired glucose metabolism compared with mice not expressing human resistin (Figure 2A). These mice also showed a general decrease in insulin sensitivity in the insulin tolerance tests (Figure 2B). The animals also showed higher levels of serum insulin during GTT, which reflects the higher glucose levels in these animals under GTT conditions and is consistent with their prediabetic state (Supplemental Figure 5).
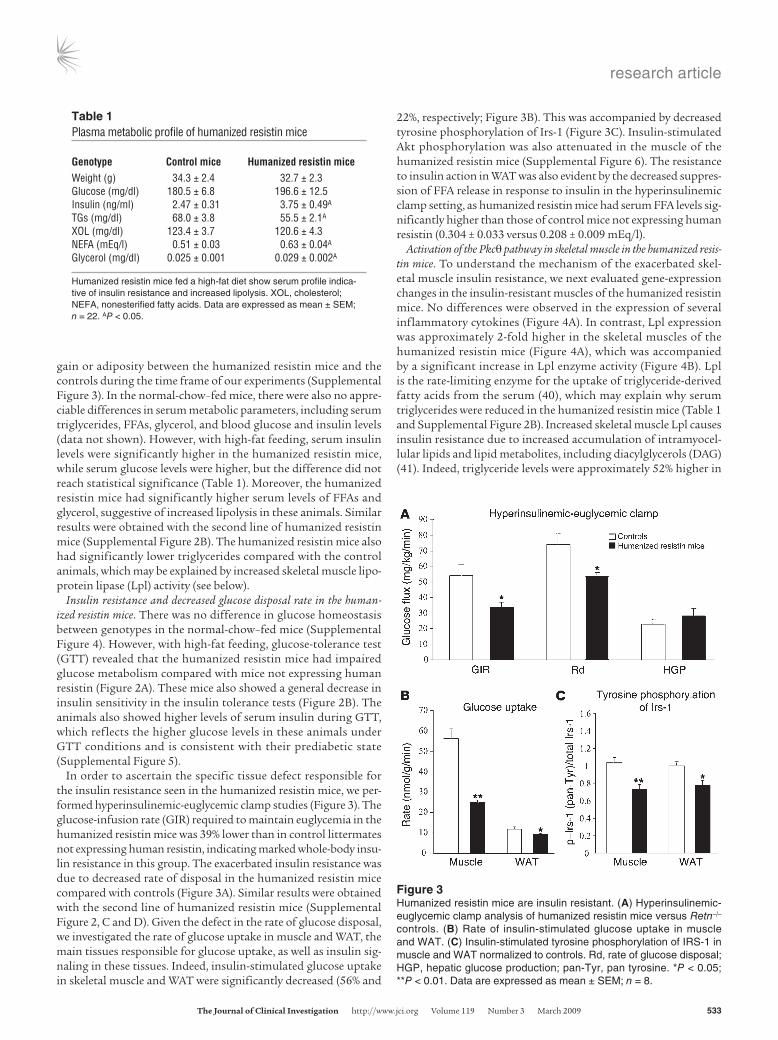
In order to ascertain the specific tissue defect responsible for the insulin resistance seen in the humanized resistin mice, we per-formed hyperinsulinemic-euglycemic clamp studies (Figure 3). The glucose-infusion rate (GIR) required to maintain euglycemia in the humanized resistin mice was 39% lower than in control littermates not expressing human resistin, indicating marked whole-body insu-lin resistance in this group. The exacerbated insulin resistance was due to decreased rate of disposal in the humanized resistin mice compared with controls (Figure 3A). Similar results were obtained with the second line of humanized resistin mice (Supplemental Figure 2, C and D). Given the defect in the rate of glucose disposal, we investigated the rate of glucose uptake in muscle and WAT, the main tissues responsible for glucose uptake, as well as insulin sig-naling in these tissues. Indeed, insulin-stimulated glucose uptake in skeletal muscle and WAT were significantly decreased (56% and
22%, respectively; Figure 3B). This was accompanied by decreased tyrosine phosphorylation of Irs-1 (Figure 3C). Insulin-stimulated Akt phosphorylation was also attenuated in the muscle of the humanized resistin mice (Supplemental Figure 6). The resistance to insulin action in WAT was also evident by the decreased suppres-sion of FFA release in response to insulin in the hyperinsulinemic clamp setting, as humanized resistin mice had serum FFA levels sig-nificantly higher than those of control mice not expressing human resistin (0.304 ± 0.033 versus 0.208 ± 0.009 mEq/l).
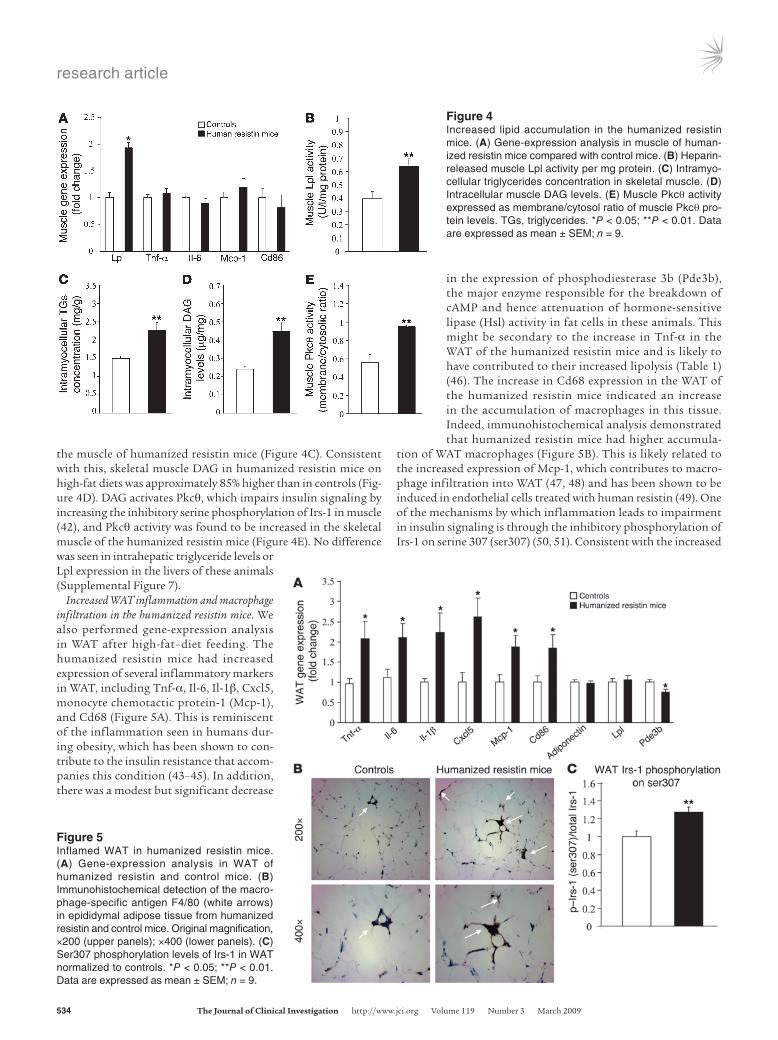
Activation of the Pkcq pathway in skeletal muscle in the humanized resis-tin mice. To understand the mechanism of the exacerbated skel-etal muscle insulin resistance, we next evaluated gene-expression changes in the insulin-resistant muscles of the humanized resistin mice. No differences were observed in the expression of several inflammatory cytokines (Figure 4A). In contrast, Lpl expression was approximately 2-fold higher in the skeletal muscles of the humanized resistin mice (Figure 4A), which was accompanied by a significant increase in Lpl enzyme activity (Figure 4B). Lpl is the rate-limiting enzyme for the uptake of triglyceride-derived fatty acids from the serum (40), which may explain why serum triglycerides were reduced in the humanized resistin mice (Table 1 and Supplemental Figure 2B). Increased skeletal muscle Lpl causes insulin resistance due to increased accumulation of intramyocel-lular lipids and lipid metabolites, including diacylglycerols (DAG) (41). Indeed, triglyceride levels were approximately 52% higher in
Table 1Plasma metabolic profile of humanized resistin mice
Genotype Controlmice HumanizedresistinmiceWeight (g) 34.3 ± 2.4 32.7 ± 2.3Glucose (mg/dl) 180.5 ± 6.8 196.6 ± 12.5Insulin (ng/ml) 2.47 ± 0.31 3.75 ± 0.49A
TGs (mg/dl) 68.0 ± 3.8 55.5 ± 2.1A
XOL (mg/dl) 123.4 ± 3.7 120.6 ± 4.3NEFA (mEq/l) 0.51 ± 0.03 0.63 ± 0.04A
Glycerol (mg/dl) 0.025 ± 0.001 0.029 ± 0.002A
Humanized resistin mice fed a high-fat diet show serum profile indica-tive of insulin resistance and increased lipolysis. XOL, cholesterol; NEFA, nonesterified fatty acids. Data are expressed as mean ± SEM; n = 22. AP < 0.05.
Figure 3Humanized resistin mice are insulin resistant. (A) Hyperinsulinemic-euglycemic clamp analysis of humanized resistin mice versus Retn–/– controls. (B) Rate of insulin-stimulated glucose uptake in muscle and WAT. (C) Insulin-stimulated tyrosine phosphorylation of IRS-1 in muscle and WAT normalized to controls. Rd, rate of glucose disposal; HGP, hepatic glucose production; pan-Tyr, pan tyrosine. *P < 0.05; **P < 0.01. Data are expressed as mean ± SEM; n = 8.
research article
534 TheJournalofClinicalInvestigation http://www.jci.org Volume 119 Number 3 March 2009
the muscle of humanized resistin mice (Figure 4C). Consistent with this, skeletal muscle DAG in humanized resistin mice on high-fat diets was approximately 85% higher than in controls (Fig-ure 4D). DAG activates Pkcq, which impairs insulin signaling by increasing the inhibitory serine phosphorylation of Irs-1 in muscle (42), and Pkcq activity was found to be increased in the skeletal muscle of the humanized resistin mice (Figure 4E). No difference was seen in intrahepatic triglyceride levels or Lpl expression in the livers of these animals (Supplemental Figure 7).
Increased WAT inflammation and macrophage infiltration in the humanized resistin mice. We also performed gene-expression analysis in WAT after high-fat–diet feeding. The humanized resistin mice had increased expression of several inflammatory markers in WAT, including Tnf-α, Il-6, Il-1β, Cxcl5, monocyte chemotactic protein-1 (Mcp-1), and Cd68 (Figure 5A). This is reminiscent of the inflammation seen in humans dur-ing obesity, which has been shown to con-tribute to the insulin resistance that accom-panies this condition (43–45). In addition, there was a modest but significant decrease
in the expression of phosphodiesterase 3b (Pde3b), the major enzyme responsible for the breakdown of cAMP and hence attenuation of hormone-sensitive lipase (Hsl) activity in fat cells in these animals. This might be secondary to the increase in Tnf-α in the WAT of the humanized resistin mice and is likely to have contributed to their increased lipolysis (Table 1) (46). The increase in Cd68 expression in the WAT of the humanized resistin mice indicated an increase in the accumulation of macrophages in this tissue. Indeed, immunohistochemical analysis demonstrated that humanized resistin mice had higher accumula-
tion of WAT macrophages (Figure 5B). This is likely related to the increased expression of Mcp-1, which contributes to macro-phage infiltration into WAT (47, 48) and has been shown to be induced in endothelial cells treated with human resistin (49). One of the mechanisms by which inflammation leads to impairment in insulin signaling is through the inhibitory phosphorylation of Irs-1 on serine 307 (ser307) (50, 51). Consistent with the increased
Figure 4Increased lipid accumulation in the humanized resistin mice. (A) Gene-expression analysis in muscle of human-ized resistin mice compared with control mice. (B) Heparin-released muscle Lpl activity per mg protein. (C) Intramyo-cellular triglycerides concentration in skeletal muscle. (D) Intracellular muscle DAG levels. (E) Muscle Pkcq activity expressed as membrane/cytosol ratio of muscle Pkcq pro-tein levels. TGs, triglycerides. *P < 0.05; **P < 0.01. Data are expressed as mean ± SEM; n = 9.
Figure 5Inflamed WAT in humanized resistin mice. (A) Gene-expression analysis in WAT of humanized resistin and control mice. (B) Immunohistochemical detection of the macro-phage-specific antigen F4/80 (white arrows) in epididymal adipose tissue from humanized resistin and control mice. Original magnification, ×200 (upper panels); ×400 (lower panels). (C) Ser307 phosphorylation levels of Irs-1 in WAT normalized to controls. *P < 0.05; **P < 0.01. Data are expressed as mean ± SEM; n = 9.
research article
TheJournalofClinicalInvestigation http://www.jci.org Volume 119 Number 3 March 2009 535
inflammation, ser307 phosphorylation of Irs-1 was increased in the WAT of humanized resistin mice (Figure 5C).
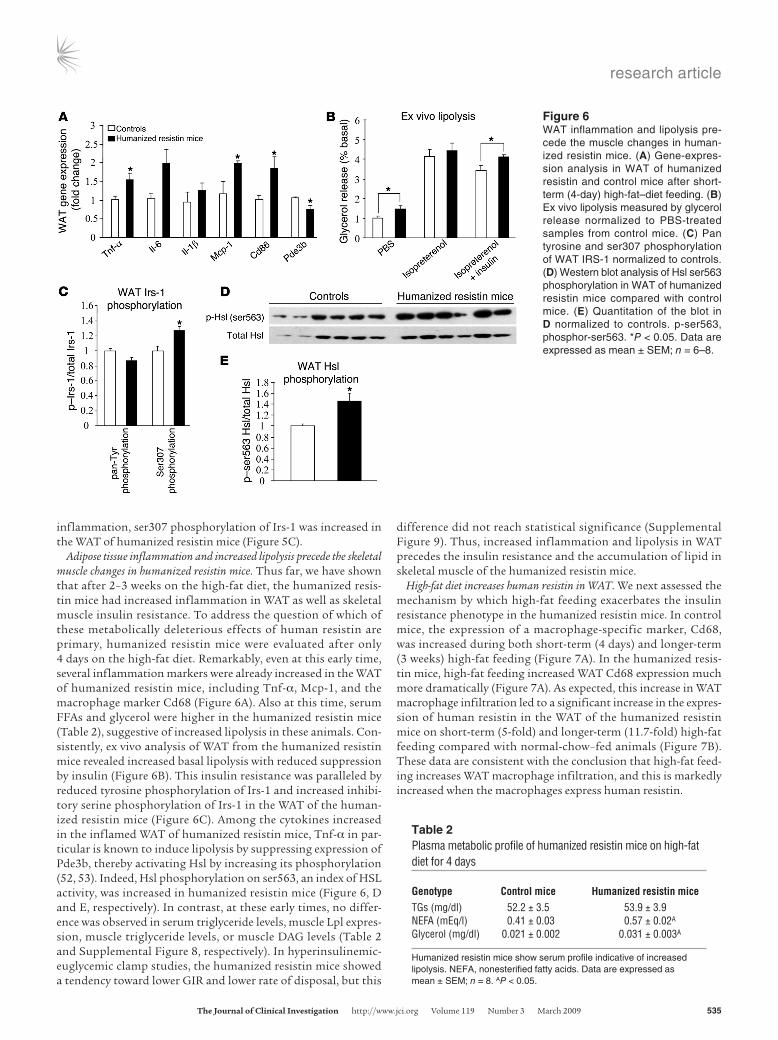
Adipose tissue inflammation and increased lipolysis precede the skeletal muscle changes in humanized resistin mice. Thus far, we have shown that after 2–3 weeks on the high-fat diet, the humanized resis-tin mice had increased inflammation in WAT as well as skeletal muscle insulin resistance. To address the question of which of these metabolically deleterious effects of human resistin are primary, humanized resistin mice were evaluated after only 4 days on the high-fat diet. Remarkably, even at this early time, several inflammation markers were already increased in the WAT of humanized resistin mice, including Tnf-α, Mcp-1, and the macrophage marker Cd68 (Figure 6A). Also at this time, serum FFAs and glycerol were higher in the humanized resistin mice (Table 2), suggestive of increased lipolysis in these animals. Con-sistently, ex vivo analysis of WAT from the humanized resistin mice revealed increased basal lipolysis with reduced suppression by insulin (Figure 6B). This insulin resistance was paralleled by reduced tyrosine phosphorylation of Irs-1 and increased inhibi-tory serine phosphorylation of Irs-1 in the WAT of the human-ized resistin mice (Figure 6C). Among the cytokines increased in the inflamed WAT of humanized resistin mice, Tnf-α in par-ticular is known to induce lipolysis by suppressing expression of Pde3b, thereby activating Hsl by increasing its phosphorylation (52, 53). Indeed, Hsl phosphorylation on ser563, an index of HSL activity, was increased in humanized resistin mice (Figure 6, D and E, respectively). In contrast, at these early times, no differ-ence was observed in serum triglyceride levels, muscle Lpl expres-sion, muscle triglyceride levels, or muscle DAG levels (Table 2 and Supplemental Figure 8, respectively). In hyperinsulinemic-euglycemic clamp studies, the humanized resistin mice showed a tendency toward lower GIR and lower rate of disposal, but this
difference did not reach statistical significance (Supplemental Figure 9). Thus, increased inflammation and lipolysis in WAT precedes the insulin resistance and the accumulation of lipid in skeletal muscle of the humanized resistin mice.
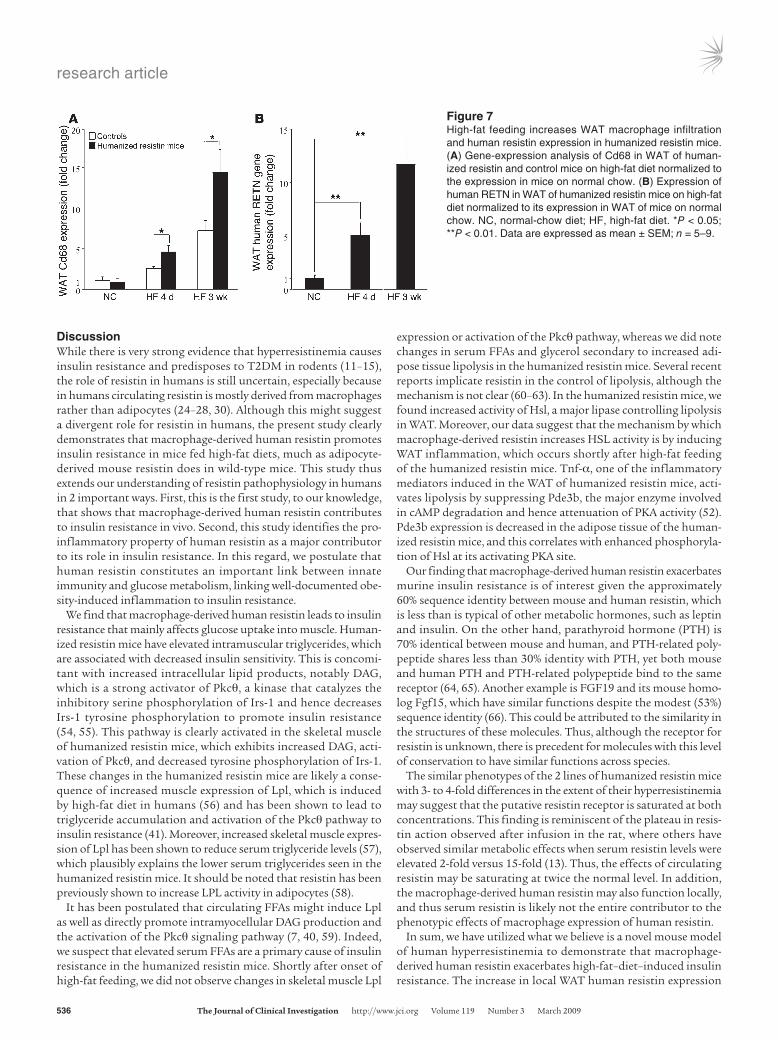
High-fat diet increases human resistin in WAT. We next assessed the mechanism by which high-fat feeding exacerbates the insulin resistance phenotype in the humanized resistin mice. In control mice, the expression of a macrophage-specific marker, Cd68, was increased during both short-term (4 days) and longer-term (3 weeks) high-fat feeding (Figure 7A). In the humanized resis-tin mice, high-fat feeding increased WAT Cd68 expression much more dramatically (Figure 7A). As expected, this increase in WAT macrophage infiltration led to a significant increase in the expres-sion of human resistin in the WAT of the humanized resistin mice on short-term (5-fold) and longer-term (11.7-fold) high-fat feeding compared with normal-chow–fed animals (Figure 7B). These data are consistent with the conclusion that high-fat feed-ing increases WAT macrophage infiltration, and this is markedly increased when the macrophages express human resistin.
Table 2Plasma metabolic profile of humanized resistin mice on high-fat diet for 4 days
Genotype Controlmice HumanizedresistinmiceTGs (mg/dl) 52.2 ± 3.5 53.9 ± 3.9NEFA (mEq/l) 0.41 ± 0.03 0.57 ± 0.02A
Glycerol (mg/dl) 0.021 ± 0.002 0.031 ± 0.003A
Humanized resistin mice show serum profile indicative of increased lipolysis. NEFA, nonesterified fatty acids. Data are expressed as mean ± SEM; n = 8. AP < 0.05.
Figure 6WAT inflammation and lipolysis pre-cede the muscle changes in human-ized resistin mice. (A) Gene-expres-sion analysis in WAT of humanized resistin and control mice after short-term (4-day) high-fat–diet feeding. (B) Ex vivo lipolysis measured by glycerol release normalized to PBS-treated samples from control mice. (C) Pan tyrosine and ser307 phosphorylation of WAT IRS-1 normalized to controls. (D) Western blot analysis of Hsl ser563 phosphorylation in WAT of humanized resistin mice compared with control mice. (E) Quantitation of the blot in D normalized to controls. p-ser563, phosphor-ser563. *P < 0.05. Data are expressed as mean ± SEM; n = 6–8.
research article
536 TheJournalofClinicalInvestigation http://www.jci.org Volume 119 Number 3 March 2009
DiscussionWhile there is very strong evidence that hyperresistinemia causes insulin resistance and predisposes to T2DM in rodents (11–15), the role of resistin in humans is still uncertain, especially because in humans circulating resistin is mostly derived from macrophages rather than adipocytes (24–28, 30). Although this might suggest a divergent role for resistin in humans, the present study clearly demonstrates that macrophage-derived human resistin promotes insulin resistance in mice fed high-fat diets, much as adipocyte-derived mouse resistin does in wild-type mice. This study thus extends our understanding of resistin pathophysiology in humans in 2 important ways. First, this is the first study, to our knowledge, that shows that macrophage-derived human resistin contributes to insulin resistance in vivo. Second, this study identifies the pro-inflammatory property of human resistin as a major contributor to its role in insulin resistance. In this regard, we postulate that human resistin constitutes an important link between innate immunity and glucose metabolism, linking well-documented obe-sity-induced inflammation to insulin resistance.
We find that macrophage-derived human resistin leads to insulin resistance that mainly affects glucose uptake into muscle. Human-ized resistin mice have elevated intramuscular triglycerides, which are associated with decreased insulin sensitivity. This is concomi-tant with increased intracellular lipid products, notably DAG, which is a strong activator of Pkcq, a kinase that catalyzes the inhibitory serine phosphorylation of Irs-1 and hence decreases Irs-1 tyrosine phosphorylation to promote insulin resistance (54, 55). This pathway is clearly activated in the skeletal muscle of humanized resistin mice, which exhibits increased DAG, acti-vation of Pkcq, and decreased tyrosine phosphorylation of Irs-1. These changes in the humanized resistin mice are likely a conse-quence of increased muscle expression of Lpl, which is induced by high-fat diet in humans (56) and has been shown to lead to triglyceride accumulation and activation of the Pkcq pathway to insulin resistance (41). Moreover, increased skeletal muscle expres-sion of Lpl has been shown to reduce serum triglyceride levels (57), which plausibly explains the lower serum triglycerides seen in the humanized resistin mice. It should be noted that resistin has been previously shown to increase LPL activity in adipocytes (58).
It has been postulated that circulating FFAs might induce Lpl as well as directly promote intramyocellular DAG production and the activation of the Pkcq signaling pathway (7, 40, 59). Indeed, we suspect that elevated serum FFAs are a primary cause of insulin resistance in the humanized resistin mice. Shortly after onset of high-fat feeding, we did not observe changes in skeletal muscle Lpl
expression or activation of the Pkcq pathway, whereas we did note changes in serum FFAs and glycerol secondary to increased adi-pose tissue lipolysis in the humanized resistin mice. Several recent reports implicate resistin in the control of lipolysis, although the mechanism is not clear (60–63). In the humanized resistin mice, we found increased activity of Hsl, a major lipase controlling lipolysis in WAT. Moreover, our data suggest that the mechanism by which macrophage-derived resistin increases HSL activity is by inducing WAT inflammation, which occurs shortly after high-fat feeding of the humanized resistin mice. Tnf-α, one of the inflammatory mediators induced in the WAT of humanized resistin mice, acti-vates lipolysis by suppressing Pde3b, the major enzyme involved in cAMP degradation and hence attenuation of PKA activity (52). Pde3b expression is decreased in the adipose tissue of the human-ized resistin mice, and this correlates with enhanced phosphoryla-tion of Hsl at its activating PKA site.
Our finding that macrophage-derived human resistin exacerbates murine insulin resistance is of interest given the approximately 60% sequence identity between mouse and human resistin, which is less than is typical of other metabolic hormones, such as leptin and insulin. On the other hand, parathyroid hormone (PTH) is 70% identical between mouse and human, and PTH-related poly-peptide shares less than 30% identity with PTH, yet both mouse and human PTH and PTH-related polypeptide bind to the same receptor (64, 65). Another example is FGF19 and its mouse homo-log Fgf15, which have similar functions despite the modest (53%) sequence identity (66). This could be attributed to the similarity in the structures of these molecules. Thus, although the receptor for resistin is unknown, there is precedent for molecules with this level of conservation to have similar functions across species.
The similar phenotypes of the 2 lines of humanized resistin mice with 3- to 4-fold differences in the extent of their hyperresistinemia may suggest that the putative resistin receptor is saturated at both concentrations. This finding is reminiscent of the plateau in resis-tin action observed after infusion in the rat, where others have observed similar metabolic effects when serum resistin levels were elevated 2-fold versus 15-fold (13). Thus, the effects of circulating resistin may be saturating at twice the normal level. In addition, the macrophage-derived human resistin may also function locally, and thus serum resistin is likely not the entire contributor to the phenotypic effects of macrophage expression of human resistin.
In sum, we have utilized what we believe is a novel mouse model of human hyperresistinemia to demonstrate that macrophage-derived human resistin exacerbates high-fat–diet–induced insulin resistance. The increase in local WAT human resistin expression
Figure 7High-fat feeding increases WAT macrophage infiltration and human resistin expression in humanized resistin mice. (A) Gene-expression analysis of Cd68 in WAT of human-ized resistin and control mice on high-fat diet normalized to the expression in mice on normal chow. (B) Expression of human RETN in WAT of humanized resistin mice on high-fat diet normalized to its expression in WAT of mice on normal chow. NC, normal-chow diet; HF, high-fat diet. *P < 0.05; **P < 0.01. Data are expressed as mean ± SEM; n = 5–9.
research article
TheJournalofClinicalInvestigation http://www.jci.org Volume 119 Number 3 March 2009 537
created by high-fat diet is the major driver of this phenotype. Although the insulin resistance is highly manifested in skeletal muscle, the primary effect of macrophage production of human resistin is inflammation of WAT that is reminiscent of the inflam-mation seen in human obesity. The macrophage infiltration trig-gered by high-fat feeding is augmented by a resistin-dependent increase in the chemoattractant Mcp-1, leading to increased inflammation as well as lipolysis which, through increased FFAs, leads to muscle lipid accumulation, activation of the Pkcq path-way, and insulin resistance. The effect of macrophage-derived human resistin in promoting and maintaining an inflammatory environment is thus likely to be a factor contributing to metabolic syndrome in humans with increased adiposity. The humanized resistin mice represent a unique model for understanding the pathophysiology associated with increased macrophage-derived human resistin and developing therapies to counter its effects and ameliorate insulin resistance and diabetes.
MethodsDerivation and treatment of mice. For the derivation of mice that overexpress human resistin in monocyte/macrophage lineage, the coding region of human resistin was obtained by PCR from pZac2.1 human resistin vec-tor, which contains the human resistin cDNA (11). The human resistin cDNA was then subcloned into the pCD68–hSR-A construct after excision of the hSR-A cDNA (a generous gift from David Greaves, Sir William Dunn School of Pathology) (36). The fusion construct containing human resis-tin, 2.9 kb hCD68 promoter, IVS1, and bGH polyadenylation signal was excised using SalI and BsaAI and then injected into the pronucleus of fertil-ized C57BL/6 mouse eggs (Transgenic and Chimeric Mouse Facility, Uni-versity of Pennsylvania). Transgenic founder mice (designated CD68hR) were identified by PCR of tail DNA with the forward primer covering the 3′ end of the 2.9-kb hCD68 region (5′-CTGGGTTGCTAACCATCTCC-3′) and the reverse primer covering the 5′-end of the human resistin cDNA (5′-CAGGCCAATGCTGCTTATTG-3′). Positive mice were then propagat-ed by mating to Retn–/– mice (16). The progeny (Retn+/–CD68hR) were then crossed back to the Retn–/– mice to produce the humanized resistin mice that express human resistin without expressing murine resistin (Retn–/–
CD68hR). Retn–/– littermates were used as controls in this study. Animals used in all experiments were age-matched (9- to 10-week-old) male mice housed in groups of 4 or 5 in plastic microisolator cages at 22°C with 12-hour light/12-hour dark cycle and had free access to food and water. Unless otherwise stated, all animals were put on a high-fat diet (60% fat diet, D12492; Research Diets Inc.) for 2–3 weeks. All protocols for animal use and euthanasia were approved by the Animal Care Committee at the University of Pennsylvania and were in accordance with NIH guidelines.
RNA preparation and quantitative PCR analysis. Mice were killed and their tis-sues isolated and immediately placed in liquid nitrogen for later use. Total RNA from tissues was isolated using RNeasy kit (QIAGEN) according to the manufacturer’s instructions. RNA integrity was determined with UV spectrophotometry. Reverse transcription was performed using the High Capacity cDNA Reverse Transcription Kit (Applied Biosystems) according to the manufacturer’s instructions. This cDNA served as the template for real-time (TaqMan) quantitative PCR, using the ABI Prism 7900 sequence detection system (Applied Biosystems). The housekeeping gene 36B4 was used to normalize results to starting amounts of cDNA. All primer/probe sets were purchased as assay-on-demand sets (Applied Biosystems). All reac-tions were performed using TaqMan Universal PCR Master Mix (Applied Biosystems) and were evaluated using the standard curve method.
Serum metabolic profile analysis. All serum measurements were done on mice after an overnight fast unless otherwise indicated. Glucose levels were deter-
mined using a standard glucometer (LifeScan). Serum nonesterified fatty acids were determined using the NEFA Determination Kit (Wako Diag-nostics). Serum triglycerides and glycerol were measured with the Serum Triglyceride and Glycerol Determination Kit (Sigma-Aldrich). Serum adi-pokines were determined using Mouse Serum Adipokine LINCOplex Kit (Millipore). Nonfasted insulin levels were analyzed using an insulin ELISA kit (Crystal Chem Inc.).
GTT and insulin-tolerance test. GTT was performed after an overnight (16-hour) fast. Blood glucose concentrations were measured before and 15, 30, 45, 60, 90, and 120 minutes after an i.p. injection of dextrose dissolved in PBS (1 g/kg). Ultra Sensitive Mouse Insulin ELISA Kit (Crystal Chem Inc.) was used to measure insulin levels during the GTT. Insulin-tolerance testing was carried out in animals that were fasted for 6 hours, beginning at approximately 9 am. After an i.p. bolus injection of recombinant human regular insulin (0.75 U/kg; Lilly), blood glucose concentrations were mea-sured at 15-minute intervals as described above.
Hyperinsulinemic-euglycemic clamp. Hyperinsulinemic-euglycemic clamp analysis was performed as described previously (11), with minor modifi-cations. In brief, 4–5 days before the clamp, mice were anesthetized with sodium pentobarbital (80–100 mg/kg i.p.), and a catheter was inserted into the right internal jugular vein for infusion. After recovery, the mice were fasted for 4 hours, placed in restrainers, and administered a bolus injection of 5 μCi of [3-3H] glucose followed by continuous i.v. infusion at 0.05 μCi/min. Baseline glucose kinetics was measured for 60 minutes followed by hyperinsulinemic clamp for 120 minutes. A priming dose of regular insulin (16 mU/kg; Lilly) was given i.v. followed by continuous infusion at 2.5 mU/kg/min, which resulted in insulin levels of 8.9 ± 1.6 and 9.3 ± 3.0 ng/ml for the controls and the humanized resistin mice, respectively. Blood glucose was maintained at 120–140 mg/dl via a variable GIR of 20%. The actual blood glucose levels were 135.8 ± 4.3 and 134.3 ± 2.9 mg/dl for the controls and the humanized resistin mice, respectively. Ten μCi 2-deoxy-D-[1-14C] glucose was injected 45 minutes before the end of the clamp, and blood samples were collected to estimate glucose uptake. The mice were euthanized, and liver, perigonadal WAT, and soleus muscle were excised, frozen immediately in liquid nitrogen, and stored at –80°C for subsequent analysis of glucose uptake and other analysis.
Phosphorylation of Irs-1. Muscle and WAT tissue were homogenized with T-PER Tissue Protein Extraction Reagent in the presence of protease and phosphatase inhibitors (Pierce Protein Research Products; Thermo Sci-entific). Total IRS-1, phospho–IRS-1 (ser307), and phospho–IRS-1 pan tyrosine (pan-Tyr) were determined using PathScan Sandwich ELISA Kit according to manufacturer’s instructions (Cell Signaling Technology).
Immunohistochemistry. Adipose tissue samples were fixed for 12–16 hours at room temperature in formalin fixative (Sigma-Aldrich) and embedded in paraffin. Five-micrometer sections cut at 50-mm intervals were mounted on charged glass slides, deparaffinized in xylene, and stained for expression of F4/80 as described elsewhere (43). A rat anti-mouse monoclonal anti-body was used to detect the F4/80 antigen (Invitrogen).
Akt and HSL phosphorylation and measurement of Pkcq activity. Pkcq mem-brane translocation assays were performed according to methods previ-ously described (67). In brief, 50 μg of crude membrane and cytosol muscle protein extracts were resolved by SDS-PAGE using an 8% gel and electro-transferred onto PVDF (Millipore). The membrane was then blocked for 2 hours at room temperature in PBS–Tween-20 (10 mM NaH2PO4, 80 mM Na2HPO4, 0.145 mM NaCl, and 0.1% Tween 20, pH 7.4) containing 5% (w/v) nonfat dried milk, washed twice, and then incubated overnight with rabbit anti-peptide antibody against Pkcq (Santa Cruz Biotechnology Inc.) diluted 1:100 in rinsing solution. After further washings, membranes were incubated with horseradish peroxidase–conjugated IgG fraction of goat anti-rabbit IgG (Amersham) diluted 1:5,000 in PBS–Tween-20 for 2 hours. Pkcq was visual-
research article
538 TheJournalofClinicalInvestigation http://www.jci.org Volume 119 Number 3 March 2009
ized on KODAK BioMax MR Film using the ECL+ Chemiluminescence Kit (GE Healthcare). The film was then scanned (Canon), and bands were quan-tified using Adobe Photoshop Creative Suite software, version 2.0. Mem-brane translocation of Pkcq was expressed as the ratio of membrane bands to cytosol bands (arbitrary units). For Hsl phosphorylation, WAT protein extracts (5 μg) were resolved on SDS-PAGE using a 14% gel and electrotrans-ferred onto PVDF as mentioned above. Phospho-Hsl antibody was diluted 1:1000 and incubated overnight (Cell Signaling Technology). Phospho-Hsl and total Hsl were visualized and quantified as mentioned above. Western blotting was also used to measure muscle Akt phosphorylation using phos-pho-specific and total Akt antibodies (Cell Signaling Technology).
Tissue triglycerides and DAG levels. To extract lipid from muscle, 100 mg of muscle tissue was homogenized in chloroform/methanol (2:1), and the resulting homogenate was centrifuged. The lower phase containing the lipid was dried down completely under a stream of N2 and resuspended uniformly in PBS/Triton X-100 solution. Muscle triglycerides levels were determined as described for the serum samples. For DAG levels, samples of 100 mg of muscle tissue were submitted to the Mouse Metabolic Phenotyping Center at Vanderbilt University Medical Center (Nashville, Tennessee, USA).
Ex vivo lipolysis. Epididymal fat pads were isolated from mice and weighed. Each pad was cut into 3 equal pieces and incubated in Krebs-Ringer Bicar-bonate Buffer containing 1% fatty acid–free BSA (Sigma-Aldrich). The samples were treated with either PBS or isoproterenol (1 μM) or pretreated with insulin (10 μM) for 10 minutes before isoproterenol treatment. Sam-ples were incubated at 37°C with mild shaking at 150 g. After 120 min-utes, glycerol release was measured using Glycerol Determination Kit; fat pads were homogenized in PBS, and total triglycerides in each sample were assayed using the Triglyceride Determination Kit (Sigma-Aldrich). Glycerol levels were then normalized to total triglyceride levels in each sample.
Muscle Lpl activity. Muscle tissue (50 mg) was isolated and incubated in ice-cold DMEM with 2% BSA and 2 units/ml heparin (Sigma-Aldrich). The tissue was then homogenized and incubated at 37°C for 1 hour. Samples were then centrifuged at 13,000 g for 10 minutes, and Lpl activity in the supernatant was analyzed using QuantiChrom Lipase Assay Kit (BioAssay Systems). Lipase activity was normalized to total protein in each sample.
Isolation of the SVF and adipocyte fraction of adipose tissue. Mouse epididymal fat pads were minced and digested for 60 minutes at 37°C with collagenase II
(1 mg/ml) (Sigma-Aldrich) in PBS. After filtration of the digested tissue through nylon mesh (100 μm), the filtrate was centrifuged at 200 g for 5 minutes. The SVF and adipocyte fraction were obtained from the result-ing pellet and supernatant, respectively. RNA isolation and quantitative PCR were performed as described earlier.
Nuclear MRI. Nuclear MRI analysis was done at the Mouse Phenotyp-ing, Physiology and Metabolism Core, University of Pennsylvania School of Medicine, as described elsewhere (11).
Statistics. Values are reported as mean ± SEM. Pairwise comparisons of quantitative phenotypes between mice of different genotypes were assessed by 2-tailed Student’s t test assuming unequal variance. Values of P < 0.05 were accepted as statistically significant.
AcknowledgmentsWe thank C. Steppan and J. Wang for help with the initial Socs3 studies and K. Kaestner for critically reading the manuscript. We are grateful to the Penn Diabetes and Endocrinology Research Center (NIH P30 DK19525) for providing outstanding core ser-vices, and we particularly thank J. Richa of the Transgenic and Chimeric Mouse Core, H. Collins of the Radioimmunoassay/Bio-markers Core, and R. Dhir of the Mouse Phenotyping, Physiology and Metabolism Core (also supported by NIDDK P01 DK49210) for their technical help. We also thank the Mouse Metabolic Phe-notyping Center at Vanderbilt University Medical Center (NIH P30 DK59637) for the DAG assays. This work was supported by the National Institute of Diabetes and Digestive and Kidney Dis-eases (NIDDK P01 DK49210 to M.A. Lazar). M. Qatanani was supported by an ADA-Takeda Mentor-Based Research Fellowship. D.R. Greaves is supported by the British Heart Foundation.
Received for publication August 26, 2008, and accepted in revised form December 8, 2008.
Address correspondence to: Mitchell A. Lazar, University of Penn-sylvania School of Medicine, 700 CRB, 415 Curie Blvd., Philadel-phia, Pennsylvania 19104-6149, USA. Phone: (215) 898-0198; Fax: (215) 898-5408; E-mail: [email protected].
1. Li, Z., Bowerman, S., and Heber, D. 2005. Health ramifications of the obesity epidemic. Surg. Clin. North Am. 85:681–701.
2. Olshansky, S.J. 2005. Projecting the future of U.S. health and longevity. Health Aff. (Millwood). 24(Suppl. 2):W5R86–W5R89.
3. American Diabetes Association. 2007. Total preva-lence of diabetes and pre-diabetes. http://www. diabetes.org/diabetes-statistics/prevalence.jsp.
4. Zimmet, P., Alberti, K.G., and Shaw, J. 2001. Global and societal implications of the diabetes epidemic. Nature. 414:782–787.
5. Kahn, B.B., and Flier, J.S. 2000. Obesity and insulin resistance. J. Clin. Invest. 106:473–481.
6. Flier, J.S. 2004. Obesity wars: molecular progress con-fronts an expanding epidemic. Cell. 116:337–350.
7. Qatanani, M., and Lazar, M.A. 2007. Mechanisms of obesity-associated insulin resistance: many choices on the menu. Genes Dev. 21:1443–1455.
8. Lazar, M.A. 2007. Resistin- and obesity-associated metabolic diseases. Horm. Metab. Res. 39:710–716.
9. Holcomb, I.N., et al. 2000. FIZZ1, a novel cysteine-rich secreted protein associated with pulmonary inflammation, defines a new gene family. EMBO J. 19:4046–4055.
10. Kim, K.H., Lee, K., Moon, Y.S., and Sul, H.S. 2001. A cysteine-rich adipose tissue-specific secretory fac-tor inhibits adipocyte differentiation. J. Biol. Chem. 276:11252–11256.
11. Steppan, C.M., et al. 2001. The hormone resistin links obesity to diabetes. Nature. 409:307–312.
12. Rajala, M.W., et al. 2004. Regulation of resistin expression and circulating levels in obesity, diabe-tes, and fasting. Diabetes. 53:1671–1679.
13. Rajala, M.W., Obici, S., Scherer, P.E., and Rossetti, L. 2003. Adipose-derived resistin and gut-derived resistin-like molecule-beta selectively impair insu-lin action on glucose production. J. Clin. Invest. 111:225–230.
14. Satoh, H., et al. 2004. Adenovirus-mediated chronic “hyper-resistinemia” leads to in vivo insulin resis-tance in normal rats. J. Clin. Invest. 114:224–231.
15. Rangwala, S.M., et al. 2004. Abnormal glucose homeostasis due to chronic hyperresistinemia. Dia-betes. 53:1937–1941.
16. Banerjee, R.R., et al. 2004. Regulation of fasted blood glucose by resistin. Science. 303:1195–1198.
17. Muse, E.D., et al. 2004. Role of resistin in diet-induced hepatic insulin resistance. J. Clin. Invest. 114:232–239.
18. Kim, K.H., Zhao, L., Moon, Y., Kang, C., and Sul, H.S. 2004. Dominant inhibitory adipocyte-specific secretory factor (ADSF)/resistin enhances adipo-genesis and improves insulin sensitivity. Proc. Natl. Acad. Sci. U. S. A. 101:6780–6785.
19. Steppan, C.M., Wang, J., Whiteman, E.L., Birn-baum, M.J., and Lazar, M.A. 2005. Activation of SOCS-3 by resistin. Mol. Cell. Biol. 25:1569–1575.
20. Qi, Y., et al. 2006. Loss of resistin improves glu-cose homeostasis in leptin deficiency. Diabetes. 55:3083–3090.
21. McTernan, C.L., et al. 2002. Resistin, central obe-sity, and type 2 diabetes. Lancet. 359:46–47.
22. McTernan, P.G., et al. 2002. Increased resistin gene and protein expression in human abdominal adi-pose tissue. J. Clin. Endocrinol. Metab. 87:2407.
23. Vidal-Puig, A., and O’Rahilly, S. 2001. Resistin: a new link between obesity and insulin resistance? Clin. Endocrinol. (Oxf.) 55:437–438.
24. Wang, H., Chu, W.S., Hemphill, C., and Elbein, S.C. 2002. Human resistin gene: molecular scanning and evaluation of association with insulin sensitiv-ity and type 2 diabetes in Caucasians. J. Clin. Endo-crinol. Metab. 87:2520–2524.
25. Smith, S.R., Bai, F., Charbonneau, C., Janderova, L., and Argyropoulos, G. 2003. A promoter geno-type and oxidative stress potentially link resistin to human insulin resistance. Diabetes. 52:1611–1618.
26. Osawa, H., et al. 2005. Resistin SNP-420 deter-mines its monocyte mRNA and serum levels induc-ing type 2 diabetes. Biochem. Biophys. Res. Commun. 335:596–602.
27. Osawa, H., et al. 2004. The G/G genotype of a resistin single-nucleotide polymorphism at -420 increases type 2 diabetes mellitus susceptibility by inducing promoter activity through specific bind-ing of Sp1/3. Am. J. Hum. Genet. 75:678–686.
research article
TheJournalofClinicalInvestigation http://www.jci.org Volume 119 Number 3 March 2009 539
28. Janke, J., Engeli, S., Gorzelniak, K., Luft, F.C., and Sharma, A.M. 2002. Resistin gene expression in human adipocytes is not related to insulin resis-tance. Obes. Res. 10:1–5.
29. Kielstein, J.T., Becker, B., Graf, S., Brabant, G., Haller, H., and Fliser, D. 2003. Increased resistin blood levels are not associated with insulin resis-tance in patients with renal disease. Am. J. Kidney Dis. 42:62–66.
30. Patel, L., et al. 2003. Resistin is expressed in human macrophages and directly regulated by PPAR gamma activators. Biochem. Biophys. Res. Commun. 300:472–476.
31. Lehrke, M., et al. 2004. An inflammatory cascade lead-ing to hyperresistinemia in humans. PLoS Med. 1:e45.
32. Pang, S.S., and Le, Y.Y. 2006. Role of resistin in inflammation and inflammation-related diseases. Cell. Mol. Immunol. 3:29–34.
33. Reilly, M.P., et al. 2005. Resistin is an inflammatory marker of atherosclerosis in humans. Circulation. 111:932–939.
34. Senolt, L., et al. 2007. Resistin in rheumatoid arthritis synovial tissue, synovial fluid and serum. Ann. Rheum. Dis. 66:458–463.
35. Savage, D.B., et al. 2001. Resistin / Fizz3 expression in relation to obesity and peroxisome proliferator-activated receptor-gamma action in humans. Diabe-tes. 50:2199–2202.
36. Gough, P.J., Gordon, S., and Greaves, D.R. 2001. The use of human CD68 transcriptional regulatory sequences to direct high-level expression of class A scavenger receptor in macrophages in vitro and in vivo. Immunology. 103:351–361.
37. Axelsson, J., et al. 2006. Elevated resistin levels in chronic kidney disease are associated with decreased glomerular filtration rate and inflam-mation, but not with insulin resistance. Kidney Int. 69:596–604.
38. Piestrzeniewicz, K., et al. 2008. Resistin increases with obesity and atherosclerotic risk factors in patients with myocardial infarction. Metabolism. 57:488–493.
39. Fain, J.N. 2006. Release of interleukins and other inflammatory cytokines by human adipose tissue is enhanced in obesity and primarily due to the nonfat cells. Vitam. Horm. 74:443–477.
40. Zechner, R., et al. 2000. The role of lipoprotein lipase in adipose tissue development and metabolism. Int. J. Obes. Relat. Metab. Disord. 24(Suppl. 4):S53–S56.
41. Kim, J.K., et al. 2001. Tissue-specific overexpression of lipoprotein lipase causes tissue-specific insulin resistance. Proc. Natl. Acad. Sci. U. S. A. 98:7522–7527.
42. Petersen, K.F., and Shulman, G.I. 2006. Etiology of insulin resistance. Am. J. Med. 119:S10–S16.
43. Weisberg, S.P., et al. 2006. CCR2 modulates inflam-matory and metabolic effects of high-fat feeding. J. Clin. Invest. 116:115–124.
44. Weisberg, S.P., et al. 2003. Obesity is associated with macrophage accumulation in adipose tissue. J. Clin. Invest. 112:1796–1808.
45. Xu, H., et al. 2003. Chronic inflammation in fat plays a crucial role in the development of obesity-related insulin resistance. J. Clin. Invest. 112:1821–1830.
46. Rahn Landstrom, T., Mei, J., Karlsson, M., Mangan-iello, V., and Degerman, E. 2000. Down-regulation of cyclic-nucleotide phosphodiesterase 3B in 3T3-L1 adipocytes induced by tumour necrosis factor alpha and cAMP. Biochem. J. 346:337–343.
47. Kanda, H., et al. 2006. MCP-1 contributes to mac-rophage infiltration into adipose tissue, insulin resistance, and hepatic steatosis in obesity. J. Clin. Invest. 116:1494–1505.
48. Di Gregorio, G.B., et al. 2005. Expression of CD68 and macrophage chemoattractant protein-1 genes in human adipose and muscle tissues: association with cytokine expression, insulin resistance, and reduction by pioglitazone. Diabetes. 54:2305–2313.
49. Verma, S., et al. 2003. Resistin promotes endothelial cell activation: further evidence of adipokine-endothelial interaction. Circulation. 108:736–740.
50. Rui, L., et al. 2001. Insulin/IGF-1 and TNF-alpha stimulate phosphorylation of IRS-1 at inhibi-tory Ser307 via distinct pathways. J. Clin. Invest. 107:181–189.
51. Gao, Z., et al. 2002. Serine phosphorylation of insu-lin receptor substrate 1 by inhibitor kappa B kinase complex. J. Biol. Chem. 277:48115–48121.
52. Zhang, H.H., Halbleib, M., Ahmad, F., Mangani-ello, V.C., and Greenberg, A.S. 2002. Tumor necro-sis factor-alpha stimulates lipolysis in differen-tiated human adipocytes through activation of extracellular signal-related kinase and elevation of intracellular cAMP. Diabetes. 51:2929–2935.
53. Anthonsen, M.W., Ronnstrand, L., Wernstedt, C., Degerman, E., and Holm, C. 1998. Identification of novel phosphorylation sites in hormone-sensi-tive lipase that are phosphorylated in response to isoproterenol and govern activation properties in vitro. J. Biol. Chem. 273:215–221.
54. Farese, R.V., et al. 2007. Muscle-specific knockout of PKC-lambda impairs glucose transport and induces metabolic and diabetic syndromes. J. Clin. Invest. 117:2289–2301.
55. Zhang, D., et al. 2007. Mitochondrial dysfunc-
tion due to long-chain Acyl-CoA dehydrogenase deficiency causes hepatic steatosis and hepatic insulin resistance. Proc. Natl. Acad. Sci. U. S. A. 104:17075–17080.
56. Schrauwen-Hinderling, V.B., et al. 2005. Intramyo-cellular lipid content and molecular adaptations in response to a 1-week high-fat diet. Obes. Res. 13:2088–2094.
57. Jensen, D.R., et al. 1997. Prevention of diet-induced obesity in transgenic mice overexpressing skeletal muscle lipoprotein lipase. Am. J. Physiol. 273:R683–R689.
58. Kim, S.J., Nian, C., and McIntosh, C.H. 2007. Resis-tin is a key mediator of glucose-dependent insuli-notropic polypeptide (GIP) stimulation of lipopro-tein lipase (LPL) activity in adipocytes. J. Biol. Chem. 282:34139–34147.
59. de Luca, C., and Olefsky, J.M. 2008. Inflammation and insulin resistance. FEBS Lett. 582:97–105.
60. Ort, T., et al. 2005. Recombinant human FIZZ3/resistin stimulates lipolysis in cultured human adi-pocytes, mouse adipose explants, and normal mice. Endocrinology. 146:2200–2209.
61. Pravenec, M., et al. 2006. Fat-specific transgenic expression of resistin in the spontaneously hyper-tensive rat impairs fatty acid re-esterification. Int. J. Obes. (Lond.) 30:1157–1159.
62. Pravenec, M., et al. 2003. Transgenic and recombi-nant resistin impair skeletal muscle glucose metab-olism in the spontaneously hypertensive rat. J. Biol. Chem. 278:45209–45215.
63. Rae, C., Robertson, S.A., Taylor, J.M., and Graham, A. 2007. Resistin induces lipolysis and re-esterifi-cation of triacylglycerol stores, and increases cho-lesteryl ester deposition, in human macrophages. FEBS Lett. 581:4877–4883.
64. Guerreiro, P.M., Renfro, J.L., Power, D.M., and Canario, A.V. 2007. The parathyroid hormone fam-ily of peptides: structure, tissue distribution, regu-lation, and potential functional roles in calcium and phosphate balance in fish. Am. J. Physiol. Regul. Integr. Comp. Physiol. 292:R679–R696.
65. He, B., et al. 2002. The murine gene encoding para-thyroid hormone: genomic organization, nucleo-tide sequence and transcriptional regulation. J. Mol. Endocrinol. 29:193–203.
66. Jones, S. 2008. Mini-review: endocrine actions of fibroblast growth factor 19. Mol. Pharm. 5:42–48.
67. Neschen, S., et al. 2005. Prevention of hepatic ste-atosis and hepatic insulin resistance in mitochon-drial acyl-CoA:glycerol-sn-3-phosphate acyltrans-ferase 1 knockout mice. Cell Metab. 2:55–65.