ABU DHABI REAL ESTATE MARKET OVERVIEW
Q2 2016
REAL ESTATE SERVICES
REPORT HIGHLIGHTS Residential
�� A decline in tenant demand (enquiries down by over 25%) has started to translate into downward pressure on rents across the market with average rents showing a decline of around 3% this quarter, with anticipation that this trend will continue in the second half of the year, particularly as the scheduled new supply enters the market
�� Low transaction volumes and cautious investor sentiment prevail. Average sale prices in the secondary market have fallen by 2% and properties are now generally trading 5% below where they were 12 months ago. Off-plan sale prices are being held firm by developers
Office�� Continuing weak demand from the government
sector has resulted in another quarter of low leasing activity. Prevailing low demand over the last year has to date been balanced by equally low levels of new supply, however in the last quarter an increase in downsizing to reduce premises costs has become more prevalent in both the private and government sectors with vacancy levels rising. This has led to more noticeable rental declines over the last 3 months
�� Average Grade A rents for fitted space decreased by 6% now standing at AED 1,850 per sqm. Average Grade B rents decreased by 10% to reach AED 1,150 per sqm.
Retail Sector
�� The impact of government austerity measures are affecting the retail market which is currently experiencing a decline in retail spending putting pressure on retailer’s trading performance
�� Mall rents remained stable across A class locations, however pressure on rental rates is evident at lease renewals which could see rental growth slowing in the coming years. Mall operators are offering additional incentives in the form of extended rent free periods both on new lettings and also at lease renewal for key anchor tenants
Hospitality Sector�� Three new hotel properties opened this quarter
comprising the Four Seasons Hotel and Four Seasons Hotel Apartments at Al Maryah Island and the Gloria Downtown Hotel at Hamdan Street
�� H2 2016 is scheduled to witness the addition of 9 properties which together will add 2,410 keys, representing an 8.6% increase to the current stock level. Key additions include the Hilton Al Forsan, Grand Hyatt Emirates Pearl, and the Millennium Bab Al Qasr Hotel
�� Trading performance in the hospitality sector has been impacted by the prevailing economic conditions which have weighed on consumer and corporate spending, with the Average Daily Room Rates and RevPAR both down in Q2 by approximately 15% in comparison with 2015 levels
One of the aims of this report is to improve market transparency by basing our analysis wherever possible on primary transactional evidence derived from our own managed portfolio and from the analysis of our sales and home financing activities. We believe that this adds credibility to the analysis and we hope provides confidence in its reliability.
FOREWORD ADIB Real Estate Services comprises a comprehensive real estate banking and advisory platform providing the full range of professional services from a single provider. Our services include:-
�� Real estate financing�� Strategic development advisory�� Investment advisory�� Asset management�� Project management
�� Valuation�� Agency�� Market research�� Property management�� Facilities management
REAL ESTATE SERVICES | ABU DHABI REAL ESTATE MARKET OVERVIEWQ2 2016
2
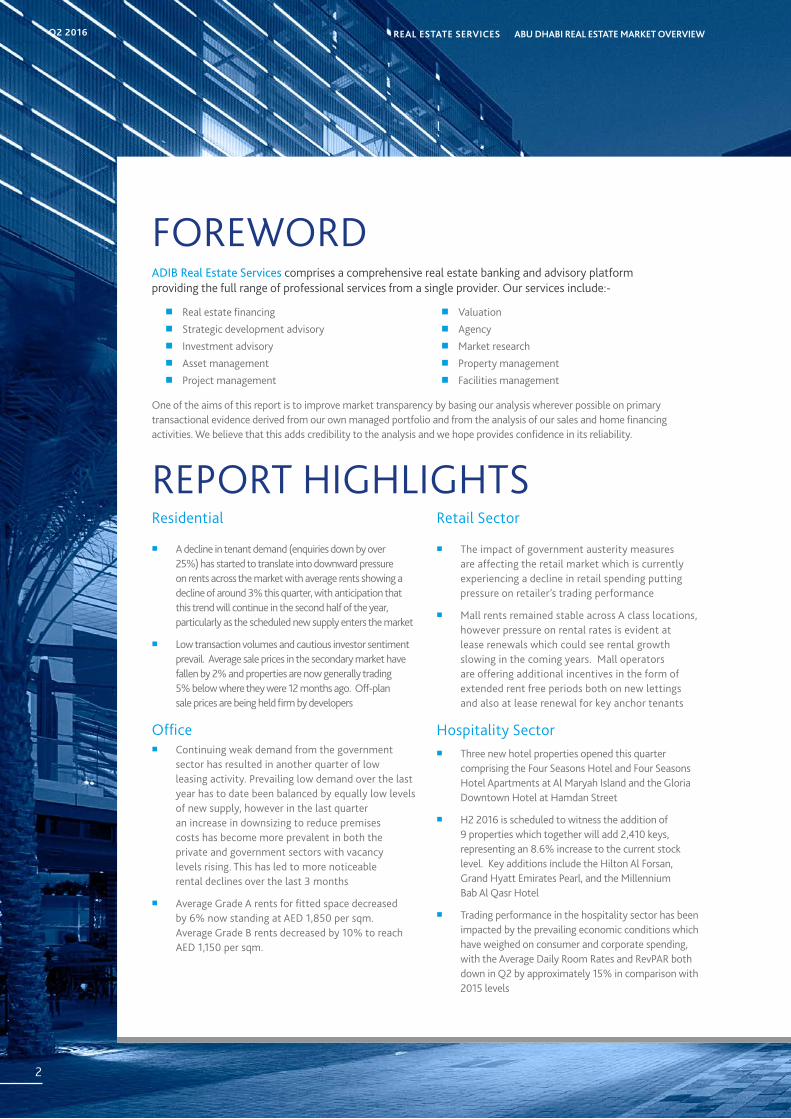
MPM PROPERTIES FACTS AND FIGURES
136bn 9,500+
CONTENTSProject in Focus 14
Office Sector 16
Retail Sector 20
Hospitality Sector 22
Definitions & Methodology 24
Contact Information 25
Supply - Photo Gallery 26
Development Location Map 28
REAL ESTATE SERVICES | ABU DHABI REAL ESTATE MARKET OVERVIEW Q2 2016
3

DEMAND DRIVERS – Q2 2016
GOVERNMENT INITIATIVES �� Moody’s Investors Service has confirmed
Abu Dhabi’s long-term issuer ratings at Aa2. Moody’s expects Abu Dhabi government’s sizeable fiscal buffers, in the form of diversified offshore investments, to help manage challenges from any economic slowdown and allow it time to adjust its fiscal policy to lower oil prices
�� Investors subscribed over $17 billion (AED 62.4 billion) for Abu Dhabi’s $5 billion bond issue exhibiting investor confidence in the Emirate. This is the first bond issue by the Emirate in seven years and is partly expected to help with a projected budget deficit of AED 36.9 billion in 2016
�� The UPC wishes to encourage property developers to restart construction work on unfinished towers that were stalled due to the global financial crisis. The recommendation is being finalized and will be presented to the government during the next step
KEY EVENTS�� Isra’a Wal Mi’raj holiday, 5th May 2016
�� Abu Dhabi Classics, 7th May – 10th May 2016
�� Portrait of a Nation, 11th April – 10th May 2016
�� Abu Dhabi International Book Fair, 27th April – 3rd May 2016
�� International Market & Consumer Fair, 20th April – 6th May 2016
�� Airline Engineering & Maintenance: Middle East conference, 26th April – 27th April, 2016
�� Andrea Bocelli Live, 22nd April 2016
�� Abu Dhabi International Jewelry and Watch Show, 3rd May – 7th May 2016
�� Start of Ramadan, 6th June 2016
FREEZONES �� Abu Dhabi Financial Group (ADFG) and Bahrain’s GFH
Financial Group have received preliminary approval to jointly set up an Islamic bank with an initial capital of US$100 million at Abu Dhabi Global Market (ADGM)
4
REAL ESTATE SERVICES | ABU DHABI REAL ESTATE MARKET OVERVIEWQ2 2016 | DEMAND DRIVERS

TOURISM INITIATIVES�� Sheikh Zayed Grand Mosque has been ranked the world’s second
favourite landmark by TripAdvisor. The Abu Dhabi landmark beat iconic wonders such as the Taj Mahal and the Eiffel Tower being outranked only by the ancient Incan site of Machu Picchu in Peru
�� Ferrari World Abu Dhabi is soon looking to launch its third phase. After the recently completed second phased added seven new rides and 20% more capacity, this planned third phase is envisaged to add an additional capacity of 40% and eight new rides
�� A UAE-Thai joint committee meeting was held to improve investment opportunities between the two countries and encourage growth of tourism. Approximately 30,000 Thai tourists visited the UAE last year as the number of flights between the two countries has increased to 98 flights per week
�� Saudi-based national airline, Flynas, will add a second daily service between Riyadh and Abu Dhabi from June, increasing its combined offer with Etihad Airways to four daily services. Also, Flynas will enter the Jeddah - Abu Dhabi market, with a daily flight which will complement Etihad Airways ‘ existing thrice daily services
�� The TCA Abu Dhabi has formally notified hotels and tourist facilities that the proposed municipal fees on hotels in Abu Dhabi will be collected from 1st June 2016 onwards.
�� The Louvre Abu Dhabi is currently more than 95 per cent complete and progressing on schedule for handover to TCA by July or August 2016. The opening is expected in December 2016 or January 2017
REAL ESTATE AND CONSTRUCTION�� Aldar Properties has sold out the first phase of Yas Acres, which was
unveiled during the lead up to Cityscape Abu Dhabi, and generated over AED 1 billion from the sales. A proposed second phase will comprise 125 homes with a starting price of AED 2.9 million
�� Following the success of its Meera Shams scheme launched in June 2015, Aldar Properties plans to add mid-income housing to its developments at Shams Abu Dhabi and Al Raha Beach
�� Aldar Properties has sold 384 out of the 512 off-plan flats in the first phase of its Mayan development on Yas Island in the first six months of launch. This includes bulk deals for two of the five buildings which make up the first phase
�� Bloom Properties unveiled ‘Faya’, the fourth phase of its Bloom Gardens project at Cityscape Abu Dhabi. The project contains 132 town houses made up of 28 four-unit and four five-unit clusters. The company has targeted UAE nationals looking to bulk buy and has reportedly sold over 90% of the units offered
�� Bloom Holding plans to launch an affordable housing project comprising 5,000 homes close to Abu Dhabi International Airport.
The 2.2 million square feet plot will be developed into flats, villas and town houses. The project is under master planning and subject to statutory approvals, is scheduled to be launched next year with delivery of units anticipated from 2019 onwards
�� The UPC has approved detailed master plans for a 637,000 square metres phase 2 of Masdar City, which will include a research and development cluster, 2,000 apartments and a Gems school as well as another 341,000 sq metres phase, which will include 1,000 homes
�� Al Forsan, the Abu Dhabi-based sports resort and housing complex, had announced a “rent-to-buy” offer for Emiratis at Cityscape Abu Dhabi on 50 of the 385 villas and town houses it has completed in Khalifa City A
�� The first phase of Saadiyat Lagoons, the largest district on Abu Dhabi’s Saadiyat Island, has been launched by TDIC at Cityscape Abu Dhabi. The premium development with 4,000 residential units is expected to house 29,000 residents upon completion
5
REAL ESTATE SERVICES | ABU DHABI REAL ESTATE MARKET OVERVIEW Q2 2016 | DEMAND DRIVERS
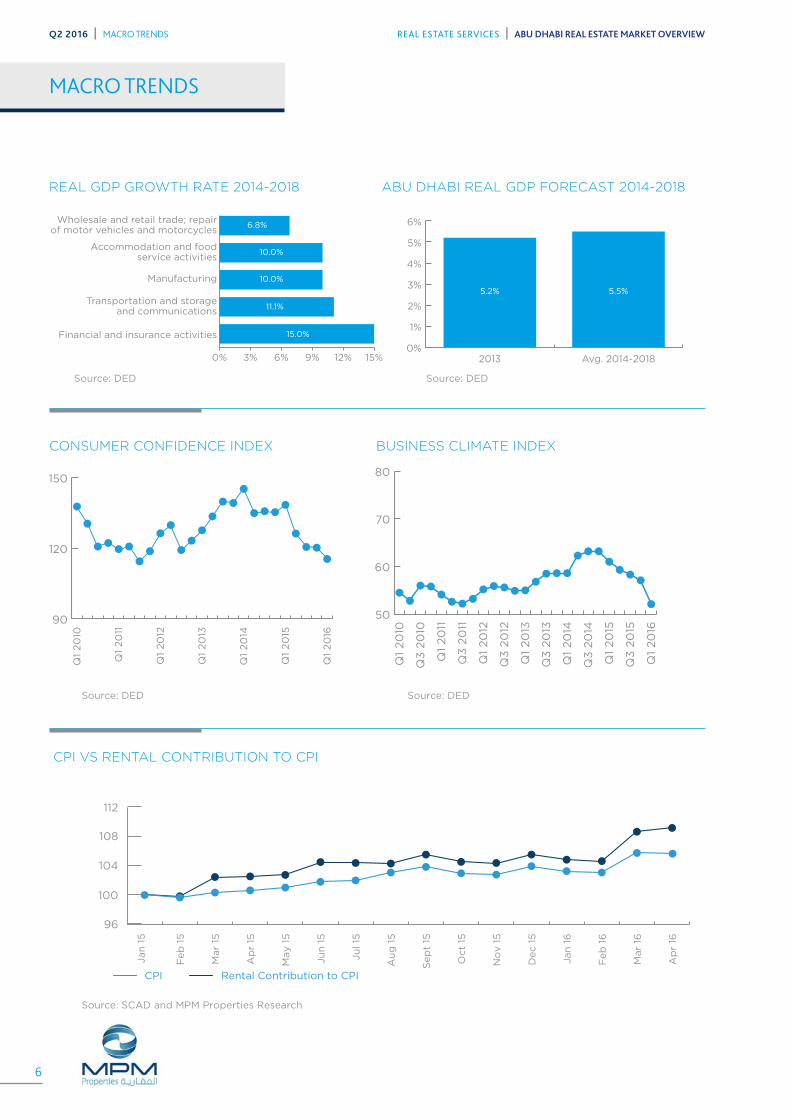
ABU DHABI REAL GDP FORECAST 2014-2018
Source: DED
0%
1%
2%
3%
4%
5%
6%
2013 Avg. 2014-2018
5.2% 5.5%
MACRO TRENDS
REAL GDP GROWTH RATE 2014-2018
Source: DED
0% 3% 6% 9% 12% 15%
Wholesale and retail trade; repairof motor vehicles and motorcycles
Accommodation and foodservice activities
Manufacturing
Transportation and storageand communications
Financial and insurance activities
6.8%
10.0%
10.0%
11.1%
15.0%
Source: DEDSource: DED
REAL GDP GROWTH RATE 2014-2018 ABU DHABI REAL GDP FORECAST 2014-2018
50
60
70
80
Q1
20
16
Q3
20
15
Q1
20
15
Q3
20
14
Q1
20
14
Q3
20
13
Q1
20
13
Q3
20
12
Q1
20
12
Q3
20
11
Q1
20
11
Q3
20
10
Q1
20
10
90
120
150
Q1
20
16
Q1
20
15
Q1
20
14
Q1
20
13
Q1
20
12
Q1
20
11
Q1
20
10
CONSUMER CONFIDENCE INDEX
Source: DED
Source: SCAD and MPM Properties Research
Source: DED
BUSINESS CLIMATE INDEX
CPI VS RENTAL CONTRIBUTION TO CPI
Feb
16
Mar
16
Ap
r 16
CPI Rental Contribution to CPI
Jan
15
Feb
15
Mar
15
Ap
r 15
Oct
15
No
v 1
5
Dec 1
5
May 1
5
Ju
n 1
5
Ju
l 15
Au
g 1
5
Sep
t 15
Jan
16
96
100
104
108
112
6
REAL ESTATE SERVICES | ABU DHABI REAL ESTATE MARKET OVERVIEWQ2 2016 | MACRO TRENDS
Dubai realty index Abu Dhabi realty index
Ju
l 0
7
Jan
07
Ju
l 0
8
Jan
08
Ju
l 0
9
Jan
09
Ju
l 10
Jan
10
Ju
l 11
Jan
11
Ju
l 12
Jan
12
Ju
l 13
Jan
13
Ju
l 14
Jan
14
Ju
l 15
Jan
15
Ju
n 1
6
Jan
16
0
50
100
150
200
250
300
350
Abu Dhabi MurbanCrude Oil
Gold Abu Dhabi Stock Market Index
Dubai Stock Index
Ju
n 1
6
Dec 1
6
Dec 1
5
Dec 1
4
Dec 1
3
Dec 1
2
Jan
11
0
50
100
150
200
250
300
350
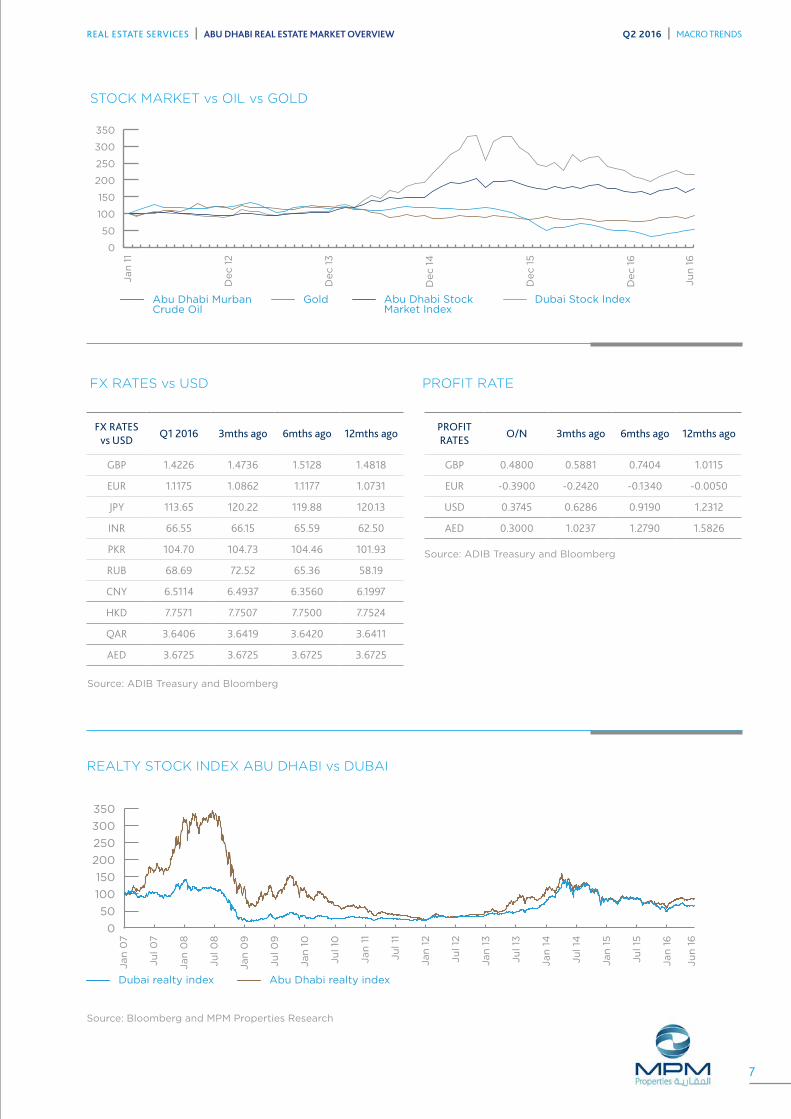
Source: Bloomberg and MPM Properties Research
Source: ADIB Treasury and Bloomberg
Source: ADIB Treasury and Bloomberg
FX RATES vs USD
REALTY STOCK INDEX ABU DHABI vs DUBAI
PROFIT RATE
STOCK MARKET vs OIL vs GOLD
FX RATES vs USD
Q1 2016 3mths ago 6mths ago 12mths ago
GBP 1.4226 1.4736 1.5128 1.4818
EUR 1.1175 1.0862 1.1177 1.0731
JPY 113.65 120.22 119.88 120.13
INR 66.55 66.15 65.59 62.50
PKR 104.70 104.73 104.46 101.93
RUB 68.69 72.52 65.36 58.19
CNY 6.5114 6.4937 6.3560 6.1997
HKD 7.7571 7.7507 7.7500 7.7524
QAR 3.6406 3.6419 3.6420 3.6411
AED 3.6725 3.6725 3.6725 3.6725
PROFIT RATES
O/N 3mths ago 6mths ago 12mths ago
GBP 0.4800 0.5881 0.7404 1.0115
EUR -0.3900 -0.2420 -0.1340 -0.0050
USD 0.3745 0.6286 0.9190 1.2312
AED 0.3000 1.0237 1.2790 1.5826
7
REAL ESTATE SERVICES | ABU DHABI REAL ESTATE MARKET OVERVIEW Q2 2016 | MACRO TRENDS
MARKET OVERVIEW Q2 2016
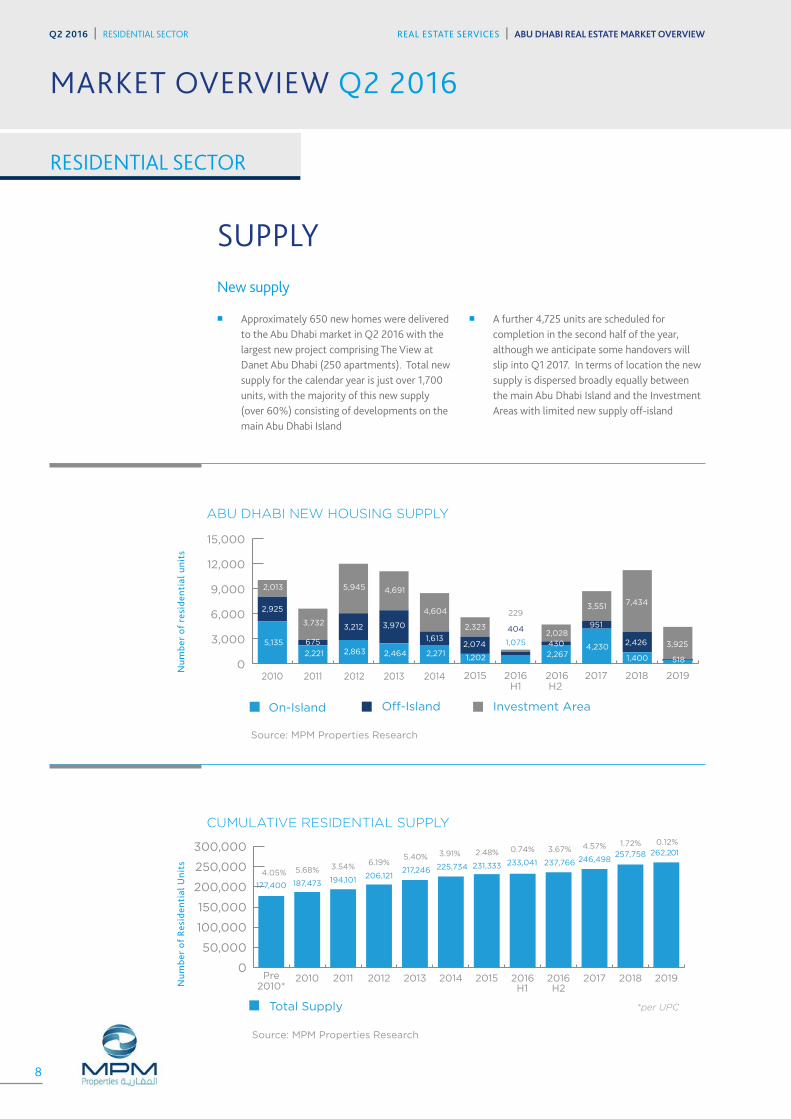
SUPPLY New supply
�� Approximately 650 new homes were delivered to the Abu Dhabi market in Q2 2016 with the largest new project comprising The View at Danet Abu Dhabi (250 apartments). Total new supply for the calendar year is just over 1,700 units, with the majority of this new supply (over 60%) consisting of developments on the main Abu Dhabi Island
�� A further 4,725 units are scheduled for completion in the second half of the year, although we anticipate some handovers will slip into Q1 2017. In terms of location the new supply is dispersed broadly equally between the main Abu Dhabi Island and the Investment Areas with limited new supply off-island
0
3,000
6,000
9,000
12,000
15,000
Investment AreaOn-Island Off-Island
20112010 2012 2013 2014 2015 2016H1
2016H2
2017 2018 2019
5,135
2,925
2,013
2,221
675
3,732
2,863
3,212
5,945
2,464
3,970
4,691
2,271
1,613
4,604
1,202
2,074
2,323
1,075
404
229
2,267
4302,028
1,400
2,426
7,434
4,230
951
3,551
518
3,925
Num
ber
of r
esid
enti
al u
nits
Pre2010*
2010 2011 2012 2013 2014 2015 2016H1
2017 2018 20192016H2
Total Supply *per UPC
0
50,000
100,000
150,000
200,000
250,000
300,000
177,400
5.68%4.05%187,473
3.54%
194,101
6.19%
206,121
5.40%
217,246
3.91%
225,734
2.48%
231,333
0.74%
233,041
3.67%
237,766
4.57% 1.72% 0.12%
246,498257,758 262,201
Num
ber
of R
esid
enti
al U
nits
RESIDENTIAL SECTOR
Source: MPM Properties Research
Source: MPM Properties Research
ABU DHABI NEW HOUSING SUPPLY
CUMULATIVE RESIDENTIAL SUPPLY
8
REAL ESTATE SERVICES | ABU DHABI REAL ESTATE MARKET OVERVIEWQ2 2016 | RESIDENTIAL SECTOR
REAL ESTATE SERVICES | ABU DHABI REAL ESTATE MARKET OVERVIEW Q2 2016 | RESIDENTIAL SECTOR
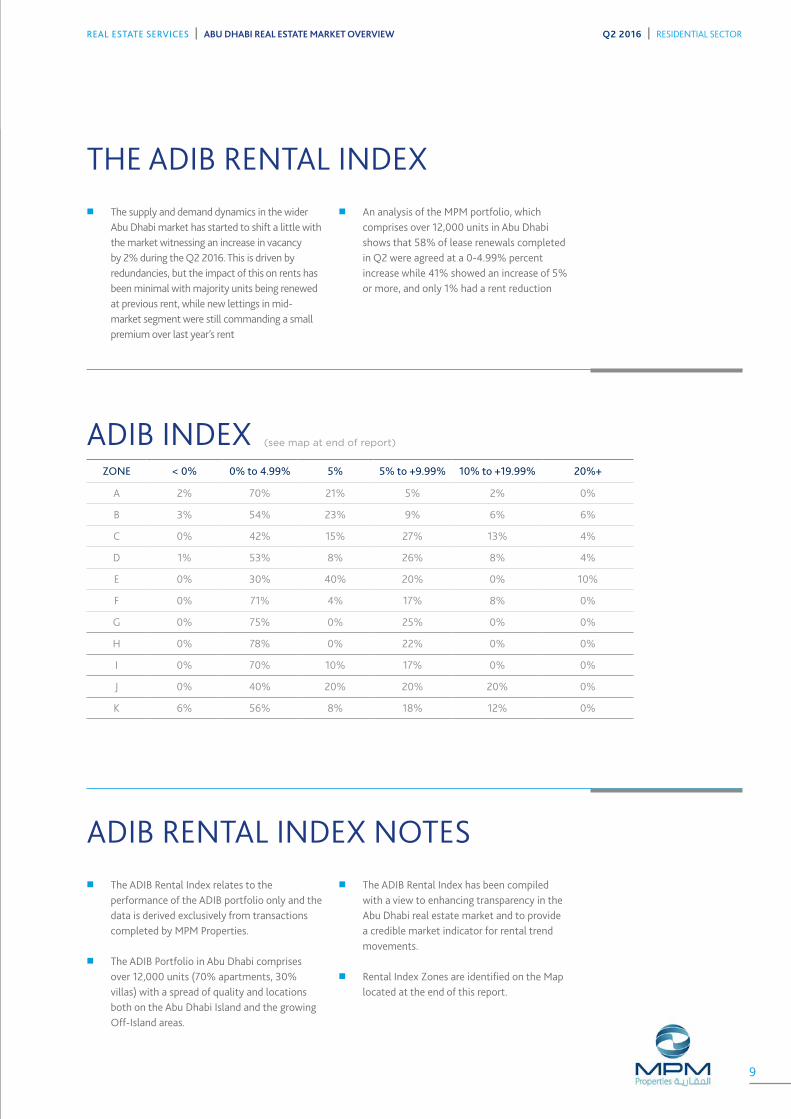
THE ADIB RENTAL INDEX �� The supply and demand dynamics in the wider
Abu Dhabi market has started to shift a little with the market witnessing an increase in vacancy by 2% during the Q2 2016. This is driven by redundancies, but the impact of this on rents has been minimal with majority units being renewed at previous rent, while new lettings in mid-market segment were still commanding a small premium over last year’s rent
�� An analysis of the MPM portfolio, which comprises over 12,000 units in Abu Dhabi shows that 58% of lease renewals completed in Q2 were agreed at a 0-4.99% percent increase while 41% showed an increase of 5% or more, and only 1% had a rent reduction
ADIB RENTAL INDEX NOTES �� The ADIB Rental Index relates to the
performance of the ADIB portfolio only and the data is derived exclusively from transactions completed by MPM Properties.
�� The ADIB Portfolio in Abu Dhabi comprises over 12,000 units (70% apartments, 30% villas) with a spread of quality and locations both on the Abu Dhabi Island and the growing Off-Island areas.
�� The ADIB Rental Index has been compiled with a view to enhancing transparency in the Abu Dhabi real estate market and to provide a credible market indicator for rental trend movements.
�� Rental Index Zones are identified on the Map located at the end of this report.
ZONE < 0% 0% to 4.99% 5% 5% to +9.99% 10% to +19.99% 20%+
A 2% 70% 21% 5% 2% 0%
B 3% 54% 23% 9% 6% 6%
C 0% 42% 15% 27% 13% 4%
D 1% 53% 8% 26% 8% 4%
E 0% 30% 40% 20% 0% 10%
F 0% 71% 4% 17% 8% 0%
G 0% 75% 0% 25% 0% 0%
H 0% 78% 0% 22% 0% 0%
I 0% 70% 10% 17% 0% 0%
J 0% 40% 20% 20% 20% 0%
K 6% 56% 8% 18% 12% 0%
ADIB INDEX (see map at end of report)
9
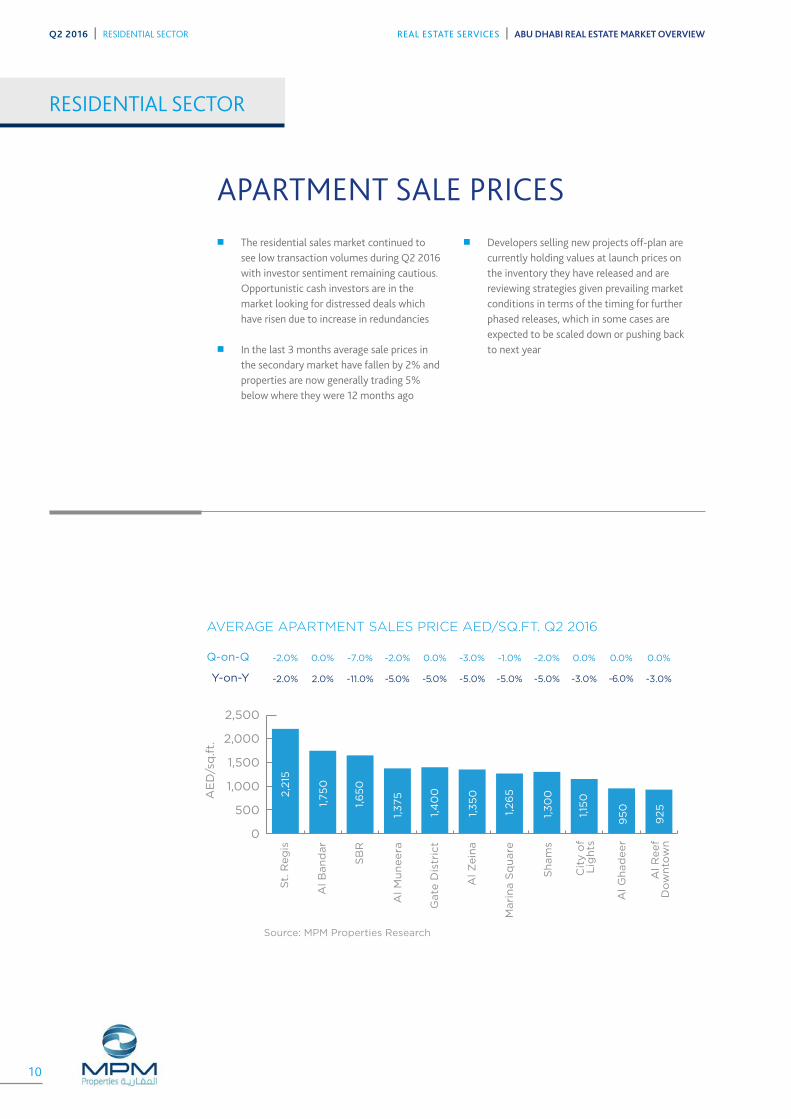
APARTMENT SALE PRICES �� The residential sales market continued to
see low transaction volumes during Q2 2016 with investor sentiment remaining cautious. Opportunistic cash investors are in the market looking for distressed deals which have risen due to increase in redundancies
�� In the last 3 months average sale prices in the secondary market have fallen by 2% and properties are now generally trading 5% below where they were 12 months ago
�� Developers selling new projects off-plan are currently holding values at launch prices on the inventory they have released and are reviewing strategies given prevailing market conditions in terms of the timing for further phased releases, which in some cases are expected to be scaled down or pushing back to next year
RESIDENTIAL SECTOR
0
500
1,000
1,500
2,000
2,500
Al R
eef
Do
wn
tow
n
Al G
had
eer
Cit
y o
fL
igh
ts
Mari
na S
qu
are
Sh
am
s
Al Z
ein
a
Gate
Dis
tric
t
Al M
un
ee
ra
SB
R
Al B
an
dar
St.
Reg
is
AE
D/s
q.ft.
-2.0% 0.0% -7.0% -2.0% 0.0% -3.0% -1.0% -2.0% 0.0% 0.0% 0.0%Q-on-Q
-2.0% 2.0% -11.0% -5.0% -5.0% -5.0% -5.0% -5.0% -3.0% -6.0% -3.0%Y-on-Y
2,2
15
1,75
0
1,6
50
1,3
75
1,4
00
1,3
50
1,26
5
1,3
00
1,15
0
95
0
925
Source: MPM Properties Research
AVERAGE APARTMENT SALES PRICE AED/SQ.FT. Q2 2016
10
REAL ESTATE SERVICES | ABU DHABI REAL ESTATE MARKET OVERVIEWQ2 2016 | RESIDENTIAL SECTOR
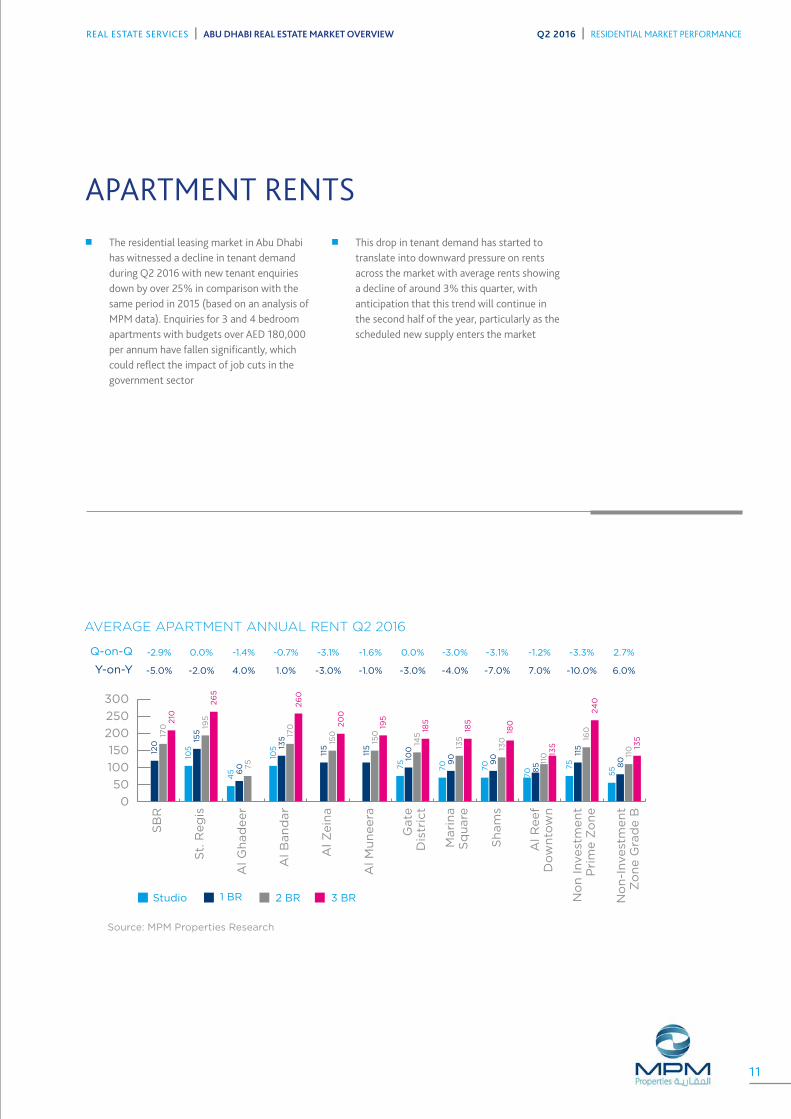
APARTMENT RENTS �� The residential leasing market in Abu Dhabi
has witnessed a decline in tenant demand during Q2 2016 with new tenant enquiries down by over 25% in comparison with the same period in 2015 (based on an analysis of MPM data). Enquiries for 3 and 4 bedroom apartments with budgets over AED 180,000 per annum have fallen significantly, which could reflect the impact of job cuts in the government sector
�� This drop in tenant demand has started to translate into downward pressure on rents across the market with average rents showing a decline of around 3% this quarter, with anticipation that this trend will continue in the second half of the year, particularly as the scheduled new supply enters the market
1 BRStudio 2 BR 3 BR
0
50
100
150
200
250
300
No
n-I
nvest
men
tZ
on
e G
rad
e B
No
n Invest
men
tP
rim
e Z
on
e
Al R
eef
Do
wn
tow
n
Sh
am
s
Mari
na
Sq
uare
Gate
Dis
tric
t
Al M
un
eera
Al Z
ein
a
Al B
an
dar
Al G
had
eer
St.
Reg
is
SB
R
0.0% -1.4% -0.7% -3.1% -1.6% 0.0% -3.0% -3.1% -1.2% -3.3% 2.7%Q-on-Q
-2.0%
-2.9%
-5.0% 4.0% 1.0% -3.0% -1.0% -3.0% -4.0% -7.0% 7.0% -10.0% 6.0%Y-on-Y
105
45
105
75
70
70
70 7
5
55
120 15
5170
210
26
5
26
0
20
0
195
185
185
180
135
24
0
135
195
75
170
150
150
145
135
130
110
160
110
60
135
115
115
100
90
90
80
115
85
Source: MPM Properties Research
AVERAGE APARTMENT ANNUAL RENT Q2 2016
11
REAL ESTATE SERVICES | ABU DHABI REAL ESTATE MARKET OVERVIEW Q2 2016 | RESIDENTIAL MARKET PERFORMANCE
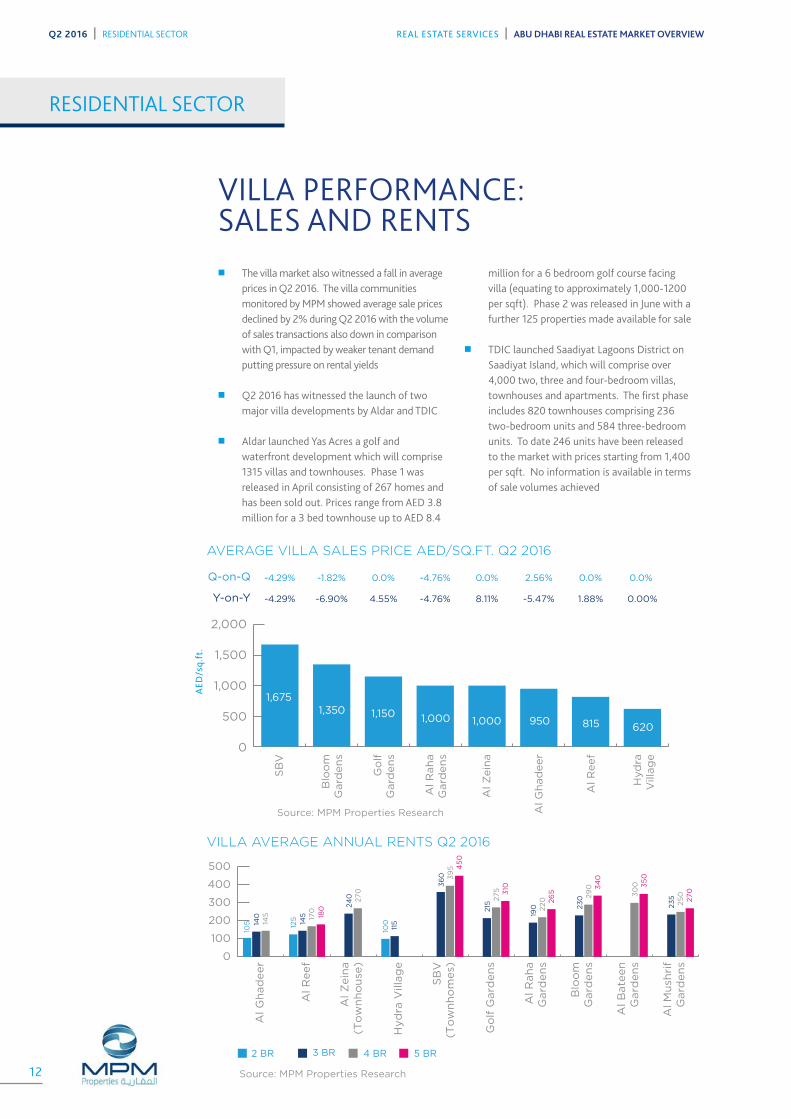
VILLA PERFORMANCE:SALES AND RENTS �� The villa market also witnessed a fall in average
prices in Q2 2016. The villa communities monitored by MPM showed average sale prices declined by 2% during Q2 2016 with the volume of sales transactions also down in comparison with Q1, impacted by weaker tenant demand putting pressure on rental yields
�� Q2 2016 has witnessed the launch of two major villa developments by Aldar and TDIC
�� Aldar launched Yas Acres a golf and waterfront development which will comprise 1315 villas and townhouses. Phase 1 was released in April consisting of 267 homes and has been sold out. Prices range from AED 3.8 million for a 3 bed townhouse up to AED 8.4
million for a 6 bedroom golf course facing villa (equating to approximately 1,000-1200 per sqft). Phase 2 was released in June with a further 125 properties made available for sale
�� TDIC launched Saadiyat Lagoons District on Saadiyat Island, which will comprise over 4,000 two, three and four-bedroom villas, townhouses and apartments. The first phase includes 820 townhouses comprising 236 two-bedroom units and 584 three-bedroom units. To date 246 units have been released to the market with prices starting from 1,400 per sqft. No information is available in terms of sale volumes achieved
RESIDENTIAL SECTOR
3 BR2 BR 4 BR 5 BR
100125
105
235
25
0270
230 2
90 3
40
190 220 26
5
215
275 3103
60
115
39
5 45
0
145
140 17
0
145 18
0 24
0 270 30
0 35
0
0
100
200
300
400
500
Al M
ush
rif
Gard
en
s
Al B
ate
en
Gard
en
s
Blo
om
Gard
en
s
Al R
ah
aG
ard
en
s
Go
lf G
ard
en
s
SB
V(T
ow
nh
om
es)
Hyd
ra V
illag
e
Al Z
ein
a(T
ow
nh
ou
se)
Al R
eef
Al G
had
eer
AED
/sq.
ft.
0
500
1,000
1,500
2,000H
yd
raV
illag
e
Al R
eef
Al R
ah
aG
ard
en
s
Go
lfG
ard
en
s
Blo
om
Gard
en
s
SB
V
-4.29%Q-on-Q
-4.29%
-1.82%
-6.90%
0.0%
4.55%
-4.76%
-4.76%
0.0%
8.11%
2.56%
-5.47%
0.0%
1.88%
0.0%
0.00%Y-on-Y
620815
Al Z
ein
a
1,0001,0001,1501,3501,675
Al G
had
eer
950
Source: MPM Properties Research
AVERAGE VILLA SALES PRICE AED/SQ.FT. Q2 2016
VILLA AVERAGE ANNUAL RENTS Q2 2016
Source: MPM Properties Research12
Q2 2016 | RESIDENTIAL SECTOR REAL ESTATE SERVICES | ABU DHABI REAL ESTATE MARKET OVERVIEW
Main island KCA MBZ
Low AverageHigh
0
5
10
15
20
25
16.17
5.4
6
6.7
510.8
10.3
7
23
.0
7.15 15
.07
14.0
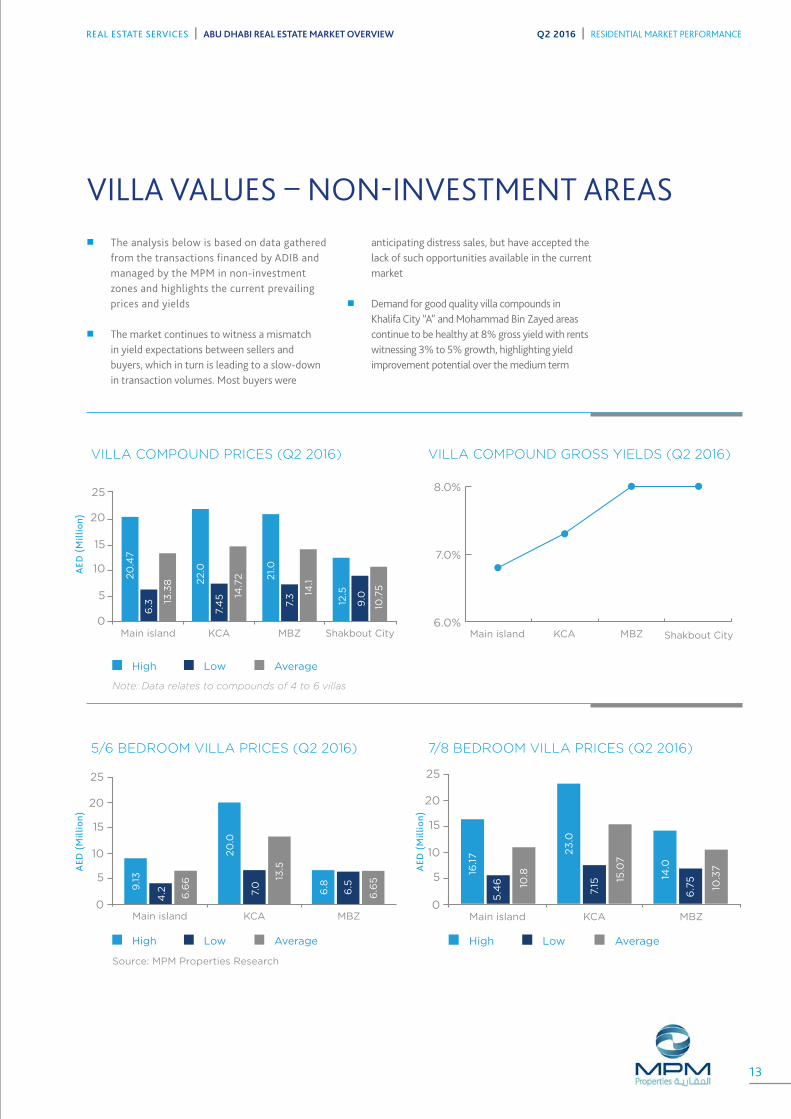
VILLA VALUES – NON-INVESTMENT AREAS�� The analysis below is based on data gathered
from the transactions financed by ADIB and managed by the MPM in non-investment zones and highlights the current prevailing prices and yields
�� The market continues to witness a mismatch in yield expectations between sellers and buyers, which in turn is leading to a slow-down in transaction volumes. Most buyers were
anticipating distress sales, but have accepted the lack of such opportunities available in the current market
�� Demand for good quality villa compounds in Khalifa City “A” and Mohammad Bin Zayed areas continue to be healthy at 8% gross yield with rents witnessing 3% to 5% growth, highlighting yield improvement potential over the medium term
0
5
10
15
20
25
Main island KCA MBZ Shakbout City
Low AverageHigh
20
.47
6.3 13
.38 2
2.0
7.4
5 14.7
2 21.0
7.3 14
.1
12.5
9.0
10.7
5
Main island KCA MBZ
Low AverageHigh
9.13
4.2 6.6
6
20
.0
7.0
13.5
6.8
6.5
6.6
5
0
5
10
15
20
25
6.0%
7.0%
8.0%
Main island KCA MBZ Shakbout City
AED
(M
illio
n)A
ED (
Mill
ion)
AED
(M
illio
n)
VILLA COMPOUND PRICES (Q2 2016)
5/6 BEDROOM VILLA PRICES (Q2 2016)
VILLA COMPOUND GROSS YIELDS (Q2 2016)
7/8 BEDROOM VILLA PRICES (Q2 2016)
Source: MPM Properties Research
Note: Data relates to compounds of 4 to 6 villas
13
REAL ESTATE SERVICES | ABU DHABI REAL ESTATE MARKET OVERVIEW Q2 2016 | RESIDENTIAL MARKET PERFORMANCE
PROJECT IN FOCUS – THE VIEW
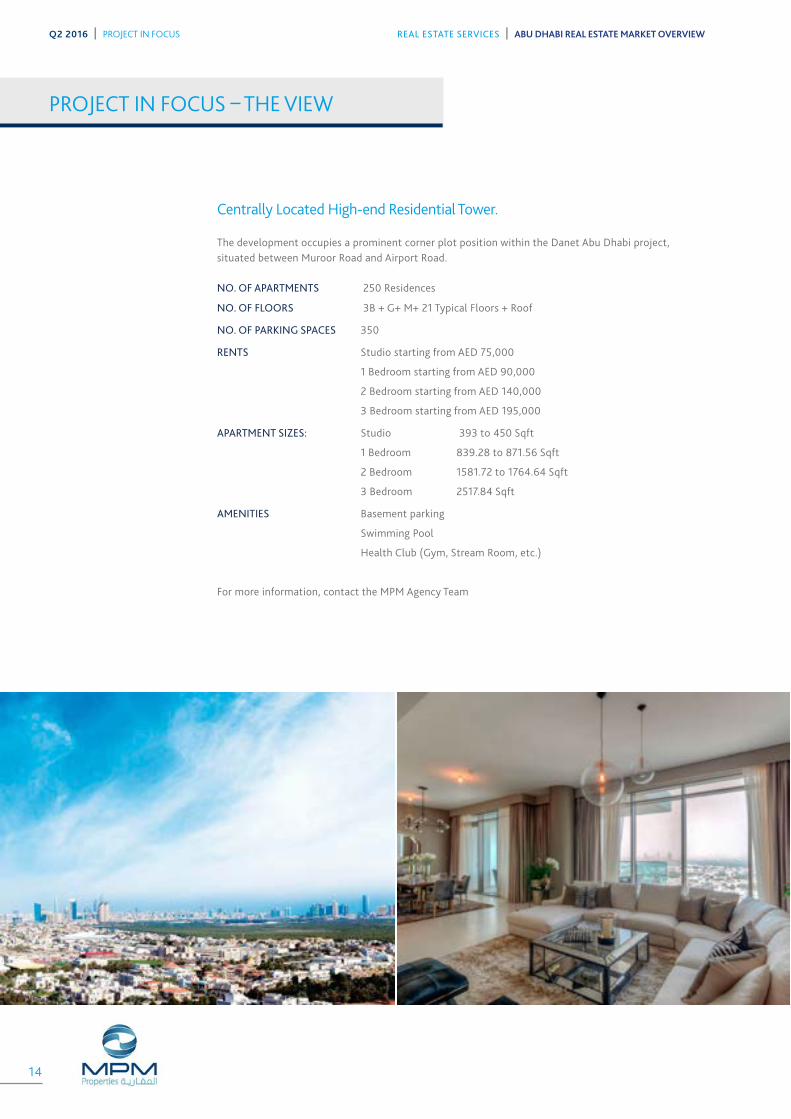
Centrally Located High-end Residential Tower.
The development occupies a prominent corner plot position within the Danet Abu Dhabi project, situated between Muroor Road and Airport Road.
NO. OF APARTMENTS 250 Residences
NO. OF FLOORS 3B + G+ M+ 21 Typical Floors + Roof
NO. OF PARKING SPACES 350
RENTS Studio starting from AED 75,000
1 Bedroom starting from AED 90,000
2 Bedroom starting from AED 140,000
3 Bedroom starting from AED 195,000
APARTMENT SIZES: Studio 393 to 450 Sqft
1 Bedroom 839.28 to 871.56 Sqft
2 Bedroom 1581.72 to 1764.64 Sqft
3 Bedroom 2517.84 Sqft
AMENITIES Basement parking
Swimming Pool
Health Club (Gym, Stream Room, etc.)
For more information, contact the MPM Agency Team
14
REAL ESTATE SERVICES | ABU DHABI REAL ESTATE MARKET OVERVIEWQ2 2016 | PROJECT IN FOCUS
15
REAL ESTATE SERVICES | ABU DHABI REAL ESTATE MARKET OVERVIEW Q2 2016 | PROJECT IN FOCUS
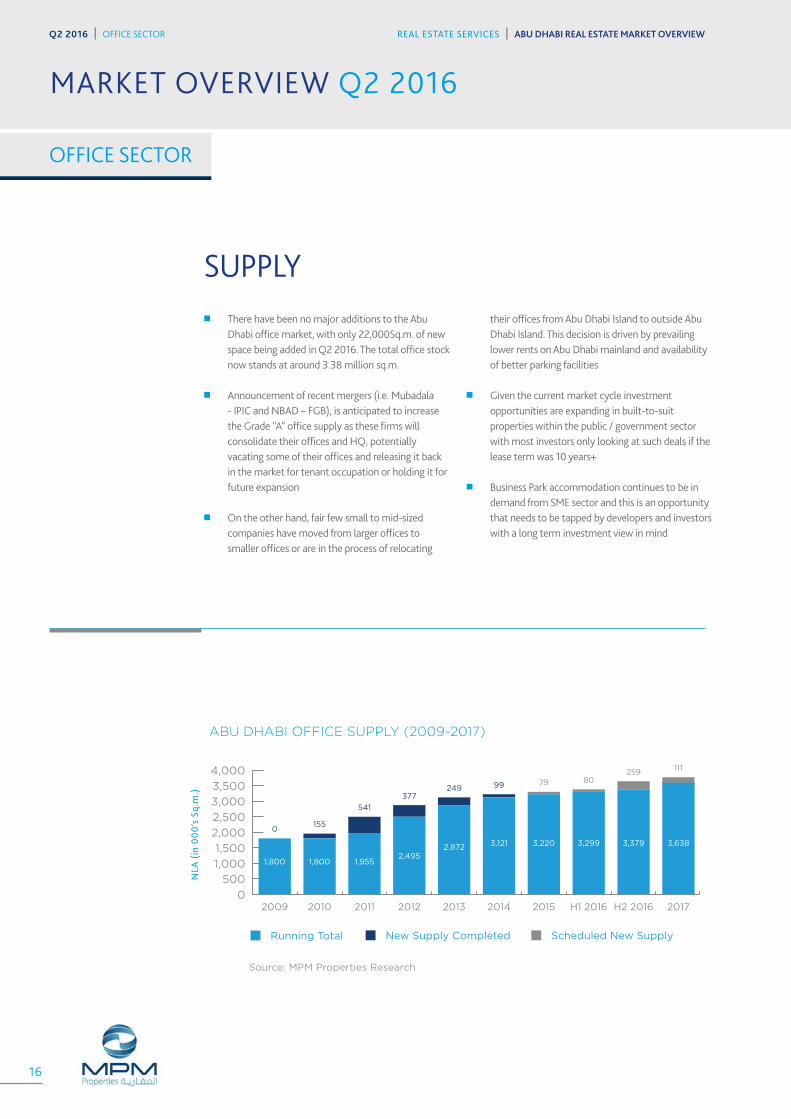
SUPPLY �� There have been no major additions to the Abu
Dhabi office market, with only 22,000Sq.m. of new space being added in Q2 2016. The total office stock now stands at around 3.38 million sq.m.
�� Announcement of recent mergers (i.e. Mubadala - IPIC and NBAD – FGB), is anticipated to increase the Grade “A” office supply as these firms will consolidate their offices and HQ, potentially vacating some of their offices and releasing it back in the market for tenant occupation or holding it for future expansion
�� On the other hand, fair few small to mid-sized companies have moved from larger offices to smaller offices or are in the process of relocating
their offices from Abu Dhabi Island to outside Abu Dhabi Island. This decision is driven by prevailing lower rents on Abu Dhabi mainland and availability of better parking facilities
�� Given the current market cycle investment opportunities are expanding in built-to-suit properties within the public / government sector with most investors only looking at such deals if the lease term was 10 years+
�� Business Park accommodation continues to be in demand from SME sector and this is an opportunity that needs to be tapped by developers and investors with a long term investment view in mind
0
500
1,000
1,500
2,000
2,500
3,000
3,500
4,000
2017H2 2016H1 20162015201420132012201120102009
Running Total New Supply Completed Scheduled New Supply
0155
541
377249 99
2598079
1,800 1,800 1,9552,495
2,872 3,121 3,220 3,299 3,379
111
3,638
MARKET OVERVIEW Q2 2016
REAL ESTATE SERVICES | ABU DHABI REAL ESTATE MARKET OVERVIEWQ2 2016 | OFFICE SECTOR
NLA
(in
00
0’s
Sq.
m.)
ABU DHABI OFFICE SUPPLY (2009-2017)
Source: MPM Properties Research
16
On-Island Off-Island Investment Area
0 500 1,000 1,500 2,000
560155917
NLA (in 000’s Sq.m.)
0
100
200
300
400
500
600
2010 2011 2012 2013 2014 2015 H1 2016 H2 2016 2017
Speculative Owner Occupation / Pre-Let
69
4220
9
1318
45
105
67
84
175
606681
203272
474
146
0
100
200
300
400
500
600
On-Island Off-Island Investment Area
125 202
64
275
235
44
98
241
81
12 21
21
207
29 5 2
11
63
0
18
0
8
57
42
0
2010 2011 2012 2013 2014 2015 2016H1
2016H2
REAL ESTATE SERVICES | ABU DHABI REAL ESTATE MARKET OVERVIEW Q2 2016 | OFFICE SECTOR
NLA
(in
00
0’s
Sq.
m.)
NLA
(in
00
0’s
Sq.
m.)
NLA (in 000’s Sq.m.)
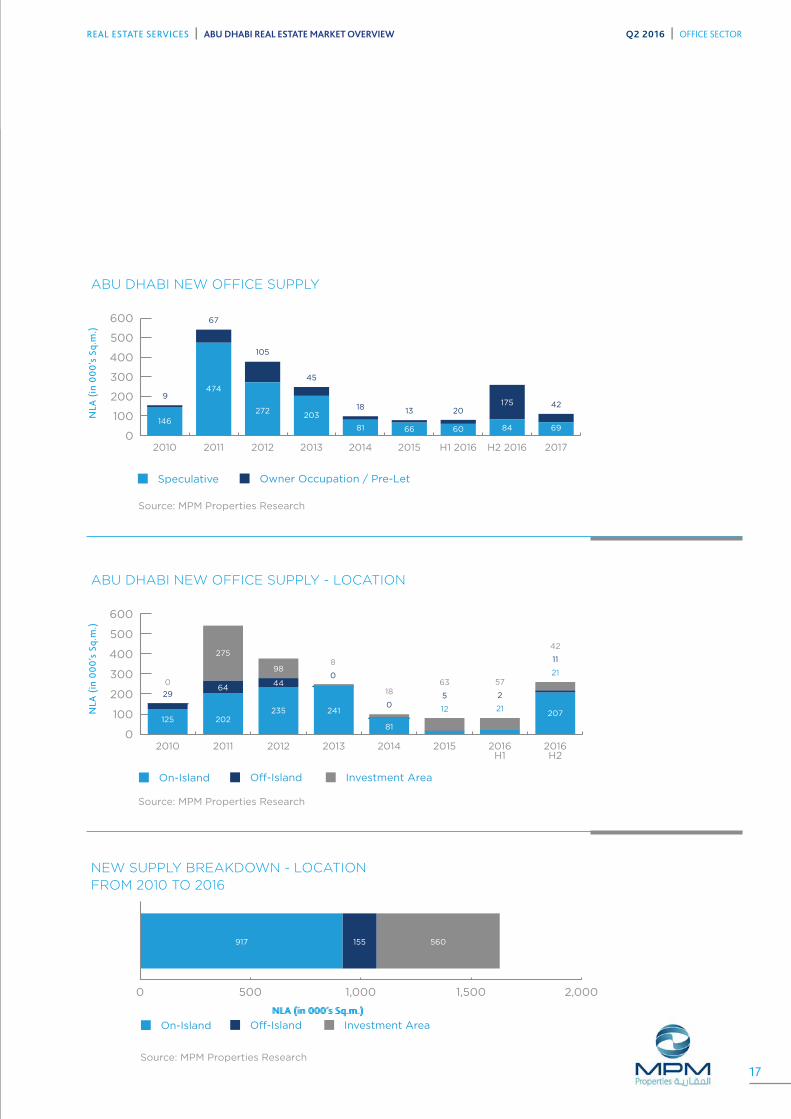
ABU DHABI NEW OFFICE SUPPLY
ABU DHABI NEW OFFICE SUPPLY - LOCATION
NEW SUPPLY BREAKDOWN - LOCATIONFROM 2010 TO 2016
Source: MPM Properties Research
Source: MPM Properties Research
Source: MPM Properties Research
17
Q1 2016 Q2 2016
Grade BGrade A S&CGrade A Fitted0
500
1,000
1,500
2,000
1,975 1,850
1,650 1,550
1,260 1,150
-6.3% -8.7%-6.1%Q-on-Q
-1.3% -6.1%0.0%Y-on-Y
Rent
/ S
q.m
. (A
ED)
Sales Price / Sq.ft.
Prestige TowerMBZ
Tamouh TowerAddaxThe WaveSky Tower0
300
600
900
1,200
1,500
1,4001,250
1,165 1,150 1,125
-3.0% -2.0%-3.0% -2.0%0.0%Q-on-Q
-5.0% -4.0%-1.0% 2.0%0.0%Y-on-Y
Sale
s Pr
ice
/ Sq
.ft.
(A
ED)
Q2 2016 | OFFICE SECTOR REAL ESTATE SERVICES | ABU DHABI REAL ESTATE MARKET OVERVIEW
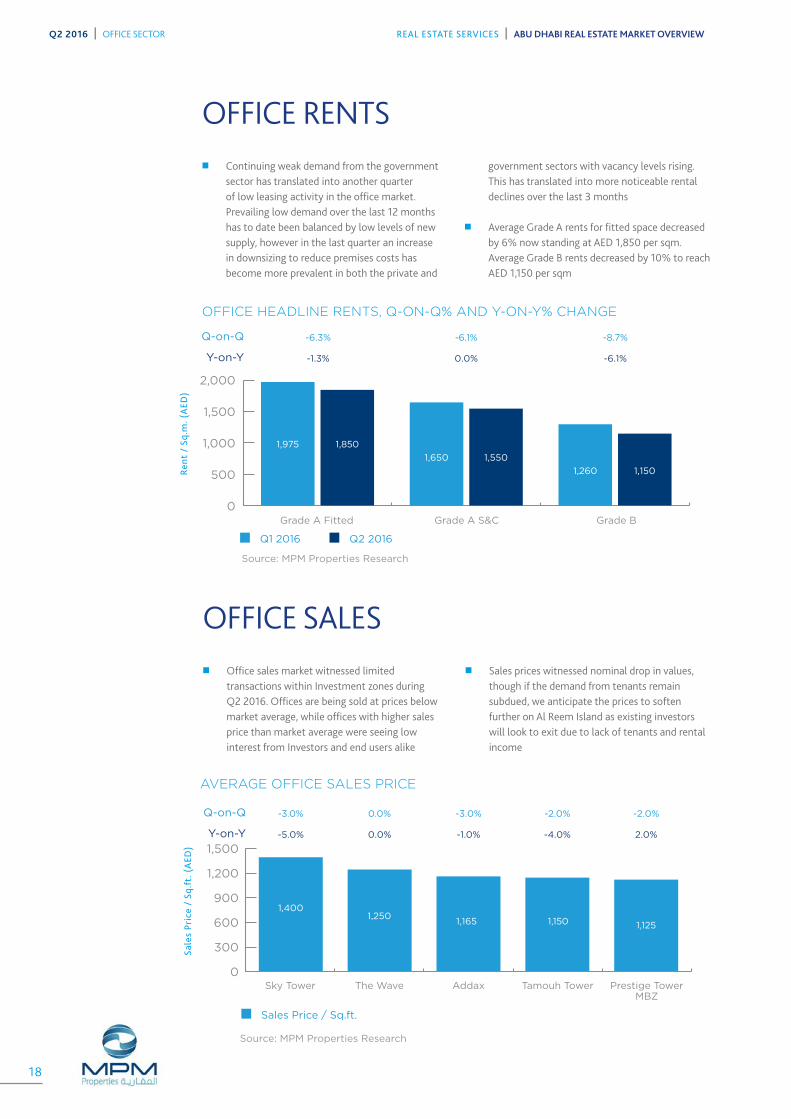
OFFICE RENTS �� Continuing weak demand from the government
sector has translated into another quarter of low leasing activity in the office market. Prevailing low demand over the last 12 months has to date been balanced by low levels of new supply, however in the last quarter an increase in downsizing to reduce premises costs has become more prevalent in both the private and
government sectors with vacancy levels rising. This has translated into more noticeable rental declines over the last 3 months
�� Average Grade A rents for fitted space decreased by 6% now standing at AED 1,850 per sqm. Average Grade B rents decreased by 10% to reach AED 1,150 per sqm
OFFICE SALES �� Office sales market witnessed limited
transactions within Investment zones during Q2 2016. Offices are being sold at prices below market average, while offices with higher sales price than market average were seeing low interest from Investors and end users alike
�� Sales prices witnessed nominal drop in values, though if the demand from tenants remain subdued, we anticipate the prices to soften further on Al Reem Island as existing investors will look to exit due to lack of tenants and rental income
OFFICE HEADLINE RENTS, Q-ON-Q% AND Y-ON-Y% CHANGE
Source: MPM Properties Research
AVERAGE OFFICE SALES PRICE
Source: MPM Properties Research
18

REAL ESTATE SERVICES | ABU DHABI REAL ESTATE MARKET OVERVIEW Q2 2016 | OFFICE SECTOR
OFFICE PROJECT IN FOCUS: ADIB HQ TOWER 2�� 21,869 sqm of net leasable area arranged over
ground and 12 upper floors
�� Shell & Core finish ready for tenant fit out works
�� 4 levels of basement parking providing 400 car parking spaces (1:50 sqm)
�� Additional parking available (subject to negotiation)
�� Efficient floor plates extending to 1638 sqm
Grade “A” Specification
�� Common atrium with Tower 1 (ADIB HQ) with coffee shop and retail units
�� 2700mm finished floor to ceiling height
�� Capacity for 200mm raised access floors
�� 8 high speed lifts dedicated to exclusively serve Tower 2 from B4 through to Level 12
�� Average wait time estimated at 10-15 seconds
�� LEED Gold for Building Design and Construction
�� All common areas are covered by CCTV, access control system, fire alarm and intrusion detection system
Location
The development is situated on Airport Road opposite the Hilton Hotel providing excellent connectivity to Downtown and the airport
MARKET OVERVIEW Q2 2016
0
500
1000
1500
2000
2500
3000
3500
2009 2010 2011 2012 2013 2014 2015 2016H1
2016H2
20182017
Scheduled New Supply Running Total New Supply Completed
28
259113
185
342 43 1 19177
749
2,5662,3892,3702,3702,3271,9851,800
1,6871,4281,4001,400NLA
(in
00
0’s
) pe
r Sq
.m.
ABU DHABI RETAIL SUPPLY (2009 - 2018+)
Source: MPM Properties Research
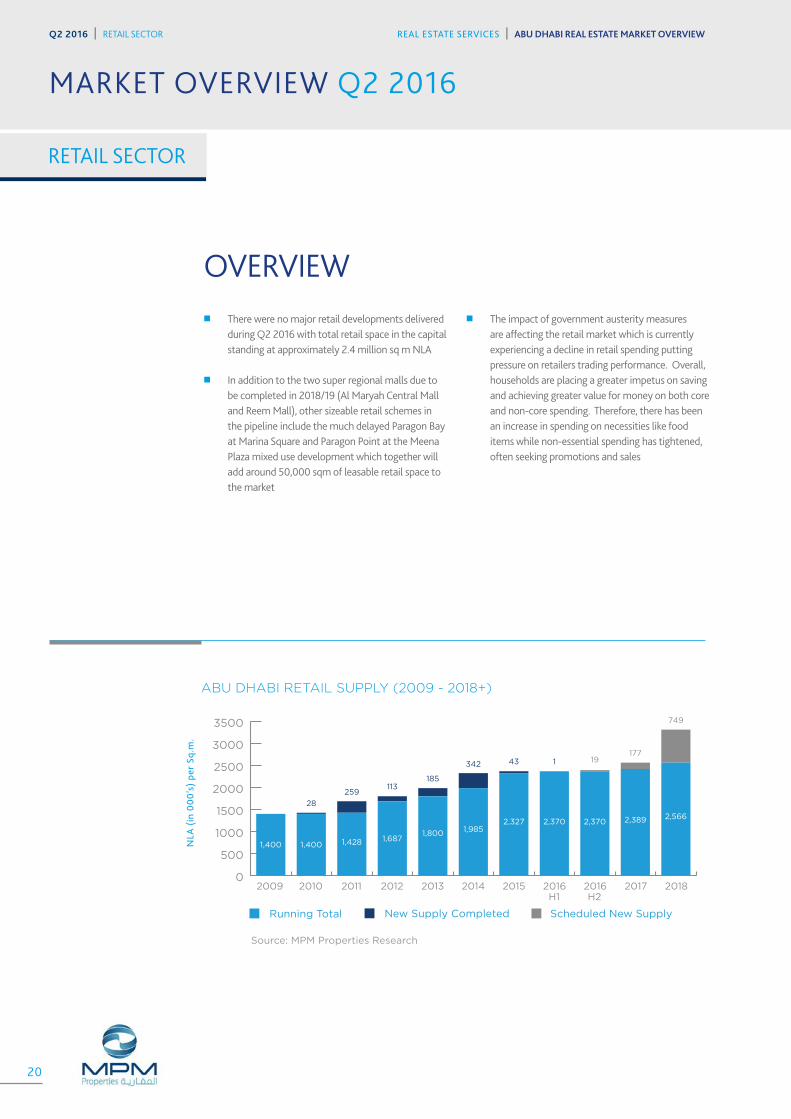
OVERVIEW �� There were no major retail developments delivered
during Q2 2016 with total retail space in the capital standing at approximately 2.4 million sq m NLA
�� In addition to the two super regional malls due to be completed in 2018/19 (Al Maryah Central Mall and Reem Mall), other sizeable retail schemes in the pipeline include the much delayed Paragon Bay at Marina Square and Paragon Point at the Meena Plaza mixed use development which together will add around 50,000 sqm of leasable retail space to the market
�� The impact of government austerity measures are affecting the retail market which is currently experiencing a decline in retail spending putting pressure on retailers trading performance. Overall, households are placing a greater impetus on saving and achieving greater value for money on both core and non-core spending. Therefore, there has been an increase in spending on necessities like food items while non-essential spending has tightened, often seeking promotions and sales
20
REAL ESTATE SERVICES | ABU DHABI REAL ESTATE MARKET OVERVIEWQ2 2016 | RETAIL SECTOR
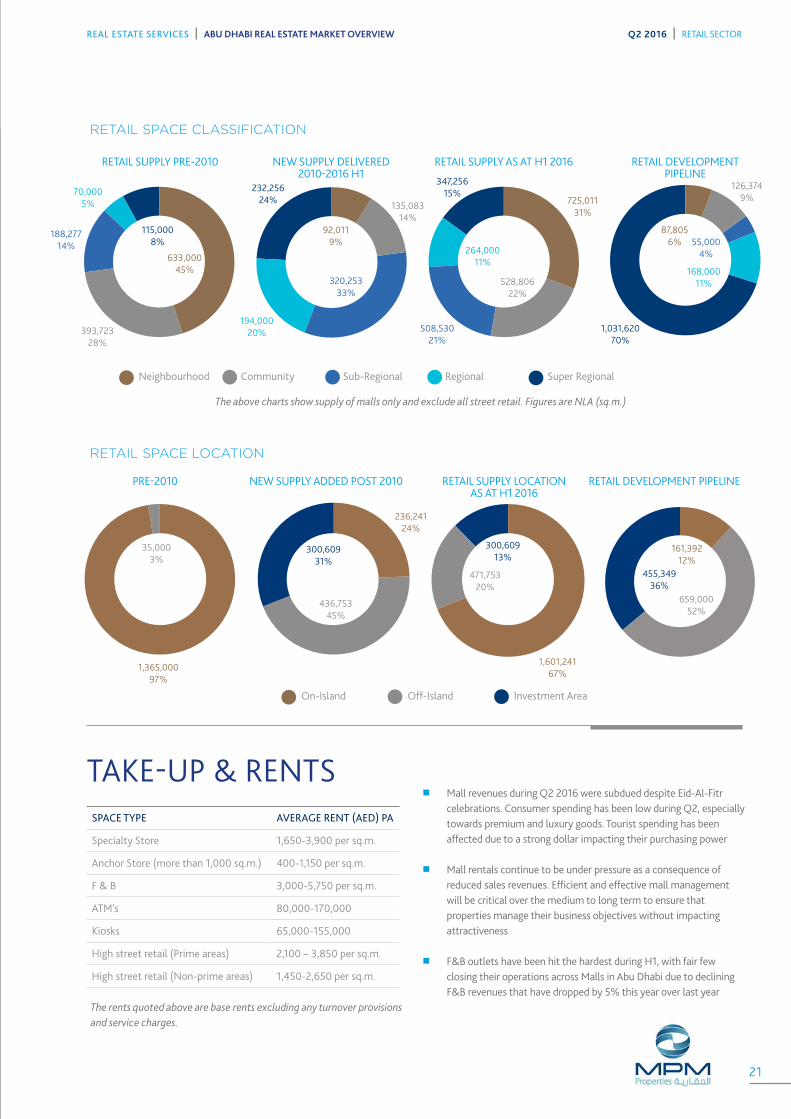
TAKE-UP & RENTS
The rents quoted above are base rents excluding any turnover provisions and service charges.
�� Mall revenues during Q2 2016 were subdued despite Eid-Al-Fitr celebrations. Consumer spending has been low during Q2, especially towards premium and luxury goods. Tourist spending has been affected due to a strong dollar impacting their purchasing power
�� Mall rentals continue to be under pressure as a consequence of reduced sales revenues. Efficient and effective mall management will be critical over the medium to long term to ensure that properties manage their business objectives without impacting attractiveness
�� F&B outlets have been hit the hardest during H1, with fair few closing their operations across Malls in Abu Dhabi due to declining F&B revenues that have dropped by 5% this year over last year
SPACE TYPE AVERAGE RENT (AED) PA
Specialty Store 1,650-3,900 per sq.m.
Anchor Store (more than 1,000 sq.m.) 400-1,150 per sq.m.
F & B 3,000-5,750 per sq.m.
ATM’s 80,000-170,000
Kiosks 65,000-155,000
High street retail (Prime areas) 2,100 – 3,850 per sq.m.
High street retail (Non-prime areas) 1,450-2,650 per sq.m.
On-Island Off-Island Investment Area
RETAIL SUPPLY PRE-2010
PRE-2010
NEW SUPPLY DELIVERED 2010-2016 H1
NEW SUPPLY ADDED POST 2010
The above charts show supply of malls only and exclude all street retail. Figures are NLA (sq.m.)
RETAIL SUPPLY LOCATION AS AT H1 2016
RETAIL DEVELOPMENT PIPELINE
RETAIL SUPPLY AS AT H1 2016
RETAIL DEVELOPMENT PIPELINE
RETAIL SPACE CLASSIFICATION
RETAIL SPACE LOCATION
633,00045%
1,365,00097%
92,011 9%
725,011 31%
393,723 28%
135,083 14%
126,374 9%
70,0005%
194,000 20%
115,0008%
232,256 24%
347,256 15%
1,031,620 70%
188,27714%
320,253 33%
508,530 21%
Neighbourhood Community Sub-Regional Regional Super Regional
528,806 22%
264,000 11%
87,805 6% 55,000
4%
168,000 11%
35,000 3%
161,392 12%
659,000 52%
455,349 36%
21
REAL ESTATE SERVICES | ABU DHABI REAL ESTATE MARKET OVERVIEW Q2 2016 | RETAIL SECTOR
ARR RevPAR Occupancy
100%
90%
80%
70%
60%
50%
40%
30%
20%
Jan
13
Ju
l
Jan
14
Ju
l
Jan
15
Ju
l
Jan
16
Ap
r
0
100
200
300
400
500
600
700
800
MARKET OVERVIEW Q2 2016
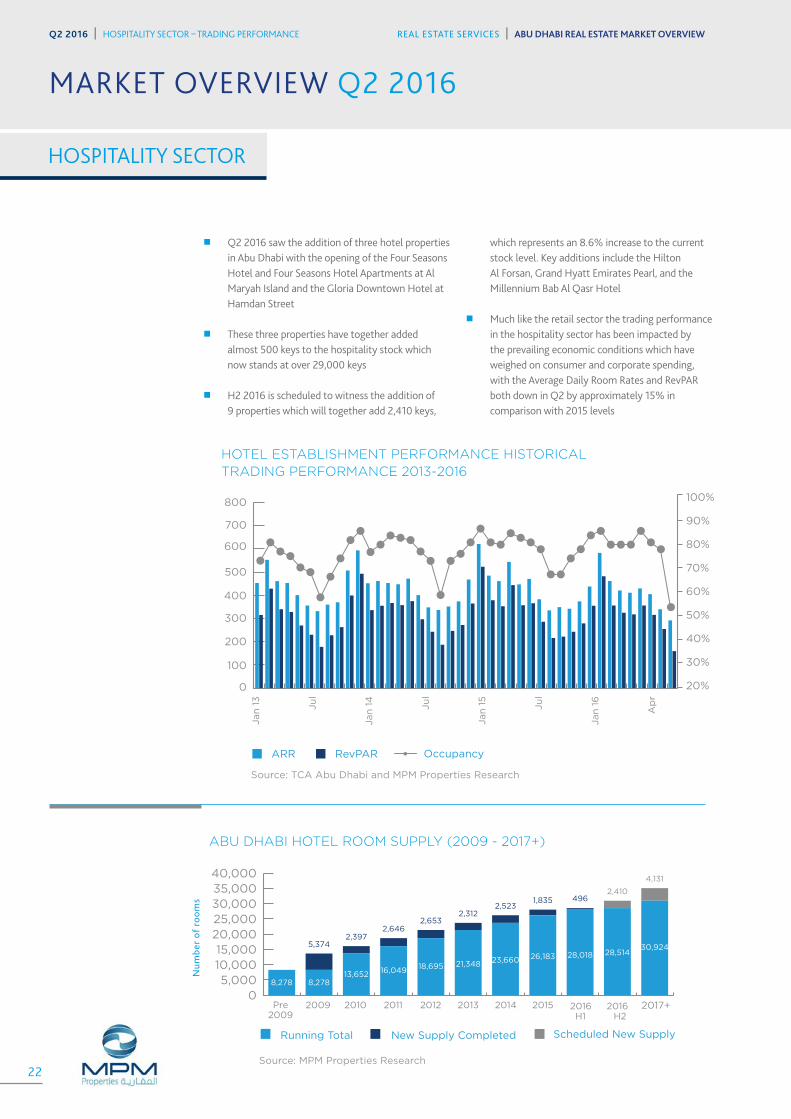
HOTEL ESTABLISHMENT PERFORMANCE HISTORICAL TRADING PERFORMANCE 2013-2016
Source: TCA Abu Dhabi and MPM Properties Research
�� Q2 2016 saw the addition of three hotel properties in Abu Dhabi with the opening of the Four Seasons Hotel and Four Seasons Hotel Apartments at Al Maryah Island and the Gloria Downtown Hotel at Hamdan Street
�� These three properties have together added almost 500 keys to the hospitality stock which now stands at over 29,000 keys
�� H2 2016 is scheduled to witness the addition of 9 properties which will together add 2,410 keys,
which represents an 8.6% increase to the current stock level. Key additions include the Hilton Al Forsan, Grand Hyatt Emirates Pearl, and the Millennium Bab Al Qasr Hotel
�� Much like the retail sector the trading performance in the hospitality sector has been impacted by the prevailing economic conditions which have weighed on consumer and corporate spending, with the Average Daily Room Rates and RevPAR both down in Q2 by approximately 15% in comparison with 2015 levels
Num
ber
of r
oom
s
05,000
10,00015,000
20,00025,00030,00035,00040,000
Pre 2009
2009 2010 2011 20132012 2014 2015 2016H1
2016H2
2017+
Scheduled New Supply Running Total New Supply Completed
4,131
2,4104961,835
2,5232,312
2,6532,646
2,3975,374 30,924
28,51428,01826,18323,66021,34818,69516,04913,6528,2788,278
ABU DHABI HOTEL ROOM SUPPLY (2009 - 2017+)
Source: MPM Properties Research22
REAL ESTATE SERVICES | ABU DHABI REAL ESTATE MARKET OVERVIEWQ2 2016 | HOSPITALITY SECTOR – TRADING PERFORMANCE
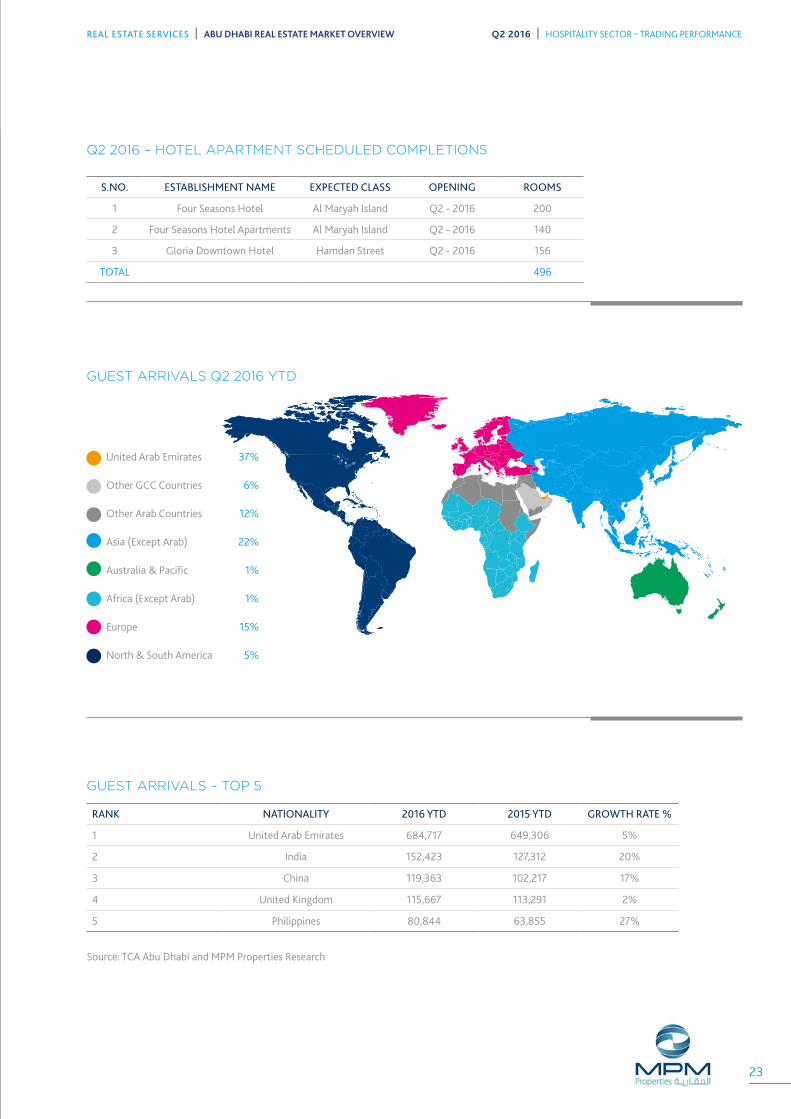
Q2 2016 – HOTEL APARTMENT SCHEDULED COMPLETIONS
GUEST ARRIVALS – TOP 5
GUEST ARRIVALS Q2 2016 YTD
S.NO. ESTABLISHMENT NAME EXPECTED CLASS OPENING ROOMS
1 Four Seasons Hotel Al Maryah Island Q2 - 2016 200
2 Four Seasons Hotel Apartments Al Maryah Island Q2 - 2016 140
3 Gloria Downtown Hotel Hamdan Street Q2 - 2016 156
TOTAL 496
RANK NATIONALITY 2016 YTD 2015 YTD GROWTH RATE %
1 United Arab Emirates 684,717 649,306 5%
2 India 152,423 127,312 20%
3 China 119,363 102,217 17%
4 United Kingdom 115,667 113,291 2%
5 Philippines 80,844 63,855 27%
United Arab Emirates 37%
Other GCC Countries 6%
Other Arab Countries 12%
Asia (Except Arab) 22%
Australia & Pacific 1%
Africa (Except Arab) 1%
Europe 15%
North & South America 5%
Source: TCA Abu Dhabi and MPM Properties Research
23
REAL ESTATE SERVICES | ABU DHABI REAL ESTATE MARKET OVERVIEW Q2 2016 | HOSPITALITY SECTOR – TRADING PERFORMANCE

RESEARCH STUDY AREA
The geographical extent of the study area includes the Abu Dhabi Island, Investment Areas and the most populated Off-Island districts specifically Khalifa City A, Mohammed Bin Zayed City and Shakbout City.
RESIDENTIAL
New residential developments are classified as delivered and thus entered into the new supply category when they are made available for occupation. This is verified via a combination of site inspections and discussion with the developer and hence our supply numbers do take into consideration the phased release of large projects.
The ADIB Rental Index relates to the performance of the ADIB portfolio only and the data is derived exclusively from transactions completed by MPM Properties.
Other rental and sales trend analysis is based on transactional data derived from the MPM Properties Agency team and data sourced from developers and owners.
OFFICES
New office developments are classified as delivered and thus entered into the new supply category when they are available for tenant fit-outs.
Given the general lack of transparency in the local market rents quoted are headline rents, thus exclude any rent free period or other financial incentives that may have been negotiated between the parties. The rents quoted are also exclusive of service charges.
RETAIL
New retail developments are classified as delivered and thus entered into the new supply category when the first units are open and trading.
Our classification of malls is based on our own assessment having regard to size and the catchment area which the mall typically penetrates.
HOSPITALITY
New hotels are classified as delivered and thus entered into the new supply category when they are opened and trading. All trading performance data is provided by ADTCA.
FUTURE SUPPLY PROJECTIONS
Our future supply projections across all sectors are based on a combination of regular site inspections and discussions with developers.
DEFINITIONS & METHODOLOGY
DISCLAIMER:
The information contained in this report has been obtained
from and is based upon sources that ADIB Real Estate Services
believes to be reliable, however, no warranty or representation,
expressed or implied, is made to the accuracy or completeness
of the information contained herein, and same is submitted
subject to errors, omissions, change of price, rental or other
conditions, withdrawal without notice, and to any special listing
conditions imposed by our principals. ADIB Real Estate Services
will not be held responsible for any third-party contributions.
All opinions and estimates included in this report constitute
ADIB Real Estate Services, as of the date of this report and
are subject to change without notice. Figures contained in
this report are derived from a basket of locations highlighted
in this report and therefore represent a snapshot of the Abu
Dhabi market. Due care and attention has been used in the
preparation of forecast information. However, actual results
may vary from forecasts and any variation may be materially
positive or negative. Forecasts, by their very nature, involve
risk and uncertainty because they relate to future events and
circumstances which are beyond ADIB Real Estate Services’
control. For a full in-depth study of the market, please contact
ADIB Real Estate Services team.
BESPOKE CLIENT RESEARCH ADDING VALUE TO YOUR PROPERTY INTERESTSThe ADIB Real Estate Services team covers all sectors of the real estate market. We provide bespoke market research to our valued clients to meet their specific requirements.
We provide reports, information and presentations derived from primary market data that directly assist our clients to save or make money from real estate and shape strategies to enhance value.
24
REAL ESTATE SERVICES | ABU DHABI REAL ESTATE MARKET OVERVIEWQ2 2016 | DEFINITIONS & METHODOLOGY

A collaborative team providing our integrated services
MOHAMED AL ZOUBI Head of Development Advisory BSc Civil Engineering T: +971 (0)2 610 0564 M: +971 (0)50 310 3570 [email protected]
PRADEEP FERNANDES MRICS Advisory & Valuation Manager BSc Civil Engineering T: +971 (0)2 510 0663 M: +971 (0)55 961 3626 [email protected]
JASON FIELDEN BSC (HONS) MRICS Valuation Manager - Abu Dhabi T: +971 (0)2 510 0653 M: +971 (0)56 244 7696 [email protected]
PAUL MAISFIELD BSC (HONS) MRICS CEO T: +971 (0)2 610 0545 M: +971 (0)50 660 9437 [email protected]
YOUSEF AL ZAROONI Regional Head – Al Ain T: +971 (0)3 708 8636 M: +971 (0)50 600 1002 [email protected]
ABDULLAH SAID AL KUWEITI Business Development Director T: +971 (0)2 610 1554 M: +971 (0)50 623 5854 [email protected]
WAHIDA KARAMA Head of Property Operations T: +971 (02) 610 0435 M: +971 (0)50 765 7679 [email protected]
FRANK O’DWYER MBA (Hons); BEng.COO T: +971 (0)2 610 0402 M: +971 (0)50 812 1070 [email protected]
DOMINIC BARLOW Head of Retail, Hospitality & Leisure T: +971 (0)2 510 0655 M: +971 (0)56 288 1458 [email protected]
JUBRAN AL HASHMI Head of Property Services T: +971 (0)2 610 0232 M: +971 (0)50 122 0041 [email protected]
ALI ABDULLAH ABDUL RAHMAN Acting Regional Head – Northern Emirates T: 971 (0)6 597 2514 M: +971 (0)50 656 2486 [email protected]
VAIBHAV SHARMA MCOM; MDBA Director of Strategic Advisory and Research T: +971 (0)2 412 8914 M: +971 (0)50 660 9295 [email protected]
KHALED AL SOLEH BSC MRICS Head of Valuation – Abu Dhabi T: +971 (0)2 610 0085 M: +971 (0)50 722 9718 [email protected]
VINEET KUMAR Director of Agency T: +971 (0)4 371 9462 M: +971 (0)50 651 6491 [email protected]
25
REAL ESTATE SERVICES | ABU DHABI REAL ESTATE MARKET OVERVIEW Q2 2016
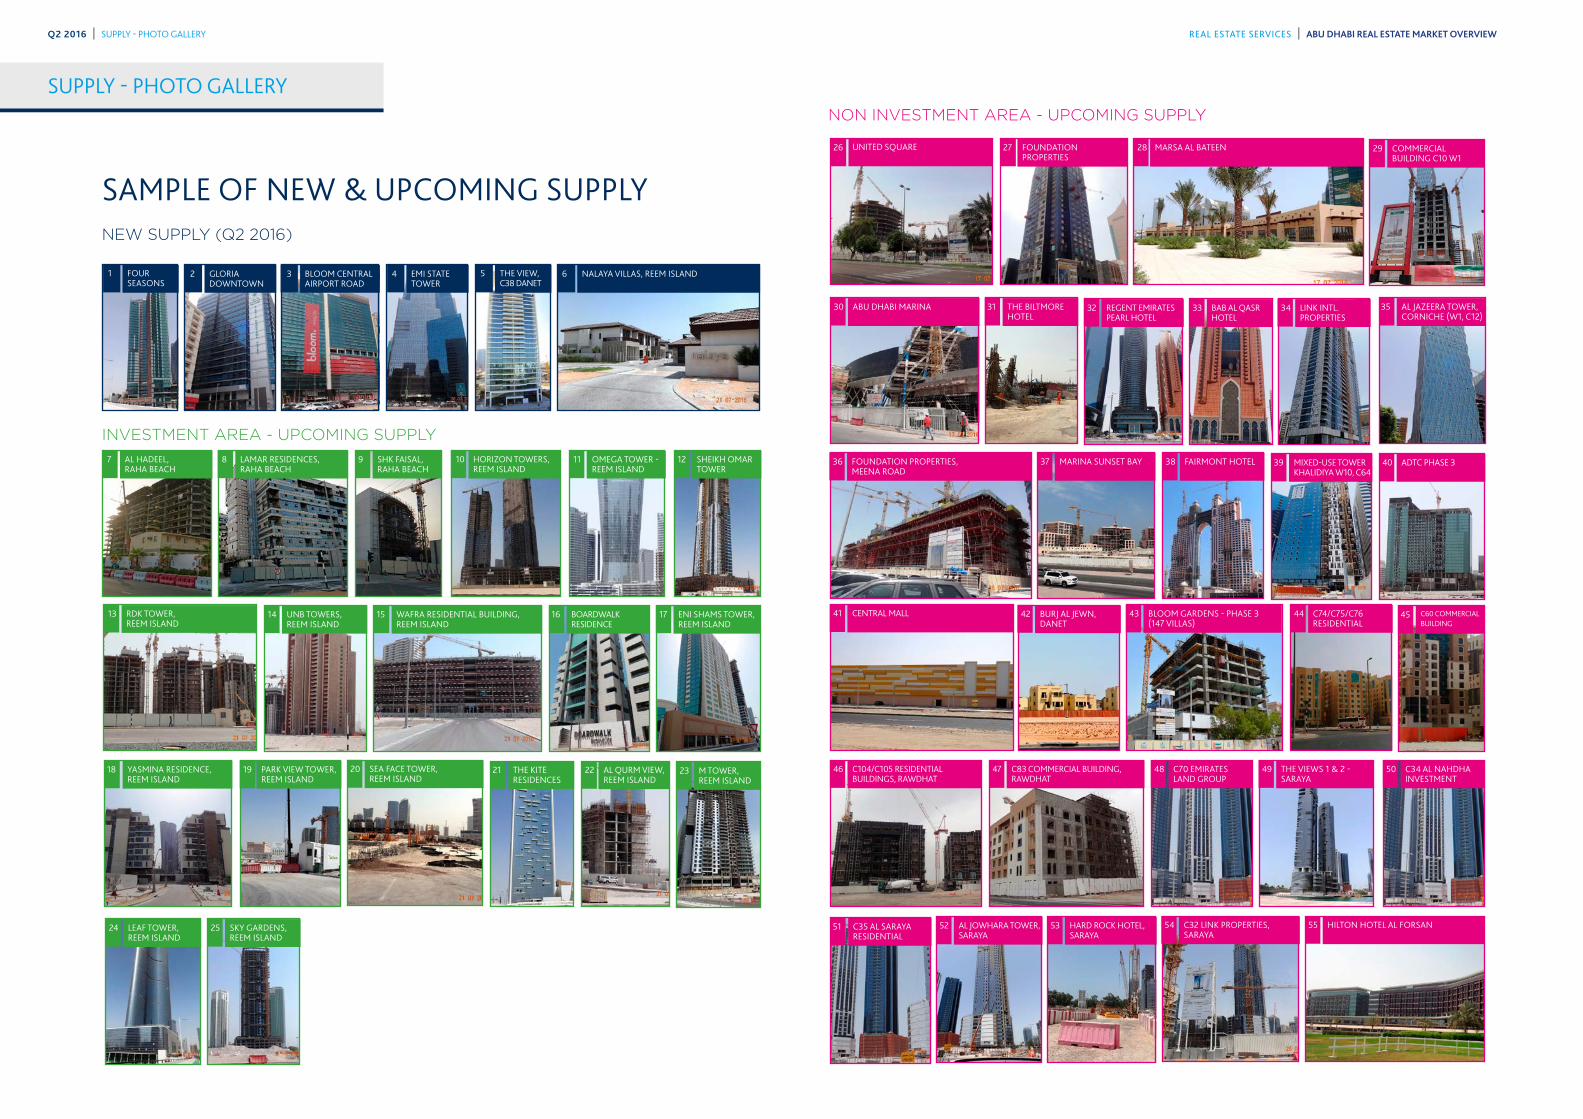
SUPPLY - PHOTO GALLERY
SAMPLE OF NEW & UPCOMING SUPPLYNEW SUPPLY (Q2 2016)
INVESTMENT AREA - UPCOMING SUPPLY
2 GLORIA DOWNTOWN
6 NALAYA VILLAS, REEM ISLAND3 BLOOM CENTRAL AIRPORT ROAD
4 EMI STATE TOWER
NON INVESTMENT AREA - UPCOMING SUPPLY
20 SEA FACE TOWER, REEM ISLAND
23 M TOWER, REEM ISLAND
24 LEAF TOWER, REEM ISLAND
25 SKY GARDENS, REEM ISLAND
29 COMMERCIAL BUILDING C10 W1
32 REGENT EMIRATES PEARL HOTEL
40
46
52
ADTC PHASE 3
C104/C105 RESIDENTIAL BUILDINGS, RAWDHAT
AL JOWHARA TOWER, SARAYA
33 BAB AL QASR HOTEL
41
47
53
CENTRAL MALL
C83 COMMERCIAL BUILDING, RAWDHAT
HARD ROCK HOTEL, SARAYA
35 AL JAZEERA TOWER, CORNICHE (W1, C12)
34 LINK INTL. PROPERTIES
42 BURJ AL JEWN, DANET
36 FOUNDATION PROPERTIES, MEENA ROAD
37
43
49
54 55
MARINA SUNSET BAY
BLOOM GARDENS - PHASE 3 (147 VILLAS)
THE VIEWS 1 & 2 - SARAYA
C32 LINK PROPERTIES, SARAYA
HILTON HOTEL AL FORSAN
30 ABU DHABI MARINA
38
44
5048
FAIRMONT HOTEL
C74/C75/C76 RESIDENTIAL
C34 AL NAHDHA INVESTMENT
C70 EMIRATES LAND GROUP
31 THE BILTMORE HOTEL
39
45
51
MIXED-USE TOWER KHALIDIYA W10, C64
C60 COMMERCIAL BUILDING
C35 AL SARAYA RESIDENTIAL
10 HORIZON TOWERS, REEM ISLAND
7 AL HADEEL, RAHA BEACH
11 OMEGA TOWER - REEM ISLAND
8 LAMAR RESIDENCES, RAHA BEACH
14 UNB TOWERS, REEM ISLAND
15 WAFRA RESIDENTIAL BUILDING, REEM ISLAND
16 BOARDWALK RESIDENCE
17 ENI SHAMS TOWER, REEM ISLAND
18 YASMINA RESIDENCE, REEM ISLAND
21 THE KITE RESIDENCES
19 PARK VIEW TOWER, REEM ISLAND
22 AL QURM VIEW, REEM ISLAND
26 UNITED SQUARE 27 FOUNDATION PROPERTIES
28 MARSA AL BATEEN
1 FOUR SEASONS
5 THE VIEW, C38 DANET
12 SHEIKH OMAR TOWER
9 SHK FAISAL, RAHA BEACH
13 RDK TOWER, REEM ISLAND
REAL ESTATE SERVICES | ABU DHABI REAL ESTATE MARKET OVERVIEWQ2 2016 | SUPPLY - PHOTO GALLERY
Residential
Offices
Retail
Hotels
Residential
Offices
Retail
Hotels
Q2 2014 NEW SUPPLY UNDER CONSTRUCTION
Residential
Offices
Retail
Hotels
Residential
Offices
Retail
Hotels
Q2 2014 NEW SUPPLY UNDER CONSTRUCTION
Jubail Island
Al ReemIsland
Al MaryahIsland
Al Raha Beach
MasdarCity
Saadiyat Island
Yas Island
HydraVillage
Al Reef
B
D
E F
G H
K
I
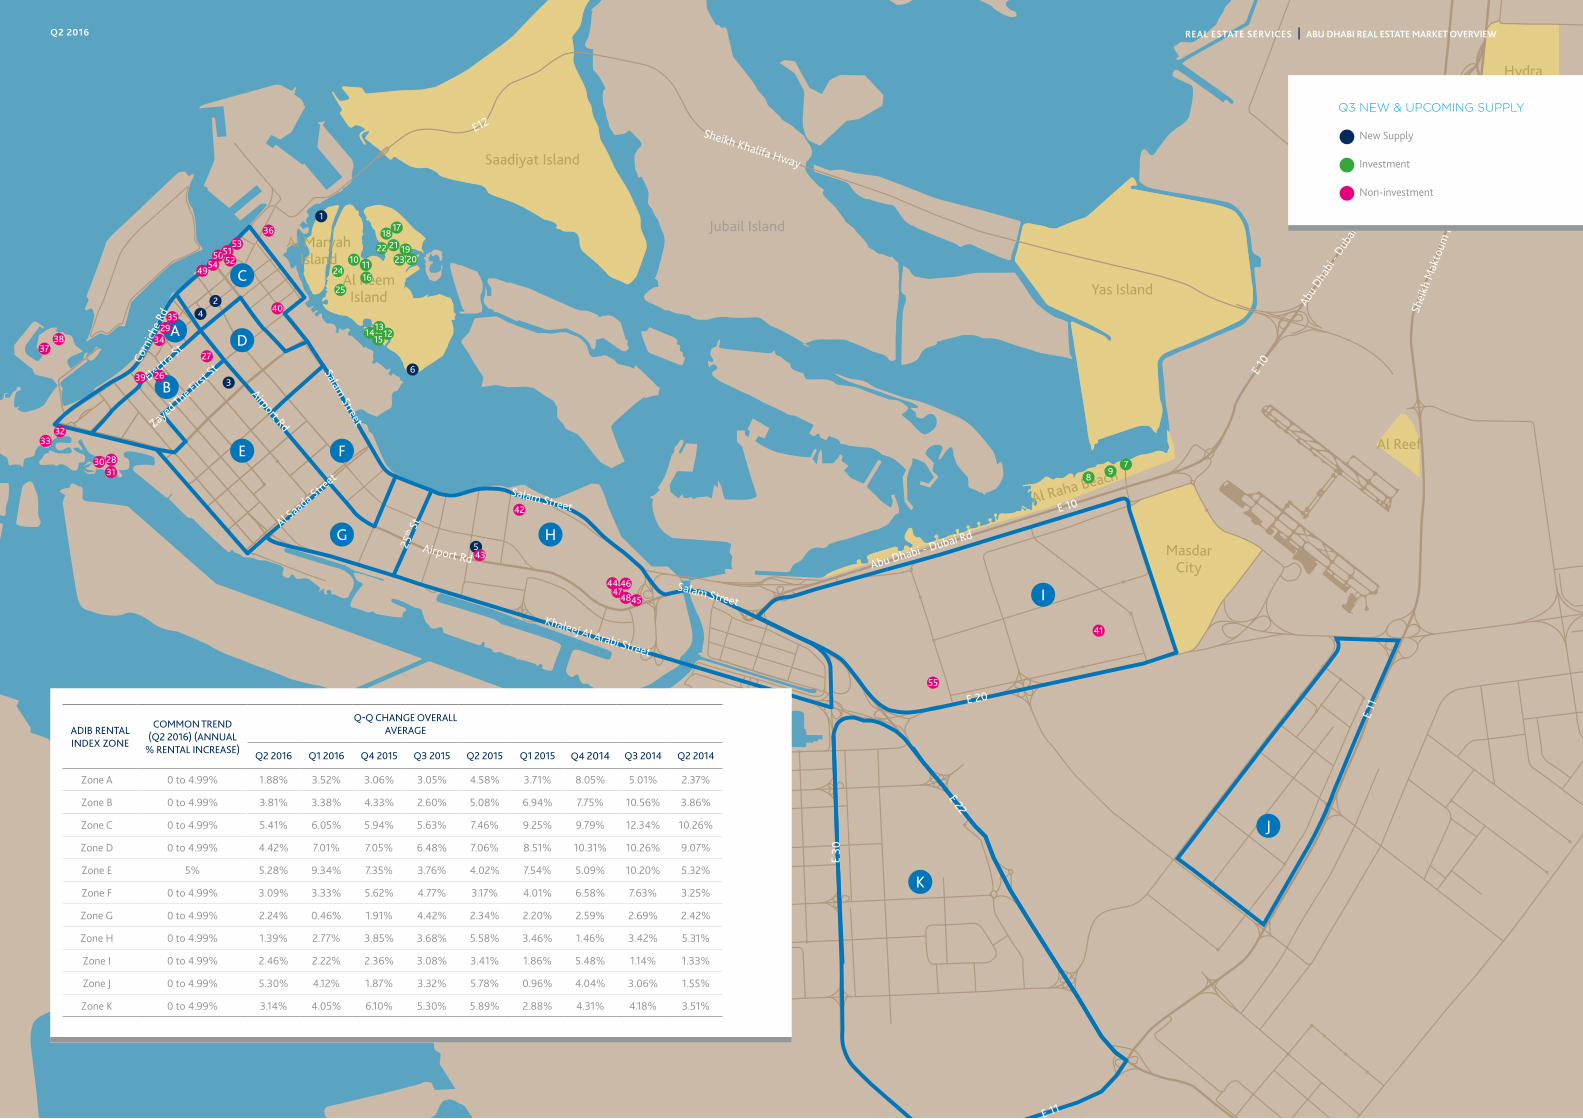
J
A
C
Salam Street
Khaleej Al Arabi Street
Airport Rd
Airport Rd
E 20
E 22
E 30
Corn
iche
Rd
Electra St
Zayed The First S
t
E12
Al Saada Stre
et
25th S
t
Salam Street
Salam Street
Sheikh Khalifa Hway
Abu D
habi
- Dub
ai Rd
Abu Dhabi - Dubai Rd
E 10
Shei
kh M
akto
um B
in R
ashi
d Rd
E 11
E 11
E 10
6
5
4
1
89
7
1116
2322
10
1514 12
13
1920
21
1718
25
24
40
34
3130 28
3233
3837
3529
39 26
36
27
43
3
42
2
454847
44 46
49
5054
5153
52
55
41
New Supply
Investment
Non-investment
Q3 NEW & UPCOMING SUPPLY
ADIB RENTAL INDEX ZONE
COMMON TREND (Q2 2016) (ANNUAL
% RENTAL INCREASE)
Q-Q CHANGE OVERALL AVERAGE
Q2 2016 Q1 2016 Q4 2015 Q3 2015 Q2 2015 Q1 2015 Q4 2014 Q3 2014 Q2 2014
Zone A 0 to 4.99% 1.88% 3.52% 3.06% 3.05% 4.58% 3.71% 8.05% 5.01% 2.37%
Zone B 0 to 4.99% 3.81% 3.38% 4.33% 2.60% 5.08% 6.94% 7.75% 10.56% 3.86%
Zone C 0 to 4.99% 5.41% 6.05% 5.94% 5.63% 7.46% 9.25% 9.79% 12.34% 10.26%
Zone D 0 to 4.99% 4.42% 7.01% 7.05% 6.48% 7.06% 8.51% 10.31% 10.26% 9.07%
Zone E 5% 5.28% 9.34% 7.35% 3.76% 4.02% 7.54% 5.09% 10.20% 5.32%
Zone F 0 to 4.99% 3.09% 3.33% 5.62% 4.77% 3.17% 4.01% 6.58% 7.63% 3.25%
Zone G 0 to 4.99% 2.24% 0.46% 1.91% 4.42% 2.34% 2.20% 2.59% 2.69% 2.42%
Zone H 0 to 4.99% 1.39% 2.77% 3.85% 3.68% 5.58% 3.46% 1.46% 3.42% 5.31%
Zone I 0 to 4.99% 2.46% 2.22% 2.36% 3.08% 3.41% 1.86% 5.48% 1.14% 1.33%
Zone J 0 to 4.99% 5.30% 4.12% 1.87% 3.32% 5.78% 0.96% 4.04% 3.06% 1.55%
Zone K 0 to 4.99% 3.14% 4.05% 6.10% 5.30% 5.89% 2.88% 4.31% 4.18% 3.51%
REAL ESTATE SERVICES | ABU DHABI REAL ESTATE MARKET OVERVIEWQ2 2016
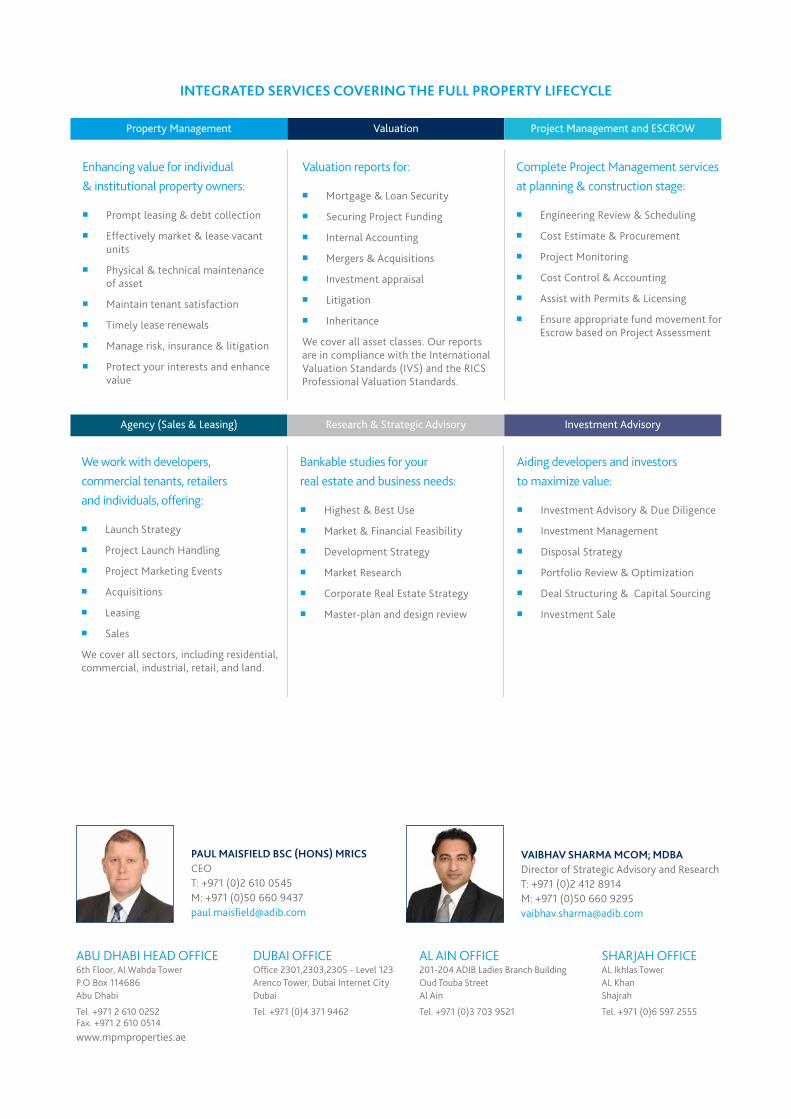
INTEGRATED SERVICES COVERING THE FULL PROPERTY LIFECYCLE
Property Management
Investment Advisory
Project Management and ESCROW
Research & Strategic AdvisoryAgency (Sales & Leasing)
Valuation
PAUL MAISFIELD BSC (HONS) MRICS CEO T: +971 (0)2 610 0545 M: +971 (0)50 660 9437 [email protected]
VAIBHAV SHARMA MCOM; MDBA Director of Strategic Advisory and Research T: +971 (0)2 412 8914 M: +971 (0)50 660 9295 [email protected]
ABU DHABI HEAD OFFICE 6th Floor, Al Wahda Tower P.O Box 114686 Abu Dhabi
Tel. +971 2 610 0252Fax. +971 2 610 0514 www.mpmproperties.ae
DUBAI OFFICE Office 2301,2303,2305 - Level 123 Arenco Tower, Dubai Internet City Dubai
Tel. +971 (0)4 371 9462
AL AIN OFFICE 201-204 ADIB Ladies Branch Building Oud Touba Street Al Ain
Tel. +971 (0)3 703 9521
SHARJAH OFFICE AL Ikhlas Tower AL Khan Shajrah
Tel. +971 (0)6 597 2555
Enhancing value for individual & institutional property owners:
�� Prompt leasing & debt collection
�� Effectively market & lease vacant units
�� Physical & technical maintenance of asset
�� Maintain tenant satisfaction
�� Timely lease renewals
�� Manage risk, insurance & litigation
�� Protect your interests and enhance value
Complete Project Management services at planning & construction stage:
�� Engineering Review & Scheduling
�� Cost Estimate & Procurement
�� Project Monitoring
�� Cost Control & Accounting
�� Assist with Permits & Licensing
�� Ensure appropriate fund movement for Escrow based on Project Assessment
Aiding developers and investors to maximize value:
�� Investment Advisory & Due Diligence
�� Investment Management
�� Disposal Strategy
�� Portfolio Review & Optimization
�� Deal Structuring & Capital Sourcing
�� Investment Sale
We work with developers, commercial tenants, retailers and individuals, offering:
�� Launch Strategy
�� Project Launch Handling
�� Project Marketing Events
�� Acquisitions
�� Leasing
�� Sales
We cover all sectors, including residential, commercial, industrial, retail, and land.
Bankable studies for your real estate and business needs:
�� Highest & Best Use
�� Market & Financial Feasibility
�� Development Strategy
�� Market Research
�� Corporate Real Estate Strategy
�� Master-plan and design review
Valuation reports for:
�� Mortgage & Loan Security
�� Securing Project Funding
�� Internal Accounting
�� Mergers & Acquisitions
�� Investment appraisal
�� Litigation
�� Inheritance
We cover all asset classes. Our reports are in compliance with the International Valuation Standards (IVS) and the RICS Professional Valuation Standards.
Recommended