Abstracts Selected for Oral Presentation
001 -‐ Early diagnosis of Atypical Femoral Fracture (AFF) at time of Dual Energy X-‐ray Absorptiometry (DXA) Scan; Recipient of Best Technologist Abstract
002 -‐ DXA-‐based Model for Advanced Analysis of Body Shape Variation
003 -‐ Temporal Trends in Bone Mineral Density, Body Mass Index and Fracture Rates: Implications for Osteoporosis Diagnosis and FRAX; Recipient of Best Clinician Abstract
004 -‐ How Comparable Are Hologic and GE-‐Lunar Visceral Fat Analyses?
005 -‐ Imaging and Finite Element Analysis of the Spine, Hip, Radius, and Tibia Following 2 years of Treatment with Odanacatib in Postmenopausal Women
Recipients of Young Investigator Awards
010 -‐ Bone structure assessed by TBS measured by DXA reflects trabecular microarchitecture analyzed by µCT in bone biopsies of females with fragility fractures -‐ The clinical proof of concept
011 -‐ Can results of the left or right half of a whole body DXA composition study effectively reflect results of a total body composition DXA study?
012 -‐ Establishment of T-‐scores for HR-‐pQCT using a normative Canadian population
013 -‐ What is the performance in vertebral fracture discrimination by Bone mineral density (BMD), micro-‐architecture estimation (TBS), Body Mass Index (BMI) and FRAX in stand-‐alone or combined approaches: The OsteoLaus Study
014 -‐ Analyzing infant whole body DXA – reflection or fusion?
Bone Structure, Quality, Architecture, Micro-‐Architecture
100 -‐ Association of Trabecular Bone Score (TBS) with Microarchitecture and Mechanical Behavior of Human Lumbar Vertebrae
101 -‐ Lumbar spine microarchitecture impairment evaluation in chronic kidney disease: a TBS study
102 -‐ Comparison of Trabecular Bone Score Values and Precision Between a GE Lunar Prodigy and iDXA Densitometer.
103 -‐ Denosumab Treatment Is Associated With Progressive Improvements in Cortical Mass and Thickness at the Hip in Regions Relevant to Fracture Protection
104 -‐ TBS is superior to BMD and structural analysis by CT in analysing gender specific differences in Females and Males with fragility Fractures
105 -‐ More Accurate Discrimination of Elderly Women with and without Arm and Wrist Fractures by Combining Bone Shock Absorption (BSA) and DXA BMD – New Device Development
106 -‐ Atypical Femoral Fractures: Radiographic and Histomorphometric Features in 17 Patients
Risk Assessment
107 -‐ Osteoporosis Treatment Does Not Explain Decreasing Temporal Trends in Fracture Rates: A Population-‐Based Analysis
108 -‐ Adjustment of FRAX probability according to lumbar spine Trabecular Bone Score (TBS): The Manitoba BMD Cohort
109 -‐ Combination of Quantitative Ultrasound and FRAX® in evaluation of Structural-‐functional State of Bone in Postmenopausal Women
110 -‐ X-‐Ray Absorptiometry Indexes for Women in Postmenopausal Period with Osteoporotical Fractures
111 -‐ What is the best statistical test to calculate reproducibility in VFA reading in population-‐based cohort? A comparison between kappa of Cohen and Uniform Kappa
112 -‐ Assessment of women microarchitecture with and without osteoporotic fracture by TBS on white non Hispanic US women
113 -‐ Quality Assessment of Osteoporosis: Screening and management of Veterans living in a Long Term Care Unit.
Treatment
114 -‐ Opening the Anabolic Window: A Pilot Study of Cyclical Teriparatide and Raloxifene
115 -‐ Zoledronic Acid Prevents Bone Mineral Density Loss at the Hip, but not at the Knee, in Persons with Acute Spinal Cord Injury.
116 -‐ Restoration of bone mass and microarchitecture texture after hypercortisolism normalization in patients with Cushing Disease: a two years study
117 -‐ Greater than expected increases in bone mineral density are seeing in clinical patients transitioned from alendronate to denosumab therapy
Peripheral
118 -‐ Pointing the Finger at Screening DXA: Device Reliability Testing for Central DXA Referrals

Other Density
119 -‐ A Competitive Relationship between Bone Marrow Adipose Tissue and Volumetric Bone Mineral Density across the Lifespan
120 – Significant Increase in Bone Area Following Teriparatide Treatment in a Patient with Spondyloepiphyseal Dysplasia
121 -‐ Adding VFA to DXA Changes Clinical Classification and Improves Detection of Fracture Risk
122 -‐ Assessment of the Reproducibly of 3 Methods of Soft Tissue Body Composition for the Determination of Muscle Mass in the Lower Extremities of Persons with Spinal Cord Injury
123 -‐ Effect of Chronic Use of Alendronate on Regional Bone Mineral Density at the Proximal Femur in Osteoporosic Men
Central Bone and Other
124 -‐ The Effect of Extending Femur Scan Length on Bone Mineral Density Results on the Hologic Discovery-‐W Scanner
125 -‐ Adapting an American Bone Density Reporting System to a French speaking Hospital… not only a matter of translation!
126 -‐ Creation of the Age-‐Related TBS curve at Lumbar Spine in US Caucasian Women Derived from DXA
127 -‐ Body Composition Measurement Reproducibility is Related to Mass
128 -‐ TBS detects the fragility fracture in men
129 -‐ Determinants of bone mineral content at 6 months of age
130 -‐ Comparison of Lunar DXA and QCT at the Femoral Neck using Asynchronous Calibration of CT Colonography Exams.
131 -‐ Trabecular Bone Score and Bone Mineral Density of Lumbar Spine in Healthy Women: Pros and Cons
132 -‐ Improved Parameters of Bone Strength in Patients After One Year of Denosumab Treatment by Measures of Trabecular Bone Score and Femur Strength Index
133 – Inconsistency in Filling in the Bottom of the Spine Bone Map Worsens the Precision of Reported Spine BMD

Recipent of Best Technologist Abstract Award Invited Oral Presentation
001 -‐ Early diagnosis of Atypical Femoral Fracture (AFF) at time of Dual Energy X-‐ray Absorptiometry (DXA) Scan
Susan van der Kamp, Eric Heffernan, Malachi McKenna; St. Vincent’s University Hospital, Dublin, Ireland
BACKGROUND: AFF is associated with prolonged bisphosphonate therapy. Major criteria include: minimal or no trauma; non-‐comminution; transverse or short oblique fracture line; and, complete fracture with medial spike or incomplete fracture on lateral cortex. Minor features include periosteal flare, “beaking” (linear crack in midst of cortical flare), and cortical thickening.We sought to identify incomplete type AFF at time of routine DXA scanning.
METHODS: All patients over 50 years of age, who had been taking a bisphosphonate bone agent for greater than 5 years, were offered an extended hip scan bilaterally. The scan length of the single-‐energy image for a hip scan has a default of approximately 18 cm. We extended the length of the scan field up to 22 cm in order to view the extra length of the femoral shaft. Images were viewed by two
observers. If abnormalities were noted in the lateral aspect of the femur such as periosteal flare or “beaking”, then patients were referred for a plain X-‐ray.
RESULTS: Extended bilateral hip scans were performed in 312 patients; 14 were referred for X-‐ray. AFF was diagnosed in 5. Two patients had orthopaedic intervention: 1 patient had a linear crack visible on DXA and X-‐ray; 1 patient had bilateral symmetric periosteal flares with extreme tenderness at the site. Of the 9 patients without evidence of an AFF, 3 had cortical thickening, and 1 had an osteochondroma.
CONCLUSIONS: AFF was diagnosed in 5 of 312 patients, with 2 requiring surgical intervention. Early diagnosis of AFF is possible using bilateral extended femoral DXA imaging, but the prevalence is low.
Invited Oral Presentation
002 -‐ DXA-‐based Model for Advanced Analysis of Body Shape Variation Joseph Wilson and John Shepherd; Berkeley-‐UCSF Graduate Program in Bioengineering and University of California
San Francisco, San Francisco, CA
BACKGROUND: As many conditions progress to advanced stages, body shape changes become readily apparent including obesity, cachexia, lipodystrophy, and anorexia. We know that simplistic markers of body shape like waist circumference and waist-‐to-‐hip ratio are highly predictive of disease and mortality, but body shape is more than just measures of central adiposity. The study of body shape and regional composition is in its infancy due to the lack of sophisticated tools used to study large cohorts with well-‐powered outcomes. In this project, we describe a DXA-‐based body shape model using principal component analysis (PCA) that ultimately can describe the variation in body shape and
composition at a pixel level for the entire United States.
METHODS: We retrospectively analyzed DXA data in small study at UCSF and generated pixel-‐level thickness from Hologic DXA scans using an in-‐house algorithm previously described. An average thickness image was developed and subtracted to evaluate variation from the mean. PCA was performed in Matlab on these thickness variation images to calculate the main uncorrelated modes of body shape variation across the study population. These were then compared to standard body composition variables evaluated in the study.

RESULTS: Figure 1 shows the process of generating the modes of body shape variation (with the first, second, and sixth displayed) for all images (N=25) used in this study. The first ten modes described 87% of the total variation in all of the thickness images. The first mode of variation described 36% of the total thickness variation and was significantly (p<0.05) correlated (Pearson’s R) to height (0.60), weight (0.99), BMI (0.84), lean (0.74), total body water (0.78), trunk fat (0.84), trunk to total volume (0.53), and trunk to leg volume (0.47). The second mode described 18% of the total variation and was
significantly correlated to age (-‐0.40), height (-‐0.60), BMI (-‐0.43), total % fat (-‐0.69), lean (0.54), total body water (0.50), and total body protein (0.69). The sixth mode described 5% of the total variation and was significantly correlated to trunk to leg volume (-‐0.41).
CONCLUSIONS: We used PCA to describe variations in body shape generated from DXA images in a small, proof-‐of-‐concept sample. In large, well-‐powered studies, this method could be used to describe those areas of the body that are highly associated with health status and disease progression.
Recipent of Best Clinician Abstract Award Invited Oral Presentation
003 -‐ Temporal Trends in Bone Mineral Density, Body Mass Index and Fracture Rates: Implications for Osteoporosis Diagnosis and FRAX
William Leslie1, Lisa Lix1, Suzanne Morin2, Colleen Metge1, Sumit Majumdar3; 1University of Manitoba, Winnipeg, Canada, 2McGill University, Montreal, Canada, 3University of Alberta, Edmonton, Canada
BACKGROUND: Osteoporotic fracture rates have been decreasing among North American women, while femoral neck BMD has increased (~6% from NHANES 1988-‐1994 to 2005-‐2008) as has BMI. Diagnosis of
osteoporosis and 10-‐year fracture risk assessment (FRAX) as defined by the WHO are still based upon NHANES 1988-‐1994 reference data.

AIM: To determine whether historical 1988-‐1994 NHANES data still provide appropriate reference data for osteoporotic fracture prediction.
METHODS: 36,587 women ≥50 years at the time of baseline femoral neck BMD from DXA (January 1st 1996 and December 31st 2006) were identified in a database containing all clinical BMD results for the Province of Manitoba, Canada. Trends in BMD and BMI were studied in relation to calendar year of DXA with analysis of covariance (ANCOVA). Health service records to March 31st 2011 (mean follow-‐up 8 years, maximum 10 years) were used to identify incident non-‐traumatic major osteoporotic fractures (MOF, n=3162) and hip fractures (HF, n=867). Linear trends in adjusted fracture rates in relation to calendar year of DXA were assessed with Cox proportional hazards models.
RESULTS: Age-‐adjusted BMI increased progressively from 1996 to 2006 (0.2 kg/m2 per year, p<0.001) as did age-‐adjusted femoral neck BMD (0.7% per year, p<0.001). The increase in BMD was not appreciably attenuated after adjustment for prior osteoporosis treatment (OTX,
including systemic HRT), BMI, instrument and other FRAX covariates (prior osteoporotic fracture, COPD [proxy for smoking], prolonged glucocorticoid use, rheumatoid arthritis, or high alcohol intake). A similar increasing trend was seen for total hip and lumbar spine BMD (both p<0.001). There was a significant negative linear trend for MOF (p<0.001) and HF (p<0.001) in relation to calendar year in age-‐adjusted models. This temporal trend persisted after accounting for BMI and OTX (p<0.001 for MOF and p=0.006 for HF), but disappeared when adjusted for femoral neck T-‐score using the NHANES 1988-‐1994 White female reference data.
CONCLUSION: This clinical BMD database closely mirrors the temporal trends in BMD, BMI and fracture rates that have been observed in population-‐based cohorts including NHANES. The temporal increase in BMD is unexplained by changes in BMI and OTX and appears to account for the observed decline in MOF and HF. Our results imply that the NHANES 1988-‐1994 White female reference data should still be used for fracture prediction.
Figure: Temporal trends in BMI and femoral neck BMD for women age 50 years and older (95% CI bars).
24
25
26
27
28
1995 1996 1997 1998 1999 2000 2001 2002 2003 2004 2005 2006
Year
BM
I
BMI - age adjusted
0.750
0.775
0.800
0.825
0.850
0.875
1995 1996 1997 1998 1999 2000 2001 2002 2003 2004 2005 2006
Year
Fem
oral
nec
k B
MD
Femoral Neck BMD - age adjustedFemoral Neck BMD - fully adjusted
Invited Oral Presentation 004 -‐ How Comparable Are Hologic and GE-‐Lunar Visceral Fat Analyses?
Bo Fan1, Joseph Wilson1, John Shepherd1, Xiaping Wu2; 1University of California San Francisco, San Francisco, CA, 2Institute of Metabolism and Endocrinology, Hunan, China
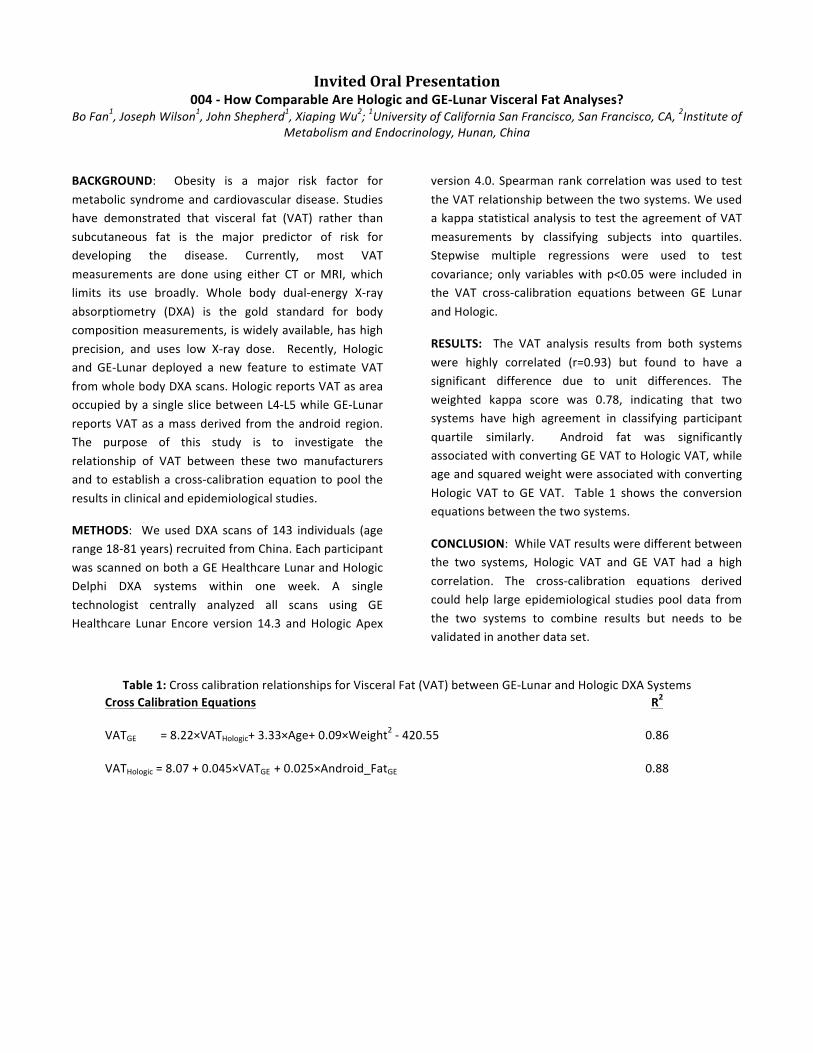
BACKGROUND: Obesity is a major risk factor for metabolic syndrome and cardiovascular disease. Studies have demonstrated that visceral fat (VAT) rather than subcutaneous fat is the major predictor of risk for developing the disease. Currently, most VAT measurements are done using either CT or MRI, which limits its use broadly. Whole body dual-‐energy X-‐ray absorptiometry (DXA) is the gold standard for body composition measurements, is widely available, has high precision, and uses low X-‐ray dose. Recently, Hologic and GE-‐Lunar deployed a new feature to estimate VAT from whole body DXA scans. Hologic reports VAT as area occupied by a single slice between L4-‐L5 while GE-‐Lunar reports VAT as a mass derived from the android region. The purpose of this study is to investigate the relationship of VAT between these two manufacturers and to establish a cross-‐calibration equation to pool the results in clinical and epidemiological studies.
METHODS: We used DXA scans of 143 individuals (age range 18-‐81 years) recruited from China. Each participant was scanned on both a GE Healthcare Lunar and Hologic Delphi DXA systems within one week. A single technologist centrally analyzed all scans using GE Healthcare Lunar Encore version 14.3 and Hologic Apex
version 4.0. Spearman rank correlation was used to test the VAT relationship between the two systems. We used a kappa statistical analysis to test the agreement of VAT measurements by classifying subjects into quartiles. Stepwise multiple regressions were used to test covariance; only variables with p<0.05 were included in the VAT cross-‐calibration equations between GE Lunar and Hologic.
RESULTS: The VAT analysis results from both systems were highly correlated (r=0.93) but found to have a significant difference due to unit differences. The weighted kappa score was 0.78, indicating that two systems have high agreement in classifying participant quartile similarly. Android fat was significantly associated with converting GE VAT to Hologic VAT, while age and squared weight were associated with converting Hologic VAT to GE VAT. Table 1 shows the conversion equations between the two systems.
CONCLUSION: While VAT results were different between the two systems, Hologic VAT and GE VAT had a high correlation. The cross-‐calibration equations derived could help large epidemiological studies pool data from the two systems to combine results but needs to be validated in another data set.
Table 1: Cross calibration relationships for Visceral Fat (VAT) between GE-‐Lunar and Hologic DXA Systems
Cross Calibration Equations R2
VATGE = 8.22×VATHologic+ 3.33×Age+ 0.09×Weight2 -‐ 420.55 0.86
VATHologic = 8.07 + 0.045×VATGE + 0.025×Android_FatGE 0.88

Invited Oral Presentation 005 -‐ Imaging and Finite Element Analysis of the Spine, Hip, Radius, and Tibia Following 2 years of Treatment
with Odanacatib in Postmenopausal Women Angela M. Cheung1, Kim Brixen2, Roland Chapurlat3, T. Keaveny4, Sharmila Majumdar5, Anne De Papp6; 1University of
Toronto, Toronto, Canada 2University of Southern Denmark, Odense, Denmark, 3INSERM, Lyon, France, 4O.N. Diagnostics, Berkley, CA 5Univeristy of California, San Francisco, CA, 6Merck Sharp & Dohme Corp., Whitehouse Station, NJ
BACKGROUND: The cathepsin K inhibitor odanacatib (ODN) is in phase 3 development for postmenopausal osteoporosis. In phase 2, 5 years of ODN 50 mg once weekly progressively increased areal BMD at the lumbar spine (LS) and total hip (TH), 11.9 % and 8.5% change from baseline, respectively. ODN reduced bone resorption markers consistently, but reduced bone formation markers only transiently.
METHODS: This was a randomized, double-‐blind placebo-‐controlled trial, using quantitative computerized tomography (QCT) of the lumbar spine and hip, and high resolution peripheral (HRp)QCT of the distal radius and distal tibia. Finite element analysis (FEA) was used to estimate bone strength.
RESULTS: A total of 214 postmenopausal women, of mean age 64.0±6.8 years and baseline LS T-‐score -‐1.81±0.83, were randomized to oral ODN 50 mg or placebo (PBO) weekly for 2 years. One-‐year mean LS areal BMD % change from baseline (primary endpoint) was significantly greater for ODN than PBO (3.5% treatment difference, p<0.001). At the LS and TH by QCT after 2 years, there were significantly greater improvements with ODN than PBO in integral and trabecular volumetric BMD and in strength estimated by
QCT-‐based FEA (P<0.001 for all). Estimated femoral neck cortical thickness, cortical volume, and cortical BMC were significantly higher in odanacatib-‐treated women; and cross-‐sectional area of the cortical compartment increased with odanacatib, whereas total cross-‐sectional area did not, suggesting that cortical bone mass increased with odanacatib due to the accrual of bone mass at the endosteal envelope of the femoral neck. At the distal radius and distal tibia by HRpQCT, there were significantly greater improvements with ODN than PBO in total, trabecular, and cortical volumetric BMD (P<0.001); cortical thickness (P<0.01); and estimated strength (P<0.001) using HR-‐pQCT-‐based FEA (exploratory endpoints). At the radius, odanacatib attenuated the increase in cortical porosity that was seen in the placebo group (treatment difference in % change from baseline -‐7.7, p=0.066). Safety and tolerability were similar between treatment groups.
CONCLUSION: Odanacatib increased volumetric BMD and estimated strength at the lumbar spine, total hip, distal radius, and distal tibia. Odanacatib improved overall proximal femoral strength by FEA, in part, by increasing cortical thickness and endosteal bone apposition along with integral and trabecular BMD at the femoral neck.
Recipent of Young Investigator Award
010 -‐ Bone structure assessed by TBS measured by DXA reflects trabecular microarchitecture analyzed by µCT in bone biopsies of females with fragility fractures -‐ The clinical proof of concept
Angela Trubrich1, Heinrich Resch1, Christian Muschitz1, Afrodite Zendeli1, Thomas Gross2, Didier Hans3; 1The VINFORCE Study Group – St. Vincent Hospital – Medical Department II, Vienna, Austria, 2Institute of Lightweight Design and Structural
Biomechanics, Vienna University of Technology, Vienna, Austria, 3Center of Bone Diseases, Lausanne University Hospital, Lausanne, Switzerland
BACKGROUND: Biomechanical competence of bone is only partly explained by bone mass. Apart from material properties, microarchitecture is an important determinant of bone strength, which is assessed by invasive methods like transiliac biopsies. Alternatively Trabecular Bone Score (TBS) is a novel grey-‐scale textural analysis to estimate trabecular structure from the PA
Spine DXA. TBS correlates well with more direct measures of bone microarchitecture independent of BMD in human cadaver vertebrae. The aim of this study is to evaluate correlations between TBS and the microarchitectural parameters of transiliac bone biopsies of females with fragility fractures to proof the clinical potency and efficacy in bone quality assessment.

METHODS: In this retrospective study we evaluated structural characteristics by μCT imaging system (μCT40, Scanco, Switzerland) in transiliac bone biopsies of 12 females of similar age between 33 and 61 years having sustained fragility fractures but otherwise healthy. The measured parameters were as follows: bone volume/total volume (BV/TV); trabecular thickness (TbTh in mm); TbSp (in mm); TbN (in mm-‐1); and ConnD (expressed in mm-‐3). Furthermore PA spine was assessed by DXA (QDR 4500, Hologic Inc, USA), and site-‐matched spine TBS parameters were extracted from the DXA image using TBS iNsight software (v1.9, Medimaps SA, France).
RESULTS: Laboratory tests did not reveal any evidence of metabolic disorder. BMD values ranged from 0.650 to 1.301 g/cm² and TBS varied from 1.004 to 1.467. The BMI ranged from 18.5 to 30.8 with a mean value of 22.8 and
was correlated to TBS, BV/TV, TbSp and TbN. Following correlations between TBS and 3D parameters were identified: r=0.69 (p=0.01), -‐0.744 (p=0.005), 0.673 (p=0.017) and -‐0.93 (p=0.0001) between TBS and BV/TV, TbSp, TbN and SMI respectively. No significant correlations were found between TBS and ConnD (r = 0.39; p< 0.2) and TbTh (r = 0.38; p< 0.2).
CONCLUSIONS: Our results in younger individuals with fragility fractures showed highly significant correlations between 3D structural parameters assessed by mCt in transiliac bone biopsies and TBS. The relationship between TBS and microarchitectural parameters was indicative that a low TBS showed weak microarchitecture related to low TbN, and high TbSp as well as low BV/TV and overall a high SMI value. Our data proof that TBS seems to be a reliable tool showing the structural patterns on tissue level in transiliac bone biopsies.
Recipent of Young Investigator Award 011 -‐ Can results of the left or right half of a whole body DXA composition study effectively reflect results of a
total body composition DXA study? Jingmei Wang1, Chad Dudzek2, Kathy Dudzek2, Tom Sanchez3; 1Cooper Surgical Company, Beijing, China, 2Cooper Surgical
Company, Fort Atkinson, WI, 3Cooper Surgical Company, Socorro, NM
Dual-‐energy x-‐ray based densitometry is being referred to as the method of choice for the evaluation of total body composition. Occasionally individuals being evaluated sometimes exceed the size of the scan window so a true estimate of total body composition cannot be made. When this happens one suggestion has been to do a total body study making sure to include the entire left or right side of the body in the scan area and then use that half of the body to estimate total body lean or fat mass. In this way it is hoped that a useful estimate of body composition can be obtained. We evaluated a group of subjects to determine if soft tissue results obtained from half the body can be used to approximate whole body results.
Fifty subjects weighing between 25kg and 109kg underwent a whole body composition study using a Norland XR-‐36 scanner. DXA assessment established a Siri Underwater Equivalent Percent Fat grading of Underfat for five subjects, Healthy for 13 subjects, Overfat for 18 subjects and Obese for 14 subjects. The effectiveness with which the left or right half assessments of lean or fat reflect total body lean or fat
was tested by regression analysis within the entire population and within the four Siri grades.
Examining the relationship between left or right half total body fat to whole body fat reveals significant positive regressions [Total Body Fat = 1,736 + 1.863 (Left Side Fat) with r = 0.979, p<0.001 and Total Body Fat = 509 + 1.790 (Right Side Fat) with r = 0.981, p<0.001]. Of the two measures, the right side showed a slightly tighter relationship. Examining the relationship between left or right half total body lean mass to whole body lean mass also reveals significant positive regressions [Total Body Lean = 7512 + 1.876 (Left Side Lean) with r = 0.977, p<0.001 and Total Body Lean = 4,630 + 1.878 (Right Side Lean) with r = 0.974, p<0.001] with the right side again showing the slightly better relationship. The relationships between half body and total body fat and lean also existed when examining subjects within the four Siri composition grades.
The data support the possible use of the half body fat or lean assessment to approximate whole body fat or lean assessment when the total body fat or lean assessment cannot be obtained from the scan. The data also
indicate that a better reflection of total body fat or lean can be obtained from evaluations obtained on the right
half of the body.
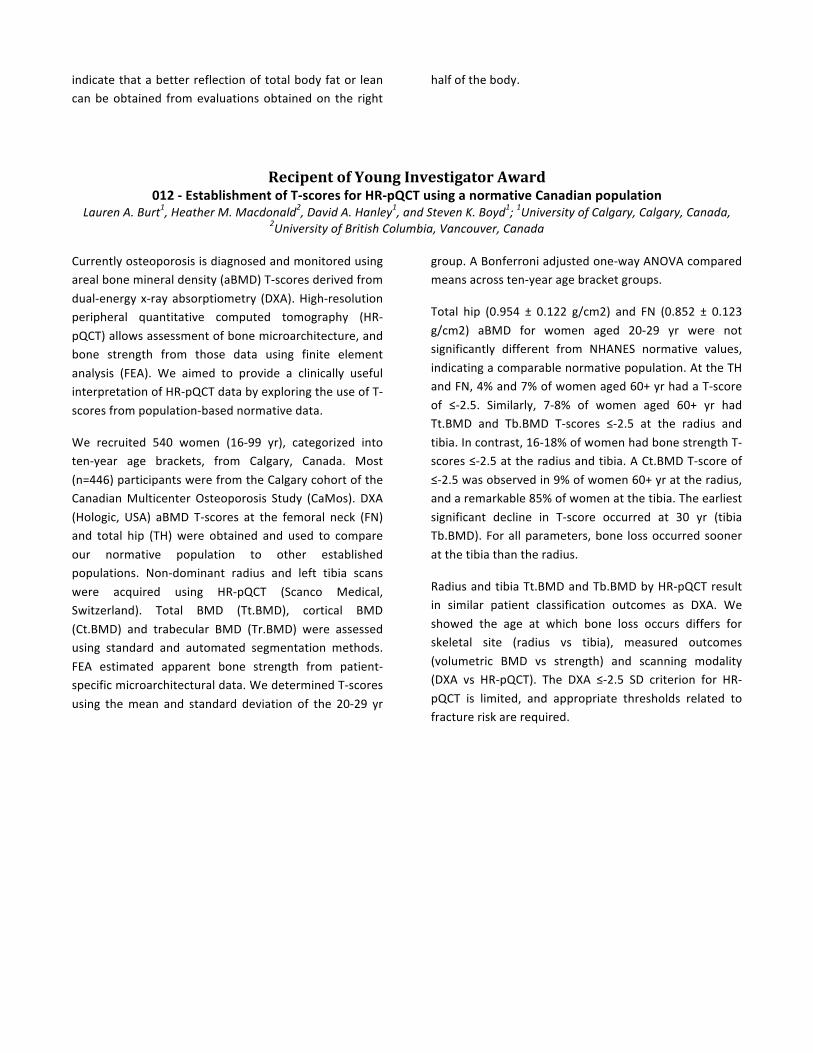
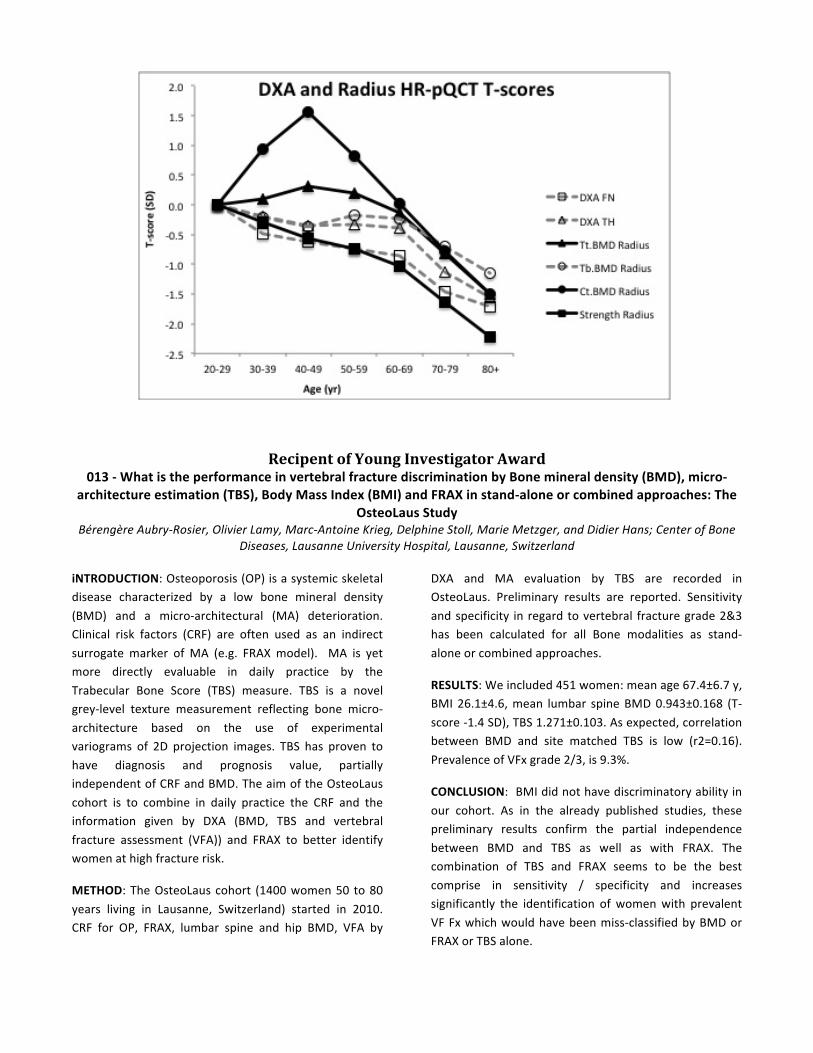
Recipent of Young Investigator Award 012 -‐ Establishment of T-‐scores for HR-‐pQCT using a normative Canadian population
Lauren A. Burt1, Heather M. Macdonald2, David A. Hanley1, and Steven K. Boyd1; 1University of Calgary, Calgary, Canada, 2University of British Columbia, Vancouver, Canada
Currently osteoporosis is diagnosed and monitored using areal bone mineral density (aBMD) T-‐scores derived from dual-‐energy x-‐ray absorptiometry (DXA). High-‐resolution peripheral quantitative computed tomography (HR-‐pQCT) allows assessment of bone microarchitecture, and bone strength from those data using finite element analysis (FEA). We aimed to provide a clinically useful interpretation of HR-‐pQCT data by exploring the use of T-‐scores from population-‐based normative data.
We recruited 540 women (16-‐99 yr), categorized into ten-‐year age brackets, from Calgary, Canada. Most (n=446) participants were from the Calgary cohort of the Canadian Multicenter Osteoporosis Study (CaMos). DXA (Hologic, USA) aBMD T-‐scores at the femoral neck (FN) and total hip (TH) were obtained and used to compare our normative population to other established populations. Non-‐dominant radius and left tibia scans were acquired using HR-‐pQCT (Scanco Medical, Switzerland). Total BMD (Tt.BMD), cortical BMD (Ct.BMD) and trabecular BMD (Tr.BMD) were assessed using standard and automated segmentation methods. FEA estimated apparent bone strength from patient-‐specific microarchitectural data. We determined T-‐scores using the mean and standard deviation of the 20-‐29 yr
group. A Bonferroni adjusted one-‐way ANOVA compared means across ten-‐year age bracket groups.
Total hip (0.954 ± 0.122 g/cm2) and FN (0.852 ± 0.123 g/cm2) aBMD for women aged 20-‐29 yr were not significantly different from NHANES normative values, indicating a comparable normative population. At the TH and FN, 4% and 7% of women aged 60+ yr had a T-‐score of ≤-‐2.5. Similarly, 7-‐8% of women aged 60+ yr had Tt.BMD and Tb.BMD T-‐scores ≤-‐2.5 at the radius and tibia. In contrast, 16-‐18% of women had bone strength T-‐scores ≤-‐2.5 at the radius and tibia. A Ct.BMD T-‐score of ≤-‐2.5 was observed in 9% of women 60+ yr at the radius, and a remarkable 85% of women at the tibia. The earliest significant decline in T-‐score occurred at 30 yr (tibia Tb.BMD). For all parameters, bone loss occurred sooner at the tibia than the radius.
Radius and tibia Tt.BMD and Tb.BMD by HR-‐pQCT result in similar patient classification outcomes as DXA. We showed the age at which bone loss occurs differs for skeletal site (radius vs tibia), measured outcomes (volumetric BMD vs strength) and scanning modality (DXA vs HR-‐pQCT). The DXA ≤-‐2.5 SD criterion for HR-‐pQCT is limited, and appropriate thresholds related to fracture risk are required.
Recipent of Young Investigator Award 013 -‐ What is the performance in vertebral fracture discrimination by Bone mineral density (BMD), micro-‐
architecture estimation (TBS), Body Mass Index (BMI) and FRAX in stand-‐alone or combined approaches: The OsteoLaus Study
Bérengère Aubry-‐Rosier, Olivier Lamy, Marc-‐Antoine Krieg, Delphine Stoll, Marie Metzger, and Didier Hans; Center of Bone Diseases, Lausanne University Hospital, Lausanne, Switzerland
iNTRODUCTION: Osteoporosis (OP) is a systemic skeletal disease characterized by a low bone mineral density (BMD) and a micro-‐architectural (MA) deterioration. Clinical risk factors (CRF) are often used as an indirect surrogate marker of MA (e.g. FRAX model). MA is yet more directly evaluable in daily practice by the Trabecular Bone Score (TBS) measure. TBS is a novel grey-‐level texture measurement reflecting bone micro-‐architecture based on the use of experimental variograms of 2D projection images. TBS has proven to have diagnosis and prognosis value, partially independent of CRF and BMD. The aim of the OsteoLaus cohort is to combine in daily practice the CRF and the information given by DXA (BMD, TBS and vertebral fracture assessment (VFA)) and FRAX to better identify women at high fracture risk.
METHOD: The OsteoLaus cohort (1400 women 50 to 80 years living in Lausanne, Switzerland) started in 2010. CRF for OP, FRAX, lumbar spine and hip BMD, VFA by
DXA and MA evaluation by TBS are recorded in OsteoLaus. Preliminary results are reported. Sensitivity and specificity in regard to vertebral fracture grade 2&3 has been calculated for all Bone modalities as stand-‐alone or combined approaches.
RESULTS: We included 451 women: mean age 67.4±6.7 y, BMI 26.1±4.6, mean lumbar spine BMD 0.943±0.168 (T-‐score -‐1.4 SD), TBS 1.271±0.103. As expected, correlation between BMD and site matched TBS is low (r2=0.16). Prevalence of VFx grade 2/3, is 9.3%.
CONCLUSION: BMI did not have discriminatory ability in our cohort. As in the already published studies, these preliminary results confirm the partial independence between BMD and TBS as well as with FRAX. The combination of TBS and FRAX seems to be the best comprise in sensitivity / specificity and increases significantly the identification of women with prevalent VF Fx which would have been miss-‐classified by BMD or FRAX or TBS alone.

Sensitivity Specificity
Single m
odels
FRAX All fracture (Swiss threshold as f(age) 23.8% 92.4%
FRAX All fracture (20% threshold) 28.6% 93.4%
BMI 20 threshold 4.8% 93.9%
Spine BMD (-‐2.5 T-‐score threshold) 33.3% 74.1%
Spine TBS (-‐1.200 threshold) 42.9% 74.6%
Combine
d mod
els
Spine BMD or TBS thresholds 59.5% 59.2%
Spine BMD or FRAX thresholds (age)* 45.2% 70.4%
Spine TBS or FRAX thresholds (age)* 52.4% 70.9%
Spine TBS or BMD or FRAX thresholds (age) 66.7% 56.2%
* similar results were found if FRAX All fracture fixed threshold was used.
Recipent of Young Investigator Award 014 -‐ Analyzing an infant whole body dxa – reflection or fusion?
C. Powers, B. Fan, J.A. Shepherd , L. Stranix-‐Chibanda, M.G. Fowler, L.A. DiMeglio, K. George , G. Siberry
BACKGROUND: Infant body composition is a marker of childhood and adult health. Few guidelines exist on the challenges of infant DXA analysis and acquisition. Our goal is to standardize positioning and analysis to allow for imputation of regions with motion artifacts using reflection of symmetrical body parts or by substitution from a duplicate scan without motion artifacts in that region. Limb reflection with offset scanning is already used for adults to create valid results for very large patients. In this study, we compared the relative accuracy of reflection and substitution imputation methods for creating whole body infant results for both bone and soft tissue composition.
METHODS: As part of the IMPAACT P1084s Study to assess bone and kidney safety of antiretrovirals, infants received whole body DXA scans. Three attempts were allowed to acquire a motion free scan, and all scans were kept. Each scan was analyzed using six regions of interest (head, left and right arm, left and right leg, trunk) and
scored as either valid (no motion, no overlap with other regions, etc.) or invalid. Intrascan correlation between left and right arms and legs and interscan precision for each region were calculated using Pearson correlation coefficients and %CV. Reflection analysis was compared to measured values using the Student’s T test. Substitution scan estimates for total body were compared using Bland-‐Altman analysis to ROIs for scans with 2 valid regions on consecutive scans.
RESULTS: Of the 229 sequentially recruited infants, 132 had repeat scans. The intrascan intra-‐region correlations ranged from 0.62 (arm BMD) and 0.98 (leg PFat). The correlations were better for soft tissue than for bone tissue. The interscan precision (%CV) for repeat measures ranged from 6.1 (right leg BMD) to 19.3 (left leg fat). There were no significant intercepts and slopes for reflection or fusion. In general, the standard deviation for the average differences of reflection regions was smaller for all regions than the interscan precision except for left

leg BMC, leg lean mass. There was a limitation of shape of the ROI boxes which may contribute to differences between regions. Clothing and positioning may also have contributed to differences between left and right regions.
CONCLUSION: The correlations between left and right were better for soft tissue than for bone measures. Whole body results created from reflected substituted values had a lower overall population standard deviation than results created using interscan substitution.
Bone Structure, Quality, Architecture, and Micro-‐Architecture
100 -‐ Association of Trabecular Bone Score (TBS) with Microarchitecture and Mechanical Behavior of Human Lumbar Vertebrae
Jean-‐Paul Roux1, Julien Wegrzyn1, Stephanie Boutroy1, Mary Bouxsein2, Didier Hans3, Roland Chapurlat1; 1INSERM, Lyon, France, 2Beth Israel Deaconess Medical Center and Harvard Medical School, Boston, MA 3Center of Bone Diseases, University of Lausanne, Lausanne, Switzerland
The measurement of areal bone mineral density (aBMD) does not predict at least half of fragility fractures, but assessment of bone microarchitecture may improve this prediction. The trabecular bone score (TBS) is a grey-‐level measure of texture using a modified version of experimental variogramm and can be extracted from DXA images (Pothuaud L. et al., Bone 42, 2008: 775-‐787). The aim of the current study was to assess whether the TBS is associated with the mechanical behavior of human lumbar vertebrae.
Lumbar vertebrae (L3) were harvested fresh from 16 human donors (7 men, 9 women, age: 82 ± 8 yrs for men and 72 ± 11 yrs for women). The antero-‐posterior and lateral BMC (g) and aBMD (g/cm2) of the vertebral body were measured using DXA (Delphi W, Hologic) and then the TBS was extracted using TBS iNsight software (Medimaps SA, France). The trabecular bone volume (Tb.BV/TV), trabecular thickness (Tb.Th), degree of anisotropy (DA), and structure model index (SMI) were measured using µCT with a 35-‐µm isotropic voxel size (Skyscan1076). Quasi-‐static uniaxial compressive testing was performed on L3 vertebral bodies under displacement control (0.5mm/min) to assess failure load (FL, N) and stiffness (STF, N/mm) .
The TBS was significantly correlated to Tb.BV/TV, SMI and stiffness (r=0.58, -‐0.62 and 0.64; p<0.02 for all), borderline not significant with FL but not with BMC or BMD. In bivariate regressions, STF was associated with TBS (r=0.64), lateral BMD (r=0.53) and apBMC (r=0.49)(all p<0.05). FL was associated with SMI (r=-‐0.56, p=0.03) and
lateral BMD (r=0.49, p=0.05) and TBS (r=0.46, p=0.07). Using stepwise regressions, the combination of TBS (first step, p=0.003), Tb.Th (second step, p=0.002) and apBMC (third step, p=0.008) was strongly associated with STF (multiple R=0.89, p<0.001). There was no other significant predictor of bone stiffness.
In conclusion, the TBS was significantly correlated to the most relevant microarchitectural parameters associated with vertebral biomechanical properties (i.e. Tb.BV/TV and SMI). In addition, the combination of TBS, Tb.Th and BMC explained up to 79% of the variability of the stiffness. These initial results suggest that TBS might improve assessment of vertebral strength in combination with standard DXA measurements.
101 -‐ Lumbar spine microarchitecture impairment evaluation in chronic kidney disease: a TBS study
Edward Leib1, Delphine Stoll2, Renaud Winzenrieth3, and Didier Hans2; 1University of Vermont College of Medicine, Burlington, VT, 2Center of Bone Diseases, Lausanne University Hospital, Lausanne, Switzerland, 3Med-‐Imaps, Pessac, France
Individuals with chronic kidney disease (CKD) have an increased risk of fracture. Areal Bone Mineral Density (aBMD) is commonly used to assess fracture risk in the general population, but the utility of measuring aBMD in CKD patients remains unclear. Bone biopsy studies at the iliac crest have demonstrated microstructural alterations at trabecular and cortical compartments in patients with CKD but sparse data exist at the axial skeleton. The aim of this study is to evaluate microarchitectural texture impairment in patients with CKD at the lumbar spine using Trabecular Bone Score(TBS).
Subjects were Non-‐Hispanic US white women from a single institution who underwent bone density testing. Control subjects were excluded if they had a historical fracture or past or present treatment or illness that might influence bone metabolism. Each CKD subject was
matched for age (±3years) and BMI (±2kg/m2) with two controls.
The study involved 47 women with CKD with a mean age 55.9±13.3yrs and BMI of 26.4±4.7kg/m2 and 94 healthy women with a mean age of 55.5±13.5yrs and BMI of 26.3±4.6kg/m2. 21% of subjects with CKD exposure to glucocorticoids 3.4% had a thyroid disease and 17% had at least one low energy fracture. 73% of subjects were postmenopausal women. Correlations between spine TBS and BMD and TBS and BMI were 0.48(p<0.01) and 0.08(p=0.4) respectively. Subjects with CKD had a significantly lower TBS (p<0.01) at the lumbar spine whereas site matched BMD was borderline non-‐significant (p=0.054). From subjects with CKD those with fracture had a significantly lower TBS (p=0.034) whereas no difference was seen for BMD (p=0.46). In subjects with CKD, TBS was associated with fracture (OR =2.5[1.02-‐6.15]; AUC=0.756[0.609-‐0.870]). Using multivariate backward logistic regression, CKD was associated with TBS (p=0.019) and a maternal history of hip fracture (p=0.012) whereas BMD, steroids, smoking and family history of osteoporosis did not reach statistically significant level to be kept into the model. TBS odds ratio per SD decrease was OR=4.67[1.29-‐16.85] after adjustment for maternal history of hip fracture.
In conclusion, CKD has a negative effect on bone microarchitectural texture, as evaluated by TBS, at the lumbar spine whereas a non-‐significant effect is seen with BMD. This study shows for the first time an impairment of axial trabecular microarchitectural texture in CKD subjects. Further studies should be performed to confirm these first results.
102 -‐ Comparison of Trabecular Bone Score Values and Precision Between a GE Lunar Prodigy and iDXA Densitometer.
Diane Krueger, Jessie Libber, Neil Binkley; University of Wisconsin Osteoporosis Clinical Research Program, Madison, WI
Trabecular Bone Score (TBS) is a new tool to assess bone structure utilizing DXA scans. TBS assigns a value from the grey-‐scale image; lower values are associated with microarchitectural deterioration and higher fracture risk. Widespread clinical use of TBS will require both comparability across instruments and stability over time.
As such, this study evaluated whether TBS differs in participants measured on a GE Lunar Prodigy and a Lunar iDXA; densitometers with differing image resolution. Additionally, we compared TBS precision between these instruments.
Existing spine DXA scans from 71 subjects who participated in a Prodigy/iDXA cross-‐calibration study were available for this study. The mean (±SD) age, BMI and L1-‐4 BMD T-‐scores were 60.5 yr (15.1), 26.2 kg/m2 (3.4) and -‐0.2 (1.5) respectively. A similar TBS comparison was performed using scans from precision assessments acquired in postmenopausal women, age ≥ 65 years, on a Prodigy and iDXA. In this second cohort (n = 30) the mean (±SD) age, BMI and L1-‐4 BMD T-‐scores were 69.5 yr (4.9), 25.9 kg/m2 (4.5) and -‐0.7 (1.1) respectively. In both cohorts, scans were obtained on each instrument the same day. Prodigy and iDXA TBS values were compared using linear regression and Bland-‐Altman analyses with Excel Analyze-‐it software. Precision was assessed in routine manner utilizing the ISCD Advanced Precision Calculator and compared using the F-‐test.
As previously reported, L1-‐L4 BMD measured by Prodigy and iDXA was highly correlated with minimal bias and no difference in precision. Prodigy and iDXA TBS values were highly correlated in the sample of 71 with an R2 of 0.86; however, a bias of -‐0.033 TBS units was observed. In the postmenopausal cohort, the TBS R2 was 0.63, with a -‐0.008 TBS unit bias. Short-‐term BMD and TBS precision values were similar between the two instruments; L1-‐4 BMD %CV = 1.5% Prodigy/1.9% iDXA; TBS %CV = 1.6% Prodigy/1.4% iDXA.
In conclusion, based on these small samples, slight TBS differences are observed between iDXA and Prodigy scans. Additional data are being obtained to evaluate if this is due to differences in DXA technology or simply reflects between-‐densitometer variation. Further study to clarify potential between-‐instrument differences in TBS, and whether these differences have clinical significance, is indicated.

103 -‐ Denosumab Treatment Is Associated With Progressive Improvements in Cortical Mass and Thickness at the Hip in Regions Relevant to Fracture Protection
Kenneth Poole1, Graham Treece1, Andrew Gee1, Jacques Brown2, Michael McClung3, Andrea Wang4, C. Libanati4; 1University of Cambridge, Cambridge, United Kingdom, 2CHUQ-‐CHUL Research Centre, Quebec City, Canada, 3Oregon Osteoporosis Center, Portland, OR, 4Amgen Inc., Thousand Oaks, CA
Denosumab (DMAb) reduces remodeling, increases BMD, and reduces cortical porosity in postmenopausal women with osteoporosis. In FREEDOM, DMAb treatment reduced the relative risk of hip fracture by 62% in those ≥ 75 years. Bone strength at the hip, estimated by FEA from QCT scans, was significantly improved from baseline and compared with placebo. To better characterize these improvements, we determined the extent and distribution of mass and thickness changes at the proximal femur using a novel cortical bone mapping technique on those same serial QCT scans.
Eighty women age 74±5 years who participated in a FREEDOM substudy underwent hip QCT scanning at baseline and months 12, 24, and 36 during DMAb (60 mg SC Q6M) or placebo treatment with daily calcium and vitamin D supplementation. For each femur, in addition
to overall cortical density, the distributions of cortical mass (in mg per unit cm2 of periosteal surface) and thickness were measured in a blinded-‐to-‐treatment manner. Distributed measures were transferred to an average femur by first registering each individual femur to this surface. Statistical parametric mapping was used to calculate significance of DMAb or placebo effects at each time point in relation to baseline, and between treatments. Distributed results were visualised as a color map over the average femur.
In DMAb-‐treated women, there was a progressive increase in cortical mass over time, reaching a difference vs placebo of ~6% at 3 years (p<0.0001; Fig. 1). Approximately 1/3 of this improvement was attributed to an increase in cortical density of 7.6±1.8 mg/cm3/year (p<0.0001), which remained unchanged in placebo subjects (p=0.62). With DMAb, cortical thickness was also significantly increased, which may represent in-‐filling of the cortical compartment. In contrast, average cortical mass and thickness decreased in subjects who received calcium and vitamin D alone. Mass color maps (Fig. 2) reveal the distribution of increases in cortical mass with DMAb, which were significant over an increasingly large area of the proximal femur and in regions where hip fractures initiate, such as the trochanteric and superior femoral neck regions.
In conclusion, in postmenopausal women with osteoporosis, administration of DMAb significantly and progressively increased cortical mass and thickness in regions of the proximal femur known to represent local
failing regions where hip fracture lines initiate in hip fracture cases.

104 -‐ TBS is superior to BMD and structural analysis by CT in analysing gender specific differences in Females and Males with fragility Fractures
Afrodite Zendeli1, Heinrich Resch1, Angela Trubrich1, Christian Muschitz1, Judith Haschka1, Didier Hans2; 1The VINFORCE Study Group – St. Vincent Hospital – Medical Department II, Vienna, Austria, 2Center of Bone Diseases, Lausanne University Hospital, Lausanne, Switzerland
BACKGROUND: In females and males different patterns of microstructure are leading finally to osteoporosis related fractures. Usually in men, trabecular thinning rather than loss of connectivity tends to dominate. The aim of the study was to compare gender specific structural characteristics with different imaging modalities. Microstructural parameters were assessed by micro-‐tomographic imaging systems in transiliac bone biopsies as well as by a non invasive method, Spine Trabecular Bone Score (TBS, unitless), a novel grey-‐scale textural analysis to estimate trabecular microarchitecture derived from the AP Spine DXA.
METHODS: In this retrospective study we evaluated gender specific structural characteristics by micro-‐tomographic imaging system (μCT40, Scanco, Switzerland) in transiliac bone biopsies of 22 males and 12 females of similar age between 18 and 61 years having sustained fragility fractures but otherwise healthy. Furthermore AP spine was assessed by DXA (QDR 1000, Hologic Inc, USA) and site-‐matched spine TBS parameters were extracted from the DXA image using TBS iNsight software (v1.9, Medimaps SA, France). TBScan differentiate between 3D microarchitectures that exhibit the same BMD but different trabecular characteristics.
RESULTS: Most of the 3D parameters measured with µCT were significantly correlated with the Spine TBS. These correlations tended to be higher in females than in males. BMD of the lumbar spine (0.966±0.15 vs 0.973±0.138 g/cm2, NS) was similar in both gender groups. Similarly using the µCT, we failed to observe gender specific differences in the parameters of microstructure like BV/TV, ConnD, SMI, Tb.N, Tb.Th, Tb.Sp, TB.(1/N).SD. However, mean TBS of the spine was significantly lower in males than in females (1.165 ±0.119 vs 1.288 ± 0.133; p<0.005).
CONCLUSIONS: In younger individuals with primary osteoporosis there are no significant differences
between DXA BMD and 3D structural parameters between the two genders, while TBS is significantly lower in the males. In this context most of the structure parameters were correlated with TBS in the total group, in the female subgroup but not in the male patients. These findings lead to the suggestion that the lower TBS in males is not reflected by structure parameters of iliac crest biopsies measured by uCT. In the females TBS seems to be a reliable tool showing the structural patterns on tissue level in bone biopsies.
105 -‐ More Accurate Discrimination of Elderly Women with and without Arm and Wrist Fractures by Combining Bone Shock Absorption (BSA) and DXA BMD – New Device Development
Nelson Watts, David Ralph, Robert Coleman, Neil Coleman, Diane Busch-‐James, and Cyndy Cox; Mercy Health Osteoporosis and Bone Health Services, Cincinatti, OH
Bone Shock Absorption (BSA), a noninvasive, painless technology developed to complement dual-‐energy x-‐ray absorptiometry (DXA) determinations of bone mineral density (BMD) for more accurate evaluation of osteoporotic fracture risk. The output of a BSA test is a bone “damping value.”
A previous study of women with osteoporosis demonstrated that BSA provided better discrimination between those with and without vertebral fractures than did DXA BMD. These results were extended in a new study of 73 ambulatory women ages 65 to 80, 30 who had recently suffered an arm or wrist fracture (fracture cases) and 43 control women who had no fracture at any site within 15 years. The mean ages (SD) of the fracture cases and controls were 71.5 (4.2) and 71.0 (4.1) respectively. All had DXA BMD and BSA damping value determinations. DXA BMD values were evaluated as T-‐scores. The mean (SD) T-‐score at the femoral neck for the fracture cases was -‐1.7 (0.8) and for the fracture-‐free controls was -‐1.4 (0.8) (p=0.062). Four fracture cases and 3 controls had T-‐scores ≤-‐2.5. These DXA-‐derived results met expectations that while BMD is inversely correlated with osteoporotic fractures, most fractures occur in patients who do not have osteoporosis as determined by BMD. BSA-‐determined bone damping values were also inversely correlated with fractures. The mean (SD) bone damping values measured above the right knee was 4.9 (2.3) for fracture cases and 13.1 (14.48) for controls

(p=0.018). Analyses with ROC curves returned AUCs of 0.65 for both T-‐scores (p=0.047) and BSA damping values (p=0.040). Interestingly and importantly, T-‐scores and BSA damping values were not highly correlated (Pearson correlation coefficient = 0.172; p = 0.164), suggesting that they contain independent information about fracture association. BSA damping values and DXA-‐derived T-‐scores were combined in a logistic regression model that more accurately discriminated between fracture cases and controls (ROC curve AUC = 0.70, p = 0.008) than either DXA or BSA alone. To facilitate planned multicenter studies, the BSA instrument has been improved through simplifying the data analysis interface and through reducing the size and complexity of the device to enable operation in physician offices.
If confirmed in currently planned follow-‐on studies, combining BSA and DXA results may provide an improved means to identify individuals at high risk of experiencing an osteoporosis-‐related fragility fracture.
106 -‐ Atypical Femoral Fractures: Radiographic and Histomorphometric Features in 17 Patients
Aliya Khan1, Angela Cheung2, Osama Khan1, Zohair Rahman1, Ken Pritzker2, Brian Lentle3; 1McMaster University, Oakville, Canada, 2University of Toronto, Mount Sinai, Toronto, Canada 3University of British Columbia, Vancouver, Canada
Purpose: This study describes characteristics and histomorphometric and radiographic features of atypical femoral fractures (AFF) as seen in 17 cases referred for evaluation.
METHODS: All patients referred for evaluation of AFF were reviewed. Patients meeting the ASBMR criteria for AFF were evaluated and tetracycline labelled bone biopsies were completed. Radiographs were reviewed by a radiologist.
RESULTS: All fracture lines were transverse or short oblique with thickened cortices. We report 17 cases of
AFF in patients on long term bisphosphonate (BP) therapy. 13 of 17 fractures occurred without a fall or direct trauma to the femur with 4 cases occurring after a fall from standing height. All patients were female; average age was 65 years (range 23-‐80 years). 4 of 17 cases were of Chinese descent, 4 were East Indian, with 9 being Caucasian. Average BP durations of use was 9.8 years (range 6-‐15 years). 9 of 17 patients were on alendronate, 2 patients were on risedronate, 5 patients on a combination and 1 patient on a combination of pamidronate and alendronate. Prodromal thigh or groin pain was seen in 12 of 17 patients for 1 to 15 months prior to fracture. PPI use was present in 6 patients. 2 patients were on prednisone for rheumatoid arthritis and 1 patient for asthma. 1 patient had a diagnosis of osteogenesis imperfecta type IV with history of multiple fragility fractures and experienced a femoral fracture after 12 years of IV pamidronate with features consistent with an AFF. All patients had 25OH Vit D levels > 50nmol/L. All patients with radiographic features of AFF had been on a bisphosphonate for > 6 years. 7 of 17 patients had bilateral femoral fractures.
SUMMARY: A large number of patients with radiographic features of an AFF had mineralization abnormalities on tetracycline labelled bone biopsy. They had normal or mildly reduced vitamin D levels. Decreased bone formation was seen in 3 patients. A significant number of patients were of Asian descent (8 of 17). 13 of the 17 AFFs occurred in the absence of a fall. Prodromal pain was commonly seen. PPIs were used in 6 of 17 patients.
CONCLUSIONS: Histomorphometric features seen on bone biopsy included mineralization abnormalities and decreased bone formation. Improved understanding of the pathophysiology leading to these fractures may be gained with further data in larger numbers of patients. A further evaluation of all AFFs with identification of predisposing clinical risk factors is needed.

Risk Assessment
107 -‐ Osteoporosis Treatment Does Not Explain Decreasing Temporal Trends in Fracture Rates: A Population-‐Based Analysis
William Leslie1, Lisa Lix1, Marina Yogendran1, Suzanne Morin2, Colleen Metge1, and Sumit Majumdar3; 1University of Manitoba, Winnipeg, Canada, 2McGill University, Montreal, Canada, 3University of Alberta, Edmonton, Canada
BACKGROUND: Decreasing temporal trends in fracture rates have been reported from many developed countries but the factors responsible for these trends remain uncertain. Increased prescription of osteoporosis therapy (OTX) has been postulated to account for this trend but no data exist for or against this hypothesis.
PURPOSE: To examine whether OTX explains temporal decreases in major osteoporotic fracture rates (hip, clinical spine, forearm, and humerus) over 10 years.
METHODS: We used 10 fiscal years of data (1996/97 to 2005/06) from the Population Health Research Data Repository for the Province of Manitoba, Canada. Age-‐adjusted major osteoporotic fracture rates were calculated for women age 50 years and older using comprehensive hospital and medical claims diagnostic codes and validated non-‐traumatic fracture definitions. OTX (defined as at least 2 dispensations with systemic HRT or non-‐HRT osteoporosis medication in the prior 12-‐months) was obtained from a validated population-‐based retail pharmacy database. Generalized linear models with generalized estimating equations (GEE) were used to derive age-‐adjusted annual major osteoporotic fracture rates and test for linear temporal trends. Three models were constructed: one without OTX (base model); one with OTX as a covariate; and one that excluded women with any prior OTX use.
RESULTS: Age-‐adjusted fracture rates in women declined linearly over the 10 years whereas OTX use approximately tripled over the same time frame (linear trend p values <0.001, see Figure). The base model (i.e., without OTX) revealed that major osteoporotic fracture rates declined 17% during the 10 years of observation (from 1320 to 1130 per 100,000 women). A similar reduction was seen when OTX was included in the model (24% decline). Major osteoporotic fracture rates showed a significant and constant linear decline without OTX (-‐1.6% per year [95% CI, -‐1.3% to -‐2.0%]) and after
adjustment for OTX (-‐2.5% per year [95% CI, -‐1.8% to -‐3.2%]). Excluding women with any prior OTX use gave the same annualized reduction in fracture rates as the base model (-‐1.6% per year [95% CI, -‐1.2% to -‐2.0%]).
CONCLUSION: We observed a significant, constant and linear decrease in non-‐traumatic major osteoporotic fractures in older women over 10 years. This was unrelated to OTX use, strongly suggesting that other mechanisms are primarily responsible for the observed temporal trends.
108 -‐ Adjustment of FRAX probability according to lumbar spine Trabecular Bone Score (TBS): The Manitoba BMD Cohort
William Leslie1, John A. Kanis2, Olivier Lamy3, Helena Johansson2, Eugene V. McCloskey2, Didier Hans3; 1University of Manitoba, Winnipeg, Canada, 2University of Sheffield Medical School, Sheffield, United Kingdom 3Center of Bone Diseases, Lausanne University Hospital, Lausanne, Switzerland
TBS, a novel gray-‐level measurement derived from lumbar spine DXA image texture, is related to microarchitecture and fracture risk independently of BMD. FRAX estimates the 10-‐year probability of hip and major osteoporotic fracture (MOF) using risk factors that act independently of femoral neck BMD. We assessed the value of combining FRAX probability with lumbar spine TBS.
42,170 women age >50 years at the time of baseline DXA were identified in a database of all clinical results for Manitoba, Canada. Lumbar spine TBS was calculated blinded to clinical parameters and outcomes. Health service records were assessed for FRAX covariates at the time of DXA and for incident non-‐traumatic MOF and hip fracture codes to March 31st 2011. FRAX probabilities were calculated with BMD. Cox proportional hazards models including competing mortality were developed for time to first fracture based upon TBS (continuous or tertiles), osteoporosis medication use, and FRAX probability. Two-‐way interactions between TBS and FRAX risk factors were tested. Additional models included lumbar spine BMD and the spine-‐hip T-‐score “offset”.

The mean age of the population was 65.7 ± 9.5 y. During mean 5.6 y, incident MOFs were identified in 2661 women (674 hip fractures). Lower lumbar spine TBS and higher FRAX probabilities were found in fracture vs non fracture women (all P<0.001). TBS modulated fracture risk after adjustment for treatment and individual FRAX risk factors (hazard ratio [HR] per SD reduction in TBS: MOF 1.21 [95% CI 1.16-‐1.250, P<0.001; hip fracture 1.14 [95% CI 1.05-‐1.23), P=0.001). Results were largely unaffected by including lumbar spine BMD or spine-‐hip T-‐score “offset” in the model. A preliminary method to adjust FRAX probability based upon lumbar spine TBS tertile is shown in the Table. When used to reclassify fracture risk, this gave a significant increase in integrated
discrimination index for MOF (+1.3%, P<0.001) and hip fracture (+1.3%, P<0.001), with net reclassification improvement +4.6% for MOF (P<0.001). There was an age interaction with larger TBS effects in younger than older women age for MOF (P<0.001) and hip fracture (P=0.002).
In summary, an incremental improvement in fracture prediction was seen by using lumbar spine TBS in combination with FRAX. An approach that addresses the age-‐TBS interaction may be required. If validated in other prospective cohorts, lumbar spine TBS may become clinically useful for enhancing fracture prediction from FRAX.
* P<0.001
Acknowledgements: The authors are indebted to Manitoba Health for the provision of data (HIPC 2012/2013 -‐18). The results and conclusions are those of the authors, and no official endorsement by Manitoba Health is intended or should be inferred. This article has been reviewed and approved by the members of the Manitoba Bone Density Program Committee.
109 -‐ Combination of Quantitative Ultrasound and FRAX® in evaluation of Structural-‐functional State of Bone in Postmenopausal Women
Vladyslav Povoroznyuk, Natalia Grygorieva, Vasyl Povorozniuk; Institute of Gerontology NAMS Ukraine, Kyiv, Ukraine
The aim of the study was to estimate the informative value of quantitative ultrasound and its combination with FRAX® in evaluation of structural-‐functional state of bone in Ukrainaian postmenopausal women.
METHODS. 363 postmenopausal women aged 45-‐87 years were examined, average age 65,1±0.5 years, duration of postmenopausal period 16,5±0.5 years. Bone mineral density (BMD) was measured by Dual-‐energy X-‐ray absorptiometer (DXA) “Prodigy” and calcaneus quantitative ultrasound (QUS) “Sahara”.
The ten years probability of major osteoporotic fracture calculated with FRAX® tool.
RESULTS. There is difference in distribution of bone indexes in depending of used methods. Among women which had osteoporosis of femoral neck by DXA, 34% had osteoporosis, 57% − osteopenia, 9% − norma data by QUS. Sensitivity of QUS indexes ranging was from low to moderate, but specificity was low (with femoral neck – 38% and 39%, total hip – 63% and 34%, lumbar spine – 45% and 34%, total body – 56% and 34% accordingly). Such sensitivity and specificity increased when combining QUS with the ten years probability of major osteoporotic fracture without BMD (FRAX®) (with femoral neck – 71% and 87%, total hip – 90% and 100%, lumbar
Change to Major Osteoporotic Fracture
probability
Change to Hip Fracture probability
If L1L4TBS is in the lowest tertile: Increase 25%* Increase 30%*
If L1L4TBS is in the middle tertile (referent): No change No change
If L1L4TBS is in the highest tertile: Decrease 21%* No change

spine – 72% and 83%, total body – 79% and 91% accordingly).
CONCLUSIONS. QUS of is informative method in evaluation of structural-‐functional state of bone in postmenopausal women. Sensitivity and specificity increased when combining QUS with FRAX® from 38% and 34% up to 90% and 100% accordingly.
110 -‐ X-‐Ray Absorptiometry Indexes for Women in Postmenopausal Period with Osteoporotical Fractures
Vladyslav Povoroznyuk, Taras Mashtaler, Roman Mashtaler; Institute of Gerontology NAMS Ukraine, Kyiv, Ukraine
AIM. To estimate structural and functional condition of bone in women in postmenopausal period with osteoporotic fractures, compare the results to referent data for Ukrainian population and to compare the results of X-‐ray absorptiometry to the fracture risk rate, assessed by FRAX for women in postmenopausal period with osteoporotical fractures.
OBJECT. 39 women in postmenopausal period aged 50-‐89 years with forearm(18) and proximal hip(21) fractures, who were on treatment the Traumatology Department #1 of Lviv City Clinical Hospital of Ambulance. They were divided into 4 categories by age (50-‐59[13];60-‐69[12];70-‐79[9];80-‐89[5]).
METHODS. Nordin Index was measured with the “Osteolog” workstation, developed in the Institute of Gerontology AMS Ukraine under the direction of professor Povoroznyuk V.V. Fracture risks were estimated using FRAX.
RESULTS. We found lower cortical indexes for women in postmenopausal period with osteoporotic fractures for 50-‐59(Common IN=0,41), 60-‐69(Common IN=0,40), 70-‐79 (Common IN=0,36), 80-‐89(Common IN=0,33) age groups in comparison to referent data for Ukrainian population. Also we found lower cortical indexes for women in postmenopausal period with higher risk of
osteoporotic fracture, assessed by FRAX, independent of age.
CONCLUSION. Thus, low cortical indexes, measured with the “Osteolog” workstation are reliable predictors of high fracture risk. There is a significant correlation between low cortical indexes and high fracture risk, assessed by FRAX.
111 -‐ What is the best statistical test to calculate reproducibility in VFA reading in population-‐based cohort? A comparison between kappa of Cohen and Uniform Kappa
Bérengère Aubry-‐Rozier, Olivier Lamy, Bernard Burnand, and Didier Hans; Center of Bone Diseases, Lausanne University Hospital, Lausanne, Switzerland
Gold standard to diagnose a Vertebral Fracture (VF) is X-‐ray. A new approach so called Vertebral Fracture Assessment (VFA) has been tested in clinical conditions. VFA seems to be adequate in term of reproducibility when compared to conventional X-‐rays in clinical situation. There is no evaluation of this method in screening population-‐based cohort. In all publications regarding reproducibility of VFA, the kappa test of Cohen is the most useful statistical test. Interpretation of kappa becomes precarious if class prevalence is extremely not uniform. This is the case in population-‐based cohort, where prevalence of the event is very low. To control it a new test of agreement has been recently proposed: the uniform kappa. We aimed to calculate reproducibility in VFA reading in a screening population-‐based cohort by 2 different statistical tests: kappa of Cohen and uniform kappa.
METHOD: We performed the reproducibility analysis on 360 OsteoLaus study patients randomly chosen. The OsteoLaus cohort concerns a sub population of women (50 to 80 yo) of the Lausanne cohort CoLaus. VFA were analyzed between T4 and L4. Two independent readers have read the 360 VFA to test inter-‐reading reproducibility. We calculated Kappas regarding the dichotomies criteria: readable vertebrae yes/no, vertebral fracture yes/no, ranking readable/VFyes/VFno, for total VFA, dorsal spine and lumbar spine. We calculated Kappas for grade

0,1,2,3 and grouping grade (0+1, 2+3). We considered Landis and Koch values to interpret kappa of Cohen results (>0.81 :excellent, 0.8-‐0.61: good, 0.6-‐0.21: moderate, 0.2-‐0: bad, <0: very bad). We estimated a good result of kappa uniform >0.75.
RESULTS: 12% of vertebrae were not readable. Prevalence of VF varied from 3% to 4% (fracture/no fracture) for all vertebrae with 3 to 4% grade 1 VF, 0.6 to 1.3% grade 2 VF and 0.03% to 0.2% grade 3 VF. Inter-‐reader reproducibility by Kappa of Cohen was moderate to good (0.35 to 0.72) and good by Uniform Kappa (0.74 to 0.98) for all criteria.
DISCUSSION: VFA is well reproducible in clinical practice. In case of screening study, events are rare making the kappa of Cohen approach inappropriate in our opinion. Here we found that results by kappa of Cohen are considered moderate. Uniform kappa is not influenced by the rate of events. We found that results of uniform kappa are high. In case of research/evaluation of general population, Uniform kappa seems more accurate for reproducibility than kappa of Cohen.
112 -‐ Assessment of women microarchitecture with and without osteoporotic fracture by TBS on white non Hispanic US women
Edward Leib1, Olivier Lamy2, Renaud Winzenrieth3, Didier Hans; 1University of Vermont College of Medicine, Burlington, VT, 2Center of Bone Diseases, Lausanne University Hospital, Lausanne, Switzerland, 3Med-‐Imaps, Pessac, France
BMD alone is not sufficient to predict the fracture risk for an individual. Others parameters, such as microarchitecture play a key role in bone fragility. Several cross-‐sectional studies have shown the abilityof TBS to discriminate fractured from healthy subjects in European populations. The aim of our study is to assess the ability of TBS, evaluated at the lumbar spine, to discriminate subjects with and without fracture in a large white US population.
We present a case-‐control study on white non Hispanic US women aged 40 and older. Patients who
had prior exposure tocorticosteroids, systemic illness or who were taking medications known to affect bone metabolism were notincluded.Fractured subjects had a history of at least one low energy fracture (all osteoporotic fractures). BMD was measured at the lumbar spine (L1-‐L4) using aProdigy densitometer(GE-‐Lunar, Madison, WI, USA). TBS was calculated at L1-‐L4 directly on the same image as the BMD using the TBS iNsight® software (medimaps, Pessac, France). Descriptive statistics and tests of difference were used. Univariate and multivariate logistic regressions (backward) were used to investigate possible correlations between independent variables (weight, height, BMI, BMD and TBS) and the status of fracture. Odds ratio per standard deviation decrease (OR) and area under the ROC curve (AUC) of discriminating parameters were calculated.
After applying the selection criteria of subjects, 2182were eligible. This group consisted of 305 fractured subjects (age=59.7±8.3yrs, BMI=25.4±3.8kg/m2) and 1877 control subjects (age=57.4±7.3yrs, BMI=25.0±3.9kg/m2). Weak correlations were obtained between TBS and BMD and between TBS and BMI (r = 0.327 and r =-‐ 0.167, respectively, p <0.01). The average value of Age, Weight, BMD and TBS between the control and fractured group were significantly different (p <0.0001, p=0.02, p=0.0004, p<0.0001 respectively), whereas no difference between groups is obtained for BMI and Height (p>0.05). The OR per standard deviation decrease and the AUC for age, BMD and TBS were presented in the table below. After adjustment for age, weight, BMD, smoking, maternal and family history of fracture, TBS remained significant (but not BMD) with an OR of 1.18[1.02-‐1.35].
This study confirmsthe potential of TBS to discriminate subjects with and without fracture and thus even after adjustment for several clinical risk factors.

113 -‐ Quality Assessment of Osteoporosis: Screening and management of Veterans living in a Long Term Care Unit.
Ashley Sterrett, Catherine Garcia, Anna Muchnik, Inna Sheyner, Joanne Valeriano-‐Marcet, Helen Bateman; James A. Haley VA, University of South Florida, Tampa, Florida
OBJECTIVE: Assess the screening and treatment of Osteoporosis in a VA Long Term Care Unit, in line with VA long term plan to try to prevent future fractures.
BACKGROUND: Screening and management of osteoporosis in long term care facilities has been shown to be deficient. Despite this knowledge, identified cases of osteoporosis often go untreated.
METHODS: We performed a chart review of 64 long term care residents at James A. Haley Tampa VA
over a 3 month time period. Both male and female residents were included in the study, as well as those who had been diagnosed with insufficiency fractures in the past. Measurements included dual-‐energy X-‐ray absorbtiometry (DEXA), biochemical and hormonal studies, and functional evaluation. Other assessments included in the study were dementia, smoking history, alcohol and steroid use.
RESULTS: We found that Low Bone Mass or Osteoporosis was present in 69% of our long term care veterans. They were diagnosed either by insufficiency fracture (22%) or DEXA screening (83%). We identified 78% with dementia, 77% were overweight (> 70kg), but surprisingly only 16% were ever treated with bisphosphonate therapy.
Vitamin D level less than 20 ng/ml 3% (2) Vitamin D level between 20-‐30 ng/ml 23% (15)
Unknown Vitamin D levels 6% (4)
Number on steroids 14% (9)
Fall Risk 91% (58)
Smokers (past and current) 43% (28)
Alcohol use (past and current) 25% (16)
No Calcium supplementation 28% (18)
No Vitamin D supplementation 14% (9)
Percentage with insufficiency fractures 22% (14)
Percentage with insufficiency fractures not ever treated with bisphosphonate 79% (11)
Percentage with renal insufficiency < 30 egfr (mL/min/m2) 5% (3)
Dysphagia 63% (40)

CONCLUSION: The low rate of therapy for osteoporosis was most unexpected. The Rheumatology faculty gives annual educational lectures related to management and screening for Osteoporosis and fracture prevention targeted to health providers in the long term care unit. We have initiated a survey of health care providers at our VA to determine feedback of perceived limitations in osteoporosis screening and management to further determine future optimal interventions.
1. Paniagua MA, Malphurs JE, Samos LF. BMI and low bone mass in an elderly male nursing home population. Clinical interventions in aging 2006:1 (3) 283-‐287.
2. Parikh S, Mogun H, Avorn J, Solomon DH. Osteoporosis Medication Use in Nursing Home Patients with Fractures in 1 US State. Arch Intern Med. 2008; 168 (10):1111-‐1115.
Treatment
114 -‐ Opening the Anabolic Window: A Pilot Study of Cyclical Teriparatide and Raloxifene
Jessie Libber, Diane Krueger, Bjoern Buehring, Neil Binkley; University of Wisconsin Osteoporosis Clinical Research Program, Madison, WI
Approaches to further improve bone mineral density (BMD) are needed. Previously, the “anabolic window” paradigm has been advanced to indicate the period of time during which teriparatide (TPD) therapy produces maximal bone anabolism. As ongoing bone formation with TPD use is mitigated by a coupled increase in bone resorption, we hypothesized that cyclic use of TPD followed by a modest antiresorptive agent could enhance the bone anabolic effect. Thus, the purpose of this 6-‐month pilot study is to evaluate the effect of alternating 1-‐month cycles of TPD followed by raloxifene (RLX) compared to continuous TPD therapy.
Community-‐dwelling postmenopausal women (n = 26) with osteoporosis (T-‐score ≤ -‐2.5 and/or prior fragility fracture) were randomly assigned in a 1:1 ratio to receive either open-‐label TPD 20 mcg by daily sc injection for 6 months or to alternating cycles of TPD for 1 month followed by 1 month of daily RLX 60 mg/day. All participants received ~1000 mg of calcium from diet and supplements if needed and 1000 IU of vitamin D3 daily. Fasting serum was obtained at baseline and months 1, 1.5, 2, 2.5, 3, 4, 5 and 6 to evaluate markers of bone turnover; CTX data are reported here. BMD of the L-‐spine, proximal femur and .3 radius was measured by DXA using a GE Lunar iDXA densitometer and L-‐spine
trabecular bone score (TBS) was measured at baseline and after 3 and 6 months. Baseline group comparisons were performed by unpaired T-‐test with change over time evaluated by repeated measures ANOVA.
Participant mean age, BMI and lowest T-‐score was 67.0 years, 26.0 kg/m2 and -‐2.7; no between group differences in demographics, serum chemistries, 25(OH)D or BMD were observed. No between group differences in BMD change (all p > 0.10) were observed (Table).
TBS values were unchanged at 6 months and did not differ by group. Serum CTX increased progressively with TPD; mean increase 188% at 6 months. In the cyclic group CTX was unchanged from baseline (-‐4%) at 6 months. An undulating pattern in CTX with reductions temporally consistent with an antiresorptive effect of RLX was observed. P1NP data is being obtained.
In conclusion, 6 months of cyclic TPD/RLX produces lumbar spine BMD increases comparable to daily TPD. Differential effects on serum CTX consistent with an antiresorptive effect of RLX were observed. This pilot work supports feasibility of opening the anabolic window.

BMD % change at 6 months
Group L-‐spine Total proximal femur .3 radius TPD +5.0 -‐0.3 -‐2.5 Cyclic +4.9 +1.0 -‐1.4
115 -‐ Zoledronic Acid Prevents Bone Mineral Density Loss at the Hip, but not at the Knee, in Persons with Acute Spinal Cord Injury.
Christopher Cirnigliaro1, Michael LaFountaine1, Steven Kirshblum2, Leighann Martinez2, Pierre Asselin1, William Bauman1; 1James J. Peters VA Medical Center, Bronx, NY, 2Kessler Institute for Rehabilitation, West Orange, NJ
BACKGROUND: Spinal cord injury (SCI) results in paralysis below the level of lesion. During the first year after acute injury, the rate of BMD loss causes an absolute depletion of the sublesional skeleton, particularly at the knee, that often falls below the fracture threshold. In persons with SCI, fractures occur with minimal trauma and lead to secondary morbidity. The objective of this study was to determine the efficacy of a single dose of zoledronic acid to prevent BMD loss at the hip and knee at 6 and 12 months after acute SCI.
METHODS A prospective, open-‐label, controlled drug intervention trial was performed on 14 patients with acute SCI: 7 subjects (6 of 7 were motor complete nonambulatory) received IV zoledronic acid (5 mg) at baseline and 7 subjects (all motor complete) served as controls who received no intervention. Areal BMD was performed at baseline, 6, and 12 months by dual energy x-‐ray absorptiometry (DXA; GE LUNAR Prodigy Advance) at the hip (e.g., total hip and femoral neck) and knee (e.g., distal femur and proximal tibia).
RESULTS Compared to the treatment group, the control group lost a significantly greater percentage of BMD at 6 months at the femoral neck (-‐0.6% ± 2.9 vs.-‐11.6% ± 3.9, respectively, p < 0.001) and at the total hip (-‐3.0% ± 2.0 vs. -‐13.9% ± 5.1, respectively, p < 0.001). At 12 months, BMD continued to decline at both these regions of interest, albeit at a significantly slower rate and magnitude in the
treatment group than in the control group at the femoral neck (-‐1.5% ± 5.1 vs.-‐16.7% ± 5.2, respectively, p = 0.0001) and total hip (-‐7.2% ± 3.4 vs. -‐20.1% ± 9.8, respectively, p < 0.01). BMD was not attenuated in the treatment group compared to controls at the distal femur and proximal tibia at the 6 month (-‐8.2% ± 3.1 vs.-‐2.7% ± 5.0, respectively, p < 0.05; and -‐9.6% ± 6.3 vs.-‐4.8% ± 6.8, respectively, p = NS) and 12 month (-‐16.8% ± 5.7 vs.-‐8.4% ± 7.2, respectively, p < 0.05; and -‐18.1% ± 10.2 vs.-‐7.9% ± 12.3, respectively, p = NS).
CONCLUSIONS Zoledronic acid markedly reduced the loss of BMD at the hip in persons with acute SCI. However, the beneficial effect of zoledronic acid to preserve BMD at the knee was not observed, and the knee is the location most susceptible to fragility fracture in persons with SCI. Treatment with bisphosphonates at time of acute SCI appears to have differential treatment efficacy on regions in which trabecular (knee) or cortical bone (hip) predominate.
116 -‐ Restoration of bone mass and microarchitecture texture after hypercortisolism normalization in patients with Cushing Disease: a two years study
Eugénie Koumakis1, Renaud Winzenrieth2, Laurence Guignat1, Catherine Cormier1; 1Cochin Hospital, Paris, France, 2Med-‐Imaps, Pessac, France
Cushing disease (CD) is considered as a true model of a glucocorticoïds (GCs) effects on bone metabolism because of the minimization of confounding factors. In CD, bone loss, due to hypercortilism, is more pronounced at the lumbar spine than at the femoral neck due to a higher content in trabecular bone. This bone loss results in osteoporosis, and leads to an increase the fracture risk. Besides, several studies have shown bone mass restoration in patients with

CD after treatment. The aim of our study was to examine treatment effects on bone mineral density (BMD) and on bone microarchitecture texture assessed by TBS in subjects with CD.
This longitudinal study consists on 11 subjects (6 women and 5 men) with CD with mean age and BMI of 39.9±12.7 years and 27.1±5.0 Kg/m2 respectively. Mean 24h urinary cortisol before treatment was 957±2110µg/24h. All subjects were completely cured, i.e. 24h urinary cortisol normalization after treatment. Among these 11 subjects, 10 underwent transsphenoidal surgery whereas one subject only received medical treatments. BMD and TBS were evaluated at AP Spine (L1-‐L4) with DXA prodigy (GE-‐Lunar), QDR 4500 (Hologic), and TBS iNsight® (Med-‐Imaps) before and after the treatment. Both DXA were cross-‐calibrated using a custom-‐made phantom.
Linear regression was used to evaluate TBS and BMD modifications over time. Results were normalized at 1 and 2 years after treatment. BMD and TBS gains were expressed in % in comparison to baseline. Normalized gains in % for TBS and BMD are presented figure 1 (mean + SD). After treatment, BMD and TBS increased by 3.7 and 7.3% respectively after 1 year, and by 7.9 and 13.5% after 2 years. Before and after treatment, BMD and TBS were not correlated (p=0.35 and p=0.20 respectively)
This study is the first to report data on bone recovery at the spine both by DXA and TBS in cured subjects with CD. The absence of correlation between TBS and BMD and the better improvement of microarchitecture assessed by TBS than BMD suggest qualitative rather than quantitative bone alterations in hypercorticism-‐induced osteoporosis. This may explain some of the discrepancies between fracture rates and relatively preserved BMD measures in GC induced bone loss. Bone microarchitecture assessment could therefore be a useful and supplementary tool for fracture risk evaluation in GC induced bone loss.
117 -‐ Greater than expected increases in bone mineral density are seeing in clinical patients transitioned from alendronate to denosumab therapy
Danny Kuo and David Kendler; Prohealth Clinical Research, Vancouver, Canada
Patients previously on alendronate therapy long-‐term have generally experienced initial increases in bone mineralization with later plateauing of bone density effects. Transitioning from alendronate to denosumab therapy in a controlled clinical trial has been shown to result in greater increases in bone mineralization in patients given denosumab as compared to continuing on alendronate therapy (STAND clinical trial, Kendler, et al.). The observed increases in bone mineralization at all measured sites were limited to about 1% favoring patients on Denosumab.
We report 87 consecutive postmenopausal women, seen in our osteoporosis program, who were previously on bisphosphonate therapy. All were switched to denosumab 60 mg subcutaneously twice yearly and followed with bone density testing after one year. 27 had hip single-‐site bone density follow-‐up and 60 had lumbar bone density follow-‐up.
Patients with hip bone density follow-‐up saw mean increases in femoral neck bone density of 2.71% after switching from alendronate to denosumab and mean total hip bone density increases of 1.75% after switching. Both were highly significant with P value
less than 0.001. Patients with lumbar spine follow-‐up showed mean increases of 3.9%, at lumbar spine, which were significant at P less than 0.001.
We conclude that increases in bone mineralization are greater in clinic patients transition from
alendronate to denosumab than have been seen in clinical trials. We postulate that this may be due to poor alendronate adherence in patients not participating in a clinical trial and/or the use of generic bisphosphonate preparations which may have poorer absorption than brand.
Peripheral
118 -‐ Pointing the Finger at Screening DXA: Device Reliability Testing for Central DXA Referrals
Ann Falkenberg Olson; Winona State University – Rochester/Winona Health Services, Rochester, MN
BACKGROUND: Estimating osteoporosis impact is difficult; many people do not know their risk or if they have low bone density (BMD). Although pharmacologic therapy can reduce fracture risk, osteoporosis is often undiagnosed until fracture occurs. Adverse consequences affect health care costs; by 2025 three million fractures are predicted costing $25.3 billion unless effective preventive and intervention measures are enacted. BMD technology is used to monitor osteoporosis and in studies with BMD as a surrogate marker. Hip/spine dual energy X-‐ray absorptiometry (DXA) is the most reliable tool for BMD testing but access to central DXA is limited to onsite testing in health care organizations. Lack of scientific evidence precludes recommending BMD testing of women before menopause and of most men. An important omission from literature is effective screening techniques and identification of patients with low BMD who may benefit from early intervention. The ACCUDXA2 device is an updated accuDEXA model and is a self-‐contained table-‐top DXA densitometer measuring BMD of the non-‐dominant hand middle finger intermediate phalange. After finger scan, T-‐scores are produced in <60 seconds. Original accuDEXA demonstrated good predictability of osteoporosis and hip low BMD.
Updated ACCUDXA2 was recently FDA-‐approved for testing; improvements include “changing finger positioning so that optimal region of interest is imaged on the sensor” (J. Singer, personal communication, July 10, 2012). This improvement “identifies, stabilizes, and tests only the intermediate phalange, theoretically demonstrating higher correlation with hip DXA T-‐scores” (A. Keim & J. Singer, personal communication, July 10, 2012). Studies comparing updated ACCUDXA2 to central site DXA are recommended.
METHODS: IRB approvals were obtained. Convenience sampling: 200 community-‐dwelling adults were screened (ACCUDXA2 phalange) and tested (DXA total hip, femur neck, lumbar spine, forearm).
PROTOCOLS: Only 1 DXA and 1 ACCUDXA2 densitometers; 2 DXA technicians (ISCD precision testing criteria met); 1 certified clinical densitometrist (CCD) with 15% of BMD results reviewed by 2 CCDs. Data entered into Microsoft Excel and analyzed via SPSS/SAS and compared. ACCUDXA2 results compared to each DXA anatomic site result for reliability.
RESULTS: (completed by March 1, 2013)
CONCLUSIONS: Developing reliable BMD screening devices will support appropriate central DXA referral to detect highest risk early.
Other Density
119 -‐ A Competitive Relationship between Bone Marrow Adipose Tissue and Volumetric Bone Mineral Density across the Lifespan
Wei Shen, Gilbert Velasquez, Jun Chen, Ye Jin, Steven Hemysfield, Dympna Gallagher, Xavier Pi-‐Sunyer; St. Luke’s – Roosevelt Hospital and Institute of Human Nutrition, Columbia University, New York, NY
BACKGROUND: Several large scale studies have reported the presence of an inverse relationship between bone mineral density (BMD) and bone marrow adipose tissue (BMAT) in adults (>18 years old). This relationship has been attributed to the mesenchymal stem cells’ (MSCs) ability to differentiate into either adipocytes or osteoblasts. However, there is a paucity of studies looking at the relationship between BMD and BMAT in children and adolescents. The objectives of this study were: 1) to determine whether an inverse relationship exists between volumetric BMD (vBMD) and BMAT in children and adolescents; and 2) compare in children and adult populations the vBMD and BMAT relationship across the lifespan.
METHODS: Pelvic BMAT and bone volume were evaluated in 181 healthy girls and boys, ages 5-‐17 years, and 495 healthy men and women, ages 18 to 88 years, with T1-‐weighted whole-‐body magnetic resonance imaging (MRI). Pelvic vBMD was calculated using whole-‐body dual-‐energy X-‐ray absorptiometry (DXA) measured pelvic bone mineral content (BMC) and MRI measured bone volume. The BMAT, bone volume, subcutaneous adipose tissue, visceral adipose tissue, and skeletal muscle of each individual were determined by trained technicians in the New York Image Analysis Laboratory using image analysis software (SliceOmatic, Tomovision Inc., Montreal, QC, Canada).
RESULTS: An inverse correlation was seen between the Box-‐Cox transformed pelvic BMAT and the log transformed pelvic vBMD in children (r=-‐0.374, p<0.001) and in adults (r=-‐0.650, p<0.001). These inverse correlations remained significant (r=-‐0.323 and -‐0.509 respectively, p<0.001) after adjustment for age, sex, pubertal status or menopausal status,
weight, total body fat, subcutaneous and visceral adipose tissue, and skeletal muscle. In regression analysis, being a child or adult did not significantly contribute to pelvic BMD (p=0.995). Additionally, no significant interaction was found between child and adult status and pelvic BMAT (p=0.415).
CONCLUSION: We found an inverse relationship to exist between pelvic vBMD and pelvic BMAT in both children and adults, thereby extending previous findings of an inverse relationship in both younger and older adults. These findings provide further support for the presence of a reciprocal relationship between adipocytes and osteoblast cells.
(Supported by ISCD Developing Clinical Researcher Grant 2011, NIH NIDDK DK082937, DK42618, and HD42187)
120 – Significant Increase in Bone Area Following Teriparatide Treatment in a Patient with Spondyloepiphyseal Dysplasia
Muhammad Ahmed and Robert Blank; University of Wisconsin, Madison, WI
Teriparatide (TPT) is currently the only approved anabolic therapy for osteoporosis. It has been shown to prevent fractures and increase bone mineral density (BMD). We report a patient in whom the anabolic effect of TPT included not only an increase in BMD, but a significant increase in bone area as well.
The patient was a 32 year old female with clinically diagnosed spondyloepiphyhyseal dysplasia (SED). She first presented at age 29 for evaluation of low bone mass. She was ambulatory and reported chronic hip, knee and wrist pain but no prior fracture. She was getting regular PT. She reported a low Ca diet. Initial evaluation revealed physical exam consistent with SED, normal Ca, PO4, PTH, TSH, and Cr. 24 hour urine Ca was 187 mg. 25-‐OH vitamin D was low. DXA showed extensive degenerative changes at hip and spine (spine precluded densitometric interpretation). The femoral heads

were large, the hip joint space was obliterated, and the femoral necks were broad and short. Femoral diaphyses had unusually small diameters. Mean femoral neck BMD was 0.572 g/cm2, corresponding to a Z-‐score of -‐3.1. Following 6 months of supplemental Ca and ergocalciferol, she began TPT. She tolerates it well with no change in overall health. Repeat DXA following 1 year of therapy showed hip total BMD has increased from 0.552 g/cm2 to 0.602 g/cm2 (LSC = 0.020 g/sq cm). The cortical thickness of the femoral diaphyses in the DXA image appeared to be increased. This impression was borne out by comprarison of bone area between the 2 scans. This increased from 37.0 to 38.6 sq cm at the total hip.
We used the ISCD Advanced Precision Calculating tool to determine the least significant change (LSC) for bone area, using the same 30 duplicate scans as were used to calculate LSC for BMD at our facility. We found that the 95% LSC in total hip bone area is 0.34 sq cm. The patient’s 1.6 sq cm increase in bone area at the hip exceeds the threshold for significant change by more than a factor of 4.
This patient’s unusual anatomy, arising from SED, provided a context in which TPT therapy’s impact on bone size as well as bone density could be assessed. Following bone area may allow clinicians to quantify the modeling as well as the densitometric response to TPT therapy.

121 -‐ Adding VFA to DXA Changes Clinical Classification and Improves Detection of Fracture Risk
Jay Ginther and Dixie Burk; Cedar Valley Medical Specialists, PC, Waterloo, IA
BACKGROUND: Patients with known vertebral fractures and vertebroplasties can have "osteopenia" or "normal BMD" by DXA Doing VFA on those patients I judged to need to need VFA to fully assess fracture risk, I was always correct. That meant I was missing some vertebral fracture deformities. How many?
METHODS: We performed VFA on every DXA patient from February 2010 through September 2012. 941 patients were evaluated with VFA for the first time. We had 792 women and 149 men with a mean age of 65 years. All DXA and VFA were read by the same ISCD Certified clinician.
RESULTS: By DXA alone: 44.6% were Osteoporosis, 40.3% were Low MBD, and 15.1% were Normal BMD. Adding VFA: 76.6% were Osteoporosis, 18.1% Low BMD, and 5.1% Normal BMD. Adding VFA changed the clinical diagnosis 32.0% of the time. Further analysis by gender, age, and numbers of vertebral deformities will be presented.
CONCLUSIONS: These are small numbers from a small referral practice, and may not be typical of the general population. Many patients had "mush for bone" at the time of orthopedic surgery. Many patients were referred because their primary physicians could not confirm osteoporosis by DXA alone. However, the results are of sufficient magnitude that a much larger, multi-‐center study is warranted.
122 -‐ Assessment of the Reproducibly of 3 Methods of Soft Tissue Body Composition for the Determination of Muscle Mass in the Lower Extremities of Persons with Spinal Cord Injury
Pierre Asselin1, Christopher Cirnigliaro1, Lisa Ramirez1, Lucian Wielopolski2, William Bauman1; 1James J. Peters VA Medical Center, Bronx, NY, 2Brookhaven National Laboratory, Upton, NY
BACKGROUND: Paralysis of sublesional limbs associated with spinal cord injury (SCI) leads to severe sarcopenia. In an effort to obtain a direct measurement of muscle mass (MM), a custom designed partial body potassium (PBK) counter was developed to determine MM in the lower extremities. This device measures the naturally occurring radioisotope potassium-‐40 (40K); 98% located in the MM. PBK is a direct measurement

without exposure of radiation or magnetic fields to the subject. Reproducibility of the PBK counter was calculated and compared to dual energy x-‐ray absorptiometry (DXA) and bioelectrical impedance spectroscopy (BIS) to measure MM.
METHODS: Twenty participants (10 AB control and 10 SCI) had the MM of their legs determined with three measurement tools at two visits within a two week period: PBK, DXA and BIS. Participants obtained two measurements with each method, and were repositioned between measurements. The coefficient of variation of each device was determined using the standard equation [CV=√(∑(SD^2)/n )], of the 4 measurements by each method in the 10 subjects. Using the CV, the least significant change (LSC) was determined [LSC=2.77*CV].
RESULTS: Leg MM determined by DXA for the control group was 18.920±2.62kg with a LSC of 0.558kg (3.0%) compared to 14.3±3.8kg with a LSC of 1.39kg (8.0%) for the SCI group, which is a significantly lower MM than that of the control group (p<0.01). The BIS and the PBK absolute values are not presented because conversion from these two instruments’ units to kg is currently being developed; however, both of these measurements showed significant difference in leg MM between the SCI and control groups (BIS: p=0.049 and PBK: p<0.0001). For the PBK system, the LSC MM values were 4.6% for the control group and 5.2% for the SCI group, respectively. For the BIS measurement, the LSC MM values were 6.3% and 8.8% for the control and SCI groups, respectively.
CONCLUSIONS: The three modalities of body composition tested demonstrated lower values for MM of the legs for the SCI group than that of the control group. Among the three methods employed, PBK was observed to have the least overlap in leg MM between the SCI and control groups, and PBK showed similar reproducibility for both of these groups. DXA provided the most reproducible method for the control group. The PBK method appears to have promise as an approach to directly measure
changes in MM of the legs without radiation or magnetic field exposure.
123 -‐ Effect of Chronic Use of Alendronate on Regional Bone Mineral Density at the Proximal Femur in Osteoporosic Men
Antonio Lazzari1, Philip Dussault1, Elise Morgan2, and Samuel Davis1; 1VA Boston HCS, Boston, MA 2Boston University, Boston, MA
BACKGROUND/PURPOSE: Bisphosphonates(BIS) are the initial treatment of choice for the treatment of osteoporosis in men and women. Questions remain regarding the optimal monitoring parameters and duration of treatment with BIS since concerns have been raised about chronic use of BIS. The purpose of this study was to evaluate the effect of long-‐term use of alendronate (ALN) on regional bone density of male patients taking ALN for more than one year comparing to patients with low bone mass not taking BIS.
METHODS: 380 male veteran patients followed in an Osteoporosis Treatment and Prevention Clinic were enlisted as part of this study. Patients who had more than two BMD studies since 2006 at least one year apart were included. 39 individuals on chronic use of ALN and 22 controls (CNT) were studied. All scans were performed at bilateral proximal femur and analyzed in a iDXA GE densitomer. We studied the following standardized sites identified according to the manufacturer's specification for both the dominant and non-‐dominant proximal femora: the femoral neck (FN), Ward's triangle(W), greater trocanther(GT), and femoral shaft(FS). Data was analyzed both as annualized % change from baseline and % change from baseline. In each case, the statistical analysis was a repeated-‐measures ANOVA with treatment, time, and site as the factors.
RESULTS: Trends toward increased density over time in the treated individuals vs. controls were observed for the annualized % changes (p=0.107) and % changes (p=0.055). Post-‐hoc analyses comparing the annualized % changes among regions of the femur in the treated individuals indicated that there were

greater changes in BMD in the GT as compared to the S for the intermediate-‐duration (14-‐47 months) group and greater changes in the GT as compared to the FN for the long-‐term-‐duration (47+ months) group. (Figure 1). Greater % changes in BMD were seen in W as compared to the FN at 48 months of treatment and a trend towards greater % changes in the GT as compared to the shaft was found at 24-‐months of treatment.
CONCLUSION: We observed a degree of variability among individuals at different sites and an overall site and time specific dependence in our cohort, in that initially greater changes occur predominantly at trabecular sites as compared to more cortical sites. We also observed in this cohort that the rate of increase in BMD in the GT following 1.5 or 2 years appears to be greater than in the FN. The biomechanical implications of this site-‐specificity need to be further studied.
Central Bone and Other
124 -‐ The Effect of Extending Femur Scan Length on Bone Mineral Density Results on the Hologic Discovery-‐W Scanner
Ginnie Prater1, Lawrence Jankowski2, Frederick Peace1, Nancy Nunnally3, Leandria Burroughs3, Sarah L. Morgan4; 1The University of Alabama at Birmingham, Birmingham, AL, 2Illinois Bone & Joint Institute Ltd, Morton Grove, IL, 3The Kirklin Clinic and The University of Alabama at Birmingham, Birmingham, AL, 4The University of Alabama at Birmingham and The UAB Osteoporosis Prevention
and Treatment Clinic and DXA Facility, Birmingham, AL
BACKGROUND: A longer dual-‐energy X-‐ray absorptiometry (DXA) scan field of the hip may be useful for the detection of atypical subtrochanteric femur fractures. It has been demonstrated in a Prodigy GE/Lunar scanner (GE/Lunar, Madison, WI) that extending the scan length does not affect bone mineral density (BMD) results at the total hip or femoral neck. We hypothesized that extending the

scan field on a Hologic Discovery scanner (Hologic, Bedford, MA) would also have no effect on BMD results at the hip. The purpose of the project was to determine whether extending the length of scan field for hip scans affects BMD results at the total hip or femoral neck on Hologic Discovery systems.
METHODS: Human use approval was obtained. Thirty subjects who presented for standard of care DXA scans agreed to have paired default (15.2 cm) and extended (24.1 cm) length hip scans, with the sequence of scans (short-‐long vs. long-‐short) selected by random draw. Two identical Hologic Discovery W scanners using 13.2:7 software were used to acquire all scans without repositioning between scans. Identical default and extended scan starting positions were achieved by the use of a registration template. A single ISCD certified technologist (LJ) analyzed all scans using standard protocols.
RESULTS: Twenty-‐eight (93.3%) of the subjects were women, twenty (66.7%) were white and the mean age of the sample was 63.2 ± 11 years with a mean BMI of 28.1 ± 5 kg/m2. There was no difference in femoral neck or total hip BMD, bone mineral content (BMC) or area between the default and extended length scans (Table 1).
CONCLUSIONS: Extending the length of the scan field on a Hologic Discovery W scanner does not affect the BMD at the total hip or femoral neck. Extended femur length scans offer the potential to detect atypical subtrochanteric femur fractures during routine DXA scanning without affecting BMD results.
Table 1 Bone Mineral Density (BMD), Bone Mineral Content (BMC) and Area at the Femoral Neck and Total Hip Between the Default Length and Extended Length Scans
Region of Interest Default length Extended length p -‐ value Femoral Neck BMD 0.722 (0.120) 0.718 (.122) 0.1134 Total hip BMD 0.844 (0.135) 0.847 (0.135) 0.1415 Femoral Neck BMC 3.5203 (0.6233) 3.5183 (0.6191) 0.9395 Total hip BMC 27.193 (5.342) 27.446 (5.462) 0.2243 Femoral Neck area 4.888 (0.416) 4.907 (0.323) 0.5983 Total hip area 32.249 (3.393) 32.417 (3.492) 0.2243
125 -‐ Adapting an American Bone Density Reporting System to a French speaking Hospital… not only a matter of translation!
Sophie Zawadynski, Patrice Trolliard, Pierre-‐Alain Meche, Jérôme Lang, Osman Ratib; Hôpitaux Universitaires de Genève, Geneva, Switzerland
BACKGROUND: 4’000 DXA exams are performed annually in the Osteodensitometry Division of the Nuclear Medicine Service of Geneva University Hospital. Replacing the existing transcription-‐based reporting process with a more flexible Web-‐based solution was needed to enhance the quality
management of workflow. We describe the adaptation of the basic commercial system to our multiple requirements.
METHODS/RESULTS: Our old DXA medical reporting process relied on inefficient data dictation/transcription and correction by physicians and secretaries. We needed to translate the replacement system (BoneStation or “System”, Cardea Technology) to French, adapt it to our specific local needs, and integrate it into our current EMR. While our team is familiar with English software menus, only data output had to be
translated. We then customized the System’s osteoporosis risk factors questionnaire: more information about patients’ medications and current/past pathologies was added, FRAX score still being calculated automatically. DXA results are transferred digitally from the Hologic system to BoneStation software, including weight and height, allowing for BMI calculation. One feature of the System is to suggest a diagnostic based on T-‐score/Z-‐score and on the presence of reported low trauma fracture. While based on ISCD and IOF’s recommendations, our diagnostic rules differ slightly: we adapted the System’s suggestions to our uses, with possible manual adjustments. For follow up exams, an alert is generated on every value of BMD rates of change beyond our local LSC. Thanks to the System’s flexibility, we added open fields for personal notes. BoneStation went live on July 17, 2012. Our process time, including physician interpretation, used to take on average 6-‐11 min per report. After 2 months of the System’s use this delay was 2-‐5 min, administrative overhead was diminished and dictation transcription errors eliminated. Also, reports and scans stored in BoneStation’s database are rapidly retrievable for future patient visits or research: it’s an organized and secure storage tool. Finally, full integration with our information systems minimizes demographic entry errors.
CONCLUSIONS: Thanks to the new automated software, we gained an integrated replacement of our old medical reporting system and a substantial gain in efficiency and accuracy. Future enhancements of this comprehensive workflow solution will include data-‐mining tools allowing for clinical research studies.
126 -‐ Creation of the Age-‐Related TBS curve at Lumbar Spine in US Caucasian Women Derived from DXA
Christine Simonelli1, Edward Leib2, Michael McClung3, Renaud Winzenrieth4, Didier Hans5; 1Health East Osteoporosis Care, Woodbury, MN, 2University of Vermont College of Medicine, Burlington, VT, 3Oregon Osteoporosis Center,
Portland, OR, 4 Med-‐Imaps, Pessac, France, 5Center of Bone Diseases, Lausanne University Hospital, Lausanne, Switzerland
INTRODUCTION: Trabecular Bone Score (TBS, Med-‐Imaps, France) is an index of bone microarchitecture texture extracted from postero-‐anterior spine DXA. Previous studies reported the ability of spine TBS to differentiate between women with and without fractures from age-‐ and BMD-‐matched controls as well as to predict future fracture. In this cross-‐sectional analysis from three facilities in the US, we have investigated the age related changes of the lumbar vertebrae microarchitectural texture assessed by TBS in a cohort of US Caucasian women.
MEHODS: Subjects in the study were Non-‐Hispanic US white women aged 30 and older with a BMD Z-‐score at spine L1-‐L4 within ± 2SD. Individuals were excluded if they had fractures or were on any osteoporosis treatment and/or had any illness that would be expected to impact bone metabolism. All data have been obtained from Prodigy DXA devices (GE-‐Lunar, Madison, WI, USA). Cross-‐calibrations between the three centers were performed for TBS and BMD. BMD and TBS were evaluated at spine L1-‐L4 but also for all possible vertebrae combinations. To validate the cohort, a comparison between BMD normative data of our cohort and US Caucasian Lunar data provided by the manufacturer was done.
RESULTS: A database of 619 Caucasian US women ages 30 to 90 years was created. BMD normative data obtained from this cohort were not statistically different from the US Caucasian Lunar normative data provided by the manufacturer (p=0.30). This outcome therefore validates indirectly our cohort. TBS values at L1-‐L4 were poorly correlated with BMI (r=-‐0.17) and with weight (r=-‐0.16) and not correlated with height as expected. TBS values obtained for all lumbar vertebral combinations decreased significantly with age (see figure below). There was a linear decline of 16.0% (~-‐2.47 T-‐score) in the micro-‐architecture at L1-‐L4 between 45 and 90 years of age (vs. – 2.34 for BMD). The micro-‐architecture loss rate increases after the age of 65

years by 50% (-‐0.004 to -‐0.006). Similar results were obtained for other ROIs of the lumbar spine.
CONCLUSION: The decrease seen in lumbar TBS reflects age-‐related microarchitectural texture changes at spine. This age related microarchitectural
modification is similar to that obtained for French Caucasian women population (r²>0.99).These findings suggest that TBS normative data can be used in clinical practice to assess bone microarchitectural texture deterioration over time and improve patient management.
127 -‐ Body Composition Measurement Reproducibility is Related to Mass
Bjoern Buehring1, Irina Haller2, Jessie Libber1, Brian Johnson2, Bryan Heiderscheidt3, Neil Binkley1; 1University of Wisconsin Osteoporosis Clinical Research Program, Madison, WI, 2Essentia Institute of Rural Health, Duluth, MN, 3University of Wisconsin Orthopedics and Rehabilitation, Madison, WI
Regional body composition assessment using DXA is becoming widely used to evaluate training regimens and enhance sport performance in athletes. For such measurements, it is necessary to know what constitutes a real change over time. The
International Society for Clinical Densitometry (ISCD) recommends performing precision assessment to calculate least significant change (LSC) between measurements. As such, to allow monitoring of change over time associated with training and rehabilitation regimens, we performed precision assessments in male and female Division 1 athletes. Additionally, we explored whether a gender-‐, tissue-‐ or region-‐related difference in LSC was observed.
Division 1 athletes (30 M / 30 F) that fit completely in the scan field were studied for this precision assessment. Two total body scans on the same day were obtained using a GE Lunar iDXA densitometer
with repositioning between scans. Total, lean and fat mass LSCs were calculated for men and women at the total body and various subregions including arms, legs, and trunk using the ISCD precision calculator. Precision (i.e. %CV) was calculated in a similar fashion. Differences between men and women using Student’s T-‐tests and Wilcoxon sum rank test. Descriptive relationships of LSC and %CV with region mass were evaluated using Excel.
Mean ± SD age (years) and BMI (kg/m2) was 20.6 ± 1.3 and 25.6 ± 3.0 for the men and 19.9 ± 1.3 and 23.3 ± 2.3 for the women, with men having a greater BMI (p < 0.01). Total mass and lean mass were higher (p < 0.001) at all sites in men than women. Fat mass was higher in women compared men in arms and legs (p < 0.001). LSC values ranged from 92 g (female right arm fat) to 734 g (male trunk lean). A non-‐linear positive relationship between LSC and mass (R2=0.78) was observed that did not appear to differ by gender or type of tissue (total, fat and lean). Percent CV values ranged from 0.84 (male and female total body lean) to 22.16 (male left arm fat). There was a non-‐linear negative relation between %CV and mass (R2=0.86).
In conclusion, LSC values vary among different regions. This variation appears to be dependent on regional mass. LSC is higher and %CV smaller in regions with higher mass; this seems unrelated to gender. At this time, when interpreting serial body composition in athletes, especially if evaluating regional change, it is appropriate to perform precision assessments in individuals of similar body size to the population of interest.
128 -‐ TBS detects the fragility fracture in men
Edward Leib1, Bérengère Aubry-‐Rozier2, Renaud Winzenrieth3, Didier Hans2; 1University of Vermont College of Medicine, Burlington, VT, 2Center of Bone Diseases, Lausanne University Hospital, Lausanne, Switzerland, 3Med-‐Imaps, Pessac, France
While osteoporosis is considered as a women disease, 25% of the osteoporotic people are men. areal Bone mineral density (BMD), as evaluated by
DXA, is the gold standard used to diagnose and manage osteoporosis. Nevertheless, BMD is not sufficient to assess the fracture risk. Others parameters, such as bone microarchitecture, play key roles in bone fragility. TBS is an index of bone microarchitecture texture extracted from spine DXA. Previous studies have reported the ability of spine TBS to discriminate and predict osteoporotic fracture in women. This preliminary case-‐control study evaluates the potential diagnostic ability of TBS as a complement to BMD, by comparing men with and without fractures
Subjects eligible in this study had to be Non-‐Hispanic US white men aged 40 and older. Subjects were excluded if they had or have any treatment or illness that may influence bone metabolism. Fractured subjects were included if the presence of at least one fracture were confirmed. Cases were matched for age (±3 years) and BMD (±0.04 g/cm²) with three controls. BMD and TBS were first retrospectively evaluated at AP Spine (L1-‐L4) with prodigy densitometer (GE-‐Lunar, Madison, USA) and TBS iNsight® (Med-‐Imaps, France) in Lausanne University Hospital blinded from clinical outcome. Inter-‐group comparisons were undertaken using Student's t-‐tests or Wilcoxon signed ranks tests. Odds ratios were calculated per one standard deviation decrease as well as areas under the receiver operating curve (AUC).
After applying inclusion/exclusion criteria, 184 male subjects were deemed eligible. This group consists of 46 fractured subjects (age=63.9±13.1 years, BMI=27.2 ± 4.4 kg/m²) and 138 control subjects (age=63.2±12 years, BMI=26.7±3.8 kg/m²) matched for age (p=0,75) and BMD (p=0.35). A weak correlation was obtained, as expected, between TBS and BMD and between TBS and BMI (r=0.27 and r=-‐0.29, respectively, p<0.01). The average value of TBS between the control and fractured group was significantly different (p=0.007; ΔTBS=-‐0.062), whereas no differences were obtained for BMI, Height and Weight (p=0.41, 0.15 and 0.12 respectively). Generally speaking, TBS values in men are lower than TBS values in women The OR per

standard deviation and the AUC were OR=1.60[1.13-‐2.27] and 0.620[0.546-‐0.690] for TBS, respectively.
This study showed the potential use of TBS in men. TBS revealed a significant difference between fractured and aged-‐ and BMD-‐matched control subjects.
129 -‐ Determinants of bone mineral content at 6 months of age
Sowmya Krishnan, Steven Chernausek, Kenneth Copeland, David Fields; University of Oklahoma Health Science Center, Oklahoma City, OK
BACKGROUND: The importance of childhood bone health in preventing adult osteoporosis has been emphasized recently. However, little is known about bone mineral content (BMC) and bone mineral density (BMD) in infancy and potential factors that affect it, including maternal obesity and gender. The purpose of this study was to examine the role of potential maternal and infant factors including gender differences on BMC and BMD at 6-‐months of age.
METHODS: Term infants (n=125; 62 male and 63 female) were studied. Body composition, including BMC and BMD, was determined by dual energy X-‐ray absorptiometry (LunariDXAv11-‐30.062; Infant whole body analysis enCore 2007 software, GE, Fairfield, CT) at 6-‐months. Maternal pre-‐gravid weight and BMI was obtained by review of the medical chart.
RESULTS: The mean age of the infants at the time of recruitment was 170.1± 10.9 days. The average weight and length at 6-‐months was 7,400 ± 1,027 grams and 65.7 ± 2.7cm respectively. Of the recruited infants, 59.8% were born to normal weight moms, 18% to overweight and 22.1% to obese moms. The majority (79.2%) of recruited infants were Caucasians. No significant differences in BMC (140.8 ± 22.7 vs. 133.3± 21.8; p=0.06) and BMD (382.6 ± 29.1 vs. 375.8 ± 32.8 g; p=0.23) were observed between males and females. No differences in either BMC or BMD were found by maternal BMI status. To better understand the
potential role of independent factors (ethnicity, maternal BMI and infant body composition) that may explain BMC at 6-‐months a forward regression model was run. At 6-‐months, lean mass explained 56% of the variance in BMC with no other significant factors in the model.
CONCLUSION: BMC and BMD at 6-‐months did not differ by gender or by maternal BMI. Lean body mass was the only significant predictor of BMC and BMD. BMI is a surrogate measure of adiposity and may not accurately reflect maternal adiposity status.
130 -‐ Comparison of Lunar DXA and QCT at the Femoral Neck using Asynchronous Calibration of CT Colonography Exams.
Perry Pickhardt1, Gabriel Bodeen2, Alan Brett2, JK Brown2, Neil Binkley1; 1University of Wisconsin School of Medicine and Public Health, Madison, WI, 2Mindways Software, Austin, TX
INTRODUCTION: For patients undergoing screening CT colonography (CTC), an opportunity exists for concurrent BMD screening without additional radiation exposure or patient time using Quantitative CT (QCT). Previous studies combining CTC and QCT have focused on the spine. This study investigated the use of DXA-‐equivalent QCT “CTXA” analysis at the hip obtained using CTC exams.
METHODS: Our cohort included 33 female subjects that had a routine CTC using either a GE LightSpeed 16 or GE LightSpeed Ultra, followed by a DXA hip BMD exam using a GE Lunar Prodigy (GE Healthcare, Waukesha, WI) 0-‐9 months (mean 2.3 months) afterwards. All scans were performed between Jan 2007 and Nov 2008 with BMD reported in T-‐scores. Subject ages ranged from 49 to 86 years, mean (SD) age 61.3 (10.6) at the time of CTC. Areal BMD in T-‐scores of the proximal femur was measured from either prone or supine CTC exam using QCT Pro Version 5.0 (Mindways Software, Austin, TX) following standard workflow except that the CT scanners were calibrated by phantoms scanned in Aug 2012, that is, retrospectively of the CTC exam without the subject present.

RESULTS: CTXA BMD measurement and DXA BMD measurement were highly correlated (R2 = 0.907) with a linear relationship of DXA_BMD = 1.297*CTXA_BMD + 0.048. The SEE on the linear fit was 0.053 g/cm2. The results for CTXA T-‐Score measurement and DXA T-‐Score measurement are below, a linear relationship of DXA_Tscore = 1.034*CTXA_Tscore + 0.3. The SEE on the linear fit was 0.379 T-‐scores.
DISCUSSION: CTXA and DXA aBMD and T-‐score measurements showed good correlation despite the approximate four year gap between patient data acquisition and retrospective QCT calibration of the
CT scanners.. The SEE of 0.053 g/cm2 is comparable with figures in the literature comparing Hologic and Lunar DXA equipment [1]. The observed relationship between CTXA and Lunar DXA BMD estimates matches predictions derived from published cross-‐calibration relationships relating CTXA BMD estimates to Hologic BMD estimates [2] and then Hologic to Lunar BMD estimates. These equations capture both differences in density calibration standards as well as differences in femoral neck ROI definition. The correlation and consistency with established methods indicates that opportunistic use of CTXA T-‐scores obtained at the time of CTC can enhance osteoporosis screening.
131 -‐ Trabecular Bone Score and Bone Mineral Density of Lumbar Spine in Healthy Women: Pros and Cons
Vladyslav Povoroznyuk1, Olivier Lamy1, N. Dzerovych1, Didier Hans2; 1Institute of Gerontology NAMS Ukraine, Kyiv, Ukraine, 2Center of Bone Diseases, Lausanne University Hospital, Lausanne, Switzerland
BMD of the PA spine and proximal femur remained the gold standard for WHO classification of osteoporosis, fracture prediction and patient monitoring. Unfortunately, with age it is not infrequent to observe the presence of degenerative disease such as spinal osteoarthritis which would have a positive artifactual impact on aBMD which

could lead to an erroneous interpretation. In a previous study it has been demonstrated that apparently such artifact would have limited impact on the Trabecular Bone Score (TBS).The aim of this study was to evaluate the PA spine TBS and site matched BMD (BMDLS) in healthy women of various ages and verify how the “normal” presence of such artifact would impact the outcome.
All women who had prior exposure to corticosteroids, systemic illness or who were taking medications known to affect bone metabolism were not included. Similarly all fractured subjects were excluded from this analysis. We’ve examined 176 healthy women aged 40-‐79 years (mean age – 53.4±0.6 yrs; mean height – 1.64±0.005 m; mean weight – 80.4±1.1 kg). The patients were divided into the following age-‐dependent groups: 40-‐49 yrs (n=53), 50-‐59 yrs (n=89), 60-‐69 yrs (n=17), 70-‐79 yrs (n=17). BMD of whole body, PA lumbar spine and proximal femur were measured by DXA method (Prodigy, GEHC Lunar, Madison, WI, USA) and PA spine TBS were assessed by TBS iNsight® software package installed on our DXA machine (Med-‐Imaps, Pessac, France).
We observed a significant decrease of TBS (L1-‐L4) as a function of age (40-‐49 yrs – 1.334±0.016; 50-‐59 yrs – 1.289±0.013; 60-‐69 yrs – 1.194±0.034; 70-‐79 yrs – 1.205±0.050; F=6.56; p=0.0003) whereas PA spine BMD was significantly increasing with age (BMDLS: 40-‐49 yrs – 1.260±0.015 g/cm2; 50-‐59 yrs – 1.234±0.013 g/cm2; 60-‐69 yrs – 1.343±0.053 g/cm2; 70-‐79 yrs – 1.348±0.100 g/cm2; F=4.04; p=0.008). In this population, BMD of femoral neck didn’t show any significant variations.
TBS decreased with age significantly. BMD of lumbar spine significantly increased in healthy women depending on their age, as it seems to reflect the impact of aggravating spinal osteoarthritis. This contradiction can be traced to the spinal osteoarthritis and degenerative diseases progressing with age in the elderly patients. Thus, TBS is an independent parameter which has a potential diagnostic value of its own, without taking into
account the bone mineral density in case of bone degenerative diseases.
132 -‐ Improved Parameters of Bone Strength in Patients After One Year of Denosumab Treatment by Measures of Trabecular Bone Score and Femur Strength Index
Christine Simonelli1, Mary Schoeller1, Julie Morancey1, Didier Hans2; 1HealthEast Osteoporosis Care, Woodbury, MN, 2Center of Bone Diseases, Lausanne University Hospital, Lausanne, Switzerland
OBJECTIVES: The purpose of this study was to evaluate two parameters of bone strength and bone microarchitecture in addition to DXA in patients electively started on denosumab for postmenopausal osteoporosis. We measured the trabecular bone score (TBS), a parameter of trabecular bone microarchitecture from postero-‐anterior lumbar spine DXA values, and femur strength index (FSI), a measure of hip strength combining femur bone density, femur geometry, age, height and weight.
METHODS: Fifty-‐five post-‐menopausal women, mean age of 68±8.8 years, with osteoporosis who were started on denosumab 60mg by subcutaneous injection every 6 months and had bone density data obtained using GE Lunar iDXA at the start of treatment and after one year, were included in the study. All patients were from the same Osteoporosis Center in the Midwest. TBS was calculated in a blinded fashion using the TBS iNsight®v1.9, Med-‐Imaps, Pessac, Fr for scans at start of treatment and after 12 months of denosumab treatment. FSI was calculated from femur scans using a strength/stress formula (JBMR 1994, Geometric structure of the femoral neck measured using dual-‐energy X-‐ray absorptiometry). In both technologies a higher score reflects greater strength.
RESULTS: After one year of denosumab treatment, lumbar spine BMD increased 2.4% (SD 0.036, range 11.8% to -‐7.9%) and TBS increased 1.3% (SD 0.044, range 12.8% to -‐12.2%). After one year, 47% of patients exceeded the least significant change for

lumbar spine BMD and 21% for TBS with 7% losing BMD and 5% with decreased TBS. Femur strength index increased from 1.24 (SD 0.0326, range 0.7-‐2.1) to 1.32 (SD 0.315, range 0.7 -‐2.2) at one year.
CONCLUSION: In postmenopausal women with osteoporosis on denosumab treatment, we are able to show an increase in mean BMD, trabecular bone score and femur strength index at one year in most patients.
133 – Inconsistency in Filling in the Bottom of the Spine Bone Map Worsens the Precision of Reported Spine BMD
LaTarsha Whittaker, Alan Malabanan, Harold Rosen; Beth Israel Deaconess Medical Center, Boston, MA
BACKGROUND: Efforts at minimizing variability in acquisition and analysis of bone densitometry help to reduce the variance of BMD measurement, thereby lowering the LSC. We came across a patient with unexpected significant spine bone loss, until the spines were reanalyzed filling in the bone map at the bottom by drawing a line straight across the bottom of the ROI and then filling in the bone map. We hypothesized that variability from year to year in how much of the bone map was filled in at the bottom of the spine ROI contributed substantially to variability in measurement of spine BMD.
METHODS: One hundred and ten consecutive spine BMDs with defects in the bone mapping at the bottom were selected. These scans were reanalyzed with the only change being manually drawing a
straight line across the bottom of the ROI and then filling in the bone map. The difference in area, BMC, and BMD of L4 and of the total spine was assessed by Wilcoxon Signed Rank test.
RESULTS: The mean±SD change in area, BMC, and BMD for L4 when the bottom of the bone map was filled in was 0.925±0.409 cm-‐sq, 0.191±0.084 gm, and -‐0.0330±0.0127 gm/cm-‐sq, respectively. The mean±SD change in area, BMC, and BMD for total spine when the bottom of the bone map was filled in was 0.919±0.411 cm-‐sq, 0.201±0.121 gm, and -‐0.0098±0.0043 gm/cm-‐sq, respectively. All of these changes were highly statistically significant, p<0.0001. The largest individual change in total spine BMD with reanalysis was 0.0238, gm/cm-‐sq , less than the LSC of 0.026 gm/cm-‐sq in our center. We calculated an LSC(fill), where we calculated the LSC using pairs of BMDs done before and after reanalysis filling in the bottom of the spine bone map without any repositioning or rescanning. The LSC(fill) attributable just to the reanalysis of missing bone map at the bottom of the spine was 0.021 gm/cm-‐sq, suggesting that the variance caused by variability in the bottom of the spine bone map in these patients was substantial, and warrants efforts to eliminate that aspect of spine BMD variability.
CONCLUSIONS: We conclude that when there is a noticeable defect in the bottom of the spine bone map, this can be filled-‐in in a consistent and reproducible manner by drawing a line across the bottom and filling it in. This would eliminate a significant source of variability in analysis of spine BMDs, and might allow us to achieve smaller LSCs.
Recommended