A STUDY OF PREVALENCE OF INSOMNIA AMOMNG UNIVERSITIES TUNKU
ABDUL RAHMAN‟S STUDENTS
TAN SHI SHENG
A RESEARCH PROJECT SUBMITTED IN PARTIAL FULFILLMENT OF THE
REQUIREMENTS FOR THE BACHELOR OF SOCIAL SCIENCE (HONS)
PSYCHOLOGY
FACULTY OF CREATIVE INDUSTRIES UNIVERSITI TUNKU ABDUL RAHMAN
MARCH. 2011

ACKNOWLEDGEMENTS
I would like to thank Doctor Siah which is my supervisor and also my academic advisor
in University Tunku Abdul Rahman. Without his assistance, it is impossible for me to complete
this thesis successfully. I am therefore thanks to Doctor Lee Chee Siang (Turning Point
Integrated Wellness Sdn Bhd) and Low Mi Yen (Turning Point Integrated Wellness Sdn Bhd) to
give me some suggestion and guidance.
I am deeply appreciating what my parents done for me. They are always giving me
encouragement and warm for me until now. Furthermore, I must give thanks to several friends
who continue to give strong moral support for me which are: Ong Si Li, Tan Yee Ling, Ng Boon
Yong and Hong Shu Rong.
To every one of you, I thank you. This thesis has been completed by having all of your
efforts and contributions.
TAN SHI SHENG

Approval Form
This research paper attached hereto, entitled “A study of the prevalence of insomnia among
University Tunku Abdul Rahman‟s Students” prepared and submitted byTan Shi Sheng in partial
fulfillment of the requirements for the Bachelor of Social Science (Hons) Psychology is hereby
accepted.
_____________________ Date:_____________
Supervisor
Supervisor‟s name

ABSTRACT
Insomnia is common complaints in general population nowadays. It caused by different factors
such as physical (cardiovascular), behavior (daytime nap, early retirement to bed), environmental
(quietness and brightness environment), and medication (alcohol, central nervous system
stimulant). For adolescent, insomnia will affect their healthy and academic performance. In this
study, it concentrated on three researches, which are the difference between gender difference
towards insomnia, the relationship between insomnia towards stress and depression. There are
100 undergraduate students in University Tunku Abdul Rahman participated in this study.
Besides that, three subscale questionnaires which are Insomnia Severity Index (ISI), Stress
Perceived Scale (PSS-10) and Patient Health Questionnaire (PHQ-9) used in this study. The
research method that used is cross sectional design and the sampling method is convenient
sampling. Through the findings, it found that there is no significance difference among gender
towards insomnia. But it found that stress and depression is positive correlation with insomnia.
In conclusion, both genders have the equal opportunity to have insomnia. But in this study
brought important information which is depression and stress is correlated with insomnia, so it
can be a guideline for parent and educator to pay attention of the young generation.

DECLARATION
I declare that the material contained in this paper is the end result of my own work and that due
acknowledgement has been given in the bibliography and references to ALL sources be they
printed, electronic or personal.
Name : TAN SHI SHENG
Student ID: 08AAB06428
Signed : ____________________
Date : 4th March 2011

TABLE OF CONTENTS
Page
ABSTRACT i
DECLARATION ii
TABLE OF CONTENTS iii
LIST OF TABLES v
LIST OF ABBREVIATIONS vi
CHAPTERS
I INTRODUCTION
Background of the Study 1-3
Problem Statement 3
Operational Definition 3-4
Significance of study 4-5
Research questions 5
Objectives of study 6
II LITERATURE REVIEW 7-14
III METHODOLOGY
Participants 15

Apparatus 15-16
Procedure 16-18
IV FINDINGS AND ANALYSIS 19-21
V DISCUSSION AND CONCLUSION
Discussions 22-24
Finding related to broader issue and future research 24-25
Shortcoming and Recommendations for Future Study 25-26
Conclusion 27
REFERENCES 28-33
Appendix A Questionnaire 34-37
Appendix B Original data 38-51
Appendix C Calculation and Result 52-67

LIST OF TABLES
Tables Page
2.1 Mean, Standard Deviation and t value of the Insomnia Severity Index
among gender of undergraduates in UTAR
19
2.2 Pearson’s Correlations between stress and insomnia among UTAR
undergraduates.
20
2.3 Pearson’s Correlations between depression and insomnia among
UTAR undergraduates
21

LIST OF ABBREVIATIONS
UTAR : University Tunku Abdul Rahman
OSA : Obstructive Sleep Apnea
CSA : Central Sleep Apnea
ACTH : Aderenocortic Otripic Hormone
HPA : Hypothelamic-pituitary-adrenal axis
REM : Rapid Eye Movement
CMA : Comprehensive Meta Analysis
VAS : Visual Analogue Scale
ISI : Insomnia Severity Index
CES-D : Center for Epidemiologic Studies-Depression scale
BDI : Beck Depression Inventory
SIAS : Social Interaction Anxiety Scale
PHQ-9 : Patient Health Questionnaire
PSS-10 : Perceived Stress Scale

CHAPTER I
INTRODUCTION
Background of study
According to Watson, Goldberg, Arguelles, and Buchwald (2006), insomnia and
sleepiness are common complaints in general population. Insomnia can be defined as complaint
of disturbed sleep, manifested as difficulties in sleep initiation or sleep maintenance, and also as
early awakenings (Doghramji, 2006). According to Budur, Roddriguez, and Schaefer (2007),
insomnia has been classified in few ways. For instance, it can be classified as cause (primary,
secondary), symptoms (difficulty falling asleep, difficulty staying asleep, non-restorative sleep),
or duration (acute = insomnia less than 1 month, chronic = insomnia for 1 month or
longer).While all of the classifications are useful in the diagnosis of insomnia.
According to the fourth edition of the Diagnostic and Statistical Manual of Mental
Disorders (as cited in Budur, Roddriguez, Schaefer, 2007), 20% to 49% of America adults have
intermittent insomnia. According to MedicineNet (2011), Intermittent insomnia is an insomnia
that occurs from time to time and each time lasts less than a week or two. An estimated of 10%
to 20% of adults have chronic insomnia and approximately 25% of people with chronic insomnia
have primary insomnia (Budur, Roddriguez, Schaefer, 2007). According to The Free Dictionary
(2011), chronic insomnia lasts more than three weeks and primary insomnia is a dyssomnia
characterized by persistent difficulty initiating or maintaining sleep or by persistently
nonrestorative sleep. So, insomnia is prevalent among the adults in America (Budur, Roddriguez,
Schaefer, 2007).

According to Kamel and Gammack (2006), there are several causes of insomnia which
are primary specific sleep disorders, physical illness, behavioral, environmental and medication.
The examples for primary specific sleep disorder are Circadian Rhythm Disorders, Sleep Apnea
and others. According to The Free Dictionary (2011), Circadian rhythm disorder is a lack of
synchrony between the schedule of sleeping and waking required by the external environment
and that of a person‟s own circadian rhythm. While Sleep Apnea is define as a condition which
an individual stop breathing for more than ten seconds during sleep. There are three types of
sleep apnea which are Obstructive Sleep Apnea, Central Sleep Apnea and mixed sleep apnea. In
Obstructive Sleep Apnea (OSA), the breath will stop because tissue in the throat closes off the
airway and Central Sleep Apnea (CSA) is the brain centers responsible for breathing fail to send
messages to the breathing muscles. While mixed sleep apnea is the combination of the OSA and
CSA (The Free Dictionary, 2011). Next, physical illness in body systems such as cardiovascular
can lead to Insomnia. Besides several pains, menopause and psychiatric illness also play an
important role in leading a person to insomnia. Furthermore, some behaviors such as daytime
nap, early retirement to bed and else are creator of insomnia. The quietness and brightness of
environment are the factor of insomnia. Lastly, the examples for medication that will cause
insomnia are alcohol, central nervous system stimulant and others (Kamel & Gammack, 2006).
But according to the twin studies which conduct by Watson, Goldberg, Arguelles and Buchwald
(2006), insomnia is strongly influence by genetic factor.
Furthermore, Doghramji (2006), stated that insomnia can bring negative consequence
towards our activity in daily life. It will lead to ill health and predicted to have lower expectancy
in life. Insomnia is associated with daytime impairment such as fatigue, irritability, decreased
memory and concentration, also affecting many aspects of day time functioning. Between, it is
always co-related with affective disorders, substance abuse, and other physical and psychological
comorbidities (Doghramji, 2006). As Léger, Guilleminault, Bader, Lévy, and Paillard (2002),
stated that the social, insomnia is also associated with an increased risk of accidents According to
Morin, Vallieres and Ivers (2007), Clinical and Research evidence that the sleep related
cognition such as faulty beliefs, worry and attention bias play an important role in perpetuating
and worsen insomnia.
Problem Statement
Insomnia is already bringing a lot of impact towards our life. Anbar and Slothower
(2006), have studied that sleep disturbances during adolescence can lead to inadequate parental
supervision and environmental factors such as consumption of alcohol or caffeine (Gaultney,
2010). Moreover, adolescents also experience delay in the timing of sleep onset and awakening,
associated with their pubertal status, which can cause a conflict with the social demands for early
morning schooling (Anbar & Slothower, 2006). Specifically, insomnia affected up to 50% of
patients with cancer (O‟Donnell, 2004). Furthermore, Yang, Wu, Hsieh, Liu, and Lu in year
2003 stated that it may impact academic performance and health of a college student too ( as
cited as Gaultney, 2010). So, the impact of insomnia is severity in this society nowadays.
Operational definition
Stress. U.S. Department of Health and Human Services Centers for Disease Control
and Prevention (n.d) stated that stress is the influence that will disrupt one person well beings. It
may bring effects on health as well as psychological change. However, sometime stress is
beneficial just if it is not overwhelm. There are different types of stress which are positive stress,
tolerable stress and toxic stress.

Depression. According to Eby & Eby (2006), is defined as a type of affective disorder
or mood disorder that characterized by pessimism, sense of inadequacy, decrease in daily activity
and else that affect a person normal life. Moreover, if depression goes to certain extent, suicide
can be resulted. There is 10% of American who affect by depression. World Health Organization
had mentioned that depression will be the most common diseases on the earth by year 2020 (As
cited in Eby & Eby, 2006).
Significance of study
First of all, women are more likely than men to report insomnia symptoms (Bartlett,
Paisley & Desai, 2006). Buysse (2004), stated that the rates of insomnia in women are typically
20 to 50% higher than in men. Besides that, women also reported more frequent with insomnia
symptoms. Both women and men will have insomnia approximately once a month to several
times a month on average (Hamilton et al, 2007).
Epidemiologic cross-sectional studies have shown the depression is connected to
disturbed sleep (Åkerstedt, 2006). According to Bartlett, Paisley and Desai (2006), it has been
estimated that 40 to 50% of individual with insomnia also experience depression. Meanwhile,
Turek (2005), study shows depression and insomnia had been related by psychiatrics. It has been
estimated that more than 90% of patients that suffering from major depression also have sleep
disturbances which can strongly linked depression with insomnia A study of Taylor and
colleagues (as cited in Turek, 2005 ), were reaffirms the relationship of insomnia and depression.
The study found that people with insomnia were 9.82 times more likely to have “clinically
significant” depression than noninsomniacs, and increased insomnia frequency and increased
number of awakenings were related to increased depression. Besides that, in a recent literature,

psychosocial factor such as depression has been associated with insomnia severity (Bluestein,
Rutledge & Healey, 2010).
The association between insomnia and stress is well known. Stress has been found to
predate the onset of insomnia in 3 quarters of poor sleepers (Yeo, Perera, Kok & Tsoi, 1996).
The relationship between psychological stress and insomnia is similar to pain and insomnia.
Sleep disturbances may increase cancer-related distress which lead to further sleep problems,
contributing to vicious cycle in which insomnia lead to stress and stress lead to insomnia
(Theobald, 2004).
In conclusion, although there are different researchers proved that girls have the higher
rate of insomnia compare to male while insomnia is correlated with both stress and depression,
most of the samples are focus on western countries only. As we know, different countries have
different culture, value, race, life-style and personality and so on and so forth. It may lead to
different result. For instance, research done by Zhang and Wing (2006) mentioned that there are
no gender difference of insomnia in some Asian countries such as Japan and northern China.
There are only few researchers done the research about the relationship between stress and
depression towards insomnia in Asian especially the sample size is not just concentrate on
undergraduates. So, it is important to conduct this study among undergraduates in Malaysia.
Besides that, it also can find out that whether the result is same with western view. For the future,
it is not only can be a reference for educator and also parents and children.
Research Questions
The research questions are
1. Does the male have higher insomnia rate as compare with female?
2. Does any correlated between stress and insomnia?

3. Does any correlated between depression and insomnia?
Objective of study
This study is conducted to examine whether gender difference in insomnia. Besides that, it also
wants to find out whether stress and depression level have correlation with insomnia.
The hypotheses of the study include:
1. Female is easier to have insomnia compare with male.
2. There is a relationship between stress and insomnia.
3. There is a relationship between depression and insomnia.

CHAPTER II
LITERATURE REVIEW
Cognitive and Physiological model of insomnia
Insomnia is a disorder of hyperarousal experienced throughout the entire day. This
hyperarousal may exhibit itself as a state of hypervigilance during the day and hard to initiate
and maintain the sleep at night. This arousal can be explained by both cognitive and
physiological models of insomnia (Roth, 2007). According to The Free Dictionary (2011),
hypervigilance is abnormally increase arousal, responsiveness to stimuli, and scanning of the
environment for treats.
For the cognitive model of insomnia, it emphasizes that if individual worry and
rumination about life stresses will lead to sleep problem and create the acute episodes of
insomnia, especially in initiating sleep and returning back to sleep after an awakening. When the
individual begins to experience sleep difficulties, worry and rumination translate from life events
to worries about the sleep itself and about the consequences of not getting enough sleep. This
negatively-toned cognitive activity is further fueled if a sleep-related threat is detected or a sleep
deficit is perceived (Roth, 2007).
According to Roth (2007), in parallel with the cognitive models, there is another model of
the evolution of insomnia suggest that hyperarousal is primarily due to neurophysiologic or
physiologic factors. Physiological arousal has been evaluated through measurements of the
whole body metabolic rate, heart rate variability, neuroendocrine measures, and functional
neuroimaging. The role of neuroendocrine systems is mediating some of effect of serotonin of
the sleep and wake cycle (Cardinali & Pandi-Perumal, 2006). Recent studies are make
comparison between good sleepers with insomnia patients. For the metabolic rates, insomnia

patients exhibited higher metabolic rates (measured at intervals across the 24-hour day) than the
healthy controls. For the heart rate variability, it found that average heart rates were increased
and variability was decreased in all stages of sleep in insomnia patients compared to healthy
normal sleepers through 36 hour study (Roth, 2007).
According to Roth (2007), chronic activation of the stress response system in
neuroendocrine systems proved the existence of sleeping arousal. Urinary catecholamines,
Urinary free cortisol levels and Cortisol & adrenocortic otripic hormone (ACTH) make influence
in sleeping condition. According to The Free Dictionary (2011), catecholamine is a hormone to
stimulate cellular activities and carry nerve impulses through the body while ACTH is a hormone
that stimulate the secretion of cortisone and other hormone by the adrenal cortex. Cortisol is a
hormone to regulate carbohydrate metabolism, immune system and maintain blood pressure.
Urinary free cortisol levels bring influence to poor sleeper and also correlated with total wake
time of a sleeper. Besides, sleep percentage in the first stage and wake time after sleep onset are
related to urinary catecholamines. Primary insomniacs have higher level of ACTH in their
Plasma when compare to normal person especially in the evening. For these findings can prove
that Hypothelamic-pituitary-adrenal axis (HPA) is linked with pathology of chronic insomnia
(Roth, 2007). HPA is a major part of neuroendocrine system and a mechanism to interact
between glands, hormones and part of the mid-brain (The Free Dictionary, 2011).
Finally, cerebral glucose metabolism is assessed by using positron emission tomography
(PET), an indirect measure of whole brain metabolism of insomnia patients. Insomnia patients
exhibited greater cerebral glucose metabolism during waking and non-rapid eye movement
(REM) sleep states compare to healthy subjects. Moreover, research found that the insomnia
patients metabolism rate have smaller reductions from waking to non-REM sleep. These findings

suggest about the interacting neural networks involved in the inability to fall asleep, which
include an emotion- regulating system, a general arousal system and a cognitive system (Roth,
2007).
Gender differences.
Some studies found that female preponderance in patients who sought treatment for
insomnia but there is a study in year 2001 found that there was no significant different in gender.
According to Mahendran (2001), there were 85 consecutive case were reported by Insomnia
Clinic. 52.9% male, 47.15% female and the age range is 31-60 participate in this research. The
result showed that there was no significant gender difference in gender toward insomnia.
But, other studies are proposed that female is more preponderance in insomnia. First of
all, Zhang and Wing (2006), stated that there is a study to examine between the genders
differences in insomnia. The study was used different meta-analyses to investigate the sex
difference of insomnia among different conditions. 29 studies were included in this study. Meta-
analyses were analyzed by using Comprehensive Meta Analysis (CMA). There are different
analyses about gender in this study. First, it was divided the studies into 2 groups which are 4
high quality studies which have met the criteria and 25 nonquality studies which didn‟t met the
criteria. The criteria include large studies (>4999 people), semistructured/ structured diagnostic
interviews, based on stringent operational criteria. Both of them showed a female preponderance
in the risk of insomnia. Second, 29 studies were divided into 2 groups: 23 current insomnia
studies (recent 1 week to 6 months) and 6 long-term insomnia studies (recent 1 year and lifetime).
Both of them showed similar female preponderance in the risk of insomnia. Third, it compared
the sex difference in the prevalence of insomnia among elderly (≥ 65 years), middle-age (31-64
years), and young adult subjects (15-30 years).3 groups showed female is in the risk of insomnia,

but overall risk ratio progressively increased from 1.28 in young adults to 1.73 in elderly subjects.
Another analysis is the studies of different regions. 29 studies were divided into 4 continents
which are 11 studies in America, 11 studies in Europe, 5 studies in East Asia and 2 studies in
Australia. Result showed that female excess in the risk of insomnia in all regions (Zhang & Wing,
2006). Through this study of meta- analysis, it can be conclude that female is predisposition with
insomnia.
There is a study conducted by Johnson, Roth, Schultz and Breslau (2006), also reported
that the difference between gender and insomnia. The data come from random sample of 1014
adolescents who were 13 to 16 years old which are selected from households in a 400 000-
member health maintenance organization encompassing metropolitan Detroit. Interviewers used
computer-assisted structured interviews with each adolescent. Due to the analyses of insomnia
and pubertal development, onset of menses was associated with a 2.75-fold increased risk for
insomnia. There was no difference in risk for insomnia among girls before menses onset relative
to boys, but it was difference emerged after menses onset. In contrast, maturational development
was not associated with insomnia in boys. Furthermore, analyses of insomnia symptom types
reported that the association of insomnia with menses onset and the emergent gender difference
may be attributable to difficulty maintaining sleep and nonrestorative sleep symptoms of
insomnia. In conclusion, gender difference in insomnia seems to emerge in association with
onset of menses.
Besides that, according to Krystal (2004), insomnia is a disorder that can lead to
substantial impairments in the quality of life and functional capacity. While this condition more
frequently occurs in women than man. It is because insomnia is association with hormonal
changes such as menopause or late-luteal phase of menstrual cycle that are unique to women.

The relationship between hormone levels and sleep is complex, there appears an association
between decrease in circulating estrogen and progesterone and an increased propensity to
insomnia. Another factor that is contributed to the high rate of insomnia among woman is that
they are more likely to suffer from psychiatric disorders which are highly correlated with
insomnia (Krystal, 2004).
Stress and insomnia.
A research regarding the relationship between stress and insomnia in Singapore have
been conducted by Yeo et al. (1996), in Singapore, there are no study of insomnia has been
conducted in the general population. So, this study is a larger study on the prevalence of neurotic
disorders in Chinese and Malays. One in three Chinese households and all Malay households
have been selected as participants. Indians and others religion were excluded as the expected
number of affected individuals ware too low to make analysis. Yeo et al. (1996), stated that the
ages of participants are between 15 years old to 55 years old. Interviewers interviewed the same
ethnic group by using an instrument comprising 3 parts which are demographic data, part of
Diagnostic Interview Schedule covering 6 disorders which are generalized anxiety disorder,
panic disorder, obsessive compulsive disorder, phobic disorder, dysthymia, major depression and
a section question with insomnia, level of stress and suicidal behavior. It has been used Visual
analogue scale (VAS) rating the level of stress participants perceived themselves to be suffering
from and the sources of this stress. This was a measure of ongoing life stress as perceived
participants and was not an independent measure of stress. 2380 individuals have been surveyed
and 370 cases reported to have sleep problems. The result showed there are 75% of insomnia
group has reported that their stress level was in the moderate to severe ranged, compare to 60%
in the non-insomnia group. The insomnia group rate home stress is higher than work stress. For
the home stress, most of the insomnia patients are attribute their stress to their children, followed
by their parents, spouses, siblings, in-law and others. In fact, home stress was the only source
stress that was significantly higher in the insomnia group compare with non-insomnia group. The
stress in the insomnia group was attributed to immediate family members. According to The Free
Dictionary (2011), immediate family members defined as a person‟s spouse, child, child‟s
spouse, stepchild, stepchild‟s spouse, grandchild, grandchild‟s spouse, parent, stepparent, parent-
in-law or siblings. In this study, there was a positive association between insomnia and increased
stress level (Yeo et al., 1996).
According to Åkerstedt (2006), stress involved increased psychological and physiological
activation in response to demands and an activated HPA (hypothalamo-pituitary-adrenocortical)
system incompatible with normal sleep. It has stated that the sleep impairment cause further
increases in the HPA systems and promote a various cycle of stress and insomnia. Besides that,
most insomniacs attribute their problem to cognitive arousal. Årkerstedt (2006), showed that
increases in alpha and beta power and reduced delta power in somniacs with intrusive thoughts
(stress-related). Disturbed sleep in itself may raise worried about being able to sleep the
following night, which will contribute to the next night, a vicious circle thus being created.
Disturbed sleep then become a stressor in itself. In conclusion, stress and insomnia is correlated
with each other.
Depression and insomnia.
A study which has concluded that insomnia severity was significantly correlated with
depression. According to Bluestein, Rutledge and Healey (2010), this correlation cross-sectional
study was conducted in a hospital-sponsored primary care clinic, 2 urban and academic family
practice centers. There are 236 participants and the age ware 18 years old or older with clinically

significant insomnia. Survey instruments are insomnia severity index (ISI) and center for
epidemiologic studies-depression scale (CES-D). The ISI has Cronbach alpha more than .70 and
calculated Cronbach alpha in this study is .84. CES-D has high coefficients alpha more than 0.85
and calculated Cronbach alpha in this study is .88. The result showed that ISI scores is
significantly correlated (P<0.1) with depression. Depressive symptomtology has a positive
relationship with insomnia severity. It means that high depression score had significant
individual associations with insomnia severity. This study found a strong relationship between
insomnia severity and depression. In their seminal study of insomnia in primary care, Simon and
VonKorff (as cited in Bluestein, Rutledge & Healey, 2010), reported that compared with
controls, insomnia patients were significantly more likely to suffer comorbid depression.
Furthermore, Buckner, Bernert, Cromer, Joiner and Schmidt (2008), stated that there is
research to examine the relationship between depressive symptoms, insomnia and social anxiety.
The sample in this research is undergraduates. 57.4% of female and age ranged from 18 to 32
(M= 19.21, SD=1.46). The majority of the sample (88%) was in their first year and second year
in college. The Instrument that was used is Insomnia Severity Index (ISI), Beck Depression
Inventory (BDI) and Social Interaction Anxiety Scale (SIAS). Three questionnaires consist of
good internal consistency which is equal or higher than .85. The result showed that insomnia was
correlated with both depressive symptoms (r = .49, P< .01) and social anxiety (r= .49,
P< .01).Social anxiety was correlated with depressive symptoms (r= .46, P< .01) Moreover, these
findings suggest that depressive symptomatology may play a role in the relationship between
insomnia and social anxiety. It also suggested that current depressive symptoms may be critical
in explaining the existing sleep problems among individuals with clinically significant social

anxiety. Alternatively, social anxiety may lead to the simultaneous development of depressive
and insomnia symptoms (Buckner et al., 2008).
Moreover, there is an article also review the relationship between depression and sleep,
with emphasis on the foundation and clinical salience. According to Berk (2009), insomniacs
have 40-60% have the symptoms of depression, with rates of around 80%. In physiological view,
melatonin hormone is secreted nocturnally by pineal gland and its release has been used as a
marker of circadian phase. About 2 hours before sleep, melatonin will be response to dim light
conditions but depression will delay melatonin release, suggesting a phrase delay in circadian
rhythms. Furthermore, depression patient may also be supersensitive to light induced suppression
to melatonin. While lower level of melatonin in depression is a consistent finding in both
depression and bipolar disorder and there is a tendency for the circadian cycle to phase advance,
with delayed sleep and waking times. Moreover, there is 3 typical sleep symptoms in depression
which are difficulty initiating sleep (initial insomnia), difficulty maintaining sleep (mild
insomnia), and early morning waking (terminal insomnia). So, the association between insomnia
and depression has a well characterized physiological foundation with each other.

CHAPTER III
METHODOLOGY
Participant
The students in University Tunku Abdul Rahman (UTAR), Kampar has been chosen as
the population and area of the research. A sample of 100 students from the population
participates in this research. There were 50 male participants and 50 female participants. The age
range of the sample is 18 to 24 (M=20.82, SD=1.533). The mean age of male participants was
20.76 (SD=1.546) and the mean age of female participants was 20.88 (SD=1.573) ( see appendix
B4 for calculation, p. 50-51).
Apparatus
The survey included three measurement scales which are Insomnia Severity Index (ISI),
Patient Health Questionnaire (PHQ-9) and Perceived Stress Scale (PSS-10). Besides that,
demographic information such as gender and age are collected too.
Insomnia Severity Index (ISI). Insomnia as indicated by a score of equal or more than
7 marks on the Insomnia Severity Index (ISI). The ISI is a 7-item questionnaire that asks
respondents to rate the severity of recent problems with sleep onset, sleep maintenance, early
waking, and the impact of insomnia using a 5-point Likert scale (where 0 = not at all and 4
=extremely). ISI scores may range from 0 to 28. Higher scores indicate more severe insomnia,
within 4 categories: absence of insomnia (0 to 7), mild (8 to 14), moderate (15 to 21), and severe
insomnia (22 to 28). Cronbach alpha for the ISI was .84 (Bluestein, Rutledge & Healey, 2010).

Patient Health Questionnaire (PHQ-9). According to Cameron, Crawford, Lawton and
Reid (2008), PHQ-9 which consists of 9 questions designed to assess participants‟ mood over the
last two weeks and correspond to the nine diagnostic criteria for major depressive disorder
covered in Diagnostic and Statistical Manual of Mental Disorder (DSM-IV). Items are rated from
the score of 0 (not at all) to 3 (nearly every day) which according to the increased frequency of
difficulties in each criteria. Scores are summed up and range from 0 to 27. The scores can be
interpret as showing either of minimal depression (0-4), mild depression ( 5-9), moderate
depression (10-14), moderately severe depression (15-19) and severe depression (20-27). The
Cronbach‟s alpha shows that reliability coefficients of this scales range from 0.83 to 0.92 and
this can concluded that the PHQ-9 contains high internal consistency (Cameron et al., 2008).
Perceived Stress Scale (PSS-10). PSS-10 consists of 10 questions are rated on a 5-point
Likert scale format, with optional responses ranging from 0 (Never) to 4 (Very Often). The
overall score ranges from 0 (low degree of perceived stress) to 40 (high degree of perceived
stress) (Goldstein, 2007). PSS scores are obtained by reversing responses (For example, 0 = 4, 1
= 3, 2 = 2, 3 = 1 & 4 = 0) to the four positively stated items (items 4, 5, 7, & 8) and then
summing across all scale items. In the study of the PSS-10 had a Cronbach‟s α of .81(Willert,
Thulstrup,Hertz & Bonde, 2009).
Demographic Information. A brief demographic information will be collected too.
The demographic insomnia is self reported such as age and gender.
Procedure
The research design used in the study is survey research where it is designed to deal more
directly with the nature of people‟s thoughts, opinions, and feelings. A survey research design is
the overall plan or structure used to conduct the entire study. In the study, the survey research

design used is cross-sectional design. This research design is one of the most commonly used
survey research design where one or more samples are drawn from the population at one time
( Shaughnessy, Zechmeister, & Zechmeister, 2009 ). Convenient Sampling is used in this study
where participants are available and willing to participate in this study is selected.
The student will complete their questionnaires in UTAR Block G library. Library is being
chosen as the space to conduct the research because it was quiet and no disturbance while the
students complete their questionnaire. Question will be asked before they start to ensure they
were no doubts while participating in the research.
After that, one questionnaire with three subscales (Insomnia Severity Index, Perceived
Stress Scale-10 and Patient Health Questionnaire-9) is distributed to the 100 samples, which
consist of 50 males and 50 females from different course of undergraduate UTAR student.
All participants will conduct one questionnaire. Before start to do the questionnaire, there
are few reminders will explain verbally to let the students understand. First, the researcher will
explain to them that the purpose of research. Second, the result of each student is private and
confidentiality. Third, each subscale of questionnaire will complete about five minutes. Forth,
the participants need to have five minutes break before they continue the next subscale of
questionnaire. The reason is to decrease the chances of being fatigue, bored and hesitated in
answering. Fifth, the questionnaires took about 20-30 minutes to complete.
For answer the Insomnia Severity Index (ISI), the participant can only choose one answer
and circle it. Different questions have the different answer to choose. For answer the Perceived
Stress Scale (PSS-10), the participant can only choose one answer and circle it which may never,
almost never, sometimes, fairly often, and very often. For answer the Patient Health

Questionnaire (PHQ-9), can only choose one answer and circle it too which were never, almost
never, sometimes and fairly.
After questionnaires are collected, the data is summarized and analyzed the level of
insomnia, stress and depression among the participants. Independent sample T-test is used to
analyze the difference of gender toward insomnia of UTAR students. The relationship
between depression and insomnia will be used Spearman correlation test to identify whether
there are any relationship, if yes, it will also find out whether there are positive or negative
significance relationship between each other. Furthermore, the relationship between stress
and insomnia will be used Spearman correlation test to identify whether there is any
relationship too. If yes, it will also find out whether there is positive or negative significance
relationship between each other.
CHAPTER IV
FINDING & ANALYSIS
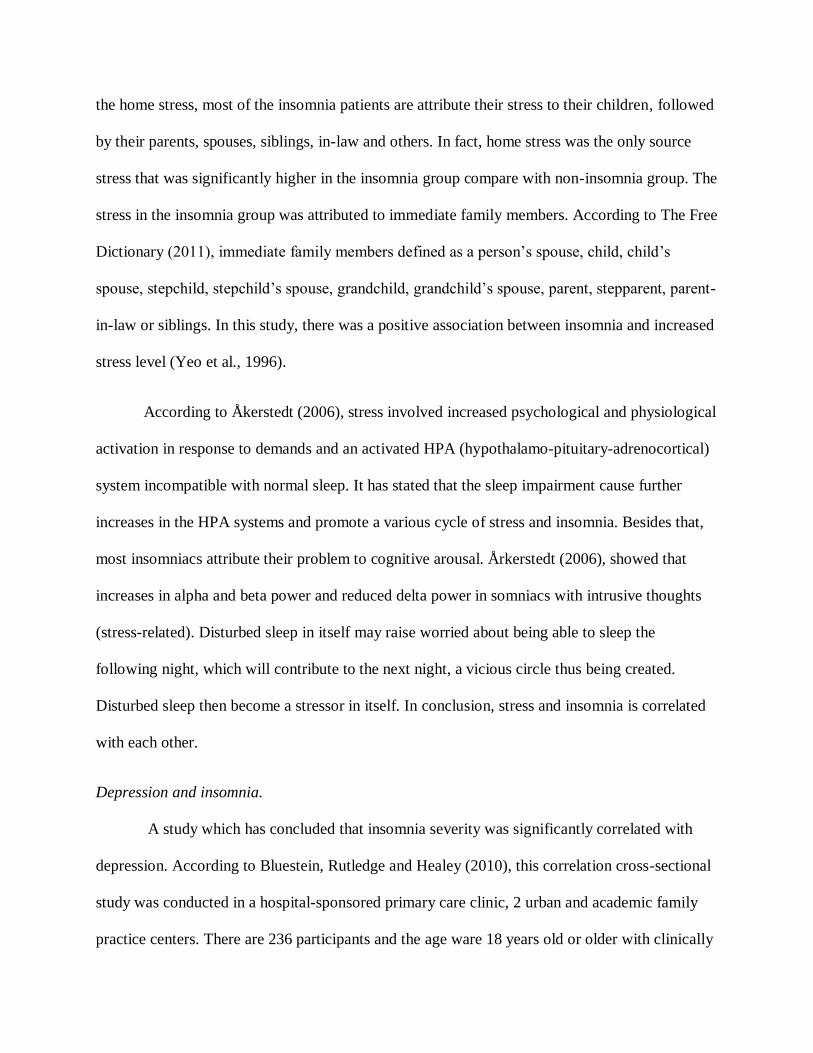
Gender VS Level of Insomnia
The first research question of this study was to assess does the male have higher insomnia
rate as compare with female. To address this question, students are separate into two groups
which are equal for both male (n=50) and female (n=50) to conduct the independent sample t-test
between gender and insomnia. The result of this analysis is shown in the table 2.1 which shows
the mean, standard deviation and t value of both gender undergraduates in UTAR.
Table 2.1
Mean, Standard Deviation and t value of the Insomnia Severity Index among gender of
undergraduates in UTAR
M SD t Df P
Male 10.12 5.944 .018 98* >0.05
Female 10.1 5.433
The result of independent sample t-test showed that there was no significant difference between
gender and insomnia among undergraduates in UTAR. t (98) =0.018,p > 0.05. (see Appendix C1
for calculation, p.53-55 )
Stress VS Level of Insomnia

The second research question of this study was to assess does any correlated between
stress and insomnia of undergraduates in UTAR. To address this question, Pearson Correlation
was conducted between the relationship between stress and insomnia of undergraduates in
UTAR. The correlation is shown in the table 2.2.
Table 2.2
Pearson’s Correlations between stress and insomnia among UTAR undergraduates.
Variable Insomnia Severity Index (ISI)
Perceived Stress Scale (PSS-10) 0.541
The result of Pearson Correlation showed that there was a significant positive correlation
between level of insomnia and stress among undergraduates in UTAR, r (98) = 0.541, p<0.05.
The higher score in insomnia severity index, the higher the score in Perceived Stress Scale. (see
appendix C2 for calculation, pg 56-61)
Depression VS Level of insomnia
The third research question of this study was to assess does any correlated between
depression and insomnia of undergraduates in UTAR. To address this question, Pearson
Correlation was conducted between the relationship between depression and insomnia of
undergraduates in UTAR. This correlation shown in table 2.3
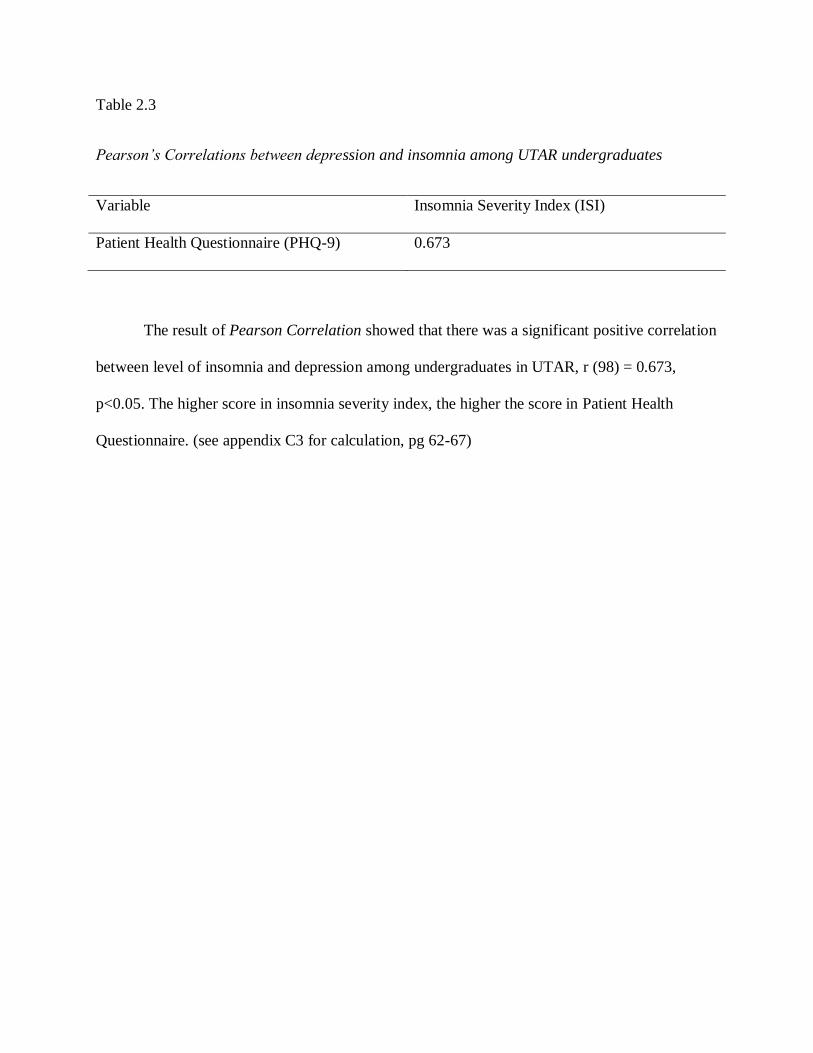
Table 2.3
Pearson’s Correlations between depression and insomnia among UTAR undergraduates
Variable Insomnia Severity Index (ISI)
Patient Health Questionnaire (PHQ-9) 0.673
The result of Pearson Correlation showed that there was a significant positive correlation
between level of insomnia and depression among undergraduates in UTAR, r (98) = 0.673,
p<0.05. The higher score in insomnia severity index, the higher the score in Patient Health
Questionnaire. (see appendix C3 for calculation, pg 62-67)

CHAPTER IV
DISCUSSION
Based on the result that I have found and statistic method that I have used which are
Independent sample t-test and Pearson Correlation test. Through the Pearson Correlation, It is
found that there is significance correlated between stress and insomnia, depression and insomnia
among UTAR undergraduates. But Independent sample t-test found that there is no significance
difference between gender towards insomnia among UTAR undergraduates.
I proposed whether male have higher insomnia rate as compare with female in the first
research question. In most of the studies, it showed that there is significant difference among
gender and female has the higher insomnia rate compare with male. For example, the research of
meta- analysis done by Zhang and Wing (2006) stated that female is more preponderance in
insomnia. However, the result of Independent sample T-test that I have done showed that there
was no significant difference between gender and insomnia among undergraduates in UTAR.
t (98) =0.018,p > 0.05. There is because of several reasons that lead to the discrepancy between
the findings in studies and the result that I done.
The first reason is female is more willing report and seeks for treatment compare with
male. According to the research done by Mahendran (2001) showed that there was no significant
gender difference towards insomnia. It is because female is more willingness to acknowledge the
problem and seek treatment compare with male. Besides that, women are more likely than men
to report insomnia symptoms too (Bartlett, Paisley & Desai, 2006). In my opinion, it will
influence the outcome of a research to be inaccurately whether there is gender difference towards
insomnia. For instance, some researchers will conduct the insomnia study in private centre, clinic,
or hospital setting, so it will lead to discrepancy and inaccurately if the female insomnia patient
is more than male insomnia patient.
Secondly, it is the region difference. Both gender from different countries have the
different life style and different personality, it will lead to different result of a research too. A
research stated that compare with other studies, female in Asian countries excess in the risk of
insomnia was the lowest and the research also mentioned that there are no gender difference of
insomnia in Asian countries such as Japan and northern China (Zhang & Wing, 2006). The
research done by Gaultney (2010) also stated that Asian students consists of less risk for
insomnia relative to white and Latino students. Therefore, it is not surprisingly that the result is
not significant.
Moreover, there is one more possibility that lead to the different in the result. The sample
size to represent the population for this research is too small compare with others researchers, it
may influence the result to be inaccurately among gender differences toward insomnia. In this
research just targeted fifty male and fifty female which total is one hundred while in the past
studies, most of the research had targeted one thousand and above respondent. For example,
Johnson et.al (2006) used 1676 respondents.
The second research question is to test the relationship between insomnia and stress.
Through the Pearson Correlation analysis that I have done, it shown that there is a significant
positive correlation between stress and insomnia [r (98) = 0.541, p<0.05]. The higher level of
insomnia is correlated with the higher level of stress. According to the research which is done by
Åkerstedt (2006), stress and insomnia is also correlated with each other. It supported the result

that I have done. Furthermore, Yeo et.al (1996) is also done the research in Singapore and
proved that there was a positive association between insomnia and increased stress level.
The third research question is to test the relationship between insomnia and depression.
Through the Pearson Correlation analysis that I have done, it shown that there is a significant
positive correlation between insomnia and depression [r (98) = 0.673, p<0.05]. This result can be
supported by Bluestein, Rutledge and Healey (2010) where they strongly stated that there is a
strong relationship between insomnia severity and depression. Moreover, the research that done
by Buckner, Bernert, Cromer, Joiner and Schmidt (2008) also showed that insomnia was
correlated with depressive symptoms. According to Taylor, Lichstein, Durrence, Reidel, Bush
(2005), increased insomnia frequency was related to increased depression. So, hypothesis of
insomnia is correlated with depression is significant.
Finding related to broader issues and future research
Although it has found out that there are no significance difference of insomnia between
male and female, it focus on UTAR undergraduates which is from age 18 to 24 only which is
youth. The United Nations, for statistical purposes, defines „youth‟, as person between the ages
of 15 and 24 years (Youth and the United Nations, n.d.). According to World Health
Organization (2011), age 60+ is taken as older generation. For the future research, it can collect
data from older generation to analysis whether there are significance differences in gender
towards insomnia.
Besides that, the result also showed that insomnia is positive correlated with depression
and stress. But we cannot prove that whether depression and stress will lead to insomnia. So, it
may find out that whether insomnia will lead to stress and depression or stress and depression

will lead to insomnia. It is important to know the answer as parents and educators have the
opportunity to have prevention in the young generation rather than cure.
There are another variable which is important to find out for the future research which is
anxiety. Even through current opinion of some researchers suggests that insomnia and anxiety
are separate entitle, their symptoms overlap considerably (Spence et al, 2004). According to
Taylor, Lichstein, Durrence, Reidel and Bush (2005), increased insomnia frequency was related
to increased anxiety. So, it is interesting to find out that whether insomnia is correlated with
anxiety.
Shortcoming and Recommendation for future study
Although all of the two of three research hypothesis are significance but there are few
assumptions which are also the limitation of the research that I conducted. First of all, it is the
number of sample that I taken from population. The sample size that I took is small as I only
took 100 samples to represent the UTAR undergraduates. So, it may mislead the accuracy of the
result. It is because if the sample size is too small, it cannot get more different information from
different population. Therefore, it is important to have a bigger sample size to represent to
population to make survey to get the more accurate result for discussion.
Moreover, the second shortcoming of the research is language that used in questionnaire.
The questionnaire that participants answered is English version. Some of the participants are
misunderstanding the meaning of the question. It might because they were born in Chinese
family background, so they can‟t fully understand some questions which are trickier in language.
It will directly influence the accuracy of the result. So, it is suggested to translate the English
version questionnaire to Chinese version questionnaire.
Furthermore, most of the participants are Chinese. It is very difficult to find Malay and
Indian to conduct the survey because the number of Malay and Indian students is low percentage
in UTAR. So, I can‟t do stratified random sampling for the race. It may lead to the prejudice. It is
because different race have different perspective. It will direct influence the result of each
research hypothesis. The way to avoid this problem is to prolong the duration of survey. So, it
just has more time to search for enough target participants to take part in the research.
Besides that, the places that I conduct survey also are not convenient which UTAR Block
G Library. Although it is a quiet and comfortable environment to answer the questionnaire but I
faced a problem. Many students are rejected to do the survey. This is because they think that it
waste their time as they went to library to search for information, lend book, do their homework
or rest only. So, it is recommended that it can do the survey at Cafeteria at Block G. It will be
chosen instead of Block C Cafeteria and Block I cafeteria because two of them are not as clean
as the Block G Cafeteria. Besides that, it has a convenient environment such as air-con provided
and quiet. Moreover, there are many students are gather at there to have chit-chat and take a rest.
During the rest time or waiting for their friends to finish their breakfast or lunch, they may
willing to help me to do the research voluntarily.
In addition, most of the journals that I used to compare with the results are from western
countries. Therefore, there might have some cultural difference among the western and eastern
country students. Moreover, different countries of residents have the different view and it may
lead to the bias. To be decrease the problem, there is a recommendation. It is not only search the
journal from UTAR Library, it also needs to have go to Public Library to search more
information from overseas.

Conclusion
Through the research, there are not only benefits for undergraduates to understand more
about insomnia and also parents and educators. Although the result found out that there is no
significant between insomnia and gender, educators and parents also need to pay more attention
of the problems of insomnia. If the children or students have the symptoms of insomnia such as
fatigue, irritability, decreased memory and concentration, also affecting many aspects of day
time functioning (Doghramji, 2006), educators and parents stand an important role to encourage
them to seek for help and treatment.
Besides that, research also showed that there are positive correlation between stress and
insomnia, and positive correlation between depression and insomnia. So, stress and depression
are two factors that are strongly correlated with insomnia. It is important to let the parents and
educators know that if their students or children are in the condition of stress or depression, they
need to be more attention as it is more possibility to have insomnia too.
Furthermore, the research of insomnia has been done by many researchers from western
countries but less in Asian countries especially our country, Malaysia. Therefore, this research
study that I done is useful for many students, educator, psychologist, counselor and some people
who is interest with the issue of insomnia as a guideline and reference.

REFERENCES
REFERENCES
Åkerstedt, T. (2006). Psychosocial stress and impaired sleep. Scand J Work Environ Health,
32(6), 493-501. Retrieved May 31, 2010, from
http://www.sjweh.fi/download.php?abstract_id=1054&file_nro=1
Anbar, R.D., & Slothower, M. P. (2006). Hypnosis for treatment of insomnia in school-age
children: A retrospective chart review. Research article, 6(23). Retrieved June 23, 2010, from
http://www.ncbi.nlm.nih.gov/pmc/articles/PMC1559690/pdf/1471-2431-6-23.pdf
Bartlett, D.J., Paisley, L., & Desai, A.V. (2006). Insomnia diagnosis and management. Medicine
today, 7(8), 14-21. Retrieved June 23, 2010, from
http://www.sleepaus.on.net/bartlettmedtodayinsomnia.pdf
Berk, M. (2009). Sleep and depression: theory and practice. Theme sleep, 38(5), 302-304.
Retrieved June 12, 2010, from http://www.racgp.org.au/afp/200905/200905berk.pdf
Bluestein, D., Rutledge, C. M., & Healey, A.C. (2010). Psychosocial correlates of insomnia
severity in primary care. JABFM, 23(2), 204-211. Retrieved June 7, 2010, from
http://www.jabfm.org/cgi/reprint/23/2/204
Buckner, J.D., Bernert, R.A., Cromer, K.R., Joiner, T. E., & Schmit, N.B. (2008). Social anxiety
and insomnia: the mediating role of depressive symptoms. Research Article: Depression and
Anxiety, 25, 124-130. Retrieved June 12, 2010, from
http://www.lsu.edu/psychology/aabc/DepAnx%20sleep.pdf

Budur, K., Rodriguez, C., & Foldvary-Schaefer, N. (2007). Advance in the treating insomnia.
Cleveland Clinic Journal of Medicine, 74(4), 251-266. Retrieved June 11, 2010, from
http://www.ccjm.org/content/74/4/251.full.pdf
Buysse, D.J. (2004). Insomnia, depress, and aging: assessing sleep and mood interaction in older
adult. Geriatric, 59(2), 47-52. Retrieved June 5, 2010, from
http://geriatrics.modernmedicine.com/geriatrics/data/articlestandard/geriatrics/072004/84701/arti
cle.pdf
Cameron, I.M., Crawford, J.R., Lawton, K., & Reid, I.C. (2008). Psychometric comparison of
PHQ-9 and HADS for measuring depression severity in primary care. British Journal Of General
Practice, 58, 32-36. Retrieved June 19, 2010, from
http://www.abdn.ac.uk/~psy086/dept/pdfs/BJGP_2008_PHQ_vs_HADS.pdf
Cardinali, D.P., & Pandi-Perumal, S.R. (2006). Neuroendocrine correlated of sleep/wakefulness.
America: Springer Science+Business Media,inc.
Cohen, S. (1994). Perceived stress scale. Retrieved June 25, 2010, from
http://www.wcupa.edu/_academics/healthsciences/stressreductioncenter/documents/perceived_st
ress_scale.pdf
Doghramji, K. (2006). The epidemiology and diagnosis of insomnia. The American Journal Of
Managed Care, 12(8), S214-S220. Retrieved June 2, 2010, from
http://www.ajmc.com/media/pdf/A130_06mayDoghramS214to20.pdf

Eby, G.A., & Eby, K.L. (2006).Rapid recovery from major depression using magnesium
treatment.Medical Hypothesis, 67(2), 1-9. Retrieve December 2, 2010, from http://george-eby-
research.com/html/magnesium-for-depression.pdf
The Free Dictionary. (2011). Retrieved January 2, 2011, from http://medical-
dictionary.thefreedictionary.com/
Gaultney, J.F. (2010). The prevalence of sleep disorder in college student: Impact on academic
performance. Journal of American College Health, 59(2), 91-97. Retrieved February 16, 2011,
from Ebscohost Database.
Goldstein, E.D. (2007). Sacred moments: implication on well-being and stress. Journal Of
Clinical Psychology, 63(10), 1001-1019. Retrieved June 22, 2010, from
http://drsgoldstein.com/Documents/goldstein%20j%20of%20clinical%20psychology%202007%
2063%2810%29%201001-1019.pdf
Hamilton, N.A., Gallagher, M.W., Preacher, K.J., Stevens, N., Nelson, C. A., Karlson, C., &
McCurdy, D. (2007). Insomnia and well-being. Journal of Counseling and Clinical Psychology,
75(6), 939-946. Retrieved June 1, 2010, from http://www.midus.wisc.edu/findings/pdfs/804.pdf
Johnson, E.O., Roth, T., Schultz, L., Breslau, N. (2006). Epidemiology of DSM-IV insomnia in
adolescent: lifetime prevalence, chronicity and an emergent gender difference. Official Journal
Of The American Academy Of Pediatrics, 117(2), 247-256. Retrieved June 5, 2010, from
http://pediatrics.aappublications.org/cgi/content/full/117/2/e247

Kamel, N. S., & Gammack, J. K. (2006). Insomnia in the elderly: Cause, approach, and treatment.
The American Journal of Medicine, 119(6), 463-469. Retrieved June 17, 2010, from
http://www.amjmed.com/article/PIIS0002934305010569/fulltext
Krystal, A.D. (2004). Insomnia in women. Clinical Cornerstone: Chronic Insomnia, 5(3), 41-50.
Retrieved June 11, 2010, from http://www.clinicalcornerstone.com/issues/v5n3/v5n3_41kry.pdf
Léger, D., Guilleminault, C., Bader, G., Levy, E., & Paillard, M. (2002). Medical and socio-
proffesional impact of insomnia. Sleep: Insomnia, 25(6), 621-625. Retrieved June 12, 2010, from
http://www.journalsleep.org/Articles/250604.pdf
Mahendran, R. (2001). Characteristic of patients referred to an insomnia clinic. Original article:
Singapore Med J, 42(2), 64-67. Retrieved June 2, 2010, from
http://www.sma.org.sg/smj/4202/4202a4.pdf
MedicineNet. (2011). Retrieved January 2, 2011 from http://www.medterms.com
Morin, C. M., Vallieres, A., & Ivers, H. (2007). Dysfunctional beliefs and attitudes about sleep
(DBAS): validation of brief version (DBAS-16). Sleep: Insomnia, 30(11), 1547-1554. Retrieved
June 11, 2010, from http://www.journalsleep.org/Articles/301114.pdf
O‟Donnell, J.F. (2004). Insomnia in cancer patient. Clinical Cornerstone, 6, S6-S14. Retrieved
June 22, 2010, from http://www.clinicalcornerstone.com/suppl/v6s1d/v6s1d_s06odo.pdf
Roth, T. (2007). Insomnia, prevalence, etiology, and consequences. Journal of Clinical Sleep
Medicine, 3(5), 37-49. Retrieved January 25, 2011, from
http://www.ncbi.nlm.nih.gov/pmc/articles/PMC1978319/pdf/jcsm.3.5.s7.pdf

Shaughnessy, J.J., Zechmeister, E.B., & Zechmeister, J.S. (2009). Research method in
psychology.(8th ed.). Boston: Mcgraw- hill higher education.
Spence, D.W., Kayumov, L., Chen, A., Lowe, A., Jain, U., Katzman, M.A., & et.al. (2004).
Acupuncture increases nocturnal melatonin secretion and reduces insomnia and anxiety: a
preliminary report. J Neuropsychiatry Clin Neurosci, 16(1), 19-28. Retrieved January 25, 2011,
from http://neuro.psychiatryonline.org/cgi/reprint/16/1/19
Taylor, D.J., Lichstein, K.L., Durrence, H.H., Reidel, B.W., & Bush, A.J. (2005). Epidemiology
insomnia, depression, and anxiety, 28(11), 1457-1464. Retrieved January 1, 2011, from
http://www.journalsleep.org/Articles/281117.pdf
Theobald, D.E.(2004). Cancer pain, fatigue, depress and insomnia in cancer patients. Clinical
Cornerstone: Insomnia In Cancer Patients, 6(suppl ID), S15-S21. Retrieved June 12, 2010, from
http://www.clinicalcornerstone.com/suppl/v6s1d/v6s1d_s15the.pdf
Turek, F.W. (2005). Insomnia and depression if it looks and walks like a duck. Sleep: from the
bench to the bedside, 28(11), 1457-1464. Retrieved June 25, 2010, from
http://www.journalsleep.org/Articles/281106.pdf
U.S. Department of Health and Human Services Centers for Disease Control and Prevention.
(n.d). The effects of childhood stress on health across the lifespan. Retrieved March 2, from
http://www.cdc.gov/ncipc/pub-res/pdf/Childhood_Stress.pdf.
Vernoy, M., & Kyle, D.J. (2007). Behavioral Statistics in Action (3rd ed.). Singapore: McGraw
Hill.

Watson, N.F., Goldberg, J., Arguelles, L., & Buchwald, D. (2006). Genetic and environmental
influences on insomnia, daytime sleepiness, and obesity in twins. Sleep: Insomnia, 29(5), 645-
649. Retrieved June 12, 2010, from http://www.journalsleep.org/Articles/290511.pdf
Willert, M.V., Thulstrup, A.M., Hertz, J., & Bonde, J. P. (2009). Changes in stress and coping
from a randomized controlled trial of three-month stress management intervention. Original
article: Scand J Work Environ Health, 35(2), 145-152. Retrieved June 25, 2010, from
http://www.sjweh.fi/download.php?abstract_id=1313&file_nro=1
World Health Organization. (2011). Definition of an older or elderly person. Retrieved
December 25, 2010, from http://www.who.int/healthinfo/survey/ageingdefnolder/en/index.html
Yeo, B.K.L., Perera, I.S., Kok, L. P., & Tsoi, W.F. (1996). Insomnia in the community.
Singapore Med J, 37, 282-284. Retrieved June 5, 2010, from
http://smj.sma.org.sg/3703/3703a12.pdf
Youth and the united nations. (n.d.) Retrieved February 5, 2011, from
http://www.un.org/esa/socdev/unyin/qanda.htm#1
Zhang, B., & Wing, Y.K. (2006). Sex differences in insomnia: a meta-analysis. Sleep: Insomnia,
29(1), 85-93. Retrieved June 2, 2010, from http://www.journalsleep.org/Articles/290114.pdf

APPENDIX A: Questionnaires

Appendix A1
Insomnia Severity Index
Gender : M / F
Age:
Use circle to indicate the severity of your insomnia problem(s)
Insomnia Problem None Mild Moderate Severe Very severe
1. Difficulty falling asleep 0 1 2 3 4
2. Difficulty staying asleep 0 1 2 3 4
3. Problem waking up too early 0 1 2 3 4
Very
Satisfied Satisfied
Moderately
Satisfied Dissatisfied
Very
Dissatisfied
4. How satisfied/ dissatisfied
are you with your current
sleep pattern?
0 1 2 3 4
Not at all
Noticeable A Little Somewhat Much
Very Much
Noticeable
5. How noticeable to others do
you think your sleep
problem is in terms of
impairing the quality of
your life?
0 1 2 3 4
Not at all
Worried A Little Somewhat Much
Very Much
Worried
6. How worried/ distressed
are you about your current
sleep problem?
0 1 2 3 4
Not at all
Interfering A Little Somewhat Much
Very Much
Interfering
7. To what extent do you
consider your sleep
problem to interfere with
your daily functioning (e.g.
daytime fatigue, mood,
ability to function at
work/daily chores,
concentration, memory,
mood, etc.) currently?
0 1 2 3 4

APPENDIX A2
Perceived Stress Scale
Circle how often you felt or thought a certain way
0 = Never 1 = Almost Never 2 = Sometimes 3 = Fairly Often 4 = Very Often
1. In the last month, how often have you been upset because
of something that happened unexpectedly?
0 1 2 3 4
2. In the last month, how often have you felt that you were
unable to control the important things in your life?
0 1 2 3 4
3. In the last month, how often have you felt nervous and
“stressed”?
0 1 2 3 4
4. In the last month, how often have you felt confident about
your ability to handle your personal problems?
0 1 2 3 4
5. In the last month, how often have you felt that things were
going your way?
0 1 2 3 4
6. In the last month, how often have you found that you
could not cope with all the things that you had to do?
0 1 2 3 4
7. In the last month, how often have you been able to control
irritations in your life?
0 1 2 3 4
8. In the last month, how often have you felt that you were
on top of things?
0 1 2 3 4
9. In the last month, how often have you been angered
because of things that were outside of your control?
0 1 2 3 4
10. In the last month, how often have you felt difficulties
were piling up so high that you could not overcome them?
0 1 2 3 4

APPENDIX A3
PATIENT HEALTH QUESTIONNAIRE
Over the last 2 weeks, how often have you been bothered by any of the following
problems? (Use circle to indicate your answer)
0 = Never 1 = Almost Never 2 = Sometimes 3 = Fairly
1. Little interest or pleasure in doing things? 0 1 2 3
2. Feeling down, depressed, or hopeless? 0 1 2 3
3. Trouble falling or staying asleep, or sleeping too much? 0 1 2 3
4. Feeling tired or having little energy? 0 1 2 3
5. Poor appetite or overeating? 0 1 2 3
6. Feeling bad about yourself - or that you are a failure or have
let yourself or your family down?
0 1 2 3
7. Trouble concentrating on things, such as reading the
newspaper or watching television?
0 1 2 3
8. Moving or speaking so slowly that other people could have
noticed? Or the opposite - being so fidgety or restless that
you have been moving around a lot more than usual?
0 1 2 3
9. Thoughts that you would be better off dead, or of hurting
yourself in some way?
0 1 2 3

APPENDIX B: Original Data

Appendix B1
Gender 1=Male
2=Female
ISI Level 1= Absence of insomnia (0-7)
2= Mild Insomnia (8-14)
3= Moderate Insomnia (15-21)
4= Severe Insomnia (22-28)
Table 1.1
Raw data for each participant gender, age and the score of Insomnia Severity Index (ISI)
Par
tici
pan
t
Ge
nd
er
Age
Insomnia Severity Index (ISI)
Q1
Q2
Q3
Q4
Q5
Q6
Q7
Tota
l
sco
re
Leve
l
1 1 20 0 0 0 1 0 0 1 2 1
2 1 18 1 1 3 4 2 1 1 13 2
3 1 20 1 1 0 1 1 1 1 6 1
4 1 19 2 3 1 3 3 3 3 18 3
5 1 21 0 1 0 0 1 0 0 2 1
6 1 22 2 1 2 2 2 2 2 13 2
7 1 22 1 0 1 2 1 1 2 8 2
8 1 21 0 0 0 1 0 0 1 2 1
9 1 19 1 1 1 1 1 0 1 6 1
10 1 23 2 1 3 2 2 1 2 13 2
11 1 20 0 0 0 1 2 0 2 5 1
12 1 22 0 0 0 0 0 1 2 3 1
13 1 21 2 1 2 2 1 2 2 12 2
14 1 22 0 0 1 1 0 1 1 4 1
15 1 24 2 3 3 2 2 3 4 19 3
16 1 22 1 0 3 2 1 2 1 10 2
17 1 19 3 2 4 1 3 0 4 17 3
18 1 20 0 0 2 0 1 0 2 5 1
19 1 23 1 1 0 1 0 0 1 4 1
20 1 22 3 3 4 3 3 3 3 22 4
21 1 19 0 0 2 1 1 1 2 7 1
22 1 23 0 0 4 1 2 1 4 12 2

23 1 20 0 0 0 1 0 0 0 1 1
24 1 18 1 0 0 1 0 0 0 2 1
25 1 20 4 4 3 3 2 4 3 23 4
26 1 19 1 1 2 0 0 0 0 4 1
27 1 22 0 2 3 1 1 1 1 9 2
28 1 22 0 0 0 0 1 1 1 3 1
29 1 22 1 0 0 1 0 0 2 4 1
30 1 19 2 1 2 2 2 1 3 13 2
31 1 22 2 1 3 2 3 1 3 15 3
32 1 21 1 1 0 2 1 0 2 7 1
33 1 20 2 3 2 3 2 1 3 16 3
34 1 21 1 2 3 0 1 0 1 8 2
35 1 22 2 2 3 3 3 2 4 19 3
36 1 20 1 1 2 2 2 2 2 12 2
37 1 19 1 1 0 1 0 0 3 6 1
38 1 22 3 2 3 2 3 1 2 16 3
39 1 23 2 2 1 2 2 2 3 14 2
40 1 18 2 2 3 3 2 3 3 18 3
41 1 20 3 1 1 3 2 2 2 14 2
42 1 19 0 3 3 4 1 2 1 14 2
43 1 20 1 1 1 1 0 2 1 7 1
44 1 19 1 0 0 2 2 1 0 6 1
45 1 21 1 0 0 0 1 1 0 3 1
46 1 23 2 1 0 2 1 2 2 10 2
47 1 20 1 2 2 2 1 2 2 12 2
48 1 21 2 2 1 2 2 2 3 14 2
49 1 23 2 1 2 2 2 2 4 15 3
50 1 20 1 3 3 3 4 2 2 18 3
51 2 22 2 2 2 3 2 2 3 16 3
52 2 21 2 1 2 3 1 1 2 12 2
53 2 18 1 1 2 2 0 0 1 7 1
54 2 22 2 2 0 2 0 2 1 9 2
55 2 20 1 1 2 1 2 1 1 9 2
56 2 19 2 1 3 1 1 1 1 10 2
57 2 22 1 1 1 2 1 1 1 8 2
58 2 21 0 1 1 2 1 1 0 6 1
59 2 19 1 1 1 1 0 0 2 6 1

60 2 18 1 1 3 2 3 1 1 12 2
61 2 20 1 0 3 3 3 4 3 17 3
62 2 19 0 0 1 1 2 0 0 4 1
63 2 20 0 0 2 1 0 0 0 3 1
64 2 21 3 2 1 3 1 1 1 12 2
65 2 20 1 1 1 2 0 0 1 6 1
66 2 19 0 0 3 3 2 1 3 12 2
67 2 20 1 0 0 1 0 0 1 3 1
68 2 19 2 3 1 1 1 1 2 11 2
69 2 20 0 0 1 0 0 0 0 1 1
70 2 19 3 1 1 2 1 2 2 12 2
71 2 22 4 3 0 2 2 3 3 17 3
72 2 23 2 0 4 2 0 0 3 11 2
73 2 24 1 2 0 1 0 0 0 4 1
74 2 23 1 1 3 1 0 1 3 10 2
75 2 22 2 2 3 1 0 1 1 10 2
76 2 21 0 0 0 1 0 0 1 2 1
77 2 20 0 0 0 1 0 0 1 2 1
78 2 20 3 2 1 3 1 2 2 14 2
79 2 24 0 0 1 0 1 0 0 2 1
80 2 23 1 0 0 1 1 0 0 3 1
81 2 21 0 2 1 0 0 0 0 3 1
82 2 20 1 1 3 2 1 1 1 10 2
83 2 19 1 1 1 2 1 0 1 7 1
84 2 19 1 1 1 2 0 0 0 5 1
85 2 22 1 3 2 2 3 1 2 14 2
86 2 23 2 2 1 1 3 2 3 14 2
87 2 21 3 2 4 3 2 1 1 16 3
88 2 21 3 3 1 2 2 1 2 14 2
89 2 20 1 2 3 1 3 1 3 14 2
90 2 21 4 4 4 4 4 4 4 28 4
91 2 19 2 2 1 2 2 2 2 13 2
92 2 22 3 3 2 2 3 1 3 17 3
93 2 22 2 2 2 2 2 1 1 12 2
94 2 23 2 3 2 3 3 1 3 17 3
95 2 21 1 3 3 2 1 1 1 12 2
96 2 22 1 2 3 1 2 2 3 14 2

97 2 21 2 3 4 2 2 3 2 18 3
98 2 22 3 2 0 2 3 1 0 11 2
99 2 24 1 2 0 1 1 0 1 6 1
100 2 20 1 1 3 0 2 0 2 9 2

Appendix B2
Gender 1=Male
2=Female
Table 1.2
Raw data for each participant gender, age and the score Perceived Stress Scale (PSS-10)
Par
tici
pan
t
Ge
nd
er
Age
Perceived Stress Scale (PSS-10)
Q1
Q2
Q3
Q4
Q5
Q6
Q7
Q8
Q9
Q1
0
Tota
l
sco
re
1 1 20 2 1 2 1 2 2 2 1 2 1 16
2 1 18 2 2 2 1 2 3 1 2 1 2 18
3 1 20 2 1 2 1 1 2 2 2 2 2 17
4 1 19 3 3 4 2 3 3 3 1 3 3 28
5 1 21 3 2 2 1 1 2 2 1 2 2 18
6 1 22 2 2 2 2 2 2 3 2 1 2 20
7 1 22 2 2 2 3 2 3 1 2 1 2 20
8 1 21 2 2 1 1 1 2 1 1 1 1 13
9 1 19 2 2 1 1 1 1 1 2 1 1 13
10 1 23 3 2 3 2 2 2 2 2 3 2 23
11 1 20 2 3 2 1 2 1 2 2 1 3 19
12 1 22 1 1 1 3 3 1 3 3 1 1 18
13 1 21 1 2 1 2 3 2 3 3 1 1 19
14 1 22 1 2 1 3 1 1 0 1 3 4 17
15 1 24 2 3 2 2 2 2 3 2 3 2 23
16 1 22 2 1 1 2 2 3 1 2 1 0 15
17 1 19 3 4 4 2 1 3 2 2 4 3 28
18 1 20 1 1 3 3 2 2 3 3 1 2 21
19 1 23 4 4 3 1 1 2 2 2 3 2 24
20 1 22 3 2 3 2 2 2 2 2 3 2 23
21 1 19 0 1 0 2 4 1 1 2 2 2 15
22 1 23 0 1 1 2 2 1 3 2 2 2 16
23 1 20 2 1 2 2 1 1 1 1 1 1 13
24 1 18 0 1 0 1 1 1 0 1 0 1 6
25 1 20 4 4 4 1 3 1 2 3 4 4 30

26 1 19 2 1 3 4 2 0 4 1 3 1 21
27 1 22 1 1 2 2 2 2 2 2 2 2 18
28 1 22 2 2 3 1 2 3 2 2 1 1 19
29 1 22 2 2 2 3 3 3 2 2 2 0 21
30 1 19 3 2 4 1 3 3 2 1 1 3 23
31 1 22 1 2 2 2 2 3 2 2 2 1 19
32 1 21 2 2 0 4 3 1 2 4 1 0 19
33 1 20 2 2 3 1 2 2 2 2 3 3 22
34 1 21 1 2 0 1 1 1 1 0 1 2 10
35 1 22 3 3 3 2 2 3 2 2 3 2 25
36 1 20 2 3 2 2 2 3 2 1 1 2 20
37 1 19 2 2 2 1 1 1 1 1 1 1 13
38 1 22 3 1 3 2 2 3 2 3 3 3 25
39 1 23 2 1 3 2 2 2 2 2 2 2 20
40 1 18 2 2 2 2 1 3 2 2 3 2 21
41 1 20 1 1 1 2 2 2 2 2 3 2 18
42 1 19 4 4 4 2 4 4 2 1 1 3 29
43 1 20 2 2 2 2 2 1 0 1 0 0 12
44 1 19 1 1 2 2 1 2 1 2 0 2 14
45 1 21 0 0 1 2 1 4 3 2 1 1 15
46 1 23 0 2 1 2 1 2 3 3 3 3 20
47 1 20 1 2 3 4 2 0 0 0 1 1 14
48 1 21 2 2 3 1 1 3 4 3 2 3 24
49 1 23 1 2 3 2 4 2 0 1 1 0 16
50 1 20 1 1 2 3 0 3 1 3 0 3 17
51 2 22 2 1 1 2 3 2 3 2 2 0 18
52 2 21 3 3 3 2 2 3 2 2 2 2 24
53 2 18 1 2 2 2 1 2 2 3 2 1 18
54 2 22 2 2 3 2 2 1 1 3 1 2 19
55 2 20 2 2 3 2 2 2 2 3 3 2 23
56 2 19 1 1 1 1 2 1 2 1 1 0 11
57 2 22 1 1 2 1 1 1 2 2 1 1 13
58 2 21 2 2 3 2 2 1 4 3 1 0 20
59 2 19 1 2 1 1 2 2 1 1 2 2 15
60 2 18 4 4 4 1 2 2 3 3 2 4 29
61 2 20 2 3 2 1 2 2 1 1 3 3 20
62 2 19 2 1 1 3 2 1 2 3 2 2 19

63 2 20 2 2 1 1 2 1 1 2 1 2 15
64 2 21 2 2 1 2 3 2 2 2 2 2 20
65 2 20 2 1 1 1 0 0 1 1 2 1 10
66 2 19 3 2 3 3 3 2 3 3 2 2 26
67 2 20 2 2 3 2 2 2 3 3 2 1 22
68 2 19 1 3 4 4 2 2 3 2 2 3 26
69 2 20 2 2 1 0 1 1 0 0 1 4 12
70 2 19 3 3 3 1 2 2 2 2 2 2 22
71 2 22 3 4 1 1 2 2 3 3 2 2 23
72 2 23 1 3 2 3 3 2 1 2 3 3 23
73 2 24 3 2 3 2 2 2 2 3 1 2 22
74 2 23 2 2 1 4 3 3 2 4 2 2 25
75 2 22 2 2 1 2 2 2 2 2 3 3 21
76 2 21 2 2 2 1 1 2 2 2 2 2 18
77 2 20 1 1 2 2 2 1 2 2 0 1 14
78 2 20 2 2 3 3 2 3 2 3 2 2 24
79 2 24 2 2 2 1 1 2 1 1 1 1 14
80 2 23 1 1 1 1 1 1 3 2 0 0 11
81 2 21 2 1 3 3 3 2 2 2 2 2 22
82 2 20 3 2 2 1 1 2 1 2 2 3 19
83 2 19 2 1 1 1 1 1 2 3 2 1 15
84 2 19 1 2 2 1 2 1 1 2 2 1 15
85 2 22 2 2 1 1 1 3 2 1 2 1 16
86 2 23 2 2 2 2 2 1 2 2 2 2 19
87 2 21 0 0 0 1 0 0 1 2 2 1 7
88 2 21 3 0 3 1 1 2 2 2 2 3 19
89 2 20 2 3 3 2 2 3 3 3 3 3 27
90 2 21 4 3 3 3 2 3 2 3 4 3 30
91 2 19 2 2 3 2 2 2 2 2 2 2 21
92 2 22 2 3 2 3 2 3 2 3 3 2 25
93 2 22 2 2 2 2 2 2 2 2 2 2 20
94 2 23 2 1 4 2 1 2 3 2 3 3 23
95 2 21 1 2 2 2 2 2 2 2 2 2 19
96 2 22 2 2 1 1 2 2 2 2 2 2 18
97 2 21 2 2 3 2 2 1 1 2 2 2 19
98 2 22 2 2 3 2 2 2 2 2 3 2 22
99 2 24 0 1 3 1 1 2 2 1 1 1 13 100 2 20 1 1 0 3 3 1 3 2 2 1 17

Appendix B3
Gender 1=Male PHQ-9 Level 1= Minimal depression(<5)
2=Female 2= Mild (5-9)
3= Moderate(10-14)
4= Moderate Severe(15-19)
5= Severe(20-27)
Table 1.3
Raw data for each participant gender, age and the score Patient Health Questionnaire (PHQ-9)
Par
tici
pan
t
Ge
nd
er
Age
Patient Health Questionnaire (PHQ-9)
Q1
Q2
Q3
Q4
Q5
Q6
Q7
Q8
Q9
Tota
l
sco
re
LEV
EL
1 1 20 2 2 0 1 0 2 0 0 0 7 2
2 1 18 2 1 3 2 3 2 2 0 0 15 4
3 1 20 1 1 1 1 2 2 2 1 0 11 3
4 1 19 2 2 2 2 2 2 2 2 0 16 4
5 1 21 1 2 1 2 2 2 1 2 2 15 4
6 1 22 2 2 2 1 3 2 2 2 1 17 4
7 1 22 1 1 2 2 1 2 1 1 0 11 3
8 1 21 1 1 2 2 2 0 1 1 0 10 3
9 1 19 2 1 1 1 1 0 1 0 0 7 2
10 1 23 2 1 2 1 1 2 2 1 0 12 3
11 1 20 1 1 0 2 3 1 0 1 0 9 2
12 1 22 1 0 2 1 2 0 3 0 0 9 2
13 1 21 1 1 1 1 2 1 2 2 2 13 3
14 1 22 2 1 0 2 0 2 1 0 0 8 2
15 1 24 1 2 3 3 3 2 3 0 2 19 4
16 1 22 1 2 3 2 1 0 2 0 0 11 3
17 1 19 3 3 3 3 3 3 3 3 3 27 5
18 1 20 1 2 1 2 1 2 1 2 1 13 3
19 1 23 1 0 3 2 2 2 2 1 0 13 3
20 1 22 3 2 3 3 3 3 3 3 2 25 5
21 1 19 2 1 2 2 2 2 2 1 0 14 3

22 1 23 1 1 0 2 0 1 0 2 0 7 2
23 1 20 2 0 0 0 0 0 1 0 0 3 1
24 1 18 0 0 0 0 0 0 0 0 0 0 1
25 1 20 2 2 3 3 3 2 0 0 0 15 4
26 1 19 0 1 0 3 2 0 0 1 0 7 2
27 1 22 2 2 2 2 2 2 2 0 0 14 3
28 1 22 1 0 1 2 0 0 1 1 0 6 2
29 1 22 2 1 1 2 1 2 1 0 0 10 3
30 1 19 0 2 2 2 2 1 2 1 2 14 3
31 1 22 2 1 2 2 2 1 2 2 1 15 4
32 1 21 2 2 2 2 1 3 2 2 0 16 4
33 1 20 1 2 2 2 3 1 1 0 2 14 3
34 1 21 1 2 2 3 2 0 2 3 0 15 4
35 1 22 2 2 3 3 3 2 0 2 0 17 4
36 1 20 2 2 2 1 1 2 2 1 2 15 4
37 1 19 3 1 2 2 1 2 0 0 0 11 3
38 1 22 3 1 2 3 1 1 2 1 0 14 3
39 1 23 3 2 2 3 2 3 2 2 1 20 5
40 1 18 2 3 3 3 3 3 2 2 0 21 5
41 1 20 2 1 1 1 2 1 2 1 1 12 3
42 1 19 3 3 0 0 0 3 0 0 0 9 2
43 1 20 3 0 0 0 0 1 1 0 0 5 2
44 1 19 0 0 0 0 2 0 1 0 0 3 1
45 1 21 0 0 2 3 1 3 1 2 3 15 4
46 1 23 2 3 3 3 1 3 3 3 3 24 5
47 1 20 1 2 2 2 1 0 2 2 3 15 4
48 1 21 3 3 3 2 3 3 3 3 2 25 5
49 1 23 3 3 1 1 3 2 3 2 3 21 5
50 1 20 3 3 3 3 3 3 3 3 3 27 5
51 2 22 1 2 1 1 1 2 1 1 0 10 3
52 2 21 2 1 2 2 1 2 2 1 0 13 3
53 2 18 1 0 1 1 2 1 2 0 1 9 2
54 2 22 2 2 3 3 1 2 3 2 2 20 5
55 2 20 2 2 2 2 1 2 1 1 1 14 3
56 2 19 2 1 3 2 1 1 1 1 0 12 3
57 2 22 2 1 2 2 2 2 1 0 0 12 3
58 2 21 1 1 0 1 1 1 1 1 0 7 2

59 2 19 1 0 1 1 2 2 1 1 1 10 3
60 2 18 2 3 3 2 2 2 1 2 2 19 4
61 2 20 3 2 3 3 3 3 1 1 2 21 5
62 2 19 1 2 1 1 2 1 1 1 2 12 3
63 2 20 1 1 1 1 1 2 1 1 1 10 3
64 2 21 2 3 3 2 3 2 1 0 0 16 4
65 2 20 3 0 2 2 0 0 0 0 0 7 2
66 2 19 2 2 3 3 3 3 2 2 3 23 5
67 2 20 2 0 1 2 2 1 0 0 0 8 2
68 2 19 1 1 2 2 2 1 1 2 2 14 3
69 2 20 2 0 0 0 0 0 0 0 0 2 1
70 2 19 2 2 2 1 1 0 0 1 2 11 3
71 2 22 3 1 3 3 2 2 3 0 0 17 4
72 2 23 0 0 0 3 3 2 2 0 0 10 3
73 2 24 2 2 2 2 1 2 0 1 2 14 3
74 2 23 2 1 2 1 2 1 1 1 0 11 3
75 2 22 2 2 1 2 2 3 2 2 2 18 4
76 2 21 1 2 1 2 2 2 1 2 2 15 4
77 2 20 1 1 1 2 1 0 2 1 0 9 2
78 2 20 2 2 2 3 2 2 2 2 3 20 5
79 2 24 1 1 1 2 1 0 0 1 0 7 2
80 2 23 1 0 1 1 1 0 0 0 0 4 1
81 2 21 2 1 0 1 1 2 1 0 0 8 2
82 2 20 2 2 2 2 1 1 1 1 0 12 3
83 2 19 1 1 1 1 3 1 0 0 2 10 3
84 2 19 0 2 2 2 0 0 0 0 0 6 2
85 2 22 3 2 2 2 2 0 2 1 0 14 3
86 2 23 2 2 2 1 1 1 0 1 0 10 3
87 2 21 2 1 3 2 3 1 0 2 0 14 3
88 2 21 1 2 2 1 1 2 1 2 1 13 3
89 2 20 2 1 2 2 1 1 2 2 2 15 4
90 2 21 2 3 3 2 3 3 3 2 3 24 5
91 2 19 2 2 2 1 2 2 3 3 1 18 4
92 2 22 3 3 2 2 2 2 2 2 2 20 5
93 2 22 2 2 2 2 2 2 2 2 0 16 4
94 2 23 2 2 3 3 2 0 0 0 0 12 3
95 2 21 1 1 2 2 2 2 2 2 1 15 4

96 2 22 2 1 2 2 1 2 2 2 0 14 3
97 2 21 2 1 3 2 2 1 2 1 2 16 4
98 2 22 2 2 1 1 3 1 1 1 0 12 3
99 2 24 1 0 1 0 1 0 0 0 0 3 1 100 2 20 2 0 2 2 1 0 1 1 0 9 2

Appendix B4
Table 1.4
Computation of the mean and Standard Deviation for undergraduates Male and Female Age
Age
Male student, X1 X12 Female student, X2 X2
2 20 400 22 484 18 324 21 441 20 400 18 324 19 361 22 484 21 441 20 400 22 484 19 361 22 484 22 484 21 441 21 441 19 361 19 361 23 529 18 324 20 400 20 400 22 484 19 361 21 441 20 400 22 484 21 441 24 576 20 400 22 484 19 361 19 361 20 400 20 400 19 361 23 529 20 400 22 484 19 361 19 361 22 484 23 529 23 529 20 400 24 576 18 324 23 529 20 400 22 484 19 361 21 441 22 484 20 400 22 484 20 400 22 484 24 576 19 361 23 529 22 484 21 441 21 441 20 400 20 400 19 361 21 441 19 361 22 484 22 484 20 400 23 529 19 361 21 441 22 484 21 441 23 529 20 400 18 324 21 441

20 400 19 361 19 361 22 484 20 400 22 484 19 361 23 529 21 441 21 441 23 529 22 484 20 400 21 441 21 441 22 484 23 529 24 576 20 400 20 400
𝑥1= 1038 𝑥12= 21666 𝑥2 = 1044 𝑥2
2= 21920 n1= 50, n2= 50
𝑥 1 = 20.76 S1= 1.546 𝑥 2 = 20.88 S2 = 1.573
Total sample of Utar undergraduates, N=100
𝑥1= 1038, 𝑥12= 21666, 𝑥2 = 1044, 𝑥2
2= 21920, N=100,n1 =50, n2=50
𝑋 = 𝑥1 + 𝑥2 = 1038 + 1044
= 2082
𝑋2 = 𝑥1
2 + 𝑥22
= 21666 + 21920
= 43586
Mean age all students 𝑋 = 𝑥 /N
=2082/100
= 20.82
Sall students = 𝑋2−
( 𝑋 )2
𝑁
𝑁−1
= 43586 −43347 .24
99
= 2.412 = 1.553
Mean 𝑥1 = 𝑥1 / n1
= 1038/50
= 20.76 S1 =
𝑥12−
( 𝑥1)2
𝑛1
𝑛1−1
= 21666 −21548 .88
49
= 2.39 = 1.546
Mean 𝑥2 = 𝑥2 / n1
= 1044/50
= 20.88 S1 =
𝑥22−
( 𝑥2)2
𝑛2
𝑛2−1
= 21920 −21798 .72
49
= 2.475 = 1.573

Appendix C: Result

Appendix C1
Research Question
1. Does the male have higher insomnia rate as compare with female?
Table 2.4
Scores for insomnia severity index between male student and female student among
undergraduate UTAR student.
Score in Insomnia Severity Index (ISI)
Male student, X1 X12 Female student,X2 X2
2
2
4
16
256
13
169
12
144
6
36
7
49
18
324
9
81
2
4
9
81
13
169
10
100
8
64
8
64
2
4
6
36
6
36
6
36
13
169
12
144
5
25
17
289
3
9
4
16
12
144
3
9
4
16
12
144
19
361
6
36
10
100
12
144
17
289
3
9
5
25
11
121
4
16
1
1
22
484
12
144
7
49
17
289
12
144
11
121
1
1
4
16
2
4
10
100
23
529
10
100
4
16
2
4
9
81
2
4
3
9
14
196

4
16
2
4
13
169
3
9
15
225
3
9
7
49
10
100
16
256
7
49
8
64
5
25
19
361
14
196
12
144
14
196
6
36
16
256
16
256
14
196
14
196
14
196
18
324
28
784
14
196
13
169
14
196
17
289
7
49
12
144
6
36
17
289
3
9
12
144
10
100
14
196
12
144
18
324
14
196
11
121
15
225
6
36
18
324
9
81
𝑥1= 506 𝑥12= 6852 𝑥2= 505 𝑥2
2= 6547
n1= 50
n2= 50
𝑥 1 =10.12
S1= 5.9441
𝑥 2 =10.1
S2= 5.4333
Null Hypothesis H0 : There is no significant difference between male and female student among
undergraduates in UTAR
Research Hypothesis H1 : There is a significant difference between male and female student
among undergraduates in UTAR.
𝑥 1 = 𝑥1 /n1
= 506/50
= 10.12
𝑥 2 = 𝑥2 /n2
= 505/50
= 10.1
S1 = 𝑥1
2−( 𝑥1)2
𝑛1
𝑛1−1
S2 = 𝑥2
2−( 𝑥2)2
𝑛2
𝑛2−1

= 6852 −
5062
50
49
= 6852 −5120 .72
49
= 35.332
= 5.944
= 6547 −
5052
50
49
= 6547 −5100 .5
49
= 29.52
= 5.433
n1= 50, n2= 50, 𝑥1= 506, 𝑥2= 505, 𝑥12= 6852, 𝑥2
2= 6547
estimated 𝜎𝑑𝑖𝑓𝑓 = 𝑠1
2
𝑛1+
𝑠22
𝑛2
= 5.944 2
50+
5.4332
50
= 0.707 + 0.590
= 1.139
t = 𝑥1 −𝑥2
estimated 𝜎𝑑𝑖𝑓𝑓
= 10.12−10.1
1.139
= 0.018
df =(n1 - 1) + (n2 - 1)
= (50-1)+(50-1)
= 98
≈ 120
Since the degree freedom 98 is not found in the distribution table, I will use the nearest degree of
freedom which is 120.
Critical t (df=120, p=0.05, two-tailed) = 1.980
Since cv >t, therefore fail to reject the null hypothesis. The result of Independent sample t-test
showed that there was no significant difference between gender and insomnia among
undergraduates in UTAR. t (98) =0.018

Appendix C2
Research Question
2. Does any correlated between stress and insomnia?
Table 2.5
Computation of the Correlation Coefficient Using the Computational Formulas for UTAR
undergraduates’ stress and insomnia level
Participant
Insomnia
Severity
Index
(x)
Perceived
Stress
Scale
(y)
xy x2 y
2
1 2 16 32 4 256
2 13 18 234 169 324
3 6 17 102 36 289
4 18 28 504 324 784
5 2 18 36 4 324
6 13 20 260 169 400
7 8 20 160 64 400
8 2 13 26 4 169
9 6 13 78 36 169
10 13 23 299 169 529
11 5 19 95 25 361
12 3 18 54 9 324
13 12 19 228 144 361
14 4 17 68 16 289
15 19 23 437 361 529
16 10 15 150 100 225

17 17 28 476 289 784
18 5 21 105 25 441
19 4 24 96 16 576
20 22 23 506 484 529
21 7 15 105 49 225
22 12 16 192 144 256
23 1 13 13 1 169
24 2 6 12 4 36
25 23 30 690 529 900
26 4 21 84 16 441
27 9 18 162 81 324
28 3 19 57 9 361
29 4 21 84 16 441
30 13 23 299 169 529
31 15 19 285 225 361
32 7 19 133 49 361
33 16 22 352 256 484
34 8 10 80 64 100
35 19 25 475 361 625
36 12 20 240 144 400
37 6 13 78 36 169
38 16 25 400 256 625
39 14 20 280 196 400
40 18 21 378 324 441
41 14 18 252 196 324

42 14 29 406 196 841
43 7 12 84 49 144
44 6 14 84 36 196
45 3 15 45 9 225
46 10 20 200 100 400
47 12 14 168 144 196
48 14 24 336 196 576
49 15 16 240 225 256
50 18 17 306 324 289
51 16 18 288 256 324
52 12 24 288 144 576
53 7 18 126 49 324
54 9 19 171 81 361
55 9 23 207 81 529
56 10 11 110 100 121
57 8 13 104 64 169
58 6 20 120 36 400
59 6 15 90 36 225
60 12 29 348 144 841
61 17 20 340 289 400
62 4 19 76 16 361
63 3 15 45 9 225
64 12 20 240 144 400
65 6 10 60 36 100
66 12 26 312 144 676

67 3 22 66 9 484
68 11 26 286 121 676
69 1 12 12 1 144
70 12 22 264 144 484
71 17 23 391 289 529
72 11 23 253 121 529
73 4 22 88 16 484
74 10 25 250 100 625
75 10 21 210 100 441
76 2 18 36 4 324
77 2 14 28 4 196
78 14 24 336 196 576
79 2 14 28 4 196
80 3 11 33 9 121
81 3 22 66 9 484
82 10 19 190 100 361
83 7 15 105 49 225
84 5 15 75 25 225
85 14 16 224 196 256
86 14 19 266 196 361
87 16 7 112 256 49
88 14 19 266 196 361
89 14 27 378 196 729
90 28 30 840 784 900
91 13 21 273 169 441
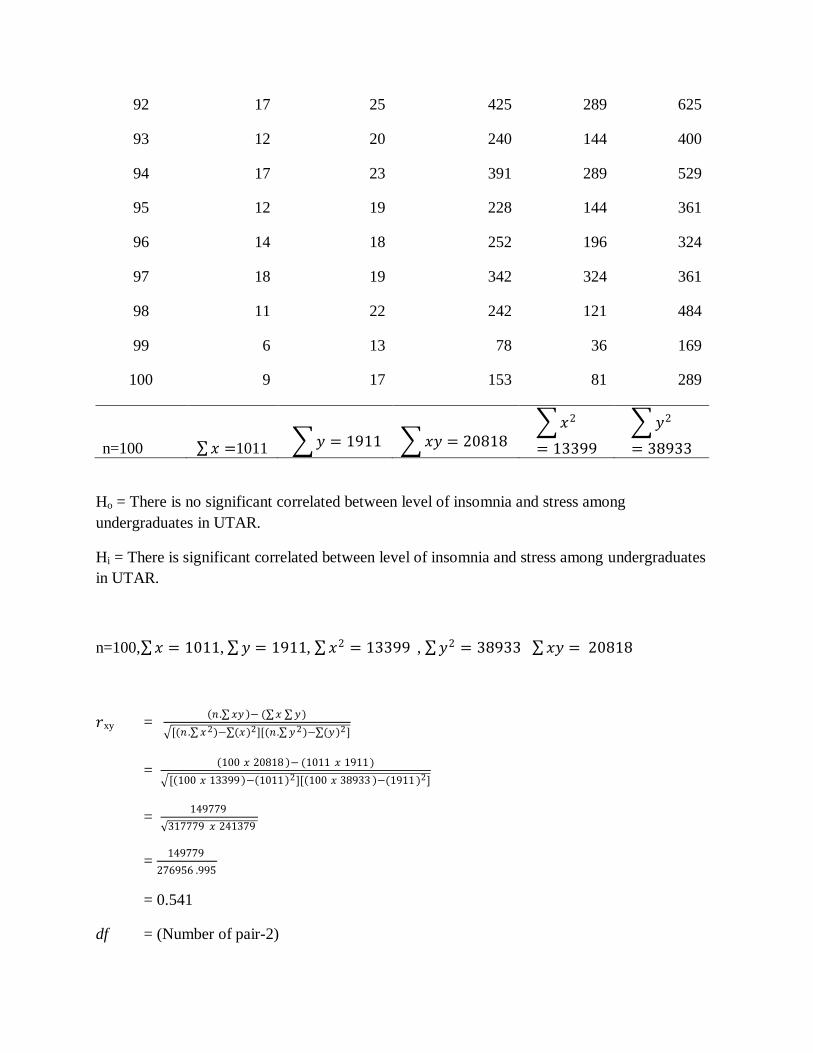
92 17 25 425 289 625
93 12 20 240 144 400
94 17 23 391 289 529
95 12 19 228 144 361
96 14 18 252 196 324
97 18 19 342 324 361
98 11 22 242 121 484
99 6 13 78 36 169
100 9 17 153 81 289
n=100 𝑥 =1011 𝑦 = 1911 𝑥𝑦 = 20818 𝑥2
= 13399
𝑦2
= 38933
Ho = There is no significant correlated between level of insomnia and stress among
undergraduates in UTAR.
Hi = There is significant correlated between level of insomnia and stress among undergraduates
in UTAR.
n=100, 𝑥 = 1011, 𝑦 = 1911, 𝑥2 = 13399 , 𝑦2 = 38933 𝑥𝑦 = 20818
𝑟xy = 𝑛 . 𝑥𝑦 − ( 𝑥 𝑦)
[(𝑛 . 𝑥2)− (𝑥)2][(𝑛 . 𝑦2)− (𝑦)2]
= 100 𝑥 20818 − (1011 𝑥 1911)
[ 100 𝑥 13399 − 1011 2][ 100 𝑥 38933 −(1911 )2]
= 149779
317779 𝑥 241379
= 149779
276956 .995
= 0.541
df = (Number of pair-2)

= 100-2
=98
≈ 100
Since the degree freedom 98 is not found in the distribution table, I will use the nearest degree of
freedom which is 100.
Cv= 0.195 , p= 0.05
Since r> cv, therefore reject the null hypothesis. The result of Pearson Correlation
showed that there was a significant positive correlation between level of insomnia and stress
among undergraduates in UTAR, r (98) = 0.541, p<0.05. The higher score in insomnia severity
index, the higher the score in Perceived Stress Scale.

Appendix C3
Research Question
3. Does any correlated between depression and insomnia?
Table 2.6
Computation of the Correlation Coefficient Using the Computational Formulas for UTAR
undergraduates’ depression and insomnia level
Participant
Insomnia
Severity
Index
(x)
Patient
Health
Questionnaire
(y)
xy x2 y
2
1 2 7 14 4 49
2 13 15 195 169 225
3 6 11 66 36 121
4 18 16 288 324 256
5 2 15 30 4 225
6 13 17 221 169 289
7 8 11 88 64 121
8 2 10 20 4 100
9 6 7 42 36 49
10 13 12 156 169 144
11 5 9 45 25 81
12 3 9 27 9 81
13 12 13 156 144 169
14 4 8 32 16 64
15 19 19 361 361 361
16 10 11 110 100 121

17 17 27 459 289 729
18 5 13 65 25 169
19 4 13 52 16 169
20 22 25 550 484 625
21 7 14 98 49 196
22 12 7 84 144 49
23 1 3 3 1 9
24 2 0 0 4 0
25 23 15 345 529 225
26 4 7 28 16 49
27 9 14 126 81 196
28 3 6 18 9 36
29 4 10 40 16 100
30 13 14 182 169 196
31 15 15 225 225 225
32 7 16 112 49 256
33 16 14 224 256 196
34 8 15 120 64 225
35 19 17 323 361 289
36 12 15 180 144 225
37 6 11 66 36 121
38 16 14 224 256 196
39 14 20 280 196 400
40 18 21 378 324 441
41 14 12 168 196 144

42 14 9 126 196 81
43 7 5 35 49 25
44 6 3 18 36 9
45 3 15 45 9 225
46 10 24 240 100 576
47 12 15 180 144 225
48 14 25 350 196 625
49 15 21 315 225 441
50 18 27 486 324 729
51 16 10 160 256 100
52 12 13 156 144 169
53 7 9 63 49 81
54 9 20 180 81 400
55 9 14 126 81 196
56 10 12 120 100 144
57 8 12 96 64 144
58 6 7 42 36 49
59 6 10 60 36 100
60 12 19 228 144 361
61 17 21 357 289 441
62 4 12 48 16 144
63 3 10 30 9 100
64 12 16 192 144 256
65 6 7 42 36 49
66 12 23 276 144 529

67 3 8 24 9 64
68 11 14 154 121 196
69 1 2 2 1 4
70 12 11 132 144 121
71 17 17 289 289 289
72 11 10 110 121 100
73 4 14 56 16 196
74 10 11 110 100 121
75 10 18 180 100 324
76 2 15 30 4 225
77 2 9 18 4 81
78 14 20 280 196 400
79 2 7 14 4 49
80 3 4 12 9 16
81 3 8 24 9 64
82 10 12 120 100 144
83 7 10 70 49 100
84 5 6 30 25 36
85 14 14 196 196 196
86 14 10 140 196 100
87 16 14 224 256 196
88 14 13 182 196 169
89 14 15 210 196 225
90 28 24 672 784 576
91 13 18 234 169 324

92 17 20 340 289 400
93 12 16 192 144 256
94 17 12 204 289 144
95 12 15 180 144 225
96 14 14 196 196 196
97 18 16 288 324 256
98 11 12 132 121 144
99 6 3 18 36 9
100 9 9 81 81 81
n=100 𝑥 =1011 𝑦 = 1308 𝑥𝑦 = 15316
𝑥2
= 13399
𝑦2
= 20148
Ho = There is no significant correlated between level of insomnia and depression among
undergraduates in UTAR.
Hi = There is significant correlated between level of insomnia and depression among
undergraduates in UTAR.
n=100, 𝑥 = 1011, 𝑦 = 1308, 𝑥2 = 13399 , 𝑦2 = 20148 𝑥𝑦 = 15316
𝑟xy = 𝑛 . 𝑥𝑦 − ( 𝑥 𝑦)
[(𝑛 . 𝑥2)− (𝑥)2][(𝑛 . 𝑦2)− (𝑦)2]
= 100 𝑥15316 − (1011 𝑥1308)
[ 100 𝑥 13399 − 1011 2][ 100 𝑥 20148 −(1308)2]
= 209212
317779 𝑥 303936
= 209212
310780.434
= 0.673
df = (number of pairs-2)
= 100-2
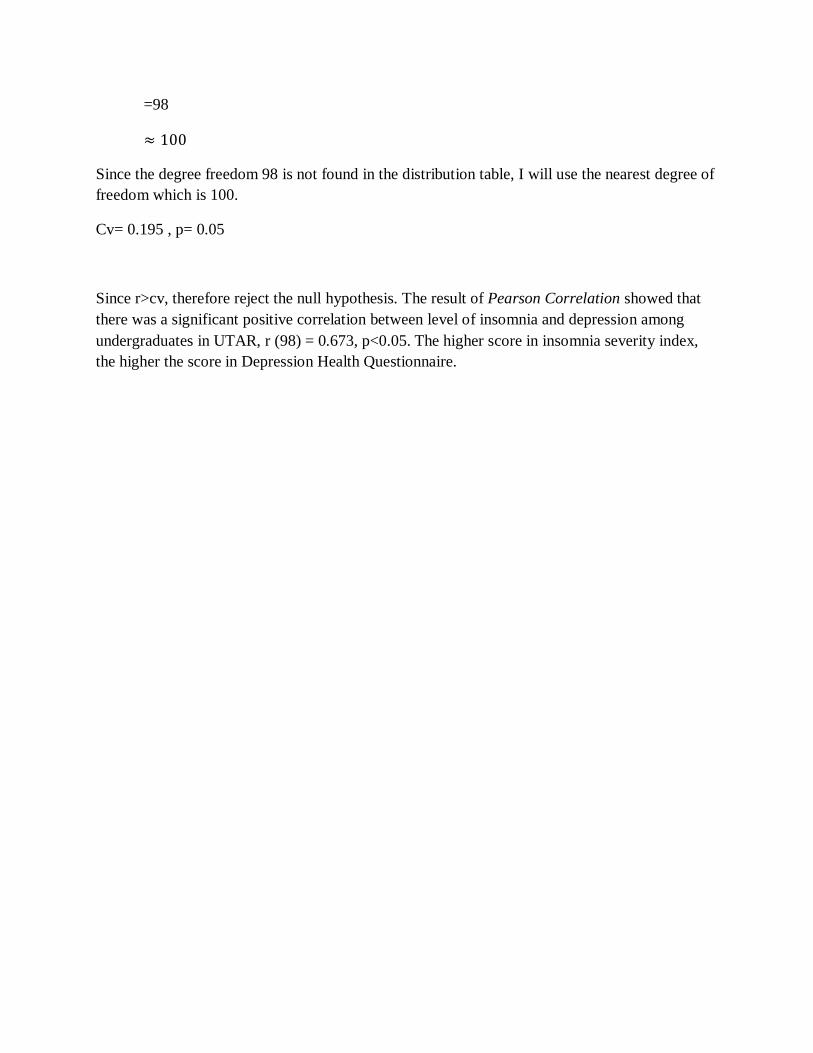
=98
≈ 100
Since the degree freedom 98 is not found in the distribution table, I will use the nearest degree of
freedom which is 100.
Cv= 0.195 , p= 0.05
Since r>cv, therefore reject the null hypothesis. The result of Pearson Correlation showed that
there was a significant positive correlation between level of insomnia and depression among
undergraduates in UTAR, r (98) = 0.673, p<0.05. The higher score in insomnia severity index,
the higher the score in Depression Health Questionnaire.
Recommended