© ABB Group November 4, 2011 | Slide 1
Capital Markets Day Joe Hogan, CEO
November 4, 2011

© ABB Group November 4, 2011 | Slide 2
Operational cost out focus through the cycle
Continued expansion in emerging markets
Technology leadership with focus on renewables, energy efficiency & smart grids
Results of cost take-out program [in $bn]: 19 new factories / engineering centers in EM1): Annual R&D spend:
Leading high tech infrastructure company Commitment to a strong cash flow generation
Example: 400MW transmission line in Germany Cash flow from operations [in $bn]:
2009
1.5
2010
1.5
9m 2011
0.8
2008
4.0
2009
4.0
2010
4.2
9m 2011
1.9
Brazil 1 new site LP, DM
Bulgaria 1 new site LP
China 8 new sites DM, PA
Mexico 1 new site PP, PS, DM, LP
Poland 2 new sites DM
India 3 new sites PP, PS, DM, LP
Vietnam 1 new site PP
(1) PP = Power Products, PS = Power Systems, DM = Discrete Automation and Motion, LP = Low Voltage Products, PA = Process Automation
% o
f sal
es
in $bn
2008
2.9%
2009
3.3%
2010
3.4%
2011F
3.5%
1.0 1.0 1.1 1.3 South Africa 1 new site All
Estonia 1 new site DM
Commitments made at 2009 CMD We have executed well

© ABB Group November 4, 2011 | Slide 3
2006
$1.9
2007
$3.1
2008
$4.0
2009
$4.0
2010
$4.2
Peer Group: Cooper, Eaton Electric, Emerson, Rockwell, Schneider Electric, Siemens
Cash Flow from Operations (CFO) and CFO to EBITDA(1)
2006
$23.3
2007
$29.2
2008
$34.9
2009
$31.8
2010
$31.6
2006 2007 2008 2009 2010
2006
42%
58%
2007
45%
55%
2008
45%
55%
2009
48%
52%
2010
50%
50%
2010 Peers
31%
69%
Revenue ABB vs. peer group Geographic revenue mix between 2006 - 2010
Dividend development ABB vs. peer group
Nominal revenue, $ bn, index 2006
Emerging Markets
Mature Markets
∆ =19%
ABB
Peers
Index DPS 2006: ABB = CHF0.24, Peers = $1.79
ABB
Peers
Index= 100
150 ABB
Peers
CAGR % 2006-2010
6.3%
2.7%
Index= 100
200
300
60%
100% CFO to EBITDA (%)
Source: Thomson Reuters
(1) Adjusted for compliance provision in 2008 and 2009
ABB has performed and is well positioned for the economic environment
2006
12%
18%
24%
46%
9m 2011
11%
24%
27%
38%
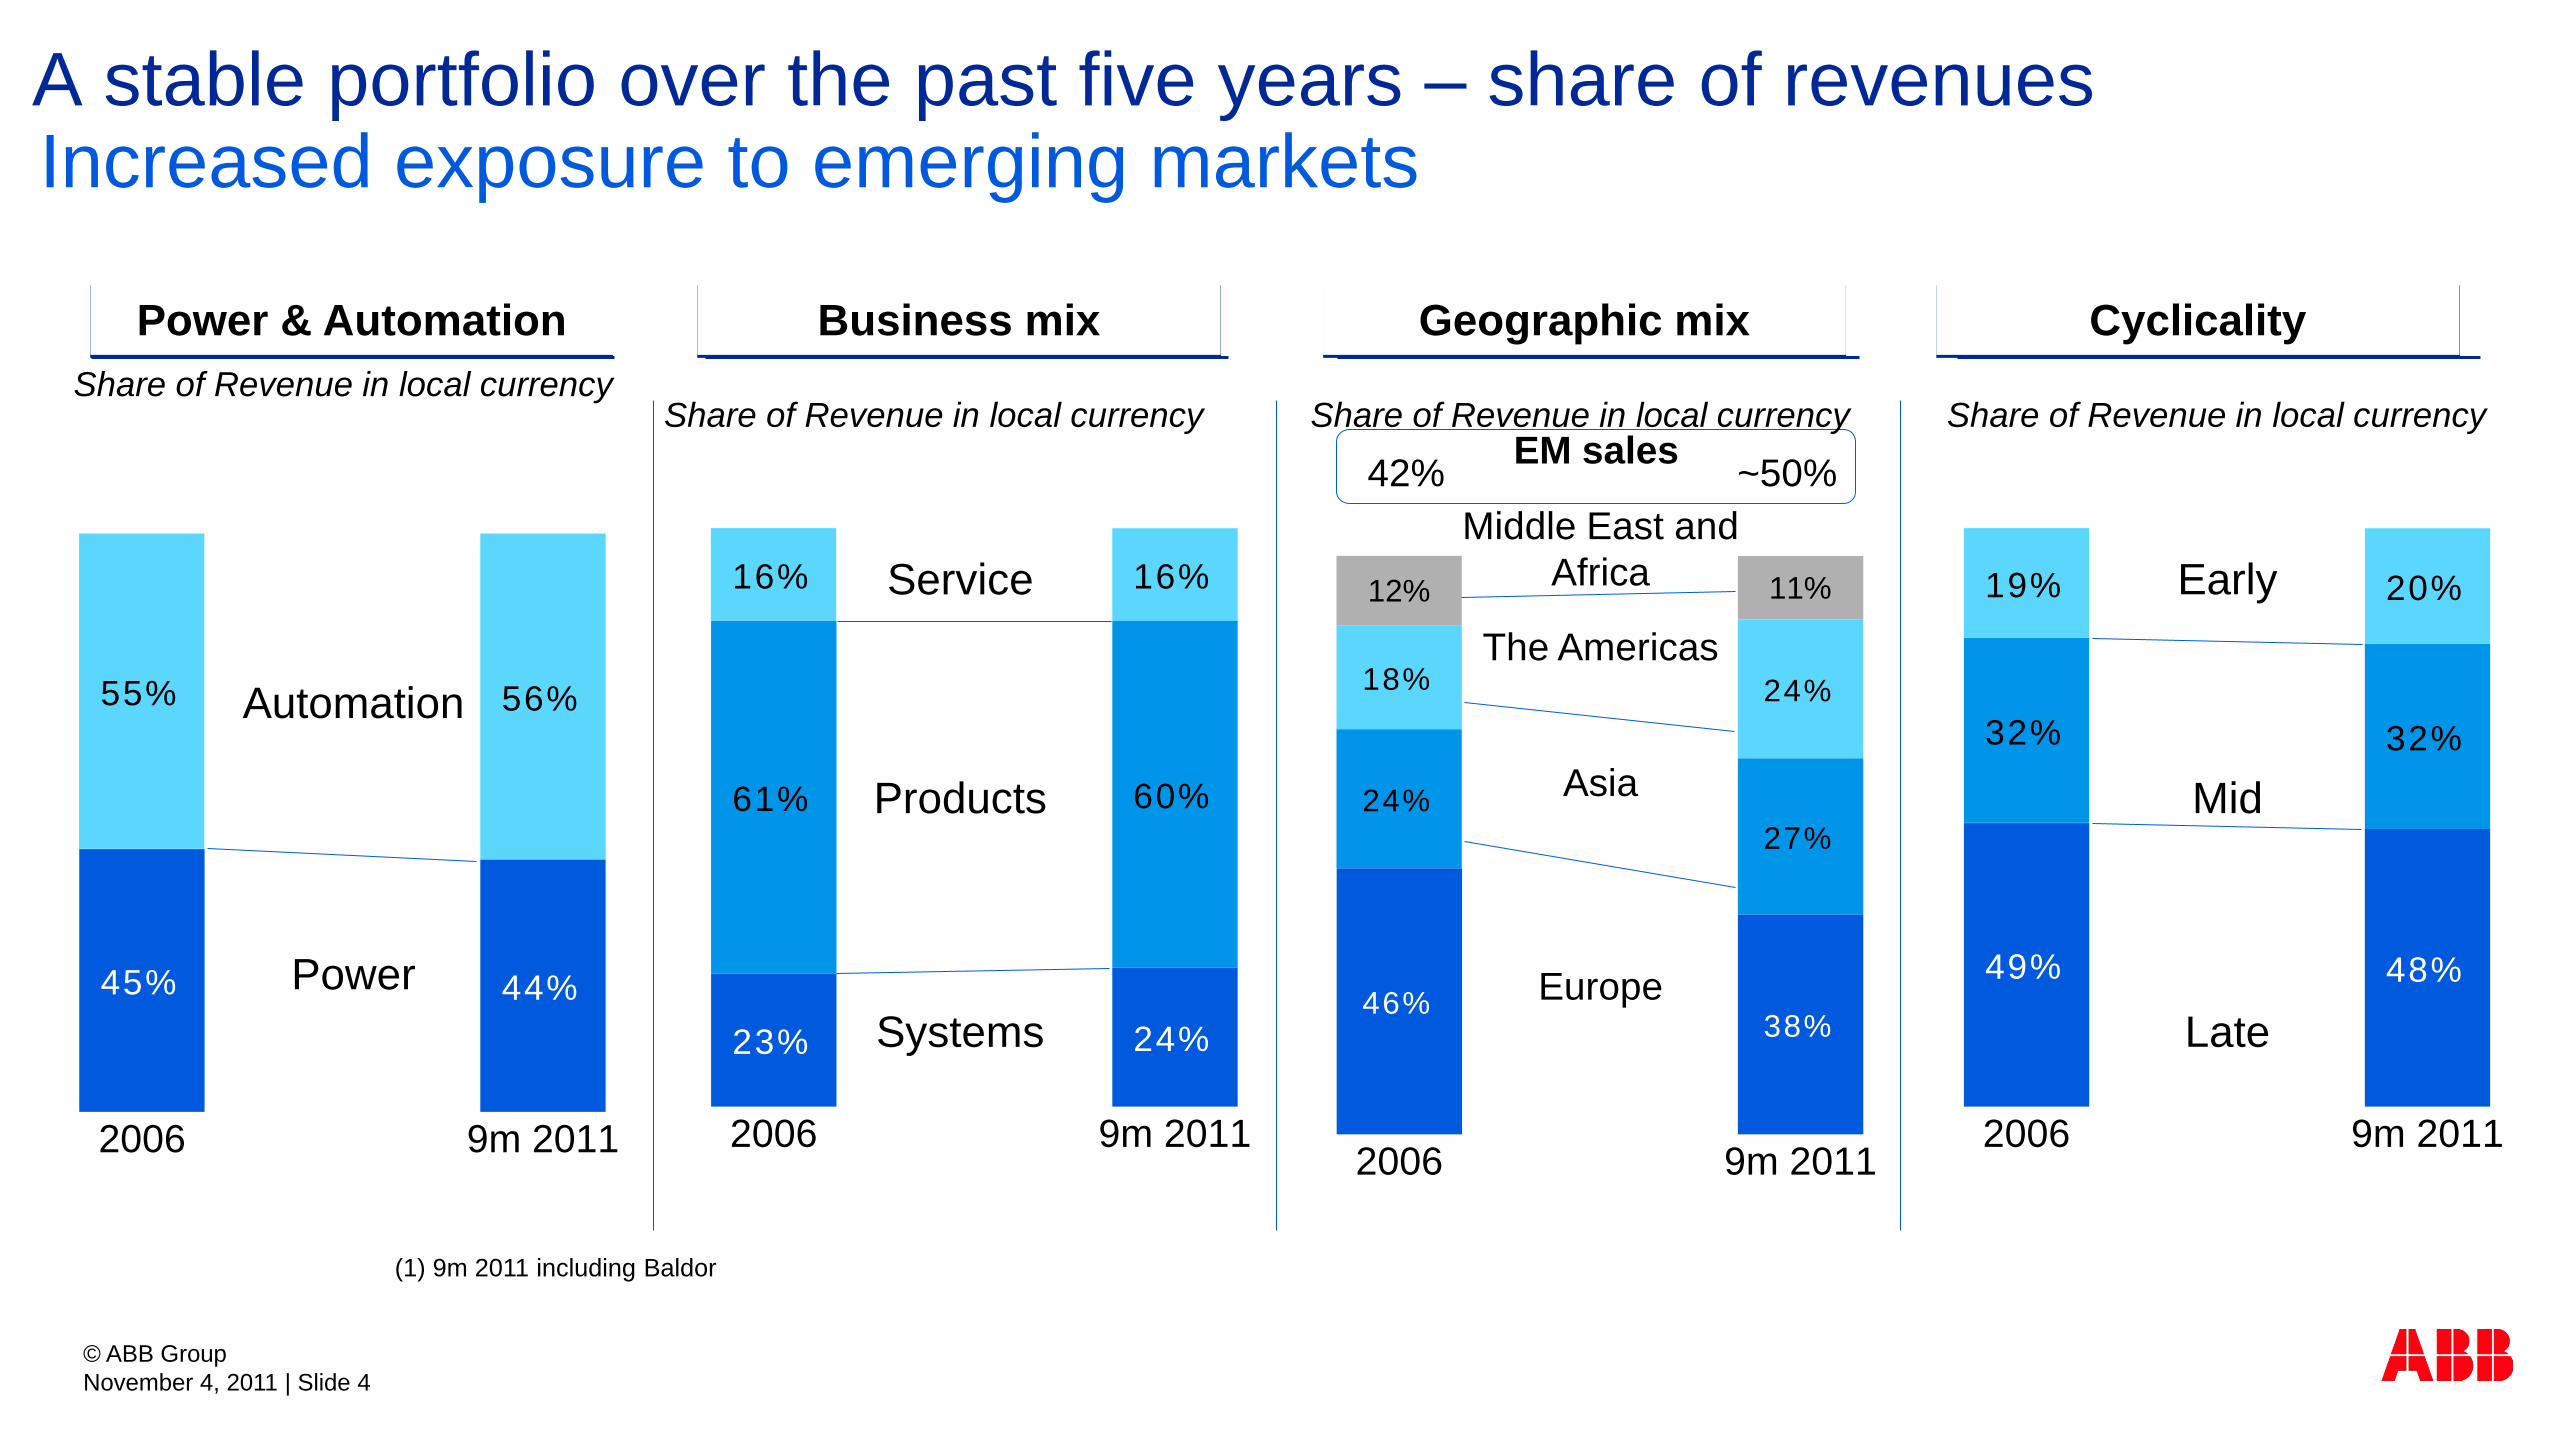
A stable portfolio over the past five years – share of revenues Increased exposure to emerging markets
(1) 9m 2011 including Baldor
Power & Automation Business mix Geographic mix Cyclicality
2006
55%
45%
9m 2011
56%
44%
Automation
Power Systems
Service
Products
2006
16%
61%
23%
9m 2011
16%
60%
24% Late
Early
Mid
2006
49%
32%
19%
9m 2011
48%
32%
20%
The Americas
Middle East and Africa
Asia
Europe
Share of Revenue in local currency
EM sales 42% ~50%
Share of Revenue in local currency Share of Revenue in local currency Share of Revenue in local currency
© ABB Group November 4, 2011 | Slide 4

© ABB Group November 4, 2011 | Slide 5
Enhancing competitiveness through cost reduction >$3.5bn savings starting in 2009
Annual impact vs. 2008 [$ bn]
Sourcing
Footprint & restructuring
Operational Excellence
Examples of achievements since we started:
25% increase of floor space in emerging markets R&D resources in EMs up 4x (>1,500 people) since 2005
Number of products re-designed to cost: 400+ Warranty savings: $100mn+
G&A cost
1.8 Emerging market sourcing increased by 40% Number of global forwarders reduced by 50%
0.8
0.9
0.3
Savings from sharing finance & HR services: $100mn+ Renegotiated IS outsourcing agreement: $50mn

© ABB Group November 4, 2011 | Slide 6
Realignment of automation products businesses
© ABB Group November 4, 2011 | Slide 6
Revenues EBITDA Peak Year - 2008
$11bn $2.1bn
Revenues EBITDA Trailing 12 months to Sep 11
$12bn $2.4bn
(1) Third party in local currency (2) Third party in local currency adjusted for Instrumentation and excluding Baldor
Breakers & Switches Enclosures & Din-rail Wiring Accessories Control Products LV Systems
LV Drives PES and MV Drives Motors and Generators Robotics
LV Products
Discrete Automation and Motion
Breakers & Switches Enclosures & Din-rail Wiring Accessories Control Products LV Systems LV Drives PES and MV Drives Motors & Generators
Automaiton Products
Robotics
Robotics

© ABB Group November 4, 2011 | Slide 7
Marketing & Customer Solutions created in 2009 Strengthening a culture that is externally focused
ABB Technology Ventures
Investing in early stage technologies of strategic interest to ABB 7 companies and 2VC fund investments since 2009
Group Account Management
Drive sustainable growth for our customers and ABB Unified and responsive face to its customer
Wind Rail Solar Energy Efficiency Water Smart Grid
Industry Segment Initiatives
Mar
ketin
g &
Cus
tom
er S
olut
ions
Data Center

© ABB Group November 4, 2011 | Slide 8
Baldor’s stand-alone performance 9m 20111 vs. last year
Synergy update
20% revenue growth, higher prices and volume
Operational EBITDA up by >40%2
Operational EBITDA margin at 20%3
Good progress in cross-selling NEMA/IEC motors and drives
Upside from mechanical power transmission orders outside U.S.
Sourcing and other cost savings in line with plan
1 Febr-Sept 2011 vs 2010. 2 Indicative; 3 Operating profit margin based on Baldor historical definition at 17.1% in YTD 2011 vs 14.2% in YTD 2010
Our acquisitions have performed well Baldor growing strongly, synergies starting to kick in

Ventyx and Mincom acquisitions create a new force The world’s leading enterprise asset management platform
Market leader in major regions… … and industries
#2
#1
#1 Electric Power Generation
Electric Power T&D
Mining & Metals
Enterprise Asset Management software is a $1.9bn industry growing at 6% p.a.
in Latin America
in North America
in Asia
#1
#1
#1
Latin America: Mexico, Central America, South America Asia: Japan, China Taiwan, South East Asia, Korea, Australia North America: US and Canada Source: ARC Advisory, EAM Solutions Worldwide Outlook 2011
© ABB Group November 4, 2011 | Slide 9

© ABB Group November 4, 2011 | Slide 10
© ABB Group November 4, 2011 | Slide 10
Target Key Products What capability did this acquisition bring? (1)
DC power infrastructure for data centers
Completes the ABB DC data center portfolio Channels to market for the US data centers Global product applications
Electric vehicle charging infrastructure solutions
DC charger control platform and software Software suite for charger infrastructure management Robust maintenance service business model
Automated fiber and pulp analysis devices Increases pulp and paper expertise Increases application process knowledge Pull through of hardware and systems
Dry-type transformers Extends ABB’s portfolio in dry transformers Widens end market exposure Strengthens higher voltage dry technology
ABB accelerated bolt-on acquisitions in 2011
(1) Controlling interest investment through ABB Technology Ventures

© ABB Group November 4, 2011 | Slide 11
Summary of Progress to Plan We created a better balanced, increasingly market focused organization
• Outperformed peer set on most measures
• Implemented operational cost out actions resulting in significant savings
• Generated superior cash flow in the period
• Aligned organization for better growth and transparency
• Aggressive emerging markets growth resulting in better global balance
• Drove organic and inorganic growth

© ABB Group November 4, 2011 | Slide 12
ABB has evolved over the past decade From holding company to locally relevant globally optimized organization
Highly decentralized conglomerate
Highly centralized organization
Pros 1000s of P&Ls Local autonomy Speed to market Market segmentation
Cons 1000s of P&Ls Little scale Poor coordination Little best practice sharing
Pros One size fits all Leverage scale Process optimization Best practice sharing
Cons Operational flexibility Corporate down view Slow to market Local market effectiveness
Highly decentralized conglomerate

© ABB Group November 4, 2011 | Slide 13
The nature of global business is changing In Country for Country becoming a competitive advantage for ABB
Indigenous products & services
Local sales force
Local engineering
Manufacturing assembly
Global R&D
Global sourcing
Local R&D (close to markets)
Product Mgmt.(local markets)
Project Mgmt. & System integr
Local sales force
Local engineering
Manufacturing assembly
Global R&D
Global sourcing
Local sales force
Manufacturing assembly Export sales force
In Country for Country
Cost arbitrage
Exporter
ABB Group
ABB China
ABB India
Local competitor
Export driven sales Stage 1 Stage 3 Stage 4 Stage 2
Manufacturing assembly Manufacturing assembly

© ABB Group November 4, 2011 | Slide 14
Five components of ABB strategic direction Strong execution and focus across these key strategic areas
Drive competitiveness and stay relevant in our current markets 1 Capitalize on mega trends: anticipate, participate and lead in key mega trends 2 Aggressively expand core business to secure next level of growth 3 Disciplined M&A across products, markets and geographies 4 Find and exploit disruptive opportunities in relevant markets 5

Drive competitiveness Focus on a range of Group-wide programs
Global footprint
Ambition Focus areas
Supply chain management
Operational excellence
“To develop, produce, source and
sell optimally to match market
needs, profitably growing the
business while increasing levels of
productivity and quality”
1
In country for country
Customer satisfaction
© ABB Group November 4, 2011 | Slide 15

© ABB Group November 4, 2011 | Slide 16
In country for country
Moving closer to customers and markets allows ABB to move at local speeds and develop products for local markets
Product competitiveness based on:
Local product requirements
Local competitiveness: cost and performance
Innovation
Speed to market
Technology development Driving competitiveness begins with product development 1
2009
75%
25%2010
74%
26%9m 2011
70%
30%2015F
50%
50%
Mature markets
Emerging markets
Development of R&D employees
Annual R&D spend as % of sales
2008
2.9%
2009
3.3%
2010
3.4%
2011F
3.5%
2015F
4.0%
© ABB Group November 4, 2011 | Slide 17
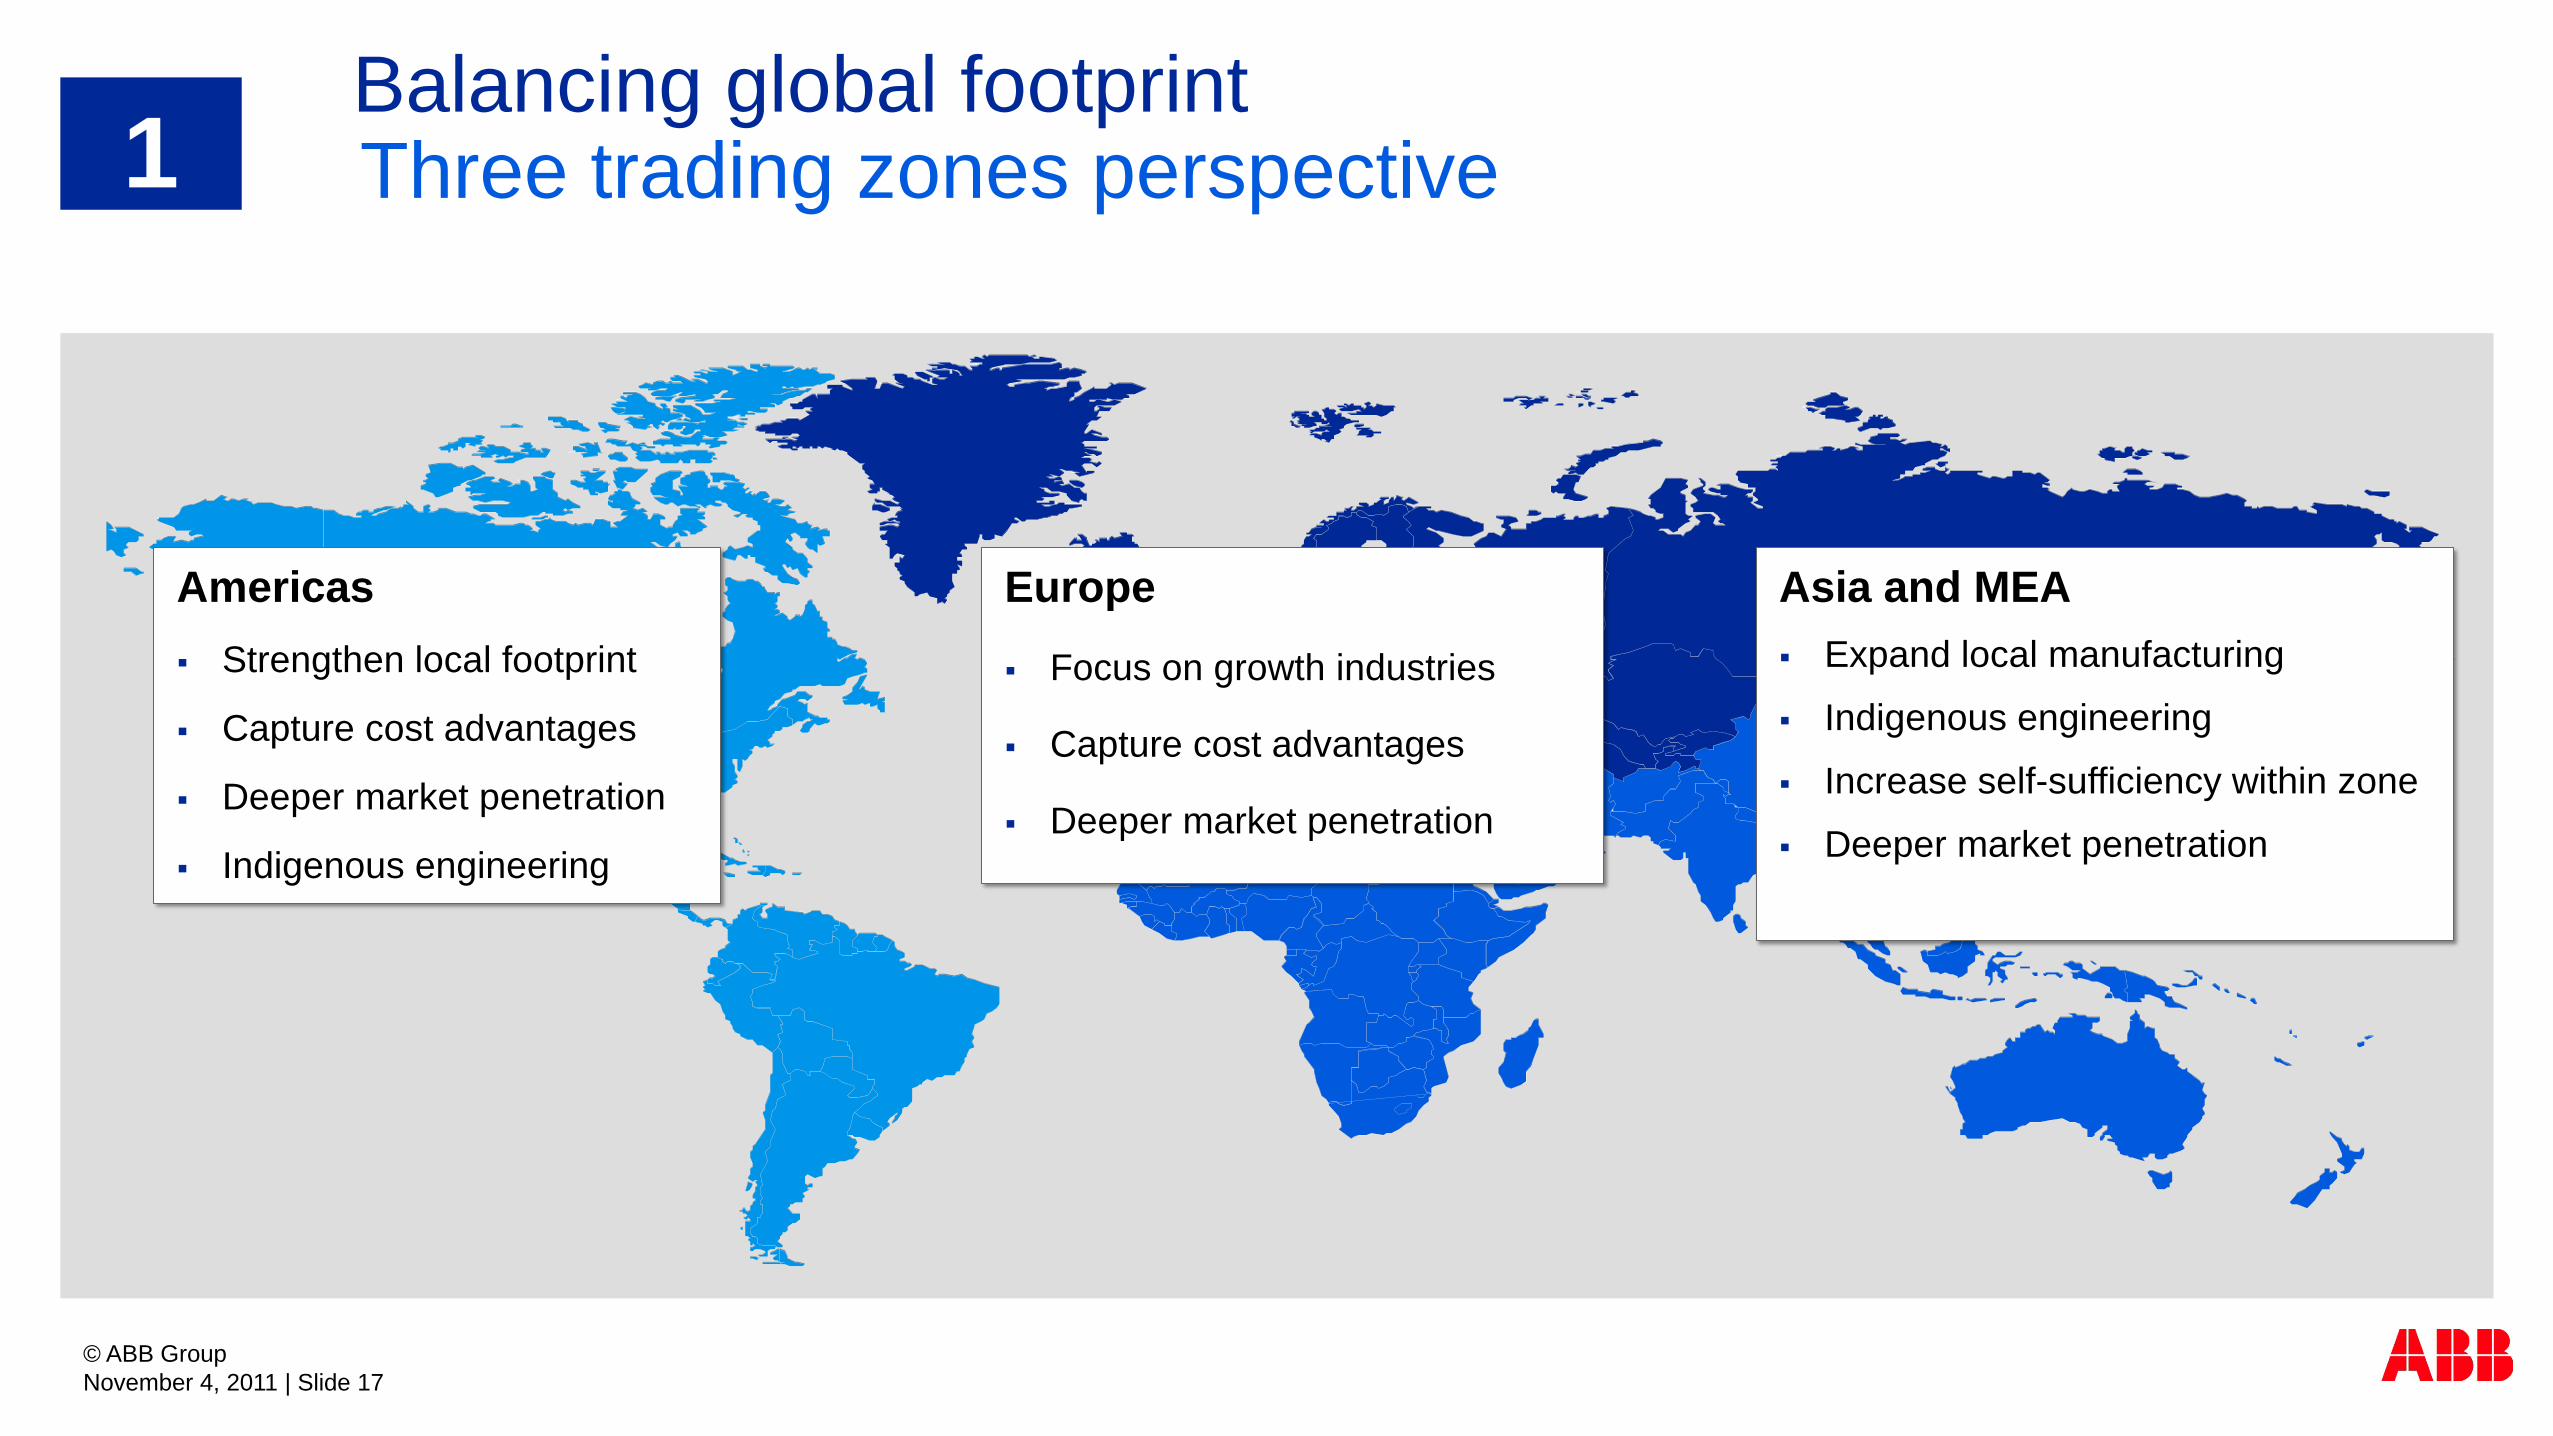
Balancing global footprint Three trading zones perspective
Americas
Strengthen local footprint
Capture cost advantages
Deeper market penetration
Indigenous engineering
Asia and MEA Expand local manufacturing
Indigenous engineering
Increase self-sufficiency within zone
Deeper market penetration
Europe
Focus on growth industries
Capture cost advantages
Deeper market penetration
1

Drive the next level of supply chain excellence Reducing costs while improving quality
© ABB Group November 4, 2011 | Slide 18
Strategy: “Glocalized“ strategic commodity management
Maximum efficiency in logistics
1
People: Training & certification of professionals
Organizational structure to support objectives
Emphasize strategic vs transactional approach
Supply base collaboration
Processes & systems: Proactive risk management
Improved quality and sustainability processes
Standard IS for performance management

Capitalizing on mega trends Global megatrends will override short-term volatility 2
Mega-trends relevant for ABB long term growth
Deep understanding of markets
Penetration of key geographic areas
Execution around markets and trends
Continued investment in R&D
Strong sales / distribution
How will we capitalize on these trends?
© ABB Group November 4, 2011 | Slide 19
© ABB Group November 4, 2011 | Slide 20
Renewables
20%
0% 10 200
Market Size in 2010 ($bn)
Mar
ket G
row
th
CA
GR
201
0 -
2015
Geographic Market
Penetration
Smart Grid
Oil & Gas Frontiers
Data Centers
Software
Industrial Automation
Mechanical Equipment &
Service
Power Electronics
DC Technology
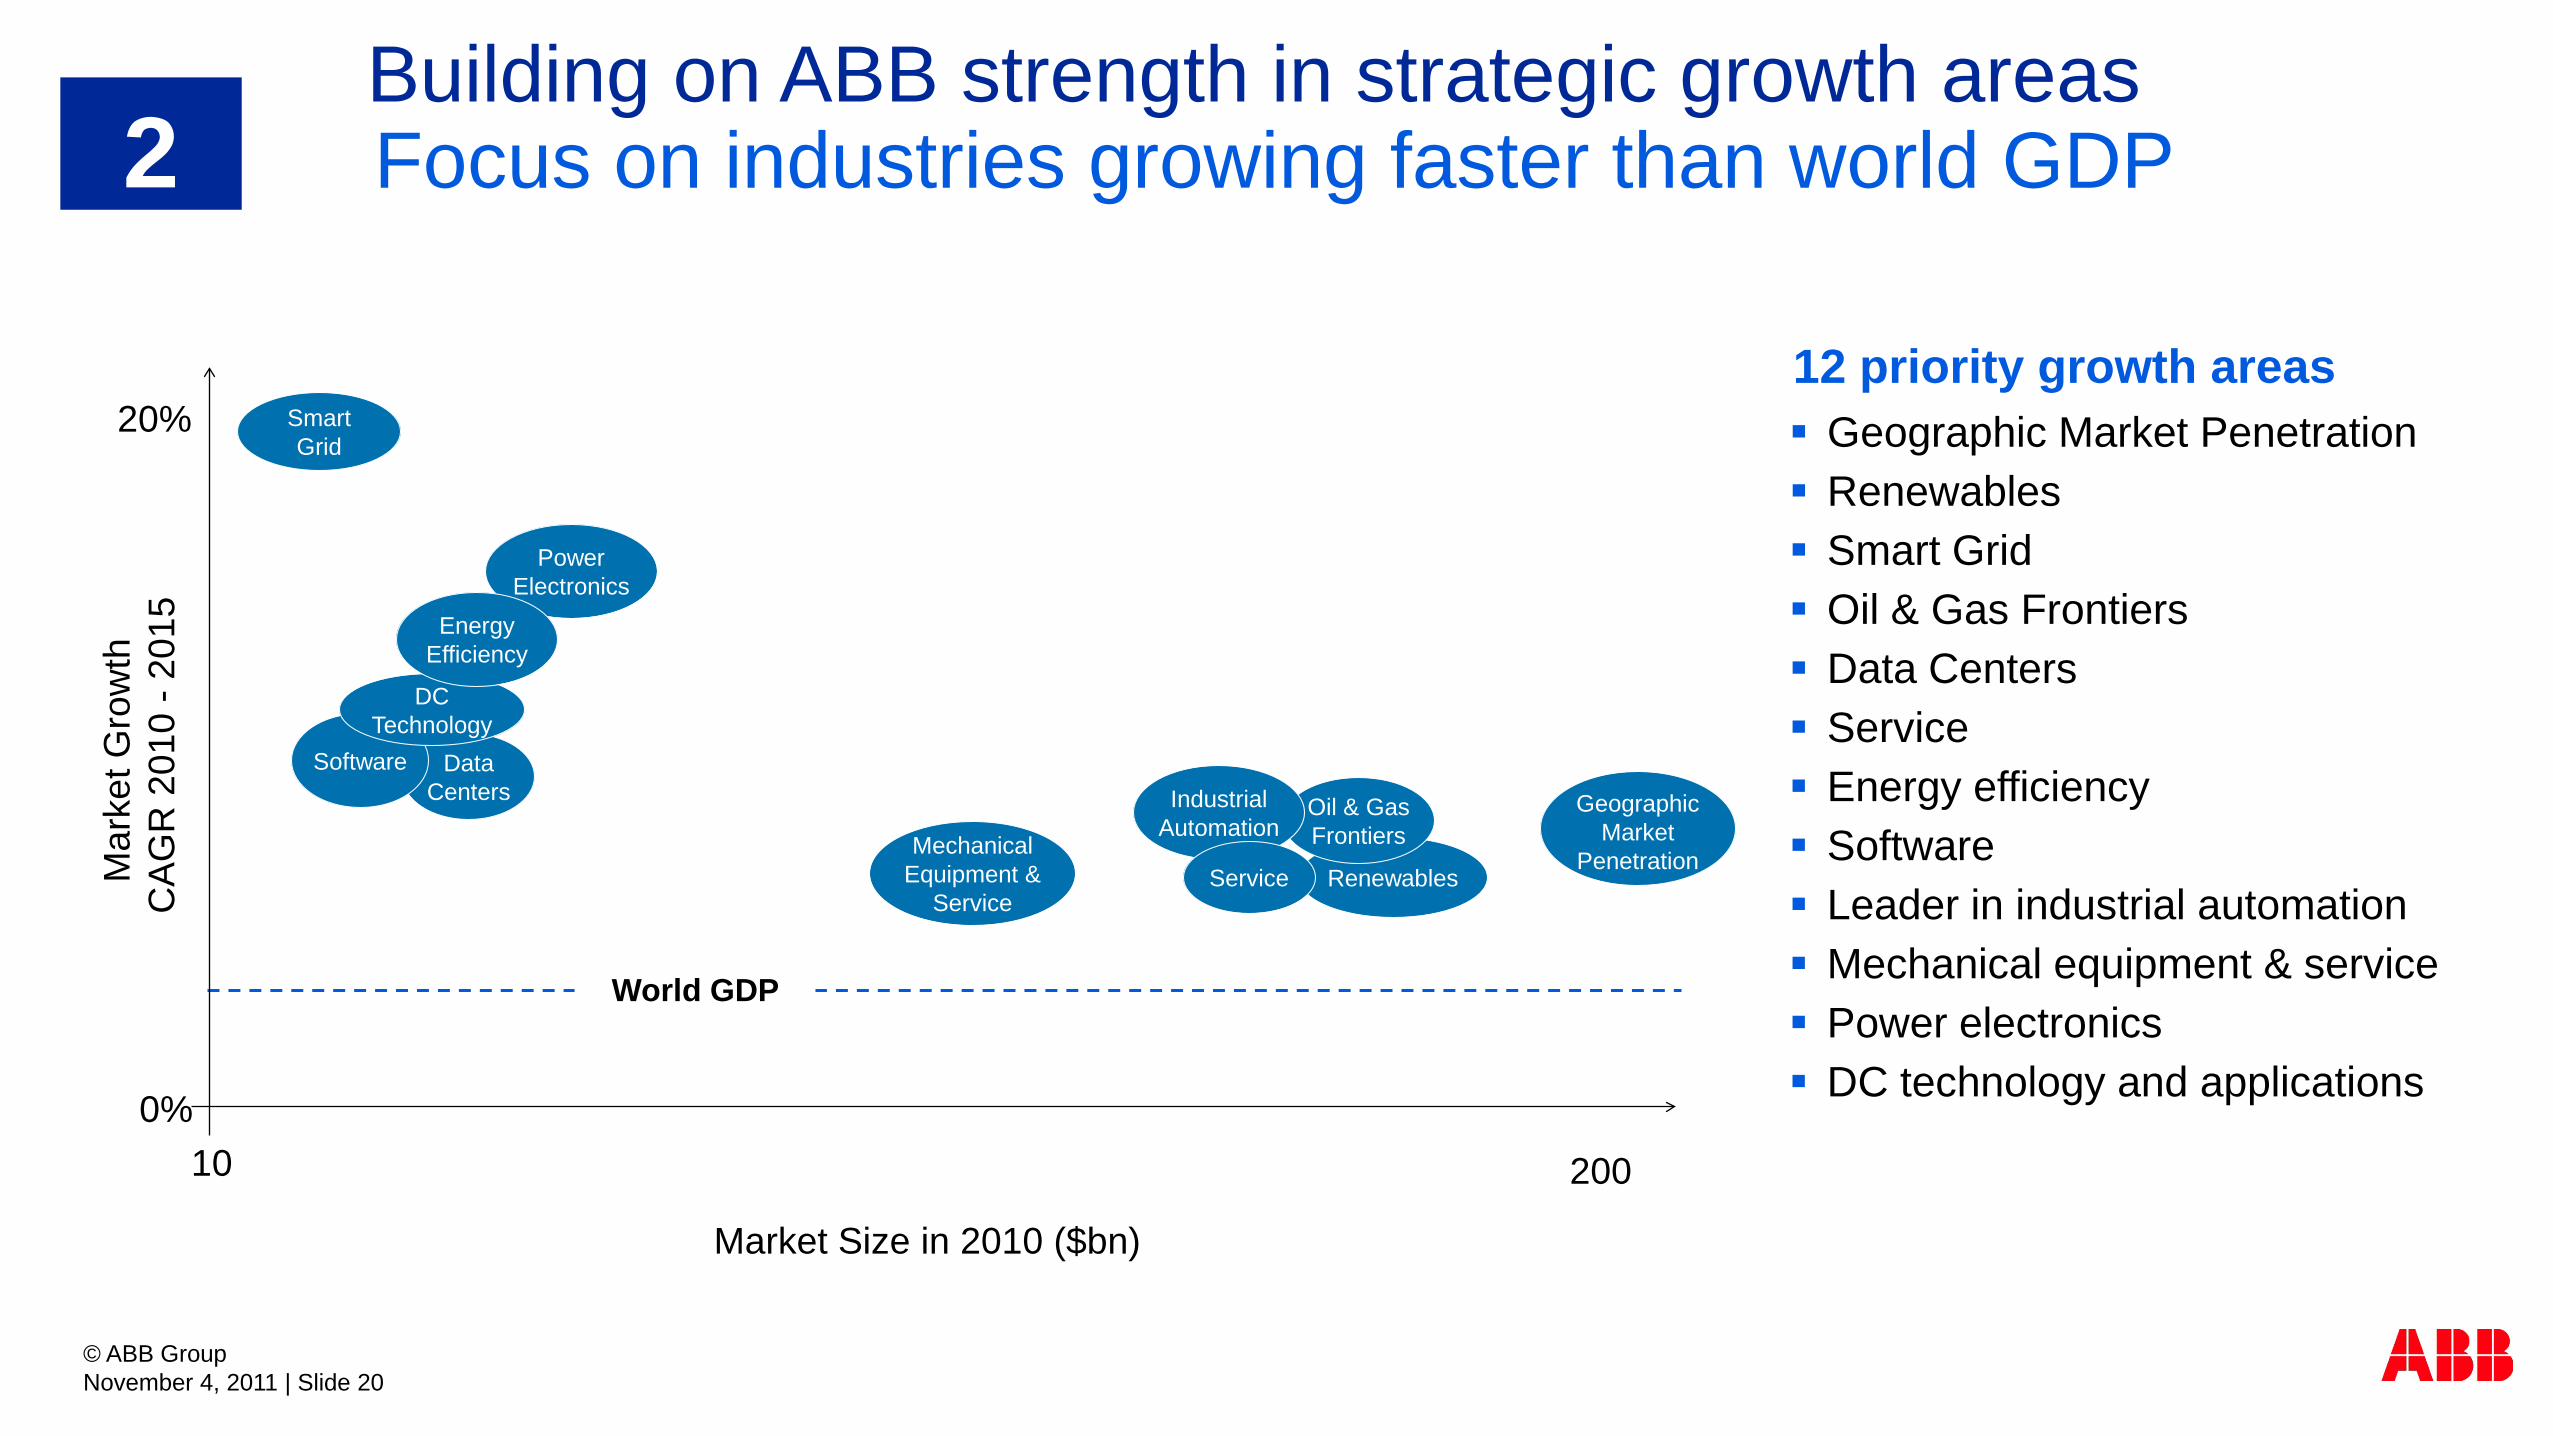
Geographic Market Penetration Renewables Smart Grid Oil & Gas Frontiers Data Centers Service Energy efficiency Software Leader in industrial automation Mechanical equipment & service Power electronics DC technology and applications
Service
12 priority growth areas
World GDP
Energy Efficiency
Building on ABB strength in strategic growth areas Focus on industries growing faster than world GDP 2

© ABB Group November 4, 2011 | Slide 21
Focus on emerging and mature markets with high growth Traditional mature markets still with significant opportunity
0 300 600 900 1'200 1'500 1'800 2'100
Netherlands 56Sweden 57Nigeria 58
S. Africa 61Spain 66
Argentina 70Italy 77
Poland 85Saudi Arabia 100
Indonesia 130Australia 134Canada 154Turkey 160Mexico 187Russia 195
S. Korea 216France 221
UK 239Brazil 280
Germany 282Japan 400
India 619EU 27+ * 1'396
U.S. 1'707China 1'955
2.5%
3.9%
3.8%4.0%
2.4%5.1%
3.0%6.1%
0.9%
5.0%4.1%
8.6%
1.1%5.0%
3.9%6.4%2.7%1.6%
1.8%8.4%1.7%1.8%4.7%2.0%1.9%
2010
32%
68%
49
2015FC
36%
64%
58
World GDP in real USD trillion
Net GDP growth by country 2010 to 2015
Mature markets
B $
GDP growth 2010 – 2015, %
Source: Global Insight, World Real GDP, Sep 2011; *European Union 27 member states plus Norway & Switzerland
GDP CAGR> 5%
Emerging markets
2
~$4tn
~$5tn
© ABB Group November 4, 2011 | Slide 22
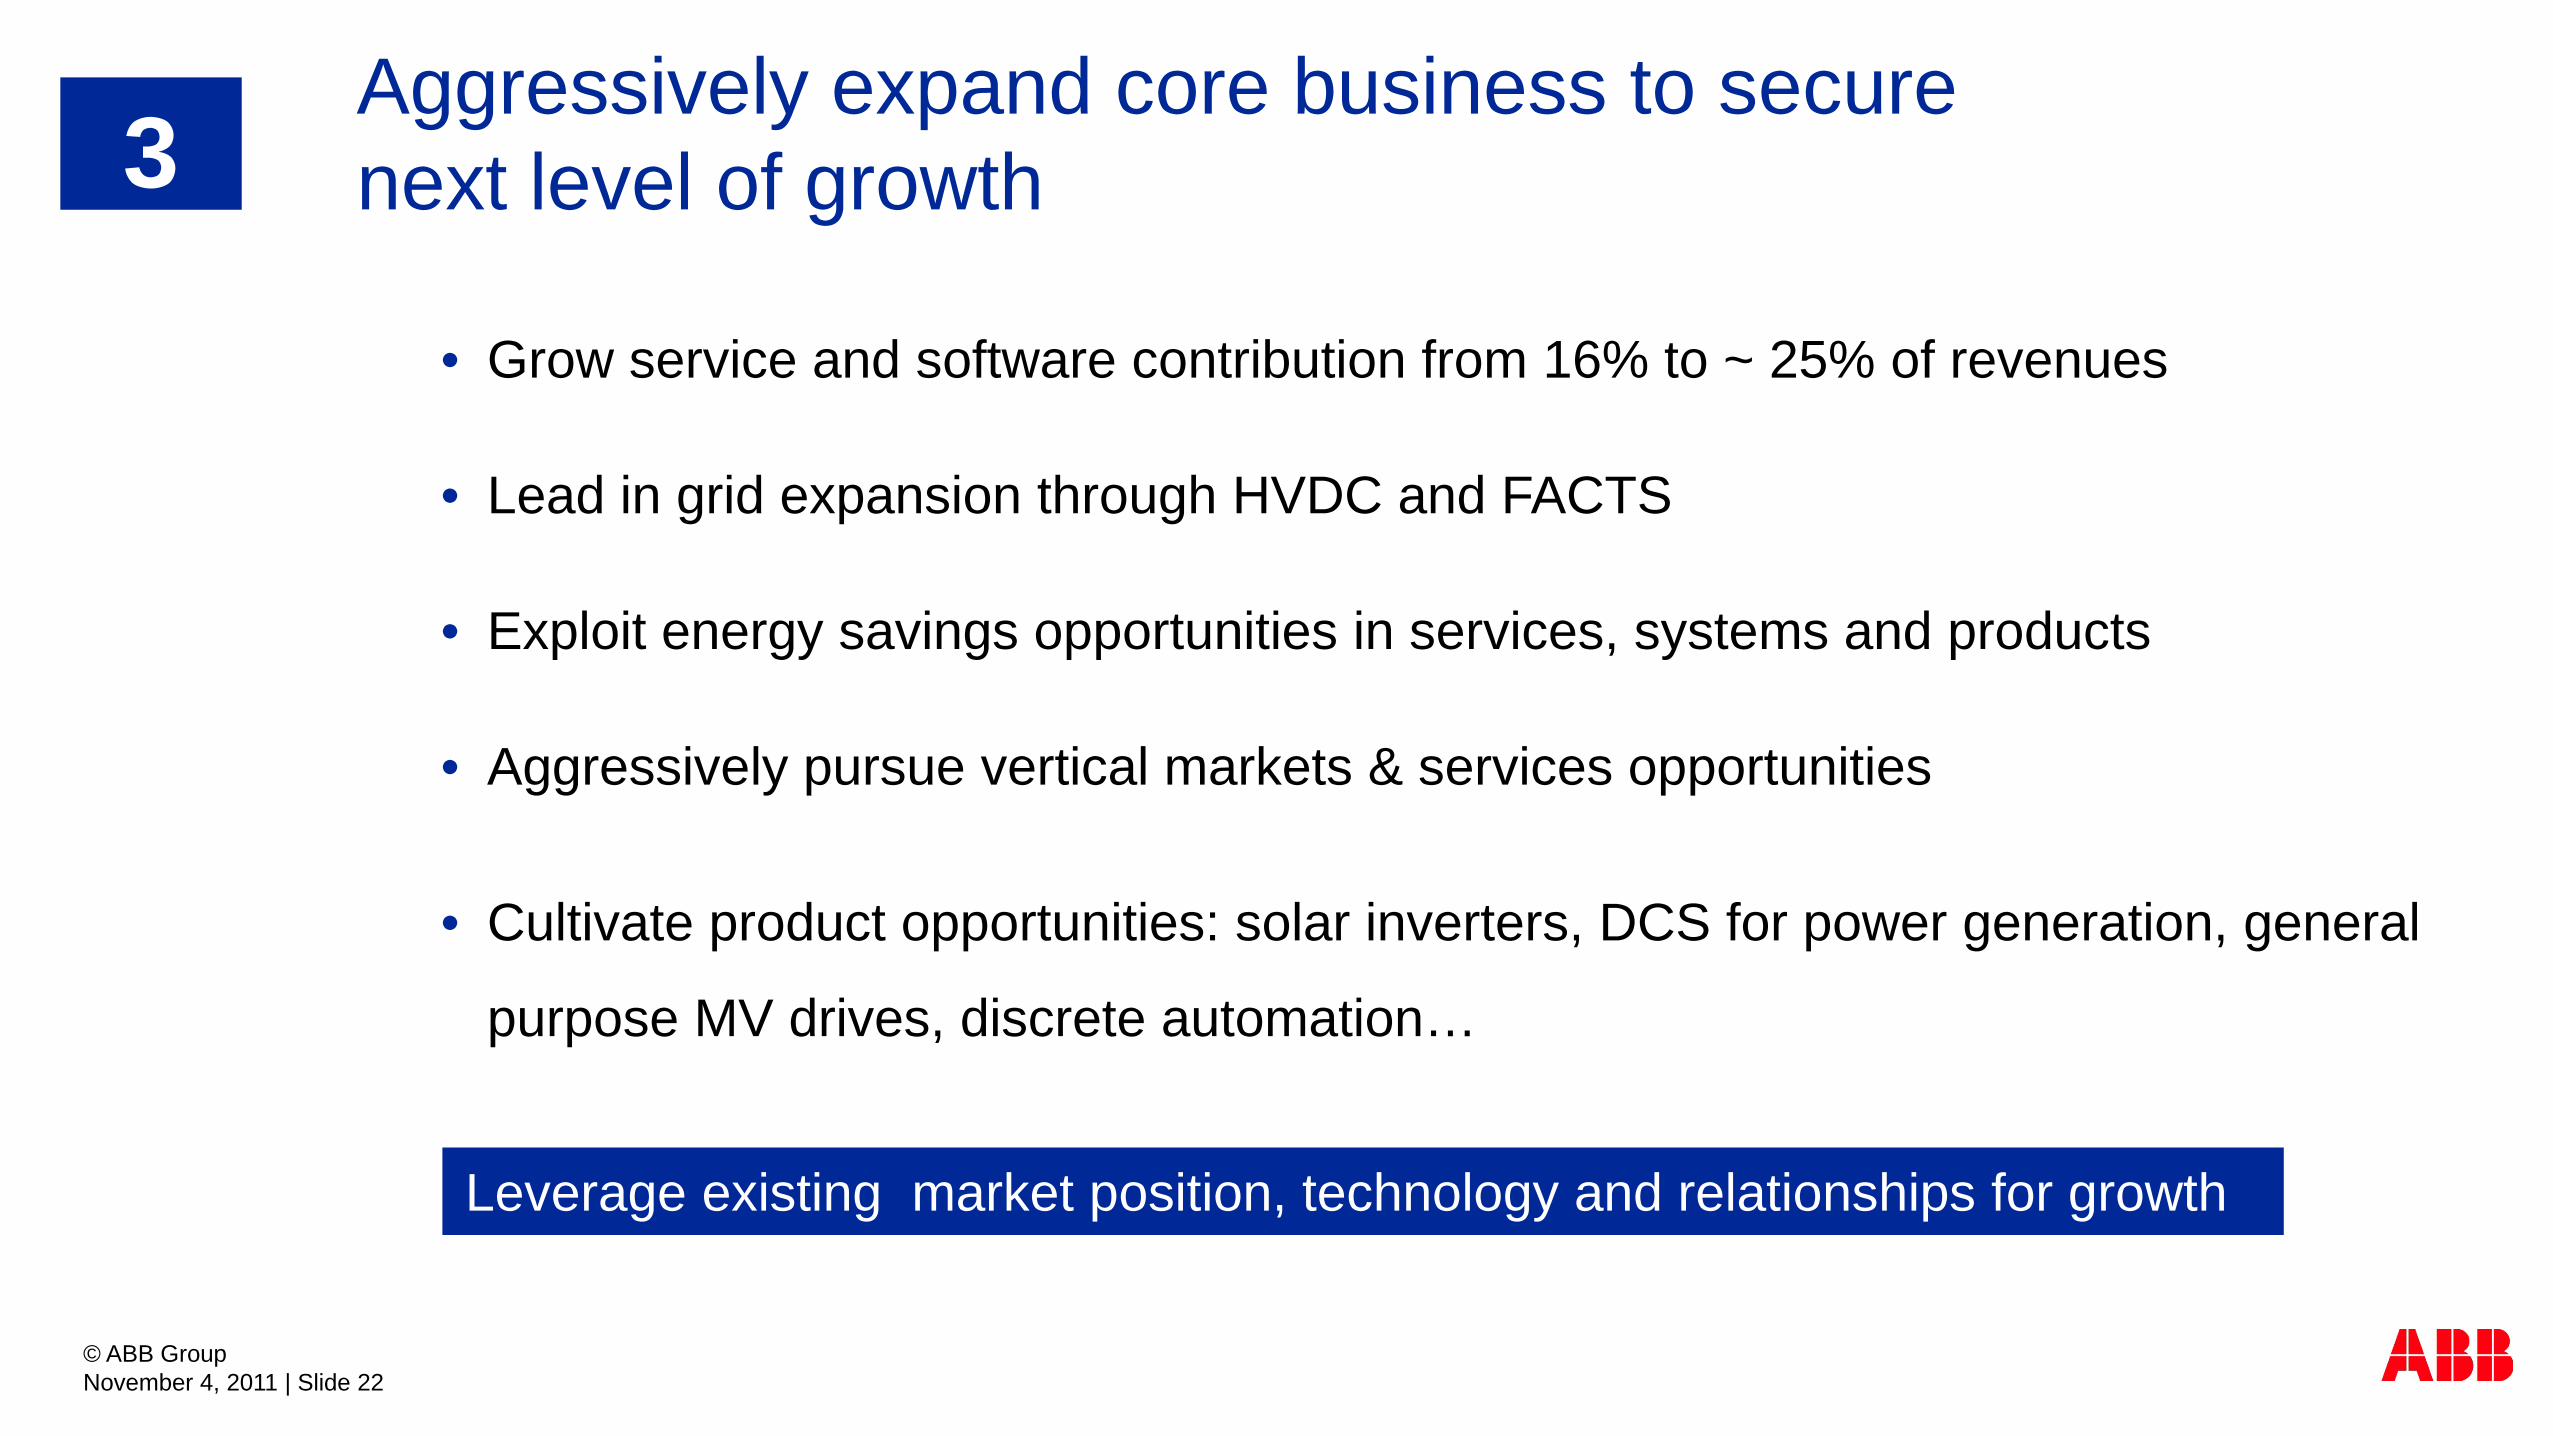
Leverage existing market position, technology and relationships for growth
• Grow service and software contribution from 16% to ~ 25% of revenues
• Lead in grid expansion through HVDC and FACTS
• Exploit energy savings opportunities in services, systems and products
• Aggressively pursue vertical markets & services opportunities
• Cultivate product opportunities: solar inverters, DCS for power generation, general
purpose MV drives, discrete automation…
Aggressively expand core business to secure next level of growth
3

© ABB Group November 4, 2011 | Slide 23
Plant operations
Plant / system maintenance
Design
engineering
Mobile workforce
Customer service
Information technology Plan-Construct-Service-Maintain
Energy management infrastructure Generation – Transmission - Distribution
Transmission
grid operations
Distribution grid
operations /
Outage management
Generation
operations
Operations technology Operate assets-real-time-event driven
Generation
Transmission grid
Distribution grid
Customers
Distribution feeders
Communication
ABB mix is changing towards more IT/OT Business model for OT is evolving towards IT OT installed base becomes a highly valuable driver for profit
3 Modernizing our software business model Transitioning from OT to IT
Ventyx and Mincom Historical ABB

2002
2003
2004
2005
2006
2007
2008
2009
2010
2011
2012
2013
2014
2015
ABB to grow service revenues to 20-25% by 2015
Historical service performance
Strong ABB installed base to build on
Several best practices across ABB (e.g. Turbo, LVD)
Above average profitability
Key driver to improve customer satisfaction
Inconsistent “Go to market approach”
Fragmented service offering portfolio
Focus going forward
Fully capitalize installed base potential
Industrialized service offering portfolio
Aligned One ABB `Go-to-market` approach
Leverage M&A to accelerate growth
Clear accountability and ownership
Investment in people
© ABB Group November 4, 2011 | Slide 24
9m 2011 Service Performance (yoy) Orders +16% Revenue +10% EBIT +32%
Accelerating growth in services 3
Ser
vice
rev
enue
s (in
loca
l cur
renc
y)

© ABB Group November 4, 2011 | Slide 25
Markets
Oil & gas, e.g. subsea
Smart grids
Renewables, e-mobility
Data centers
Wind, water and rail
Smart building controls
Product and Services
PLC’s, solar Inverters Industrial software High service products Electro mechanicals Flow valves, measurements
Geography
NEMA motors in US India, USA low voltage US ANSI, NEMA Markets South East Asia Penetration China, relays, MV drives
Disciplined M&A to help close gap areas Acquisitions to act as accelerator in priority gap areas 4

© ABB Group November 4, 2011 | Slide 26
We systematically look for technology and business model disruptions to position ABB for market leadership 5
#1 Smart Phone
#2 Social Networking
#3 Voice Over IP
#4 LED lighting
Top technologies of the decade
(1)
(1) Institute of Electrical and Electronics Engineers , one of the world’s largest professional associations for the advancement of technology.
# 9 ABB’s Pioneer Technology - FACTs
An enabler for a “smarter grid” • Increase transmission capacity – up to 50%
• Improve system stability/reliability
• Improve power quality
ABB Position: • Pioneer and technology leader
• World’s leading supplier
• Delivered >50% of world total installations

© ABB Group November 4, 2011 | Slide 27
Capital Markets Day Michel Demaré, CFO
November 4, 2011

© ABB Group November 4, 2011 | Slide 28
2006 2007 2008 2009 2010 9m 11annualized
Performance against our 2007 – 2011 targets Revenues: Close despite historic downturn
Revenues and revenue CAGR 2007 – 20111
% change year-on-year in local currencies excl. Baldor
CAGR %
10%
15%
20%
5%
0%
Revenues US$ millions
Target CAGR range = 8 – 11%
Organic CAGR ~7%
incl. Baldor
excl. Baldor
1 2011 annualized using 9-months to Sept 2011

© ABB Group November 4, 2011 | Slide 29
Performance against our 2007 – 2011 targets EBIT margin: Within or above the range every quarter over the cycle
1 2007-08 EBIT adj. for transformer restructuring; 2008-10 adj. for cost take-out restructuring program; 2008-09 adjusted for compliance and other provisions; 2009-
11 = operational EBIT -- See Appendix for definitions of non-GAAP measures
EBIT margin1 full year and by quarter 2007 – 9 months 2011 % revenues
8
10
12
14
16
18
2007 2008 2009 2010 9m 11
Full year
By quarter
Target range = 11 – 16%
Reliable earnings delivery High-margin business units maintained
solid performance Fast and effective cost take-out Successful crisis management

© ABB Group November 4, 2011 | Slide 30
Performance against our 2007 – 2011 targets Cash flow conversion: Excellent quality of earnings
Cash conversion and cumulative average 2007 – 2010 FCF as % net income1
1 2007 excl. gain on sale of ABB Lummus and on valuation allowance on
DTA on net income; 2008 and 2009 excl. impact of compliance provisions
on net income
133%125%
77%
93%
84% 92%
104%
0%
50%
100%
150%
2007 2008 2009 2010
Target = avg. 100%
Full-year cash conversion rate
Cumulative
average

© ABB Group November 4, 2011 | Slide 31
Current environment: We are prepared Growth AND cost is now part of ABB’s DNA
-$650 mn
+$110 mn
+$630 mn
+$750 mn Enough to fund investments in selling and R&D of $240 mn…
… and generate additional EBIT of $700 mn($1 bn incl. M&A)
Net positive
impact of $940 mn1
Product price
Project margins
Volume Cost savings
EBITDA impacts 9-months 2011 US$ millions
Market forces (+ $90 mn) 1 Incl. forex, mix and commodity
impacts
~$1 bn cost savings expected in 2012

© ABB Group November 4, 2011 | Slide 32
Overview of new targets 2011 – 2015
Potential M&A impact
1 incl acquisitions closed as of end-Oct. 2011; 2 Compound annual growth rate, base year 2010
+3 – 4 percentage points
In line with corridor
+3 percentage points
Same conversion rate
Depends on acquisition timing, steady over the long term
7 – 10%
13 – 19%
10 – 15%
Annual average
>90%
>20% by 2015
Group targets – Organic1
Revenue growth (CAGR2)
Operational EBITDA margin corridor
EPS growth (CAGR)
Free cash flow conversion
Cash flow return on invested capital

© ABB Group November 4, 2011 | Slide 33
2011 – 2015 plan assumptions We expect to outgrow global GDP by more than 2x
Assumptions based on a slowdown in next 18 months, not a deep recession
World GDP to grow 3 – 4%1 p.a., emerging market (EM) growth >2x developed markets
Global industrial capex to grow 5 – 6% p.a., EM capex share growing to 65% from <60%
ABB’s markets assumed to grow 6% CAGR over the period
World GDP growth assumptions2
Real GDP growth %
0
2
4
6
8
10
2010 2011 2012 2013 2014 2015
1 Compound annual growth rate, base year 2010; 2 Source: Global Insight
3% CAGR
4% CAGR
ABB’s organic revenue growth target (CAGR) = >2x GDP

© ABB Group November 4, 2011 | Slide 34
Group Target Organic revenue growth 7% to 10% a year CAGR
Revenue growth CAGR1 2011 – 2015 Base year = 2010
Base scenario
2010 2015
Additional 3 – 4% potential from M&A
Baldor, Ventyx and Mincom account for ~1.5% of 7 – 10% organic growth – they’re in the portfolio today
“Pure” organic growth is 5.5% to 8.5% CAGR
7 – 10% CAGR organic
Emerging market strategy: “In country, for country” Mature economies focus: gain shares in local markets Further focus on energy efficiency, grids, renewables Service and software growth in high teens,
to reach >20% total sales
World GDP2 3%
ABB's market 6%
ABB's revenues 7 – 10%
2 Source: Global Insight 1 Compound annual growth rate, base year 2010

© ABB Group November 4, 2011 | Slide 35
Group Target Operational EBITDA margin corridor 13% to 19% Drivers
Growth in service and software expected to lift Group margins from current levels
Value-based pricing, packaged solutions Cost savings to protect gross margins – primarily sourcing,
operational excellence and footprint Steady G&A to absorb more volume
Supportive
Dilutive
Continuous price pressure – emerging competitors, overcapacity in some segments Investments into R&D and selling to accelerate top line growth
Potential M&A initiatives expected to deliver EBITDA margins within the target range
Operational EBITDA margins1 and targets 2005 – 2015 % operational revenues
18% 19%
13% 13%
Previous EBIT margin targets converted to operational EBITDA margins
New operational EBITDA targets
9 mo 2011
1 See Appendix for reconciliation of non-GAAP measures

© ABB Group November 4, 2011 | Slide 36
Group target Average Net Income conversion to Free Cash Flow >90%
Free cash flow and as % revenues 2000 – 2010 Ambition to stay at the top of the league for cash generation
Capital expenditure expected to continue above depreciation
Higher capex partly offset by net working capital discipline (11 – 14% of revenues over the cycle)
Target average conversion >90% across the plan period (also including potential M&A)
2000 2009 2001 2002 2003 2004 2005 2006 2007 2008
Downturn
2010
Downturn
Free cash flow as % revenues
Free cash flow (US$ millions)

© ABB Group November 4, 2011 | Slide 37
Conservative financial strategy Solid single A rating remains our standard
Net debt/EBITDA ratio ~1.5x, gearing <40%
Debt maturities repaid out of free cash flow
Customer financing without loading ABB balance sheet
Centralized financial risk management and execution
Strict hedging policy – forex, interest rates, commodities
Acquisition financing always in line with balance sheet targets
Steadily rising, sustainable annual dividend policy
Additional distributions (special dividend, share buyback) only if/when M&A doesn’t require full availability of cash
1 Organic growth, R&D, and capex
2 Value-creating acquisitions
3 Paying annual dividend in line with policy
4 Returning additional cash to shareholders
Investment priorities
M&A investment criteria
1 Cash return >WACC within 3 years
2 IRR > WACC + specific hurdles
3 Financing designed to retain investment grade
© ABB Group November 4, 2011 | Slide 38
Summary: Combining ambition with execution focus
New targets combine ambition with solid execution plan
Current uncertainty may slow near-term growth …
… but we expect market to return to full potential in 2013
Management focus is on the balance between growth AND cost
Updated metrics: Shift focus to cash instead of accounting earnings
Financial strategy maintains M&A discipline, conservative balance sheet
Proven record of agility and discipline
Ready for growth, prepared to be resilient

© ABB Group November 4, 2011 | Slide 39
Summary Joe Hogan, CEO
November 4, 2011

© ABB Group November 4, 2011 | Slide 40
2005
$21bn
2010
$32bn
2015
© ABB Group November 4, 2011 | Slide 40
Macro growth drivers: Emerging markets Climate change investment Service & software expansion Infrastructure spend emerging & developed Key growth areas Grid expansion and reliability Emerging market growth in power and automation Service and software growth entitlement DC technology market expansion Automation business expansion Energy efficiency Renewables
ABB expects to outpace world economy Revenue growth at twice the pace of global GDP through 2015
Organic
Inorganic
7% - 10% CAGR vs. 2010
3% - 4% potential impact

© ABB Group November 4, 2011 | Slide 41
2015 Strategy Summary
Execution
Long term growth
Find and exploit disruptive opportunities in relevant markets
Disciplined M&A across products, markets and geographies
Aggressively expand core business to secure next level of growth
Capitalize on mega trends: anticipate, participate and lead in key mega trends
Drive competitiveness and stay relevant in our current markets
Continue to drive cost and quality competitiveness
Invest in technology leadership
Efficient use of assets: cash, people, IP & brand
People development and Investment

© ABB Group November 4, 2011 | Slide 42
Recommended