Af
MLa
b
a
ARR2AA
KAPFBPW
1
totra[p[m
cftt
m
1h
Process Biochemistry 49 (2014) 365–373
Contents lists available at ScienceDirect
Process Biochemistry
jo ur nal home p age: www.elsev ier .com/ locate /procbio
robust fed-batch feeding strategy independent of the carbon sourceor optimal polyhydroxybutyrate production
d. Salatul Islam Mozumdera,b,∗, Heleen De Wevera, Eveline I.P. Volckeb,insey Garcia-Gonzaleza
Flemish Institute for Technological Research (VITO), Business Unit Separation and Conversion Technology, Boeretang 200, 2400 Mol, BelgiumGhent University, Department of Biosystems Engineering, Coupure Links 653, 9000 Ghent, Belgium
r t i c l e i n f o
rticle history:eceived 8 August 2013eceived in revised form7 November 2013ccepted 3 December 2013vailable online 9 December 2013
eywords:utomatic substrate feedingolyhydroxybutyrate (PHB)
a b s t r a c t
A three-stage control strategy independent of the organic substrate was developed for automated sub-strate feeding in a two-phase fed-batch culture of Cupriavidus necator DSM 545 for the production ofthe biopolymer polyhydroxybutyrate (PHB). The optimal feeding strategy was determined using glu-cose as the substrate. A combined substrate feeding strategy consisting of exponential feeding anda novel method based on alkali-addition monitoring resulted in a maximal cell concentration in thebiomass growth phase. In the PHB accumulation phase, a constant substrate feeding strategy based onthe estimated amount of biomass produced in the first phase and a specific PHB accumulation rate wasimplemented to induce PHB under limiting nitrogen at different biomass concentrations. Maximal celland PHB concentrations of 164 and 125 g/L were obtained when nitrogen feeding was stopped at 56 g/L
ed-batch fermentationiomass growthHB accumulationaste glycerol
of residual biomass; the glucose concentration was maintained within its optimal range. The developedfeeding strategy was validated using waste glycerol as the sole carbon source for PHB production, and thethree-stage control strategy resulted in a PHB concentration of 65.6 g/L and PHB content of 62.7% whilekeeping the glycerol concentration constant. It can thus be concluded that the developed feeding strategyis sensitive, robust, inexpensive, and applicable to fed-batch culture for PHB production independent ofthe carbon source.
© 2013 Elsevier Ltd. All rights reserved.
. Introduction
Polyhydroxybutyrate (PHB) is an intracellular storage materialhat is synthesized by a number of microorganisms and has becomef considerable industrial interest and of environmental impor-ance as a biodegradable and biobased polyester. Although PHB isegarded as an effective substitute for conventional plastics for suchpplications as medical and agricultural uses [1] and food packaging2], the full-scale commercialization of this biopolymer is ham-ered by its high production cost compared to other (bio)polymers3]. The factors affecting the economics of PHB include the raw
aterials, process design, and downstream processing [4,5].According to Shen et al. [6], 50% of the total production costs
an be attributed to the raw materials of which the carbon source
or growth and polymer accumulation accounts for 70–80%. Thus,o attain bulk commercial viability and to further improve the sus-ainability profile of PHB production by fermentation, it is desirable∗ Corresponding author at: Boeretang 200, 2400 Mol, Belgium. Tel.: +32 14336903.E-mail addresses: [email protected],
[email protected] (Md.S.I. Mozumder).
359-5113/$ – see front matter © 2013 Elsevier Ltd. All rights reserved.ttp://dx.doi.org/10.1016/j.procbio.2013.12.004
to use waste carbon sources instead of pure substrates. A widespectrum of industrial by-products, such as whey, molasses, starch,and waste glycerol, have already been studied with regard to PHBproduction [7].
The production of biodiesel by the transesterification of oil witha short chain alcohol generates approximately 10% (w/w) glycerolas a co-product stream. Although pure glycerol is an importantfeedstock with applications found in the food, drug, and pharma-ceutical industries, glycerol from biodiesel cannot be used in theseapplications due to the presence of impurities and requires furtherrefinement prior to its use. As refining waste glycerol is expen-sive, it is important to search for alternative applications in whichcrude glycerol can be used as is with no refinement needed. Withinthis context, the biological conversion of crude glycerol to highervalue chemicals, such as PHB, is an attractive alternative [8,9].Indeed, utilizing crude glycerol as a cheap feedstock to produce PHBcould increase the economic performance of both the biodiesel andbiopolymer industries, though it should be noted that the presence
of glycerol adversely affects the quality of the polymer by reduc-ing its molecular mass [10–12]. Two prevalent cultivation methodsare employed for PHB production, depending on the microorgan-ism used. The more frequently applied method is a two-phase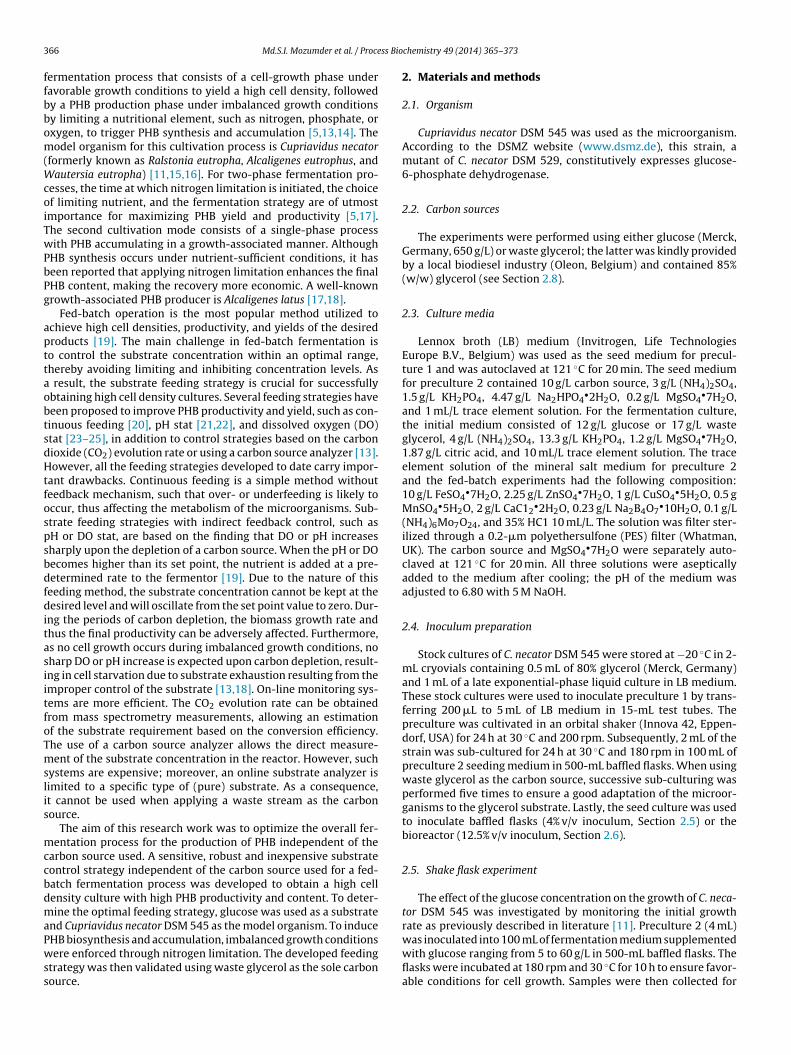
3 ss Bio
ffbbom(WcoiTwPbPg
apttaobtsdHtfospsbdfditasiitfoTmslis
mccbdmaPwss
66 Md.S.I. Mozumder et al. / Proce
ermentation process that consists of a cell-growth phase underavorable growth conditions to yield a high cell density, followedy a PHB production phase under imbalanced growth conditionsy limiting a nutritional element, such as nitrogen, phosphate, orxygen, to trigger PHB synthesis and accumulation [5,13,14]. Theodel organism for this cultivation process is Cupriavidus necator
formerly known as Ralstonia eutropha, Alcaligenes eutrophus, andautersia eutropha) [11,15,16]. For two-phase fermentation pro-
esses, the time at which nitrogen limitation is initiated, the choicef limiting nutrient, and the fermentation strategy are of utmostmportance for maximizing PHB yield and productivity [5,17].he second cultivation mode consists of a single-phase processith PHB accumulating in a growth-associated manner. Although
HB synthesis occurs under nutrient-sufficient conditions, it haseen reported that applying nitrogen limitation enhances the finalHB content, making the recovery more economic. A well-knownrowth-associated PHB producer is Alcaligenes latus [17,18].
Fed-batch operation is the most popular method utilized tochieve high cell densities, productivity, and yields of the desiredroducts [19]. The main challenge in fed-batch fermentation iso control the substrate concentration within an optimal range,hereby avoiding limiting and inhibiting concentration levels. As
result, the substrate feeding strategy is crucial for successfullybtaining high cell density cultures. Several feeding strategies haveeen proposed to improve PHB productivity and yield, such as con-inuous feeding [20], pH stat [21,22], and dissolved oxygen (DO)tat [23–25], in addition to control strategies based on the carbonioxide (CO2) evolution rate or using a carbon source analyzer [13].owever, all the feeding strategies developed to date carry impor-
ant drawbacks. Continuous feeding is a simple method withouteedback mechanism, such that over- or underfeeding is likely toccur, thus affecting the metabolism of the microorganisms. Sub-trate feeding strategies with indirect feedback control, such asH or DO stat, are based on the finding that DO or pH increasesharply upon the depletion of a carbon source. When the pH or DOecomes higher than its set point, the nutrient is added at a pre-etermined rate to the fermentor [19]. Due to the nature of thiseeding method, the substrate concentration cannot be kept at theesired level and will oscillate from the set point value to zero. Dur-
ng the periods of carbon depletion, the biomass growth rate andhus the final productivity can be adversely affected. Furthermore,s no cell growth occurs during imbalanced growth conditions, noharp DO or pH increase is expected upon carbon depletion, result-ng in cell starvation due to substrate exhaustion resulting from themproper control of the substrate [13,18]. On-line monitoring sys-ems are more efficient. The CO2 evolution rate can be obtainedrom mass spectrometry measurements, allowing an estimationf the substrate requirement based on the conversion efficiency.he use of a carbon source analyzer allows the direct measure-ent of the substrate concentration in the reactor. However, such
ystems are expensive; moreover, an online substrate analyzer isimited to a specific type of (pure) substrate. As a consequence,t cannot be used when applying a waste stream as the carbonource.
The aim of this research work was to optimize the overall fer-entation process for the production of PHB independent of the
arbon source used. A sensitive, robust and inexpensive substrateontrol strategy independent of the carbon source used for a fed-atch fermentation process was developed to obtain a high cellensity culture with high PHB productivity and content. To deter-ine the optimal feeding strategy, glucose was used as a substrate
nd Cupriavidus necator DSM 545 as the model organism. To induce
HB biosynthesis and accumulation, imbalanced growth conditionsere enforced through nitrogen limitation. The developed feedingtrategy was then validated using waste glycerol as the sole carbonource.
chemistry 49 (2014) 365–373
2. Materials and methods
2.1. Organism
Cupriavidus necator DSM 545 was used as the microorganism.According to the DSMZ website (www.dsmz.de), this strain, amutant of C. necator DSM 529, constitutively expresses glucose-6-phosphate dehydrogenase.
2.2. Carbon sources
The experiments were performed using either glucose (Merck,Germany, 650 g/L) or waste glycerol; the latter was kindly providedby a local biodiesel industry (Oleon, Belgium) and contained 85%(w/w) glycerol (see Section 2.8).
2.3. Culture media
Lennox broth (LB) medium (Invitrogen, Life TechnologiesEurope B.V., Belgium) was used as the seed medium for precul-ture 1 and was autoclaved at 121 ◦C for 20 min. The seed mediumfor preculture 2 contained 10 g/L carbon source, 3 g/L (NH4)2SO4,1.5 g/L KH2PO4, 4.47 g/L Na2HPO4
•2H2O, 0.2 g/L MgSO4•7H2O,
and 1 mL/L trace element solution. For the fermentation culture,the initial medium consisted of 12 g/L glucose or 17 g/L wasteglycerol, 4 g/L (NH4)2SO4, 13.3 g/L KH2PO4, 1.2 g/L MgSO4
•7H2O,1.87 g/L citric acid, and 10 mL/L trace element solution. The traceelement solution of the mineral salt medium for preculture 2and the fed-batch experiments had the following composition:10 g/L FeSO4
•7H2O, 2.25 g/L ZnSO4•7H2O, 1 g/L CuSO4
•5H2O, 0.5 gMnSO4
•5H2O, 2 g/L CaC12•2H2O, 0.23 g/L Na2B4O7
•10H2O, 0.1 g/L(NH4)6Mo7O24, and 35% HC1 10 mL/L. The solution was filter ster-ilized through a 0.2-�m polyethersulfone (PES) filter (Whatman,UK). The carbon source and MgSO4
•7H2O were separately auto-claved at 121 ◦C for 20 min. All three solutions were asepticallyadded to the medium after cooling; the pH of the medium wasadjusted to 6.80 with 5 M NaOH.
2.4. Inoculum preparation
Stock cultures of C. necator DSM 545 were stored at −20 ◦C in 2-mL cryovials containing 0.5 mL of 80% glycerol (Merck, Germany)and 1 mL of a late exponential-phase liquid culture in LB medium.These stock cultures were used to inoculate preculture 1 by trans-ferring 200 �L to 5 mL of LB medium in 15-mL test tubes. Thepreculture was cultivated in an orbital shaker (Innova 42, Eppen-dorf, USA) for 24 h at 30 ◦C and 200 rpm. Subsequently, 2 mL of thestrain was sub-cultured for 24 h at 30 ◦C and 180 rpm in 100 mL ofpreculture 2 seeding medium in 500-mL baffled flasks. When usingwaste glycerol as the carbon source, successive sub-culturing wasperformed five times to ensure a good adaptation of the microor-ganisms to the glycerol substrate. Lastly, the seed culture was usedto inoculate baffled flasks (4% v/v inoculum, Section 2.5) or thebioreactor (12.5% v/v inoculum, Section 2.6).
2.5. Shake flask experiment
The effect of the glucose concentration on the growth of C. neca-tor DSM 545 was investigated by monitoring the initial growthrate as previously described in literature [11]. Preculture 2 (4 mL)
was inoculated into 100 mL of fermentation medium supplementedwith glucose ranging from 5 to 60 g/L in 500-mL baffled flasks. Theflasks were incubated at 180 rpm and 30 ◦C for 10 h to ensure favor-able conditions for cell growth. Samples were then collected for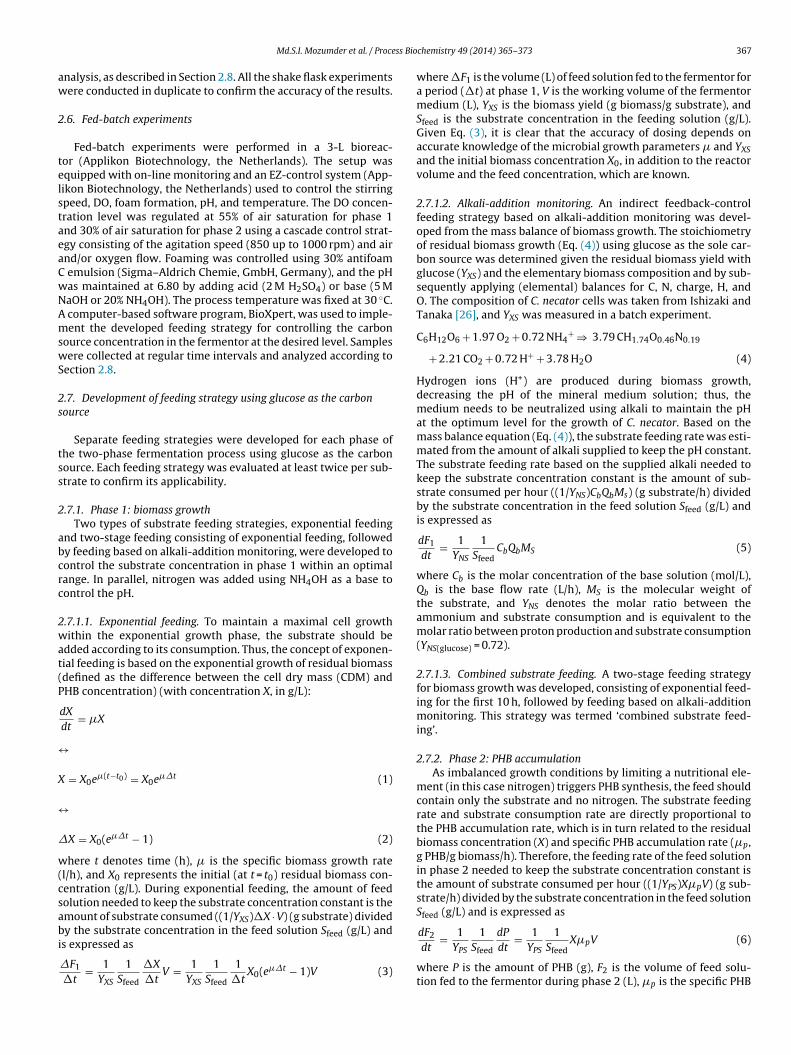
ss Bio
aw
2
telstaeaCwNAmswS
2s
tss
2
abcrc
2wat(P
↔
X
↔
�
w(csabi
Md.S.I. Mozumder et al. / Proce
nalysis, as described in Section 2.8. All the shake flask experimentsere conducted in duplicate to confirm the accuracy of the results.
.6. Fed-batch experiments
Fed-batch experiments were performed in a 3-L bioreac-or (Applikon Biotechnology, the Netherlands). The setup wasquipped with on-line monitoring and an EZ-control system (App-ikon Biotechnology, the Netherlands) used to control the stirringpeed, DO, foam formation, pH, and temperature. The DO concen-ration level was regulated at 55% of air saturation for phase 1nd 30% of air saturation for phase 2 using a cascade control strat-gy consisting of the agitation speed (850 up to 1000 rpm) and airnd/or oxygen flow. Foaming was controlled using 30% antifoam
emulsion (Sigma–Aldrich Chemie, GmbH, Germany), and the pHas maintained at 6.80 by adding acid (2 M H2SO4) or base (5 MaOH or 20% NH4OH). The process temperature was fixed at 30 ◦C.
computer-based software program, BioXpert, was used to imple-ent the developed feeding strategy for controlling the carbon
ource concentration in the fermentor at the desired level. Samplesere collected at regular time intervals and analyzed according to
ection 2.8.
.7. Development of feeding strategy using glucose as the carbonource
Separate feeding strategies were developed for each phase ofhe two-phase fermentation process using glucose as the carbonource. Each feeding strategy was evaluated at least twice per sub-trate to confirm its applicability.
.7.1. Phase 1: biomass growthTwo types of substrate feeding strategies, exponential feeding
nd two-stage feeding consisting of exponential feeding, followedy feeding based on alkali-addition monitoring, were developed toontrol the substrate concentration in phase 1 within an optimalange. In parallel, nitrogen was added using NH4OH as a base toontrol the pH.
.7.1.1. Exponential feeding. To maintain a maximal cell growthithin the exponential growth phase, the substrate should be
dded according to its consumption. Thus, the concept of exponen-ial feeding is based on the exponential growth of residual biomassdefined as the difference between the cell dry mass (CDM) andHB concentration) (with concentration X, in g/L):
dX
dt= �X
= X0e�(t−t0) = X0e��t (1)
X = X0(e��t − 1) (2)
here t denotes time (h), � is the specific biomass growth ratel/h), and X0 represents the initial (at t = t0) residual biomass con-entration (g/L). During exponential feeding, the amount of feedolution needed to keep the substrate concentration constant is themount of substrate consumed ((1/YXS)�X · V) (g substrate) dividedy the substrate concentration in the feed solution S (g/L) and
feeds expressed as
�F1
�t= 1
YXS
1Sfeed
�X
�tV = 1
YXS
1Sfeed
1�t
X0(e��t − 1)V (3)
chemistry 49 (2014) 365–373 367
where �F1 is the volume (L) of feed solution fed to the fermentor fora period (�t) at phase 1, V is the working volume of the fermentormedium (L), YXS is the biomass yield (g biomass/g substrate), andSfeed is the substrate concentration in the feeding solution (g/L).Given Eq. (3), it is clear that the accuracy of dosing depends onaccurate knowledge of the microbial growth parameters � and YXSand the initial biomass concentration X0, in addition to the reactorvolume and the feed concentration, which are known.
2.7.1.2. Alkali-addition monitoring. An indirect feedback-controlfeeding strategy based on alkali-addition monitoring was devel-oped from the mass balance of biomass growth. The stoichiometryof residual biomass growth (Eq. (4)) using glucose as the sole car-bon source was determined given the residual biomass yield withglucose (YXS) and the elementary biomass composition and by sub-sequently applying (elemental) balances for C, N, charge, H, andO. The composition of C. necator cells was taken from Ishizaki andTanaka [26], and YXS was measured in a batch experiment.
C6H12O6 + 1.97 O2 + 0.72 NH4+ ⇒ 3.79 CH1.74O0.46N0.19
+ 2.21 CO2 + 0.72 H+ + 3.78 H2O (4)
Hydrogen ions (H+) are produced during biomass growth,decreasing the pH of the mineral medium solution; thus, themedium needs to be neutralized using alkali to maintain the pHat the optimum level for the growth of C. necator. Based on themass balance equation (Eq. (4)), the substrate feeding rate was esti-mated from the amount of alkali supplied to keep the pH constant.The substrate feeding rate based on the supplied alkali needed tokeep the substrate concentration constant is the amount of sub-strate consumed per hour ((1/YNS)CbQbMs) (g substrate/h) dividedby the substrate concentration in the feed solution Sfeed (g/L) andis expressed as
dF1
dt= 1
YNS
1Sfeed
CbQbMS (5)
where Cb is the molar concentration of the base solution (mol/L),Qb is the base flow rate (L/h), MS is the molecular weight ofthe substrate, and YNS denotes the molar ratio between theammonium and substrate consumption and is equivalent to themolar ratio between proton production and substrate consumption(YNS(glucose) = 0.72).
2.7.1.3. Combined substrate feeding. A two-stage feeding strategyfor biomass growth was developed, consisting of exponential feed-ing for the first 10 h, followed by feeding based on alkali-additionmonitoring. This strategy was termed ‘combined substrate feed-ing’.
2.7.2. Phase 2: PHB accumulationAs imbalanced growth conditions by limiting a nutritional ele-
ment (in this case nitrogen) triggers PHB synthesis, the feed shouldcontain only the substrate and no nitrogen. The substrate feedingrate and substrate consumption rate are directly proportional tothe PHB accumulation rate, which is in turn related to the residualbiomass concentration (X) and specific PHB accumulation rate (�p,g PHB/g biomass/h). Therefore, the feeding rate of the feed solutionin phase 2 needed to keep the substrate concentration constant isthe amount of substrate consumed per hour ((1/YPS)X�pV) (g sub-strate/h) divided by the substrate concentration in the feed solutionSfeed (g/L) and is expressed as
dF2
dt= 1
YPS
1Sfeed
dP
dt= 1
YPS
1Sfeed
X�pV (6)
where P is the amount of PHB (g), F2 is the volume of feed solu-tion fed to the fermentor during phase 2 (L), �p is the specific PHB
3 ss Biochemistry 49 (2014) 365–373
a(tt
X
ww
2
iScmagM(Hmw(SwwlwespiHtcc
2
cA(fcrrm
2
mw13erwp5
68 Md.S.I. Mozumder et al. / Proce
ccumulation rate (g PHB/g biomass/h), and YPS is the yield of PHBg PHB/g substrate). Although the total amount of biomass remainshe same during phase 2, the biomass concentration decreases dueo dilution through the added feed volume and can be calculated as
= X1V1
V1 +∫ F2
0dF2
(7)
here X1 denotes the biomass concentration (g/L) and V1 is theorking volume at the end of phase 1 (L).
.8. Analytical procedures
The growth of C. necator was roughly monitored by measur-ng the optical density (OD) using a spectrophotometer (UV-1800,himadzu, Japan) at 600 nm, with the sufficient dilution of theulture broth. The glucose concentration in the medium was deter-ined off-line by the phenol-sulfuric acid method using glucose
s a standard, as originally described by Dubois et al. [27]. Thelycerol concentration was determined off-line through HPLC usingilliQ water as the mobile phase. The concentrations of ammonium
NH4+–N) were evaluated off-line colorimetrically with standard
ach Lange cuvette tests (Hach Lange Gmbh, Germany). A gravi-etrical method was used to determine the cell concentration,hich was expressed as cell dry mass (CDM). Culture broth
15–20 mL) was centrifuged (SORVALL RC6+ centrifuge, Thermocientific, Clintonpark Keppekouter, Belgium) at 7000 × g in pre-eighted screw-cap tubes for 30 min at 4 ◦C. The cell pellets wereashed with distilled water, re-centrifuged, frozen at −20 ◦C, and
yophilized until a constant weight. CDM was determined as theeight difference between tubes containing the cell pellets and
mpty tubes. For the PHB analysis, dried samples and externaltandards (PHB, Biomer) were subjected to methanolysis in theresence of 50% (v/v) methanol and 50% (v/v) NaOH. The result-
ng 3-hydroxybutyric acids were analyzed by HPLC using 0.05%3PO4 as the mobile phase. The residual biomass was defined as
he difference between CDM and the PHB concentration. The PHBontent was calculated as the percentage of the ratio of the PHBoncentration to the total cell concentration.
.9. PHB extraction
After lyophilization, 1 g of dried cells was resuspended in 100 mLhloroform for 24 h with vigorous agitation at room temperature.fter extraction, the cellular debris was separated by filtration
Whatman, Schleicher and Schuell, 75 mm radius). The chloro-orm fraction containing the solubilized polymer was poured intoold ethanol to precipitate the polymer. After filtration, PHB wasesuspended into chloroform, and the precipitation procedure wasepeated twice to further purify the polymer. The precipitated poly-er was filtered and dried.
.10. PHB characterization
The average molecular weight (Mw) was determined by gel per-eation chromatography (GPC) using a Waters BreezeTM Systemith a combination of three column series (PSS SDV analytical
000 A, 5 �m, 300 × 8.00; PSS SDV analytical 100,000 A, 5 �m,00 × 8.00; PSS SDV analytical 1,000,000 A, 5 �m, 300 × 8.00) andquipped with a 2414 differential refractive index detector. Chlo-oform was used as the eluent at 35 ◦C, and the applied flow rateas 1.0 mL/min. A calibration curve was obtained using narrowolystyrene standards (Polymer Laboratories) in the Mw range of80–1,930,000 g/mol.
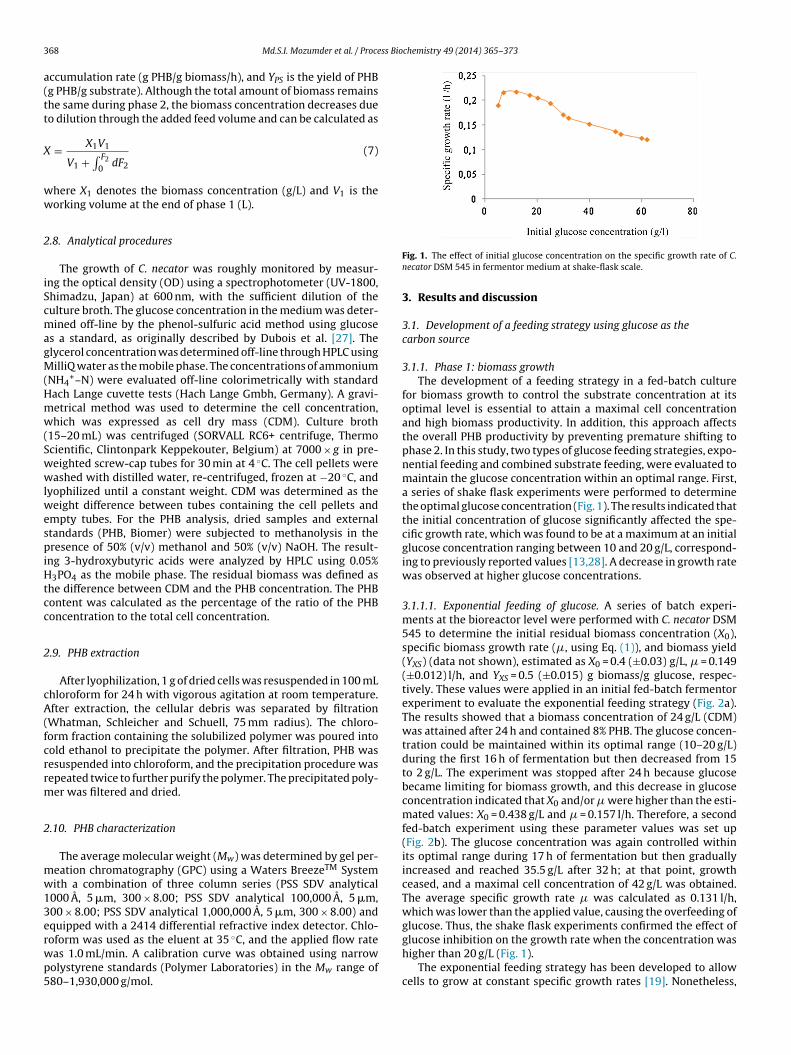
Fig. 1. The effect of initial glucose concentration on the specific growth rate of C.necator DSM 545 in fermentor medium at shake-flask scale.
3. Results and discussion
3.1. Development of a feeding strategy using glucose as thecarbon source
3.1.1. Phase 1: biomass growthThe development of a feeding strategy in a fed-batch culture
for biomass growth to control the substrate concentration at itsoptimal level is essential to attain a maximal cell concentrationand high biomass productivity. In addition, this approach affectsthe overall PHB productivity by preventing premature shifting tophase 2. In this study, two types of glucose feeding strategies, expo-nential feeding and combined substrate feeding, were evaluated tomaintain the glucose concentration within an optimal range. First,a series of shake flask experiments were performed to determinethe optimal glucose concentration (Fig. 1). The results indicated thatthe initial concentration of glucose significantly affected the spe-cific growth rate, which was found to be at a maximum at an initialglucose concentration ranging between 10 and 20 g/L, correspond-ing to previously reported values [13,28]. A decrease in growth ratewas observed at higher glucose concentrations.
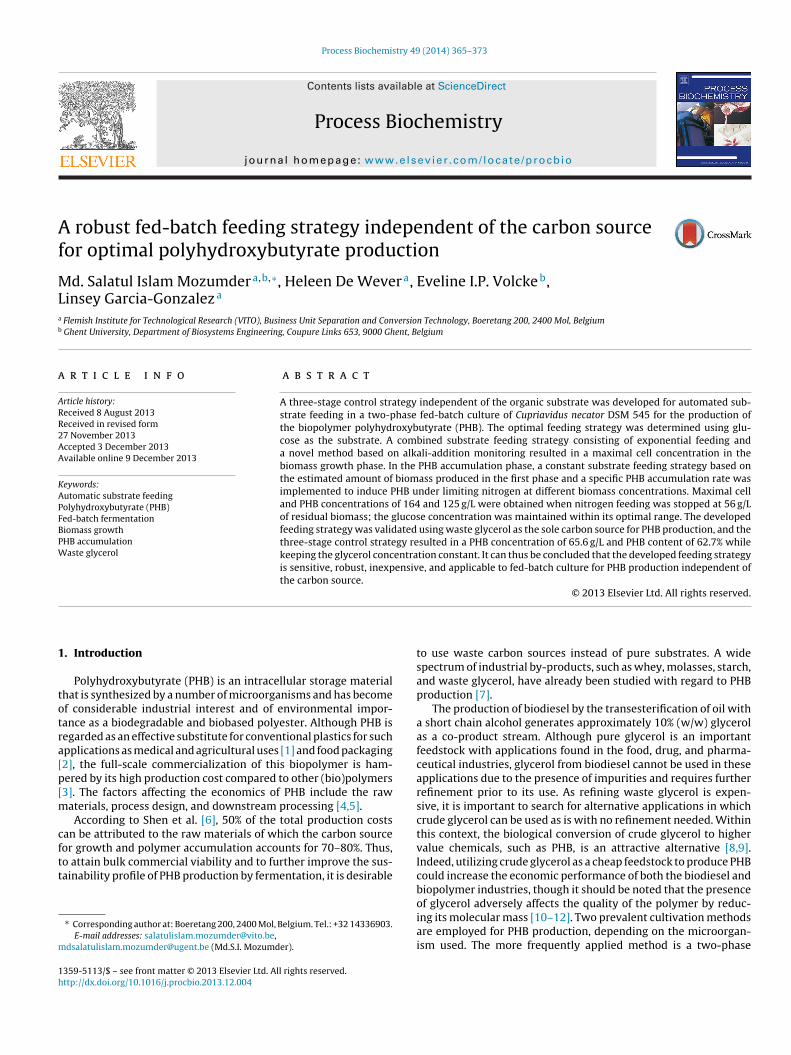
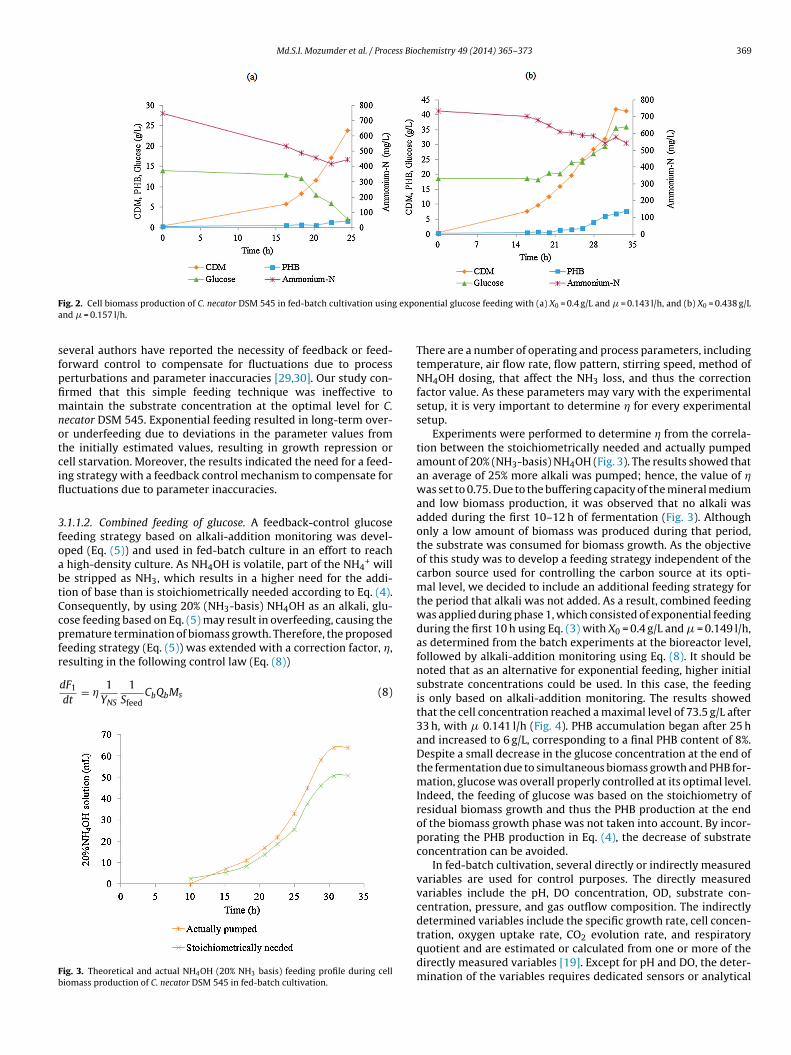
3.1.1.1. Exponential feeding of glucose. A series of batch experi-ments at the bioreactor level were performed with C. necator DSM545 to determine the initial residual biomass concentration (X0),specific biomass growth rate (�, using Eq. (1)), and biomass yield(YXS) (data not shown), estimated as X0 = 0.4 (±0.03) g/L, � = 0.149(±0.012) l/h, and YXS = 0.5 (±0.015) g biomass/g glucose, respec-tively. These values were applied in an initial fed-batch fermentorexperiment to evaluate the exponential feeding strategy (Fig. 2a).The results showed that a biomass concentration of 24 g/L (CDM)was attained after 24 h and contained 8% PHB. The glucose concen-tration could be maintained within its optimal range (10–20 g/L)during the first 16 h of fermentation but then decreased from 15to 2 g/L. The experiment was stopped after 24 h because glucosebecame limiting for biomass growth, and this decrease in glucoseconcentration indicated that X0 and/or � were higher than the esti-mated values: X0 = 0.438 g/L and � = 0.157 l/h. Therefore, a secondfed-batch experiment using these parameter values was set up(Fig. 2b). The glucose concentration was again controlled withinits optimal range during 17 h of fermentation but then graduallyincreased and reached 35.5 g/L after 32 h; at that point, growthceased, and a maximal cell concentration of 42 g/L was obtained.The average specific growth rate � was calculated as 0.131 l/h,which was lower than the applied value, causing the overfeeding ofglucose. Thus, the shake flask experiments confirmed the effect of
glucose inhibition on the growth rate when the concentration washigher than 20 g/L (Fig. 1).The exponential feeding strategy has been developed to allowcells to grow at constant specific growth rates [19]. Nonetheless,
Md.S.I. Mozumder et al. / Process Biochemistry 49 (2014) 365–373 369
F expoa
sfpfimnotcifl
3foabtCcpfr
Fb
ig. 2. Cell biomass production of C. necator DSM 545 in fed-batch cultivation usingnd � = 0.157 l/h.
everal authors have reported the necessity of feedback or feed-orward control to compensate for fluctuations due to processerturbations and parameter inaccuracies [29,30]. Our study con-rmed that this simple feeding technique was ineffective toaintain the substrate concentration at the optimal level for C.
ecator DSM 545. Exponential feeding resulted in long-term over-r underfeeding due to deviations in the parameter values fromhe initially estimated values, resulting in growth repression orell starvation. Moreover, the results indicated the need for a feed-ng strategy with a feedback control mechanism to compensate foructuations due to parameter inaccuracies.
.1.1.2. Combined feeding of glucose. A feedback-control glucoseeeding strategy based on alkali-addition monitoring was devel-ped (Eq. (5)) and used in fed-batch culture in an effort to reach
high-density culture. As NH4OH is volatile, part of the NH4+ will
e stripped as NH3, which results in a higher need for the addi-ion of base than is stoichiometrically needed according to Eq. (4).onsequently, by using 20% (NH3-basis) NH4OH as an alkali, glu-ose feeding based on Eq. (5) may result in overfeeding, causing theremature termination of biomass growth. Therefore, the proposedeeding strategy (Eq. (5)) was extended with a correction factor, �,
esulting in the following control law (Eq. (8))dF1
dt= �
1YNS
1Sfeed
CbQbMs (8)
ig. 3. Theoretical and actual NH4OH (20% NH3 basis) feeding profile during celliomass production of C. necator DSM 545 in fed-batch cultivation.
nential glucose feeding with (a) X0 = 0.4 g/L and � = 0.143 l/h, and (b) X0 = 0.438 g/L
There are a number of operating and process parameters, includingtemperature, air flow rate, flow pattern, stirring speed, method ofNH4OH dosing, that affect the NH3 loss, and thus the correctionfactor value. As these parameters may vary with the experimentalsetup, it is very important to determine � for every experimentalsetup.
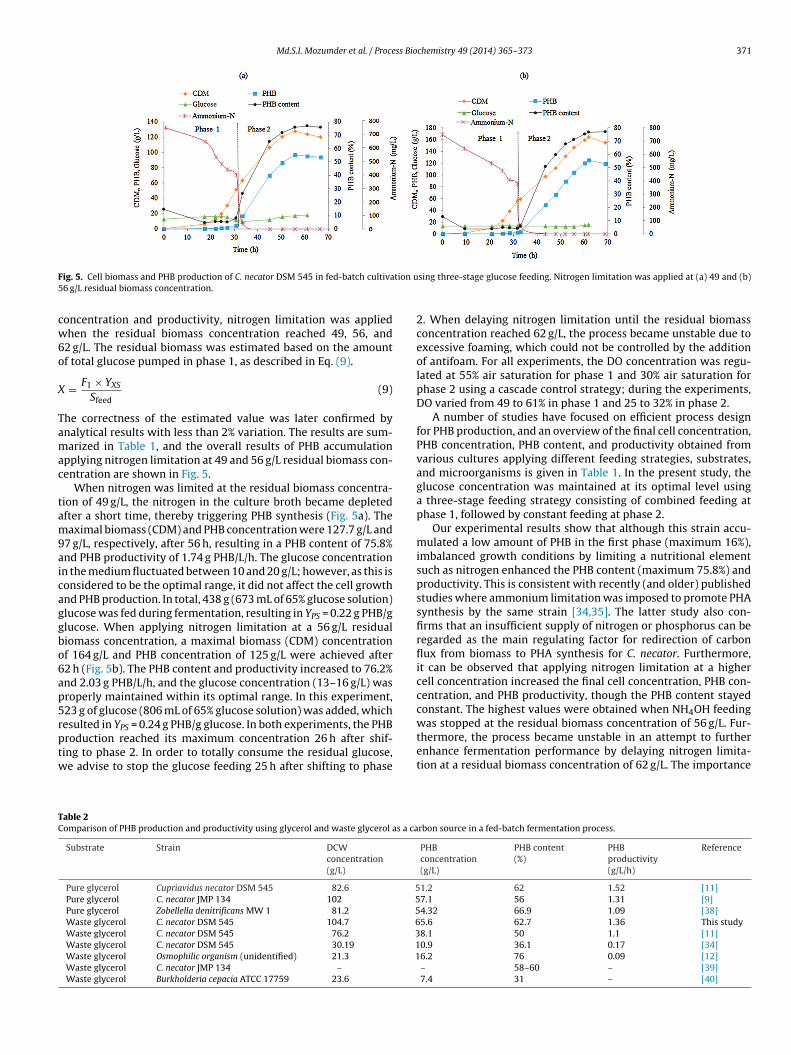
Experiments were performed to determine � from the correla-tion between the stoichiometrically needed and actually pumpedamount of 20% (NH3-basis) NH4OH (Fig. 3). The results showed thatan average of 25% more alkali was pumped; hence, the value of �was set to 0.75. Due to the buffering capacity of the mineral mediumand low biomass production, it was observed that no alkali wasadded during the first 10–12 h of fermentation (Fig. 3). Althoughonly a low amount of biomass was produced during that period,the substrate was consumed for biomass growth. As the objectiveof this study was to develop a feeding strategy independent of thecarbon source used for controlling the carbon source at its opti-mal level, we decided to include an additional feeding strategy forthe period that alkali was not added. As a result, combined feedingwas applied during phase 1, which consisted of exponential feedingduring the first 10 h using Eq. (3) with X0 = 0.4 g/L and � = 0.149 l/h,as determined from the batch experiments at the bioreactor level,followed by alkali-addition monitoring using Eq. (8). It should benoted that as an alternative for exponential feeding, higher initialsubstrate concentrations could be used. In this case, the feedingis only based on alkali-addition monitoring. The results showedthat the cell concentration reached a maximal level of 73.5 g/L after33 h, with � 0.141 l/h (Fig. 4). PHB accumulation began after 25 hand increased to 6 g/L, corresponding to a final PHB content of 8%.Despite a small decrease in the glucose concentration at the end ofthe fermentation due to simultaneous biomass growth and PHB for-mation, glucose was overall properly controlled at its optimal level.Indeed, the feeding of glucose was based on the stoichiometry ofresidual biomass growth and thus the PHB production at the endof the biomass growth phase was not taken into account. By incor-porating the PHB production in Eq. (4), the decrease of substrateconcentration can be avoided.
In fed-batch cultivation, several directly or indirectly measuredvariables are used for control purposes. The directly measuredvariables include the pH, DO concentration, OD, substrate con-centration, pressure, and gas outflow composition. The indirectlydetermined variables include the specific growth rate, cell concen-
tration, oxygen uptake rate, CO2 evolution rate, and respiratoryquotient and are estimated or calculated from one or more of thedirectly measured variables [19]. Except for pH and DO, the deter-mination of the variables requires dedicated sensors or analytical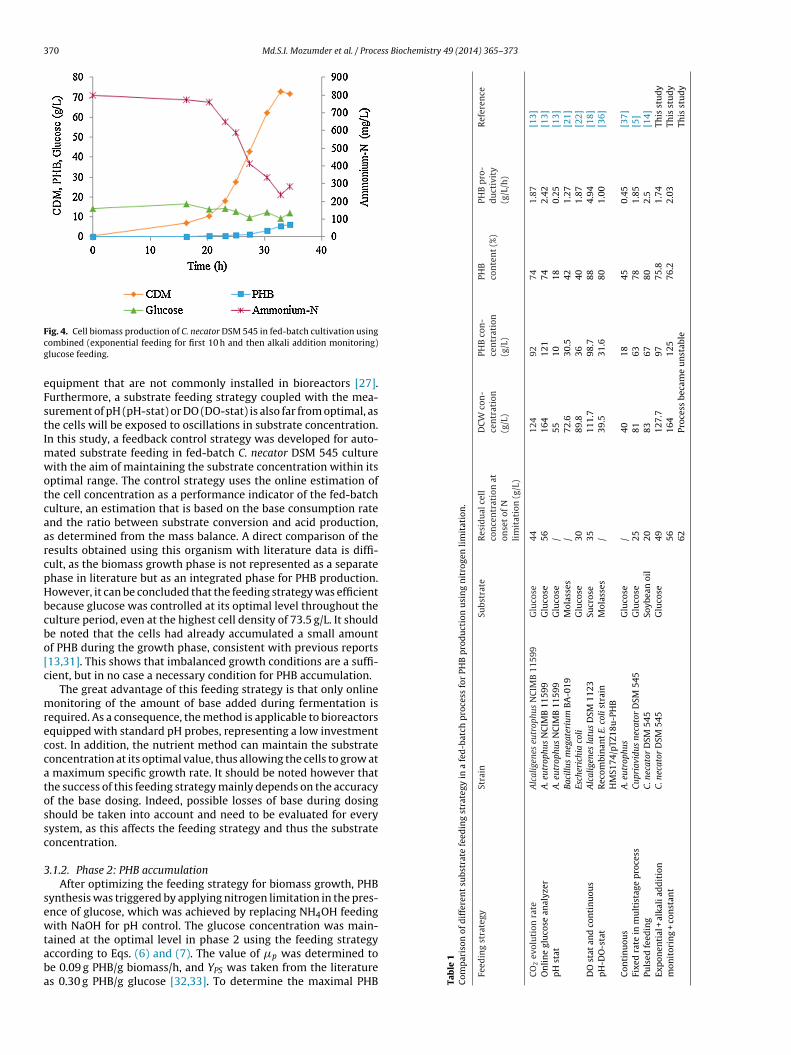
370 Md.S.I. Mozumder et al. / Process Biochemistry 49 (2014) 365–373
Fcg
eFstImwotcaarcpHbcbo[c
mreccatossc
3
sewtaba
of
dif
fere
nt
subs
trat
e
feed
ing
stra
tegy
in
a
fed
-bat
ch
pro
cess
for
PHB
pro
du
ctio
n
usi
ng
nit
roge
n
lim
itat
ion
.
ateg
ySt
rain
Subs
trat
e
Res
idu
al
cell
con
cen
trat
ion
aton
set
of
Nli
mit
atio
n
(g/L
)
DC
W
con
-ce
ntr
atio
n(g
/L)
PHB
con
-ce
ntr
atio
n(g
/L)
PHB
con
ten
t
(%)
PHB
pro
-d
uct
ivit
y(g
/L/h
)
Ref
eren
ce
ion
rate
Alc
alig
enes
eutr
ophu
s
NC
IMB
1159
9
Glu
cose
44
124
92
74
1.87
[13]
ose
anal
yzer
A. e
utro
phus
NC
IMB
1159
9
Glu
cose
56
164
121
74
2.42
[13]
A. e
utro
phus
NC
IMB
1159
9
Glu
cose
/
55
10
18
0.25
[13]
Baci
llus
meg
ater
ium
BA
-019
Mol
asse
s
/
72.6
30.5
42
1.27
[21]
Esch
eric
hia
coli
Glu
cose
30
89.8
36
40
1.87
[22]
con
tin
uou
sA
lcal
igen
es
latu
s
DSM
1123
Sucr
ose
35
111.
7
98.7
88
4.94
[18]
t
Rec
ombi
nan
t
E.
coli
stra
inH
MS1
74/p
TZ18
u-P
HB
Mol
asse
s
/
39.5
31.6
80
1.00
[36]
A. e
utro
phus
Glu
cose
/
40
18
45
0.45
[37]
n
mu
ltis
tage
pro
cess
Cupr
iavi
dus
neca
tor
DSM
545
Glu
cose
25
81
63
78
1.85
[5]
ing
C.
neca
tor
DSM
545
Soyb
ean
oil
20
83
67
80
2.5
[14]
l +
alka
li
add
itio
n
+
con
stan
tC.
neca
tor
DSM
545
Glu
cose
49
127.
7
97
75.8
1.74
This
stu
dy
56
164
125
76.2
2.03
This
stu
dy
62
Proc
ess
beca
me
un
stab
le
This
stu
dy
ig. 4. Cell biomass production of C. necator DSM 545 in fed-batch cultivation usingombined (exponential feeding for first 10 h and then alkali addition monitoring)lucose feeding.
quipment that are not commonly installed in bioreactors [27].urthermore, a substrate feeding strategy coupled with the mea-urement of pH (pH-stat) or DO (DO-stat) is also far from optimal, ashe cells will be exposed to oscillations in substrate concentration.n this study, a feedback control strategy was developed for auto-
ated substrate feeding in fed-batch C. necator DSM 545 cultureith the aim of maintaining the substrate concentration within its
ptimal range. The control strategy uses the online estimation ofhe cell concentration as a performance indicator of the fed-batchulture, an estimation that is based on the base consumption ratend the ratio between substrate conversion and acid production,s determined from the mass balance. A direct comparison of theesults obtained using this organism with literature data is diffi-ult, as the biomass growth phase is not represented as a separatehase in literature but as an integrated phase for PHB production.owever, it can be concluded that the feeding strategy was efficientecause glucose was controlled at its optimal level throughout theulture period, even at the highest cell density of 73.5 g/L. It shoulde noted that the cells had already accumulated a small amountf PHB during the growth phase, consistent with previous reports13,31]. This shows that imbalanced growth conditions are a suffi-ient, but in no case a necessary condition for PHB accumulation.
The great advantage of this feeding strategy is that only onlineonitoring of the amount of base added during fermentation is
equired. As a consequence, the method is applicable to bioreactorsquipped with standard pH probes, representing a low investmentost. In addition, the nutrient method can maintain the substrateoncentration at its optimal value, thus allowing the cells to grow at
maximum specific growth rate. It should be noted however thathe success of this feeding strategy mainly depends on the accuracyf the base dosing. Indeed, possible losses of base during dosinghould be taken into account and need to be evaluated for everyystem, as this affects the feeding strategy and thus the substrateoncentration.
.1.2. Phase 2: PHB accumulationAfter optimizing the feeding strategy for biomass growth, PHB
ynthesis was triggered by applying nitrogen limitation in the pres-nce of glucose, which was achieved by replacing NH4OH feedingith NaOH for pH control. The glucose concentration was main-
ained at the optimal level in phase 2 using the feeding strategyccording to Eqs. (6) and (7). The value of �p was determined toe 0.09 g PHB/g biomass/h, and YPS was taken from the literatures 0.30 g PHB/g glucose [32,33]. To determine the maximal PHB Ta
ble
1C
omp
aris
on
Feed
ing
str
CO
2ev
olu
tO
nli
ne
glu
cp
H
stat
DO
stat
and
pH
-DO
-sta
Con
tin
uou
sFi
xed
rate
iPu
lsed
feed
Exp
onen
tia
mon
itor
ing
Md.S.I. Mozumder et al. / Process Biochemistry 49 (2014) 365–373 371
F tion u5
cw6o
X
Tamac
tam9aicaggbo6ap5rptw
TC
ig. 5. Cell biomass and PHB production of C. necator DSM 545 in fed-batch cultiva6 g/L residual biomass concentration.
oncentration and productivity, nitrogen limitation was appliedhen the residual biomass concentration reached 49, 56, and
2 g/L. The residual biomass was estimated based on the amountf total glucose pumped in phase 1, as described in Eq. (9).
= F1 × YXS
Sfeed(9)
he correctness of the estimated value was later confirmed bynalytical results with less than 2% variation. The results are sum-arized in Table 1, and the overall results of PHB accumulation
pplying nitrogen limitation at 49 and 56 g/L residual biomass con-entration are shown in Fig. 5.
When nitrogen was limited at the residual biomass concentra-ion of 49 g/L, the nitrogen in the culture broth became depletedfter a short time, thereby triggering PHB synthesis (Fig. 5a). Theaximal biomass (CDM) and PHB concentration were 127.7 g/L and
7 g/L, respectively, after 56 h, resulting in a PHB content of 75.8%nd PHB productivity of 1.74 g PHB/L/h. The glucose concentrationn the medium fluctuated between 10 and 20 g/L; however, as this isonsidered to be the optimal range, it did not affect the cell growthnd PHB production. In total, 438 g (673 mL of 65% glucose solution)lucose was fed during fermentation, resulting in YPS = 0.22 g PHB/glucose. When applying nitrogen limitation at a 56 g/L residualiomass concentration, a maximal biomass (CDM) concentrationf 164 g/L and PHB concentration of 125 g/L were achieved after2 h (Fig. 5b). The PHB content and productivity increased to 76.2%nd 2.03 g PHB/L/h, and the glucose concentration (13–16 g/L) wasroperly maintained within its optimal range. In this experiment,23 g of glucose (806 mL of 65% glucose solution) was added, which
esulted in YPS = 0.24 g PHB/g glucose. In both experiments, the PHBroduction reached its maximum concentration 26 h after shif-ing to phase 2. In order to totally consume the residual glucose,e advise to stop the glucose feeding 25 h after shifting to phaseable 2omparison of PHB production and productivity using glycerol and waste glycerol as a ca
Substrate Strain DCWconcentration(g/L)
Pure glycerol Cupriavidus necator DSM 545 82.6 5Pure glycerol C. necator JMP 134 102 5Pure glycerol Zobellella denitrificans MW 1 81.2 5Waste glycerol C. necator DSM 545 104.7 6Waste glycerol C. necator DSM 545 76.2 3Waste glycerol C. necator DSM 545 30.19 1Waste glycerol Osmophilic organism (unidentified) 21.3 1Waste glycerol C. necator JMP 134 –
Waste glycerol Burkholderia cepacia ATCC 17759 23.6
sing three-stage glucose feeding. Nitrogen limitation was applied at (a) 49 and (b)
2. When delaying nitrogen limitation until the residual biomassconcentration reached 62 g/L, the process became unstable due toexcessive foaming, which could not be controlled by the additionof antifoam. For all experiments, the DO concentration was regu-lated at 55% air saturation for phase 1 and 30% air saturation forphase 2 using a cascade control strategy; during the experiments,DO varied from 49 to 61% in phase 1 and 25 to 32% in phase 2.
A number of studies have focused on efficient process designfor PHB production, and an overview of the final cell concentration,PHB concentration, PHB content, and productivity obtained fromvarious cultures applying different feeding strategies, substrates,and microorganisms is given in Table 1. In the present study, theglucose concentration was maintained at its optimal level usinga three-stage feeding strategy consisting of combined feeding atphase 1, followed by constant feeding at phase 2.
Our experimental results show that although this strain accu-mulated a low amount of PHB in the first phase (maximum 16%),imbalanced growth conditions by limiting a nutritional elementsuch as nitrogen enhanced the PHB content (maximum 75.8%) andproductivity. This is consistent with recently (and older) publishedstudies where ammonium limitation was imposed to promote PHAsynthesis by the same strain [34,35]. The latter study also con-firms that an insufficient supply of nitrogen or phosphorus can beregarded as the main regulating factor for redirection of carbonflux from biomass to PHA synthesis for C. necator. Furthermore,it can be observed that applying nitrogen limitation at a highercell concentration increased the final cell concentration, PHB con-centration, and PHB productivity, though the PHB content stayedconstant. The highest values were obtained when NH4OH feeding
was stopped at the residual biomass concentration of 56 g/L. Fur-thermore, the process became unstable in an attempt to furtherenhance fermentation performance by delaying nitrogen limita-tion at a residual biomass concentration of 62 g/L. The importancerbon source in a fed-batch fermentation process.
PHBconcentration(g/L)
PHB content(%)
PHBproductivity(g/L/h)
Reference
1.2 62 1.52 [11]7.1 56 1.31 [9]4.32 66.9 1.09 [38]5.6 62.7 1.36 This study8.1 50 1.1 [11]0.9 36.1 0.17 [34]6.2 76 0.09 [12]– 58–60 – [39]7.4 31 – [40]
372 Md.S.I. Mozumder et al. / Process Bio
Ft4
octe
nfwlAuacsrp
3c
iwdstbsiu(bgntfutPcrptfta
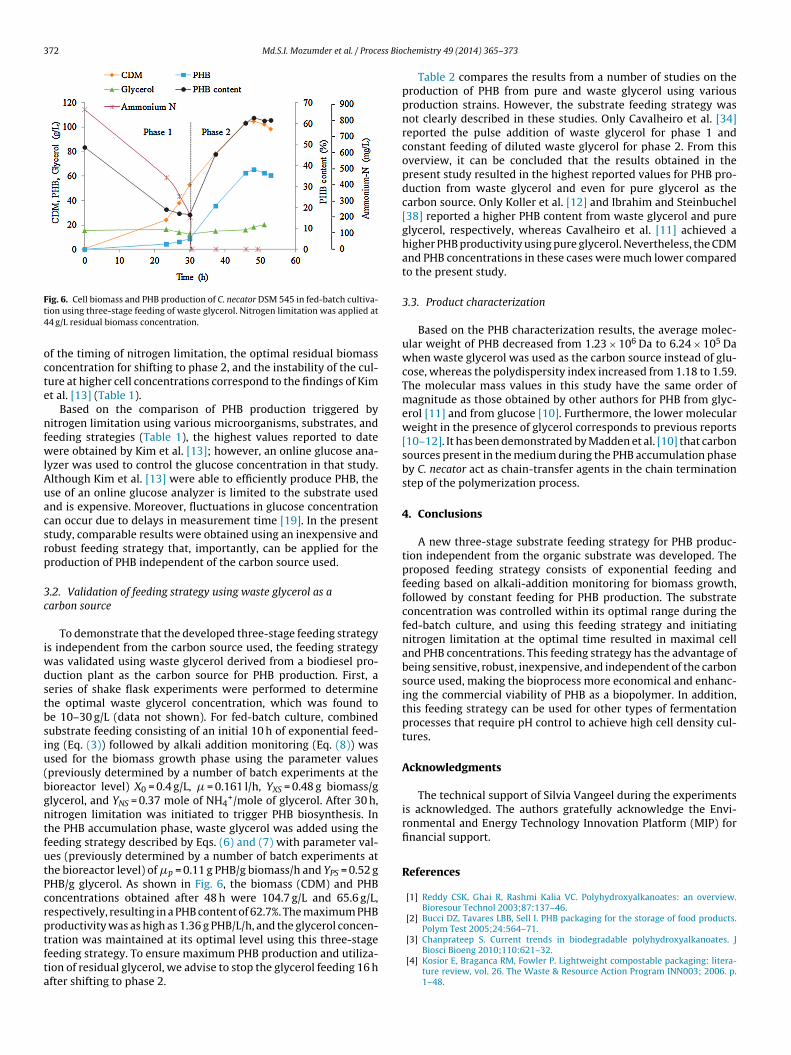
ig. 6. Cell biomass and PHB production of C. necator DSM 545 in fed-batch cultiva-ion using three-stage feeding of waste glycerol. Nitrogen limitation was applied at4 g/L residual biomass concentration.
f the timing of nitrogen limitation, the optimal residual biomassoncentration for shifting to phase 2, and the instability of the cul-ure at higher cell concentrations correspond to the findings of Kimt al. [13] (Table 1).
Based on the comparison of PHB production triggered byitrogen limitation using various microorganisms, substrates, and
eeding strategies (Table 1), the highest values reported to dateere obtained by Kim et al. [13]; however, an online glucose ana-
yzer was used to control the glucose concentration in that study.lthough Kim et al. [13] were able to efficiently produce PHB, these of an online glucose analyzer is limited to the substrate usednd is expensive. Moreover, fluctuations in glucose concentrationan occur due to delays in measurement time [19]. In the presenttudy, comparable results were obtained using an inexpensive andobust feeding strategy that, importantly, can be applied for theroduction of PHB independent of the carbon source used.
.2. Validation of feeding strategy using waste glycerol as aarbon source
To demonstrate that the developed three-stage feeding strategys independent from the carbon source used, the feeding strategy
as validated using waste glycerol derived from a biodiesel pro-uction plant as the carbon source for PHB production. First, aeries of shake flask experiments were performed to determinehe optimal waste glycerol concentration, which was found toe 10–30 g/L (data not shown). For fed-batch culture, combinedubstrate feeding consisting of an initial 10 h of exponential feed-ng (Eq. (3)) followed by alkali addition monitoring (Eq. (8)) wassed for the biomass growth phase using the parameter valuespreviously determined by a number of batch experiments at theioreactor level) X0 = 0.4 g/L, � = 0.161 l/h, YXS = 0.48 g biomass/glycerol, and YNS = 0.37 mole of NH4
+/mole of glycerol. After 30 h,itrogen limitation was initiated to trigger PHB biosynthesis. Inhe PHB accumulation phase, waste glycerol was added using theeeding strategy described by Eqs. (6) and (7) with parameter val-es (previously determined by a number of batch experiments athe bioreactor level) of �p = 0.11 g PHB/g biomass/h and YPS = 0.52 gHB/g glycerol. As shown in Fig. 6, the biomass (CDM) and PHBoncentrations obtained after 48 h were 104.7 g/L and 65.6 g/L,espectively, resulting in a PHB content of 62.7%. The maximum PHBroductivity was as high as 1.36 g PHB/L/h, and the glycerol concen-
ration was maintained at its optimal level using this three-stageeeding strategy. To ensure maximum PHB production and utiliza-ion of residual glycerol, we advise to stop the glycerol feeding 16 hfter shifting to phase 2.chemistry 49 (2014) 365–373
Table 2 compares the results from a number of studies on theproduction of PHB from pure and waste glycerol using variousproduction strains. However, the substrate feeding strategy wasnot clearly described in these studies. Only Cavalheiro et al. [34]reported the pulse addition of waste glycerol for phase 1 andconstant feeding of diluted waste glycerol for phase 2. From thisoverview, it can be concluded that the results obtained in thepresent study resulted in the highest reported values for PHB pro-duction from waste glycerol and even for pure glycerol as thecarbon source. Only Koller et al. [12] and Ibrahim and Steinbuchel[38] reported a higher PHB content from waste glycerol and pureglycerol, respectively, whereas Cavalheiro et al. [11] achieved ahigher PHB productivity using pure glycerol. Nevertheless, the CDMand PHB concentrations in these cases were much lower comparedto the present study.
3.3. Product characterization
Based on the PHB characterization results, the average molec-ular weight of PHB decreased from 1.23 × 10⁶ Da to 6.24 × 10⁵ Dawhen waste glycerol was used as the carbon source instead of glu-cose, whereas the polydispersity index increased from 1.18 to 1.59.The molecular mass values in this study have the same order ofmagnitude as those obtained by other authors for PHB from glyc-erol [11] and from glucose [10]. Furthermore, the lower molecularweight in the presence of glycerol corresponds to previous reports[10–12]. It has been demonstrated by Madden et al. [10] that carbonsources present in the medium during the PHB accumulation phaseby C. necator act as chain-transfer agents in the chain terminationstep of the polymerization process.
4. Conclusions
A new three-stage substrate feeding strategy for PHB produc-tion independent from the organic substrate was developed. Theproposed feeding strategy consists of exponential feeding andfeeding based on alkali-addition monitoring for biomass growth,followed by constant feeding for PHB production. The substrateconcentration was controlled within its optimal range during thefed-batch culture, and using this feeding strategy and initiatingnitrogen limitation at the optimal time resulted in maximal celland PHB concentrations. This feeding strategy has the advantage ofbeing sensitive, robust, inexpensive, and independent of the carbonsource used, making the bioprocess more economical and enhanc-ing the commercial viability of PHB as a biopolymer. In addition,this feeding strategy can be used for other types of fermentationprocesses that require pH control to achieve high cell density cul-tures.
Acknowledgments
The technical support of Silvia Vangeel during the experimentsis acknowledged. The authors gratefully acknowledge the Envi-ronmental and Energy Technology Innovation Platform (MIP) forfinancial support.
References
[1] Reddy CSK, Ghai R, Rashmi Kalia VC. Polyhydroxyalkanoates: an overview.Bioresour Technol 2003;87:137–46.
[2] Bucci DZ, Tavares LBB, Sell I. PHB packaging for the storage of food products.Polym Test 2005;24:564–71.
[3] Chanprateep S. Current trends in biodegradable polyhydroxyalkanoates. JBiosci Bioeng 2010;110:621–32.
[4] Kosior E, Braganca RM, Fowler P. Lightweight compostable packaging: litera-ture review, vol. 26. The Waste & Resource Action Program INN003; 2006. p.1–48.
ss Bio
[
[
[
[
[
[
[
[
[
[
[
[
[
[
[
[
[
[
[
[
[
[
[
[
[
[
[
[
[
Md.S.I. Mozumder et al. / Proce
[5] Atlic A, Koller M, Scherzer D, Kutschera C, Grillo-Fernandes E, HorvatP, et al. Continuous production of poly([R]-3-hydroxybutyrate) by Cupri-avidus necator in a multistage bioreactor cascade. Appl Microbiol Biotechnol2011;91:295–304.
[6] Shen L, Haufe J, Patel MK. Product overview and market projection of emerg-ing bio-based plastics. Report PRO-BIP 2009. The Netherlands: UniversiteitUtrecht; 2009.
[7] Akaraonye E, Keshavarz T, Roy I. Production of polyhydroxyalkanoates: thefuture green materials of choice. J Chem Technol Biotechnol 2010;85:732–43.
[8] Ashby RD, Solaiman DKY, Strahan GD. Efficient utilization of crude glycerol asfermentation substrate in the synthesis of poly(3-hydroxybutyrate) biopoly-mers. J Am Oil Chem Soc 2011;88:949–59.
[9] Posada JA, Naranjo JM, Lopez JA, Higuita JC, Cardona CA. Design and analysisof poly-3-hydroxybutyrate production processes from crude glycerol. ProcessBiochem 2011;46:310–7.
10] Madden LA, Anderson AJ, Shah DT, Asrar J. Chain termination in polyhy-droxyalkanoate synthesis: involvement of exogenous hydroxyl-compounds aschain transfer agents. Int J Biol Macromol 1999;25:43–53.
11] Cavalheiro JMBT, de Almeida MCMD, Grandfils C, da Fonseca MMR. Poly(3-hydroxybutyrate) production by Cupriavidus necator using waste glycerol.Process Biochem 2009;44:509–15.
12] Koller M, Bona R, Braunegg G, Hermann C, Horvat P, Kroutil M, et al. Produc-tion of polyhydroxyalkanoates from agricultural waste and surplus materials.Biomacromolecules 2006;6:561–5.
13] Kim BS, Lee SC, Lee SY, Chang HN, Chang YK, Woo SI. Production of poly(3-hydroxybutyric acid) by fed-batch culture of Alcaligenes eutrophus with glucoseconcentration control. Biotechnol Bioeng 1994;43:892–8.
14] Pradella JGC, Ienczak JL, Delgado CR, Taciro MK. Carbon source pulsed feed-ing to attain high yield and high productivity in poly(3-hydroxybutyrate)(PHB) production from soybean oil using Cupriavidus necator. Biotechnol Lett2012;34:1003–7.
15] Pohlmann A, Fricke WF, Reinecke F, Kusian B, Liesegang H, Cramm R, et al.Genome sequence of the bioplastic-producing “Knallgas” bacterium Ralstoniaeutropha H16. Nat Biotechnol 2006;24:1257–62.
16] Reinecke F, Steinbüchel A. Ralstonia eutropha strain H16 as model organism forPHA metabolism and for biotechnological production of technically interestingbiopolymers. J Mol Microbiol Biotechnol 2009;16:91–108.
17] Wang B, Sharma-Shivappa RR, Olson JW, Khan SA. Upstream processoptimization of polyhydroxybutyrate (PHB) by Alcaligenes latus using two-stage batch and fed-batch fermentation strategies. Bioprocess Biosys Eng2012;35:1591–602.
18] Wang F, Lee SY. Poly(3-hydroxybutyrate) production with high productivityand high polymer content by a fed-batch culture of Alcaligenes latus undernitrogen limitation. Appl Environ Microbiol 1997;63:3703–6.
19] Lee J, Lee SY, Park S, Middelberg APJ. Control of fed-batch fermentations.Biotechnol Adv 1999;17:29–48.
20] Hafuka A, Sakaida K, Satoh H, Takahashi M, Watanabe Y, Okabe S. Effect offeeding regimens on polyhydroxybutyrate production from food wastes byCupriavidus necator. Bioresour Technol 2011;102:3551–3.
21] Kulpreecha S, Boonruangthavorn A, Meksiriporn B, Thongchul N. Inexpensive
fed-batch cultivation for high poly(3-hydroxybutyrate) production by a newisolate of Bacillus megaterium. J Biosci Bioeng 2009;107:240–5.22] Arifin Y, Sabri S, Sugiarto H, Krömer JO, Vickers CE, Nielsen LK. Deletion ofcscR in Escherichia coli W improves growth and poly-3-hydroxybutyrate (PHB)production from sucrose in fed batch culture. J Biotechnol 2011;156:275–8.
[
[
chemistry 49 (2014) 365–373 373
23] Lee SH, Oh DH, Ahn WS, Lee Y, Choi J, Lee SY. Production of poly(3-hydroxybutyrate-co-3-hydroxyhexanoate) by high-cell-density cultivation ofAeromonas hydrophila. Biotechnol Bioeng 2000;67:240–4.
24] Lee SY, Wong HH, Choi J, Lee SH, Lee SC, Han CS. Production of medium-chain-length polyhydroxyalkanoates by high-cell-density cultivation of Pseudomonasputida under phosphorus limitation. Biotechnol Bioeng 2000;68:466–70.
25] Park SJ, Ahn WS, Green PR, Lee SY. High level production of poly(3-hydroxybutyrate-co-3-hydroxyhexanoate) by metabolically engineeredEscherichia coli strains. Biomacromolecules 2001;2:248–54.
26] Ishizaki A, Tanaka K. Batch culture of Alcaligenes eutrophus ATCC 17697Tusing recycled gas closed circuit culture system. J Ferment Bioeng 1990;69:170–4.
27] Dubois M, Gilles KA, Hamilton JK, Rebers PA, Smith F. Colorimetric method fordetermination of sugars and related substances. Anal Chem 1956;28:350–6.
28] Lee YW, Yoo YJ. Kinetics for the growth of Alcaligenes eutrophus and thebiosynthesis of poly-�-hydroxybutyrate. Korean J Appl Microbiol Biotechnol1991;19:186–92.
29] Nor ZM, Tamer MI, Scharer JM, Young MM, Jervis EJ. Automated fed-batch cul-ture of Kluyveromyces fragilis based on a novel method for on-line estimationof cell specific growth rate. Biochem Eng J 2001;9:221–31.
30] Qiu L, Yao Y, Chen C. Optimization of feeding strategy in fed-batch cultures fordegradation of phenol by trichosporon sp.X1. In: 3rd International conferenceon bioinformatics and biomedical engineering, ICBBE 2009. 2009.
31] Berezina N. Novel approach for productivity enhancement of polyhydroxyalka-noates (PHA) production by Cupriavidus necator DSM 545. New Biotechnol2013;30:192–5.
32] Nonato RV, Mantelatto PE, Rossell CV. Integrated production of biodegradableplastic, sugar and ethanol. Appl Microbiol Biotechnol 2001;57:1–5.
33] Rossell CEV, Mantelatto PE, Agnelli JAM, Nascimento J. Sugar-based biorefinery-technology for integrated production of poly(3-hydroxybutyrate), sugar andethanol. In: Kamm B, Gruber PR, Kamm M, editors. Biorefineries – industrialprocesses and products. Weinheim: Wiley–VHC; 2006. p. 209–25.
34] Cavalheiro JMBT, Raposo RS, de Almeida MCMD, Cesario MT, Sevrin C,Grandfils C, et al. Effect of cultivation parameters on the production ofpoly(3-hydroxybutyrate-co-4-hydroxybutyrate) and poly(3-hydroxybutyrate-4-hydroxybutyrate-3-hydroxyvalerate) by Cupriavidus necator using wasteglycerol. Bioresour Technol 2012;111:391–7.
35] Spoljaric IV, Lopar M, Koller M, Muhr A, Salerno A, Reiterer A, et al. Mathemati-cal modeling of poly[(R)-3-hydroxyalkanoate] synthesis by Cupriavidus necatorDSM 545 on substrates stemming from biodiesel production. Bioresour Technol2013;133:482–94.
36] Liu F, Li W, Ridgway D, Gu T. Production of poly-�-hydroxybutyrate on molassesby recombinant Escherichia coli. Biotechnol Lett 1998;20:345–8.
37] Du GC, Chen J, Gao HJ, Chen YG, Lun SY. Effects of environmental conditionson cell growth and poly-�-hydroxybutyrate accumulation in Alcaligenes eutro-phus. World J Microbiol Biotechnol 2000;16:9–13.
38] Ibrahim MHA, Steinbuchel A. Poly(3-hydroxybutyrate) production fromglycerol by Zobellella denitrificans MW1 via high-cell-density fed-batchfermentation and simplified solvent extraction. Appl Environ Microbiol2009;75:6222–31.
39] Mothes M, Schnorpfeil C, Ackermann JU. Production of PHB from crude glycerol.Eng Life Sci 2007;7:475–9.
40] Zhu C, Nomura CT, Perrotta JA, Stipanovic AJ, Nakas JP. Production and charac-terization of poly-3-hydroxybutyrate from biodiesel-glycerol by Burkholderiacepacia ATCC 17759. Biotechnol Prog 2010;26:424–30.
Recommended