Embed Size (px)
Citation preview
i
L-asparaginase production by fed-batch fermentation with
recombinant Pichia pastoris
Operation modes, conditions in bioreactor and kinetic parameters
determination
David Miguel da Cruz Rodrigues
Thesis to obtain the Master of Science Degree in
Biological Engineering
Supervisors: Dr. Adalberto Pessoa Junior
Dr. Luís Joaquim Pina da Fonseca
Examination committee
Chairperson: Dr. Duarte Miguel de França Teixeira dos Prazeres
Co-Supervisor: Dr. Luis Joaquim Pina da Fonseca
Member of the Committee: Dr. Pedro Carlos de Barros Fernandes
Outubro, 2016
ii
Acknowledgements
A realização de uma dissertação é um processo complexo e exaustivo que levou à elaboração deste
documento. Este percurso iniciou-se quando o Prof. Adalberto Pessoa Junior me aceitou para fazer
parte da sua equipa e por me receber no Laboratório de Biotecnologia Farmacêutica da Faculdade de
Ciências Farmacêuticas da Universidade de São Paulo para estudar um tema pelo qual tenho enorme
interesse. Obrigado por esta oportunidade e todo o acompanhamento ao longo destes longos meses
de trabalho.
Ir estudar para o Brasil foi uma grande mudança, um novo continente, um novo país uma nova
universidade, mas que se tornou mais fácil com a ajuda de colegas e amigos que me deram a conhecer
um bocado do país, da cultura e me integraram, fazendo-me sentir em casa.
Quero agradecer à Malu, que a mais de 8000 km me fez sentir em casa, pelo seu carinho e
hospitalidade.
Ao Gledston, um obrigado por me teres recebido como um amigo, mesmo ainda sem me conheceres
e pela tua companhia (especialmente nas cervejas bebidas, nos intervalos de trabalho).
Ao Omar, agradeço, por ser o meu braço direito nesta viagem, por estar sempre disponível para as
minhas dúvidas, novas estratégias e companhia no laboratório.
Ao Juan, à Karin e ao Ignácio, o meu obrigado pela disponibilidade e prontidão para ajudar.
À Gabriela, agradeço por ter tido a paciência e tempo nas longas horas a medir amostras.
A todos do laboratório, que me receberam de braços abertos, com entusiasmo e amabilidade, que me
ajudaram com conselhos e boa companhia, muito obrigado.
Aos meus pais e ao meu irmão, agradeço todo o apoio nestes meses, sem vocês este percurso seria
muito mais difícil e complicado.
À tia Sandra, agradeço por ter sido a minha agente pessoal e me ter apoiado em tudo o que eu
precisava durante a minha estadia.
À minha prima Inês, por todo o poio, obrigado.
À minha avó São, que conseguiu ir dar um saltinho ao outro lado do oceano e não deixar o seu neto à
fome, sem as iguarias portuguesas, obrigado avó.
À minha avó Lena, agradeço por ter andado a contar os meses e dias que faltavam para regressar
desde o momento em que entrei no avião, por ter tido a paciência de explorar a tecnologia e usar o
Skype.

iii
Por ultimo, o maior agradecimento. À Kateryna, que sempre me suportou durante todo este percurso,
desde o momento em que pensei em me candidatar até acabar este documento. A tua presença nas
primeiras semanas no Brasil foi algo espetacular e que tornou a transição mais fácil . Mesmo à
distância as nossas conversas no Skype que eram o momento alto da noite durante as longas horas a
tomar conta do fermentador. Obrigado por todo apoio e carinho.
A todos os que me acompanharam durante esta etapa da minha vida, seja nas em aulas, trabalhos ou
em momentos mais relaxados como ir beber uma simples cerveja ao Arco do Cego. Obrigado.
iv
Abstract
L-asparaginase is used in the treatment of Acute Lymphoblastic Leukemia (ALL), with only bacterial
versions produced being commercialize. Alternative Saccharomyces cerevisiae ASNase coded by the
ASP3 gene was produced in recombinant Pichia pastoris, under the control of the AOX1 gene promoter.
P. pastoris, a methylotrophic yeast, is an established system for the production of heterologous proteins,
particularly biopharmaceuticals and industrial enzymes. However, the physiological effects of different
cultivation strategies result in different specific growth rates, biomass and enzyme yields. The multistage
fed batch cultivation was separated four distinct phases: glycerol batch phase, glycerol fed-batch phase,
starvation phase and the production phase. In this study, recombinant P. pastoris was cultivated using
optimum conditions with modified defined medium, 31 g.L-1 were produced during glycerol batch phase
(GBP) giving a yield coefficient of 0.77 g.gglycerol-1 and specific growth rate of 0.21 h-1. With 12 h limiting
glycerol feed the cell concentration achieved above 65 g.L-1 with low concentration of ethanol detected.
High cell density culture performed in bioreactor, where the biomass concentration reached 91 g.L-1
after induction. Through the induction with methanol was observed a specific growth rate up to of 0.039
h-1. Enzyme yield per dry cell mass reached 37 U.g-1 with no active enzyme detected in the supernatant,
resulted in a volumetric yield 3315 U.L-1 and global volumetric productivity of 31 U.L-1.h-1.
Key words: L-asparaginase, Pichia pastoris, defined medium, Fed-Batch fermentation, high cellular
density culture, kinetic parameter
v
Resumo
L-asparaginase é uma enzima utilizada no tratamento de Leucemia Linfomablastica Aguda em que as
únicas versões comercializadas são de origem bacteriana. Foi produzida em Pichia pastoris uma
ASNase de Saccharomyces cerevisiae codificada pelo gene ASP3, sob o controlo do promotor AOX1.
P. pastoris, uma levedura metilotrófica, é um sistema reconhecido para a produção heteróloga de
proteínas, particularmente biofarmacêuticas e enzimas industriais. Contudo, os efeitos fisiológicos de
diferentes estratégias de cultivo resultam em diferentes velocidades específicas de crescimento e
diferentes rendimentos. O cultivo descontinuo com alimentação foi divido em quatro fases distintas:
inicial de glicerol, adição descontínua de glicerol, fase exaustão/esgotamento e fase de produção. Neste
estudo, P. pastoris recombinante foi cultivada a condições ótimas de pH e temperatura usando um meio
definido modificado, que para o kLa inicial ótimo produziu-se 31 g.L-1 durante a fase de batelada com
glicerol resultando num rendimento de 0.77 g.gglycerol-1 e uma velocidade de crescimento de 0.21 h-1.
Com 12 h de alimentação limitada de glicerol alcançou-se 65 g.L-1 de biomassa seca, com baixos níveis
de etanol detetados. Com fermentação de alta densidade celular em biorreator produziu-se até 91 g.L-
1. Durante a fase de indução com metanol observou-se uma velocidade específica de crescimento até
0.039 h-1. O rendimento em enzima por unidade de massa seca atingiu 37 U.g-1, sem ter sido detetada
atividade enzimática no sobrenadante, resultando no rendimento volumétrico de 3315 U.L-1 e uma
produtividade volumétrica global de 31 U.L-1.h-1.
Palavras chave: L-asparaginase, Pichia pastoris, meio definido, fermentação descontinua com adição
de nutrientes, culturas de alta densidade celular, parâmetros cinéticos
vi
Contents
Acknowledgements ..................................................................................................................................ii
Abstract ................................................................................................................................................... iv
Resumo ..................................................................................................................................................... v
Contents .................................................................................................................................................. vi
List of tables .......................................................................................................................................... viii
List of figures ........................................................................................................................................... ix
1. Introduction ..................................................................................................................................... 1
1.1. Objective ............................................................................................................................ 1
2. Theoretical background ................................................................................................................... 2
2.1. Acute Lymphoblastic leukemia ....................................................................................... 2
2.2. L-asparaginase as therapeutic agent ............................................................................ 3
2.3. L-asparaginase from Escherichia coli, Erwinia Chrysontheni and PEGilated ......... 4
2.4. L-asparaginase from yeast S. cerevisiae ...................................................................... 6
2.5. Heterologous protein expression in Pichia pastoris .................................................... 7
2.5.1. P. pastoris expression system .................................................................................... 7
2.5.2. Metabolism and AOX promoters ................................................................................ 8
2.5.3. Methanol utilization phenotypes (MUT+, MUTS and MUT-) .................................. 9
2.5.4. Pichia pastoris high cell concentration fermentation ............................................. 10
2.5.4.1. Fermentation media ............................................................................................... 10
2.5.4.2. Operational strategies ............................................................................................ 11
2.5.4.3. Glycerol Batch and fed-batch phases .................................................................. 12
2.5.4.4. Methanol fed-batch strategies .............................................................................. 12
2.5.4.4.1. Constant methanol concentration control ....................................................... 13
2.5.4.4.2. µ-stat control ........................................................................................................ 14
2.5.4.4.3. DO stat Control ................................................................................................... 15
3. Materials and Methods ................................................................................................................. 16
3.1. Equipment ........................................................................................................................ 16
3.2. Pichia pastoris expression system ............................................................................... 16
3.3. Culture medium formulation .......................................................................................... 16
3.4. Pichia pastoris cell bank – Cell line preservation and revival .................................. 17
3.5. Pichia pastoris Cultivation in Erlenmeyer flask .......................................................... 17
3.6. Pichia pastoris cultivation in bioreactor ....................................................................... 18
vii
3.6.1. kLa experiments .......................................................................................................... 18
3.6.1.1. kLa determination .................................................................................................... 19
3.6.2. Two stages fermentation – high cell density fermentation with P.pastoris
recombinant ................................................................................................................................. 20
3.6.3. Three stages fermentation – Induction experiments of L-asparaginase
production .................................................................................................................................... 20
3.7. Analytical techniques ..................................................................................................... 23
3.7.1. Dry cell weight ............................................................................................................. 23
3.7.2. Glycerol quantification ................................................................................................ 23
3.7.3. L-asparaginase activity quantification ...................................................................... 24
3.7.4. Ethanol and methanol quantification ........................................................................ 24
3.7.5. SDS-PAGE .................................................................................................................. 24
3.7.6. ASNase purification by fast protein liquid chromatography ................................. 24
3.7.7. Total protein quantification ........................................................................................ 25
4. Results and discussion ................................................................................................................... 26
4.1. ASNase production in Shaker-flash cultures .............................................................. 26
4.1.1. Media evaluation by cell growth and ASNase periplasmic activity ..................... 26
4.1.2. Basal salt medium nitrogen source modification ................................................... 27
4.2. P. pastoris high cell density culture in 3L bioreactor ................................................. 29
4.2.1. Fermentation medium oxygenation conditions - kLa selection ............................ 29
4.2.2. Glycerol fed-batch feed profiles ................................................................................ 31
4.2.3. Two phases fermentation – high cell density culture ............................................ 33
4.2.4. ASNase production induction in high cell density P. pastoris culture ................. 35
4.2.4.1. Comparison of ASNase induction in bioreactor and shaker flask ................... 35
4.2.5. ASNase production and kinetic parameters determination – pulses feeding .... 36
4.2.6. ASNase production and kinetic parameters determination – continuous
methanol feeding ........................................................................................................................ 40
5. Conclusions .................................................................................................................................... 45
6. Recommendations ........................................................................................................................ 48
7. Bibliography ................................................................................................................................... 49
Appendices ............................................................................................................................................ 57
Appendix A: Pichia pastoris recombinant strain and BMY’s components analytical
composition .............................................................................................................................. 57
viii
List of tables
Table 1 - kLa (h-1) values obtain with gassing out method in water for different values of agitation (500
to 1000 rpm) and aeration rates (0.25; 0.5; 0.75; 1 vvm) for bioreactor Bioflo 115 New Brunskwick, with
a 3 L vessel at 25 °C ............................................................................................................................. 19
Table 2 - P. pastoris biomass yield (g.gglycerol-1), specific growth rate (h-1) and volumetric productivity
(gdcw.L-1.h-1) in 3 L bioreactor with 2L using BSMm media with PTM1,, at 30°C, kLa 8x10 h-1 - 6x10² h-1
(1 vvm of aeration and 500-700 rpm of agitation speed), until glycerol depletion. Controlled pH 5.0 with
NaOH (10M); initial glycerol concentration 40 g.L 1 and inoculum 1 gdcw.L 1......................................... 30
Table 3 - Volumetric feed flow rate calculated through the use of mass balance and Excel for µ=0.072
h-1, Yx/s=0,77 gdcw.gglycerol-1 and initial cell density of 28 g.L-1 for 12 h feed and feed solution’s glycerol
concentration of 50% (w/v).................................................................................................................... 33
Table 4 – Methanol feeding rate used in the methanol limiting continuous feed. ................................. 41
Table 5 - Carbon and nitrogen elementary composition analysis of BMY compounds Central Analítica
do Instituto de química from Universidade de São Paulo ..................................................................... 57
Table 6 - Elementary composition of yeast Pichia pastoris recombinant strain by Central Analítica do
Instituto de química from Universidade de São Paulo .......................................................................... 57
ix
List of figures
Figure 1 - Schematic illustration of blood stem cell differentiation [6] ..................................................... 2
Figure 2 – Schematic illustration of the reaction mechanism of L-asparagine hydrolyze to L-aspartate
catalyzed by the enzyme ASNase The intermediate is produced in the course of nucleophilic attack by
enzyme [30]. ............................................................................................................................................ 4
Figure 3 – P. pastoris under microscope: A) stained with lugol B) after Gram straining. ....................... 7
Figure 4 - The methanol pathway in P. pastoris. 1, alcohol oxidase; 2, catalase; 3, formaldehyde
dehydrogenase; 4, formate dehydrogenase, 5, dihydroxyacetone synthase; 6, dihydroxyacetone
kinase; 7, fructose 1,6-biphosphate aldolase; 8, fructose 1,6-bisphosphatase [26]. .............................. 8
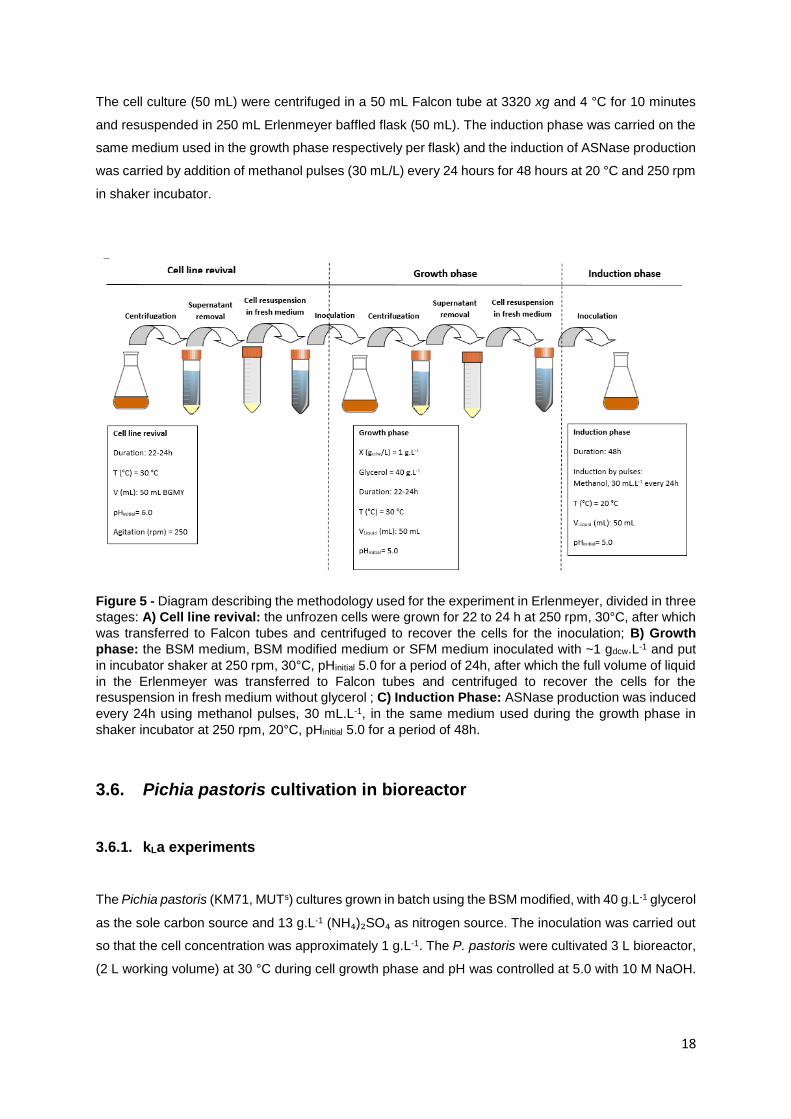
Figure 5 - Diagram describing the methodology used for the experiment in Erlenmeyer, divided in three
stages: A) Cell line revival: the unfrozen cells were grown for 22 to 24 h at 250 rpm, 30°C, after which
was transferred to Falcon tubes and centrifuged to recover the cells for the inoculation; B) Growth
phase: the BSM medium, BSM modified medium or SFM medium inoculated with ~1 gdcw.L-1 and put in
incubator shaker at 250 rpm, 30°C, pHinitial 5.0 for a period of 24h, after which the full volume of liquid
in the Erlenmeyer was transferred to Falcon tubes and centrifuged to recover the cells for the
resuspension in fresh medium without glycerol ; C) Induction Phase: ASNase production was induced
every 24h using methanol pulses, 30 mL.L-1, in the same medium used during the growth phase in
shaker incubator at 250 rpm, 20°C, pHinitial 5.0 for a period of 48h. ...................................................... 18
Figure 6 - Fermentation conducted in bioreactor phase diagram for a three phases fermentation process
with P.pastoris and its conditions. 1st phase: Glycerol Batch Phase (GBP) has glycerol 40 g.L-1,
(NH4)2SO4 13 g.L-1, kLa 80-160 h-1 that corresponds to 1 vvm of aeration and agitation speed of 500-
700 rpm, pH 5.0, at 30◦C until glycerol exhaustion; 2nd phase: Glycerol Fed-batch Phase (GFP)
temperature and pH as in BGP and kLa 160 h-1 that corresponds to 1 vvm of aeration and agitation
speed of 700 rpm (selected condition), it is started the feed with glycerol solution 50% (w/m) with 0.325
g(NH4)2SO4.gglycerol-1 and 15 mL.gglycerol solution
-1 for 12h; 3rd phase: Methanol Fed-batch Phase (MFP) at the
same conditions of aeration and agitation as the selected condition, 20◦C and pH 6.0 with methanol
(100%) feed with PTM1 12 mL PTM1.mLmethanol solution-1 for 72-96 h. ......................................................... 22
Figure 7 - Biomass Dry weight of P. pastoris in: BSM with PTM1, BMGY with and without casein or corn
step powder and glycerol, after growth phase with 40 and 10 g.L-1 glycerol respectively for 24 h and in
the induction phase with 3% methanol during 48 h .............................................................................. 27
x
Figure 8 - Periplasmic activity of ASNase obtained with P. pastoris in: BSM with PTM1, BMGY with and
without casein or corn step powder and glycerol, after growth phase with 40 and 10 g.L-1 glycerol
respectively for 24 h and in the induction phase with 3% methanol during 48 h. ................................. 27
Figure 9 - Growth curve of P. pastoris in shake-flasks. Culture was initiated at, pH 5.0, 30 °C, agitation
250 rpm, inoculum 1 g.L-1 in: ( ) BSMm with (NH4)2SO4, 13 g.L-1; ( )BSMm with (NH4)2SO4, 15 g.L-1;
( ) BSMm with (NH4)2SO4, 20 g.L-1; ( ) SFMm with (NH4)2SO4, 13 g.L-1; ( ) SFMm with (NH4)2SO4,
15 g.L-1; ( ) SFMm with (NH4)2SO4, 20 g.L-1 ...................................................................................... 28
Figure 10 - Growth curves bioreactor using BSMm obtain by optical density (DO): A) ( ) kLa=8.4x101
h-1, obtain for 1vvm of aeration and 500 rpm; B) ( ) kLa=1.1x10² h-1, obtain for 1vvm of aeration and
600 rpm; C) ( ) kLa=1.6x10² h-1, obtain for 1vvm of aeration and 700 rpm. Glycerol consumption curves:
A)( ) kLa=8.4x101 h-1; B) ( ) kLa=1.1x10² h-1; C) kLa=1.6x10² h-1 ( ). Temperature:30 ⁰C, inoculum 1
gdcw.L-1 and pH 5.0; Broth volume: 2 L. ................................................................................................. 30
Figure 11 - Feeding profile computed for µ=0.072 h-1, Yx/s=0,77 gdcw.gglycerol-1 and initial cell density of 28
g.L-1 for 12 h feed. A) Exponential feed ( ); Pseudo-exponential feed with step increases every two
hours ( ); Exponential feed ( ); B) Constant feed obtain from the average of the exponential feed for
12h ( ) ................................................................................................................................................. 32
Figure 12 - Growth curves of P. pastoris ( ) in 3L bioreactor to achieve high cell density culture using
BSM modified medium and glycerol consumption ( ). Temperature: 30°C, inoculum 0.82 g.L-1, pH 5.0,
aeration 1 vvm of and 700 rpm (kLa=1.6x10² h-1), and initial volume 1,5 L. A) Glycerol batch phase with
40 g.L-1 glycerol for 20 h; B) Glycerol fed-batch phase with glycerol solution 50% (w/m) with 0.325
g(NH4)2SO4.gglycerol-1
and 15 mLPTM1.Lglycerol solution-1 for 12 h. B1) Gycerol fed-batch phase with pseudo
exponential feeding (average flow rate 13 mL.h-1) and B2) Glycerol fed-batch phase at constant feed
(13 mL.h-1) ............................................................................................................................................. 34
Figure 13 - Kinetic profile for ASNase production ( ) by recombinant P. pastoris ( ) in 3 L vessel
bioreactor to achieve high cell density culture using BSM modified medium and glycerol consumption (
). Temperature: 30°C, inoculum 0.82 g.L-1, pH 5.0, aeration 1 vvm of and 700 rpm (kLa=1.6x10² h-1)
and initial volume 1,5 L. A) Glycerol batch phase with 40 g.L-1 glycerol for 20 h; B) Glycerol fed-batch
phase at constant feed (13 mL.h-1)with glycerol solution 50% (w/m) with 0.325 g(NH4)2SO4.gglycerol-1
and 15
mLPTM1.Lglycerol solution-1 for 12 h; C) Starvation period of 2h to ensure total glycerol depletion; D) Induction
fed-batch phase at 20°C, pH 6.0, with methanol solution (100% ,12 mLPTM1.Lmehtanol-1) fed by two pulses
(30 mL.L-1) controlled by DO (dissolved oxygen) spikes. ..................................................................... 36
Figure 14 - Kinetic profile for ASNase production ( ) by recombinant P. pastoris in 3 L vessel bioreactor
to achieve high cell density culture using BSM modified medium and glycerol consumption ( ).Growth
temperature: 30°C, inoculum 0.91 g.L-1, pH 5.0, aeration 1 vvm of and 700 rpm (kLa=1.6x10² h-1) and
initial volume 1,5 L. A) Glycerol batch phase with 40g.L-1 glycerol for 20 h; B) Glycerol fed-batch phase
at constant feed (13 mL.h-1)with glycerol solution 50% (w/m) with 0.325 g(NH4)2SO4.gglycerol-1
and 15
xi
mLPTM1.Lglycerol solution-1 for 12 h; C) Starvation period of 1 h to ensure total glycerol depletion; D) Induction
fed-batch phase at 20°C, pH 6.0, with methanol ( ) solution (100% ,12 mLPTM1.Lmehtanol-1) fed by pulses:
two small pulses (5 mL.L-1), 4 medium pulses (10 mL.L-1) and 2 large pulses (30 mL.L-1) controlled by
DO (dissolved oxygen) spikes. Cell density ( ) obtain by optical density. ........................................... 37
Figure 15 - SDS-Page with blue comassie satining of supernatant samples. 1) commercial E. coli
ASNase; 2) supernatant sample just before induction; 3-9) Supernatant samples after induction. The
samples were taken just before it was induced with the next pulse. 3) first pulse; 4) second pulse; 5)
third pulse; 6) fourth pulse; 7) fifth pulse; 8) sixth pulse; 9) eighth pulse. ............................................. 39
Figure 16 - Purification of extracellular ASNase in the supernatant from the fermentation continuous
induction, by Ni2+ immobilized metal ion affinity chromatography. Elution profile obtain from the affinity
step on the Hitrap IMAC column. FPLC was performed with one elution step using Elution buffer (NaCl
500 mM, imidazole 500 mM, sodium phosphate buffer 20 mM, pH 8.6). A) The blue line refers to the
elution of sample conductivity with imidazole. The red line is the sample’s conductivity without the
imidazole contribution to the conductivity detected. Green line is the elution solution feed rate. B) blue
line is the imidazole’s conductivity that was used as standard. Green line is the elution solution feed
rate. ....................................................................................................................................................... 39
Figure 17 - Kinetic profile for ASNase production ( ) by recombinant P. pastoris in 3 L vessel bioreactor
with high cell density culture using BSM modified medium and glycerol consumption ( ). Growth
temperature: 30°C, inoculum 0.95 g.L-1, pH 5.0, aeration 1 vvm of and 700 rpm (kLa=1.6x10² h-1) and
initial volume 1,5 L. A) Glycerol batch phase with 40g.L-1 glycerol for 20 h; B) Glycerol fed-batch phase
at constant feed (13 mL.h-1)with glycerol solution 50% (w/m) with 0.325 g(NH4)2SO4.gglycerol-1
and 15
mLPTM1.Lglycerol solution-1 for 12 h; C) Starvation period of 1 h to ensure total glycerol depletion; D) Induction
fed-batch phase at 20°C, pH 6.0, with continuous methanol ( ) solution fedd (100% ,12 mLPTM1.Lmehtanol-
1). Cell density ( ). ................................................................................................................................ 42
Figure 18 - SDS-Page with blue coomassie staining of supernatant samples and purified enzyme. 1)
Purified ASNase; 2) supernatant sample at 30 h of fermentation (before induction); 3-5 and 7-10)
Supernatant samples after induction. 3) sample taken at 34 h; 4) sample taken at 46 h; 5) sample taken
at 58 h; 7) sample taken at 70 h; 8) sample taken at 82 h; 9) sample taken at 94 h; 10) sample taken at
106. 6) standard molecular weight ........................................................................................................ 43
Figure 19 - Purification of extracellular ASNase in the supernatant from the fermentation continuous
induction, by Ni2+ immobilized metal ion affinity chromatography. Elution profile obtain from the affinity
step on the Hitrap IMAC column. FPLC was performed with one elution step using Elution buffer (NaCl
500 mM, imidazole 500 mM, sodium phosphate buffer 20 mM, pH 8.6). The blue line refers to the elution
of sample conductivity with imidazole. The red line is the imidazole elution used as standard. Pink line
is the sample’s conductivity without the imidazole contribution to the conductivity detected. .............. 43
List of acronyms
xii
ALL Acute lymphoblastic leukemia
AOX Alcohol oxidase
ASNase L-asparaginase
BGMY Buffered glycerol complex medium
BMMY Buffered methanol complex medium
BMY Buffered complex medium
BSM Basal salt medium
𝐶𝑠 Dissolved oxygen saturation concentration (mg.L-1)
DCW Dry cell weight (g)
DO Dissolved oxygen (%)
FM22 Fermentation medium 22
FPLC Fast protein liquid chromatography
g Gravitational acceleration (m.s-2)
GBP Glycerol batch phase
GC Gas chromatography
GFP Glycerol fed-batch phase
HCDC High cell density culture
HIS4 Histidinol dehydrogenase
HPLC High Pressure Liquid Chromatography
kLa Mass transfer coefficient
MFP Methanol fed-batch phase
MUT + Methanol utilization plus
MUT s Methanol utilization slow
MUT- Methanol utilization negative
PTM1 Pichia trace medium 1
TLFB Temperature liming fed-batch
TP Transition phase
SCP Single cell protein
SFM Salt fermentation medium
vvm Volume gas by volume of liquid and minute (Lgas.Liquid-1.min-1)
YPD yeast peptone dextrose
Yx/s Biomass to substrate yield (gdcw.g-1)
Greek letters
µ Growth rate (h-1)
1
1. Introduction
1.1. Objective
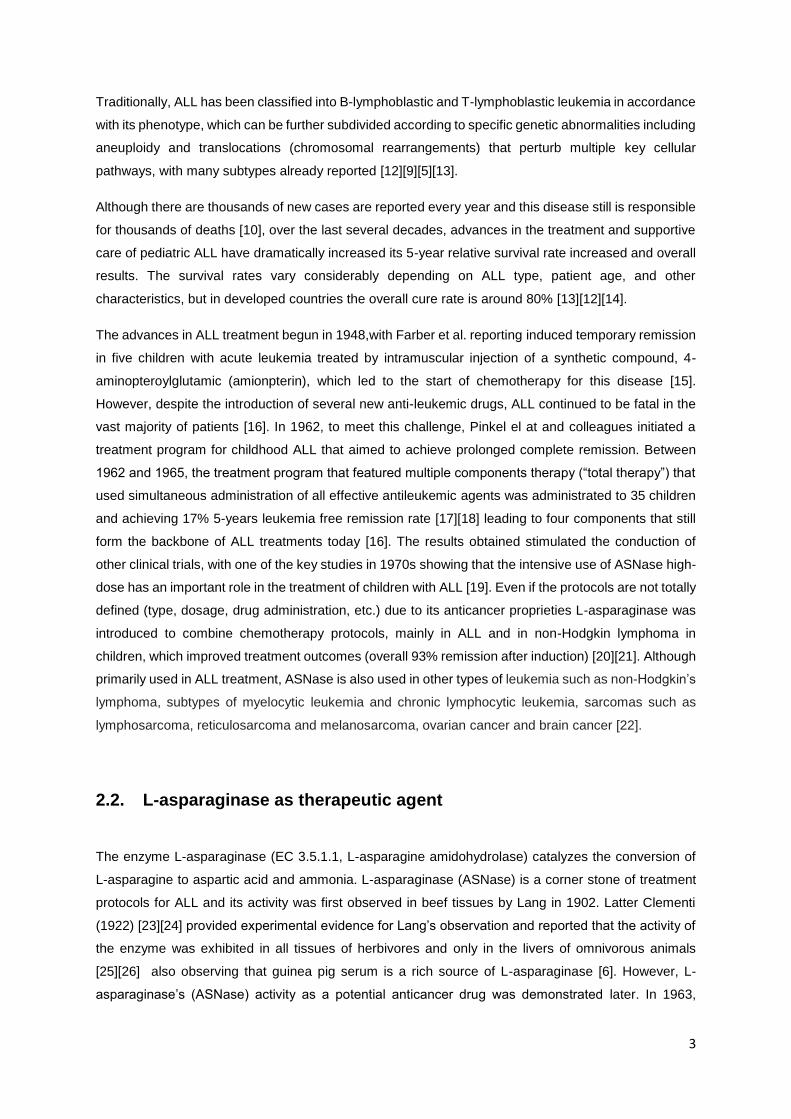
Acute lymphoblastic leukemia (ALL), a type of blood cancer is a common cancer type in children,
representing 3 in every 4 cases of leukemia. The chemotherapy treatment uses the enzyme L-
asparginase (ASNase). With markets losing interest in Brazil and with the discontinuation of various
pharmaceutical drugs, especially those related to oncological treatment, this project is developing a
viable process for L-asparaginase (ASNase) industrial production.[1]
The goal of this project is to obtain a viable industrial process for production of the therapeutic drug L-
asparaginase. For that purpose, was studied its production in methylotrophic yeast P. pastoris
recombinant system with ASP3 gene that encodes for the ASNase II from S. cerevisiae. Parameters
like the substrate feeding rate or the inducer concentration are known to play key roles regarding the
productivity of recombinant micro-organisms and process mode during production. The major objective
was to developing a process to achieve high cell density cultures and obtaining the kinetic parameter
for further process development.
2
2. Theoretical background
2.1. Acute Lymphoblastic leukemia
Cancer has been considered one of the most feared diseases of our time and for some people the most
feared [2]. Acute lymphoblastic leukemia (ALL), a type of blood cancer, is seen in both children and
adult. ALL’s global incidence is about three per 100 000 people, with around three out of four cases
occurring in children under 6 years [3] and being the most common form of childhood leukemia,
representing about 85% of cases of acute leukemia among children [4][5][6]. Although the precise
events leading to development of acute lymphoblastic leukemia are unknown[7], ALL is a malignant
disorder of lymphoid progenitor cells that begins in the bone marrow [8][9] and is characterized by rapid
increase and accumulation of immature hematopoietic cells, as these lymphocytes affected by leukemia
they do not go through their normal process of maturing. The enormous number of immature
lymphocytes results in the crowding of the bone marrow that hiders the production of healthy blood
cells. In most cases, the malignant cells can spill over into the blood stream and other parts of the body,
such as organs and tissues [10][11]
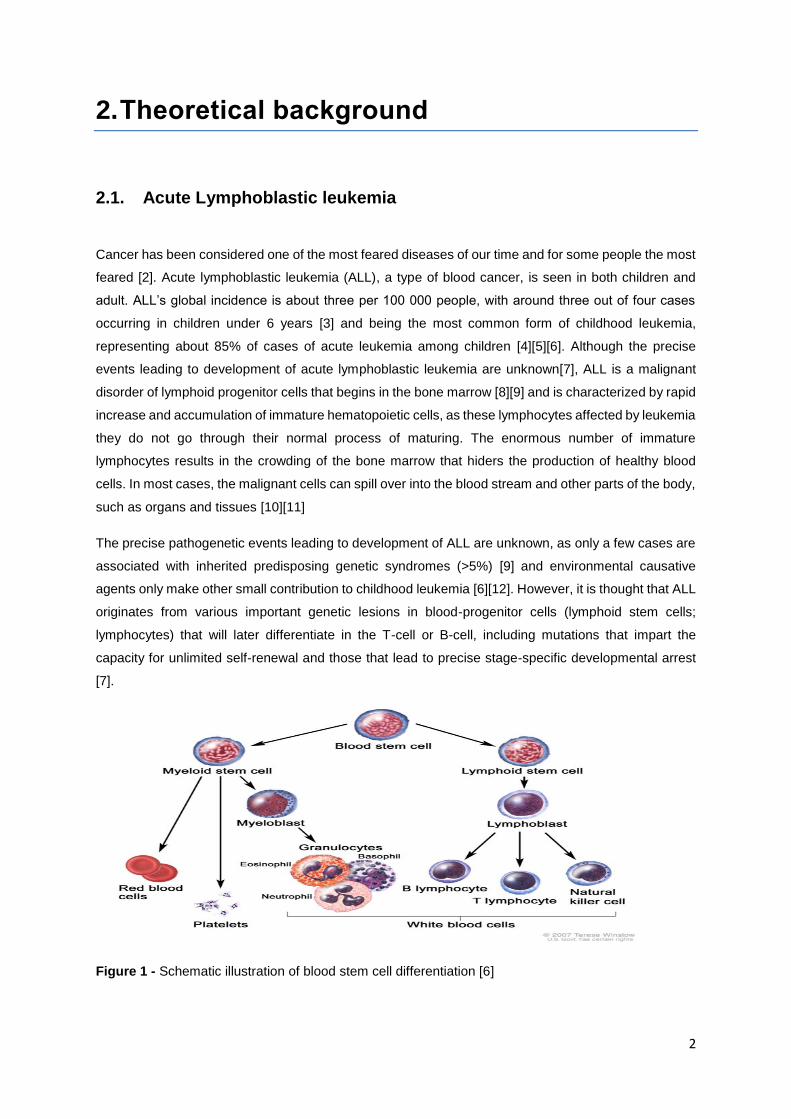
The precise pathogenetic events leading to development of ALL are unknown, as only a few cases are
associated with inherited predisposing genetic syndromes (>5%) [9] and environmental causative
agents only make other small contribution to childhood leukemia [6][12]. However, it is thought that ALL
originates from various important genetic lesions in blood-progenitor cells (lymphoid stem cells;
lymphocytes) that will later differentiate in the T-cell or B-cell, including mutations that impart the
capacity for unlimited self-renewal and those that lead to precise stage-specific developmental arrest
[7].
Figure 1 - Schematic illustration of blood stem cell differentiation [6]
3
Traditionally, ALL has been classified into B-lymphoblastic and T-lymphoblastic leukemia in accordance
with its phenotype, which can be further subdivided according to specific genetic abnormalities including
aneuploidy and translocations (chromosomal rearrangements) that perturb multiple key cellular
pathways, with many subtypes already reported [12][9][5][13].
Although there are thousands of new cases are reported every year and this disease still is responsible
for thousands of deaths [10], over the last several decades, advances in the treatment and supportive
care of pediatric ALL have dramatically increased its 5-year relative survival rate increased and overall
results. The survival rates vary considerably depending on ALL type, patient age, and other
characteristics, but in developed countries the overall cure rate is around 80% [13][12][14].
The advances in ALL treatment begun in 1948,with Farber et al. reporting induced temporary remission
in five children with acute leukemia treated by intramuscular injection of a synthetic compound, 4-
aminopteroylglutamic (amionpterin), which led to the start of chemotherapy for this disease [15].
However, despite the introduction of several new anti-leukemic drugs, ALL continued to be fatal in the
vast majority of patients [16]. In 1962, to meet this challenge, Pinkel el at and colleagues initiated a
treatment program for childhood ALL that aimed to achieve prolonged complete remission. Between
1962 and 1965, the treatment program that featured multiple components therapy (“total therapy”) that
used simultaneous administration of all effective antileukemic agents was administrated to 35 children
and achieving 17% 5-years leukemia free remission rate [17][18] leading to four components that still
form the backbone of ALL treatments today [16]. The results obtained stimulated the conduction of
other clinical trials, with one of the key studies in 1970s showing that the intensive use of ASNase high-
dose has an important role in the treatment of children with ALL [19]. Even if the protocols are not totally
defined (type, dosage, drug administration, etc.) due to its anticancer proprieties L-asparaginase was
introduced to combine chemotherapy protocols, mainly in ALL and in non-Hodgkin lymphoma in
children, which improved treatment outcomes (overall 93% remission after induction) [20][21]. Although
primarily used in ALL treatment, ASNase is also used in other types of leukemia such as non-Hodgkin’s
lymphoma, subtypes of myelocytic leukemia and chronic lymphocytic leukemia, sarcomas such as
lymphosarcoma, reticulosarcoma and melanosarcoma, ovarian cancer and brain cancer [22].
2.2. L-asparaginase as therapeutic agent
The enzyme L-asparaginase (EC 3.5.1.1, L-asparagine amidohydrolase) catalyzes the conversion of
L-asparagine to aspartic acid and ammonia. L-asparaginase (ASNase) is a corner stone of treatment
protocols for ALL and its activity was first observed in beef tissues by Lang in 1902. Latter Clementi
(1922) [23][24] provided experimental evidence for Lang’s observation and reported that the activity of
the enzyme was exhibited in all tissues of herbivores and only in the livers of omnivorous animals
[25][26] also observing that guinea pig serum is a rich source of L-asparaginase [6]. However, L-
asparaginase’s (ASNase) activity as a potential anticancer drug was demonstrated later. In 1963,
4
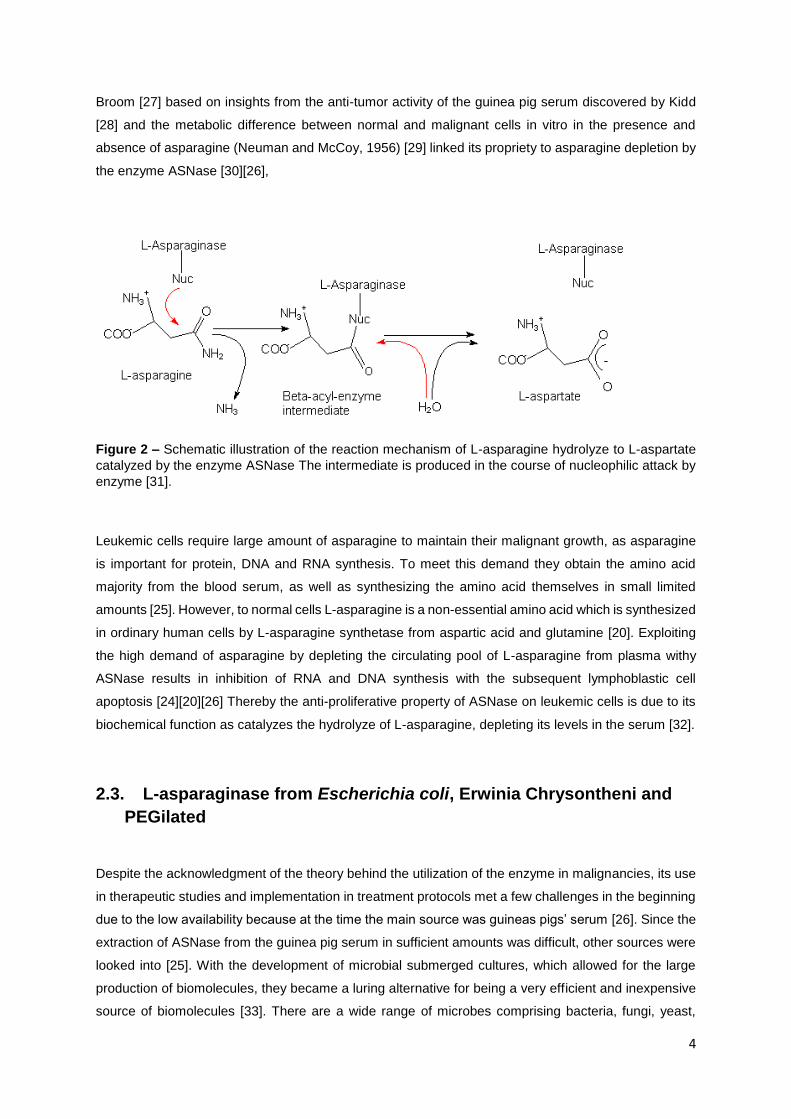
Broom [27] based on insights from the anti-tumor activity of the guinea pig serum discovered by Kidd
[28] and the metabolic difference between normal and malignant cells in vitro in the presence and
absence of asparagine (Neuman and McCoy, 1956) [29] linked its propriety to asparagine depletion by
the enzyme ASNase [30][26],
Figure 2 – Schematic illustration of the reaction mechanism of L-asparagine hydrolyze to L-aspartate
catalyzed by the enzyme ASNase The intermediate is produced in the course of nucleophilic attack by
enzyme [31].
Leukemic cells require large amount of asparagine to maintain their malignant growth, as asparagine
is important for protein, DNA and RNA synthesis. To meet this demand they obtain the amino acid
majority from the blood serum, as well as synthesizing the amino acid themselves in small limited
amounts [25]. However, to normal cells L-asparagine is a non-essential amino acid which is synthesized
in ordinary human cells by L-asparagine synthetase from aspartic acid and glutamine [20]. Exploiting
the high demand of asparagine by depleting the circulating pool of L-asparagine from plasma withy
ASNase results in inhibition of RNA and DNA synthesis with the subsequent lymphoblastic cell
apoptosis [24][20][26] Thereby the anti-proliferative property of ASNase on leukemic cells is due to its
biochemical function as catalyzes the hydrolyze of L-asparagine, depleting its levels in the serum [32].
2.3. L-asparaginase from Escherichia coli, Erwinia Chrysontheni and
PEGilated
Despite the acknowledgment of the theory behind the utilization of the enzyme in malignancies, its use
in therapeutic studies and implementation in treatment protocols met a few challenges in the beginning
due to the low availability because at the time the main source was guineas pigs’ serum [26]. Since the
extraction of ASNase from the guinea pig serum in sufficient amounts was difficult, other sources were
looked into [25]. With the development of microbial submerged cultures, which allowed for the large
production of biomolecules, they became a luring alternative for being a very efficient and inexpensive
source of biomolecules [33]. There are a wide range of microbes comprising bacteria, fungi, yeast,
5
actinomycetes and algae that produce this enzyme, however the enzyme proprieties vary from which
organism originates from and so it does the possibility of its usage in clinical treatment [31] In 1964,
Mashburn and Wriston demonstrated Escherichia coli (E. coli) ASNase tumoricidal activity [34] that
made it of primary interest as it was a well characterized microorganism. Later Campbell and Mashburn,
in 1967, reported the purification of two different ASNAses from E. Coli, EC-1 (periplasmic) and EC-2
(cytoplasmic), only the EC-2 had antitumor activity.
These findings allowed the production of the enzyme in large quantities for the pre-clinical and clinical
studies [3]. Until today, only bacterial derived enzymes from E. coli and Erwinia chrysontheni (E.
chrysontheni) have been approved for ALL treatment, so large ASNase production has only been done
with these enzymes as they have been found to have lowest toxicity. However, despite the lower toxic
effects on the patient, the native or unmodified forms of ASNase from bacterial sources present
immunogenic complications, resistance and short half-life that make their clinical application
challenging and limits its usage. The toxicity profile of ASNase falls under two main categories, the
immunological sensitization to a foreign protein (hypersensitivity) and the adverse events related to
inhibition of protein synthesis due to its activity that depletes the L-asparagine, such as neurotoxicity
and the most common effect being pancreatitis [35][14]. The hypersensitivity reactions presented one
of the main restrictions to the clinical use of ANSase, including several types of side reactions [36] that
include anaphylaxis, pain, edema, Quincke's edema, urticaria, erythema, rash and pruritis [35] It has
been observed that about 60% patients were suffering from hypersensitivity reactions during therapy
with ASNase from E. Coli. However, the antibodies produced in response to ASNase do not always
lead to clinical hypersensitivity, but may instead cause inactivation of the ASNase. The ASNase
inactivation (“silent hypersensitivity” or “silent inactivation”) leads to a lower concentration in the blood
than that needed to achieve the optimal L-asparagine depletion [35][30], About 30% patients show silent
hypersensitivity or silent inactivation. Both enzymes, exhibited high rate of immunogenicity. These
immunogenic complication, resistance and short half-life demanded alternative preparation of ASNase
for removal or for low frequency of allergic reactions. Several attempts have been made to reduce the
ASNase potential immunogenicity while preserving its enzymatic activity [26] and prolonging its half-life
to reduce the frequency of administration, which also increases life quality. Therefore several strategies
have been applied, such as protein engineering by site-directed mutagenesis [26] and chemical
modifications. The chemical modifications that could be less immunogenic and achieve higher half-life
were those that could hide the immunogenically active epitopes without compromising the
antineoplastic property of the drug [25]. Among the chemical modification procedures made to ASNase
were reported the coupling of ASNase to polyethylene glycol (PEG) molecules (pegylation), ASNase
coupling with dextran, ASNase with poly-DL-alanyl peptides to block epitopes of E. coli and Erwenia
ASNase, Acylation (which lead to enzyme becoming hydrophobic), SC-PEG (conjugation of PEG to
succinimidyl carbamate), palmitoyl ASNase where the enzyme is encapsulated. Although some showed
promising results, pegylation turned to be the most successful method. The pegylation of ASNase
reduced immunogenicity without altering the antineoplastic property of the enzyme [36] and was first
reported by Abuchowki in 1979, who successfully couple PEG molecules and ASNase by the covalent
conjugation of ASNase type EC-2 to the 5 kDa PEG [14]. Later confirm in vivo animal model by
6
Yoshimoto in1986 that also reported significant prolongation of its half-life. Since its approval from FDA
this modified ASNase has been the third preparation used in combination chemotherapy for the
treatment of patients with ALL who are hypersensitive to native forms [25].Currently, among the drugs
used in the treatment of ALL are three bacterial-derived ASNase preparation, i.e. native E.coli ASNase
(Kidrolase®, EUSA Pharma; Elspar®, Ovation Pharmaceuticals; Crasnitin®, Bayer; Leunase®, sanofi-
aventis; Asparaginase medac®, Kyowa Hakko), native Erwinia ASNase (Erwinase®, EUSA Pharma)
and PEG-ASNase (Oncaspar®, Enzon Pharmaceuticals Inc) [35][26][30]. In addition, a PEGylated
recombinant Erwinia ASNase (mPEG-r-crisantaspase) is undergoing evaluation (NCT015515124) [32]
and a new recombinant E. coli-asparaginase preparation is currently undergoing clinical evaluation
[35].Although, PEG-ASNase reduced the immunologic reactions and increased the half-life time in the
serum, there are still room for improvement by chemical modification, protein engineering and the non-
immunological adverse effects of ASNase such as pancreatitis, hyperglycaemia, hepatotoxicity or
coagulation disorders, can be eliminated or mitigated by extensive characterization of novel sources of
the enzyme.
2.4. L-asparaginase from yeast S. cerevisiae
Administration of foreign proteins may cause immunological problems that limit their usage. Even with
all the success given to the bacterial ASNase, there are still side effects, even with the chemical
modifications already approved [37][30][20]. Therefore, there is a demand for new drug protein with
different immunological proprieties. There are many ASNase producing organisms, from
microorganisms to mammals [24][26][25] so it is possible that one of the enzymes might also be of
clinical use. One of the many producing organism is the yeast Saccharomyces cerevisiae. Being the
most studied yeast there are substantial information available concerning its genetics and cytology
making it a great subject for production of new ASNase. S. cerevisiae is able to do post translational
modification to proteins such as glycosylation [38]. Similarly, to E. coli, S. cerevisiae is able to produce
two distinctly different forms of ASNase: ASNase I, an internal constitutive enzyme located within the
cell, and ASNase II, an external glycoprotein enzyme in the cell wall which is secreted in response to
nitrogen starvation [39][40]. ASNase II of S. cerevisiae is a cell wall glycoprotein which has been shown
to differ significantly in several aspects from the enzyme of bacterial sources, with lower allergenic
potential that would reduce the secondary effects [41] ASNase I is coded by the ASP1 gene, while
ASNase II is coded by ASP3 gene [40]. ASNase II with 362 amino acid residues with a 38686 Da
presented higher kM, higher stability and optimum pH near the physiologic pH [42]. However, the S.
cerevisiae lower secretory capacity relative to P. pastoris and other yeasts may hider industrial
production [43].
7
2.5. Heterologous protein expression in Pichia pastoris
2.5.1. P. pastoris expression system
The first identification of a yeast capable of using methanol as a sole carbon source was in 1969 [44],
in the sequence of research for yeast that could use C1 compounds to produce single cell proteins
(SCP). In the early 1970, the interest in the production of single cell proteins (SCP) led eventually to a
strain of P. pastoris which exhibit stable fermentation characteristics and high yields of biomass and
protein [45][33]. Philips Petroleum first introduced it for commercial production of SCP as animal feed
additive based on high cell density fermentation process utilizing methanol as carbon source [46]. Since
Phillips Petroleum licensed Invitrogen™ Corporation (Carlsbad, CA) to sell components of the system
[47] P. pastoris has become widely used for heterologous proteins expression, where more than 1000
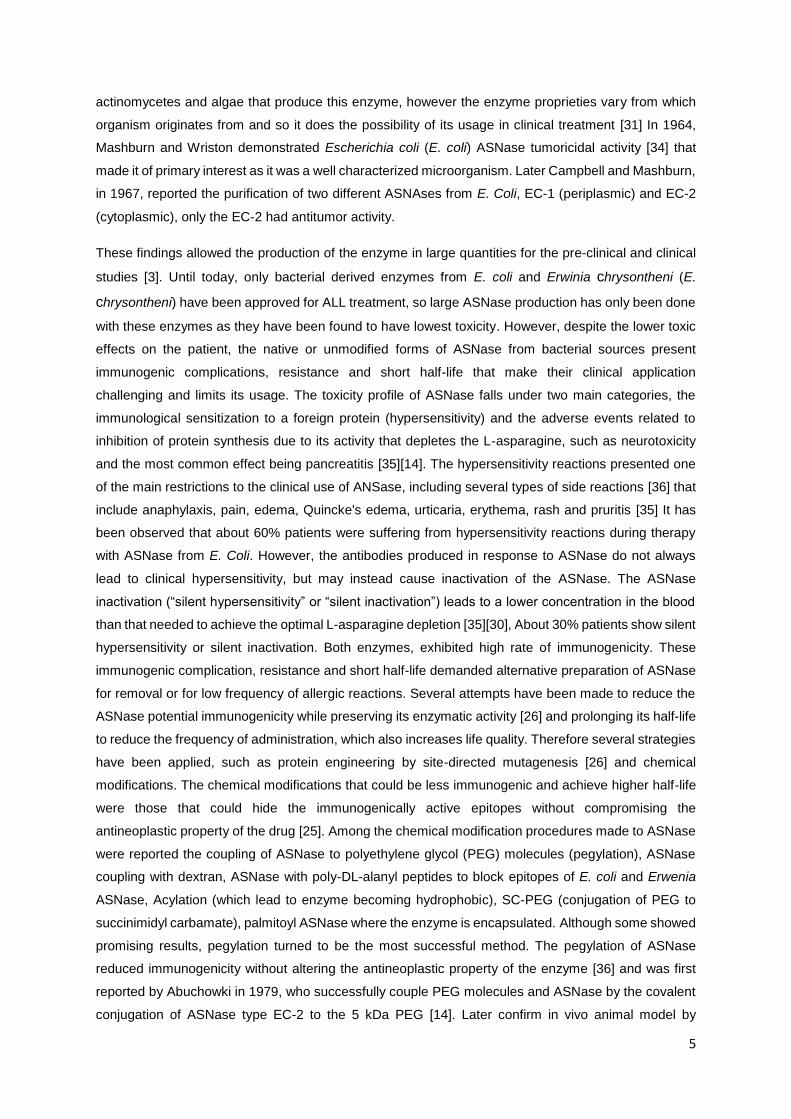
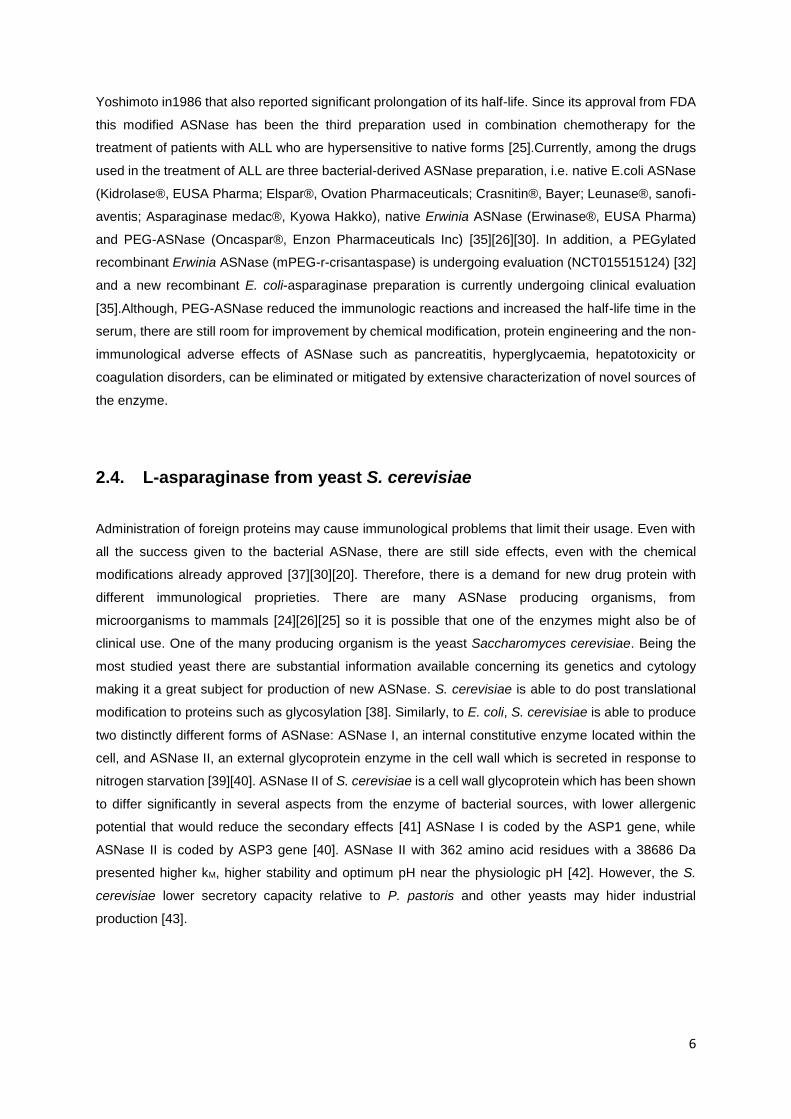
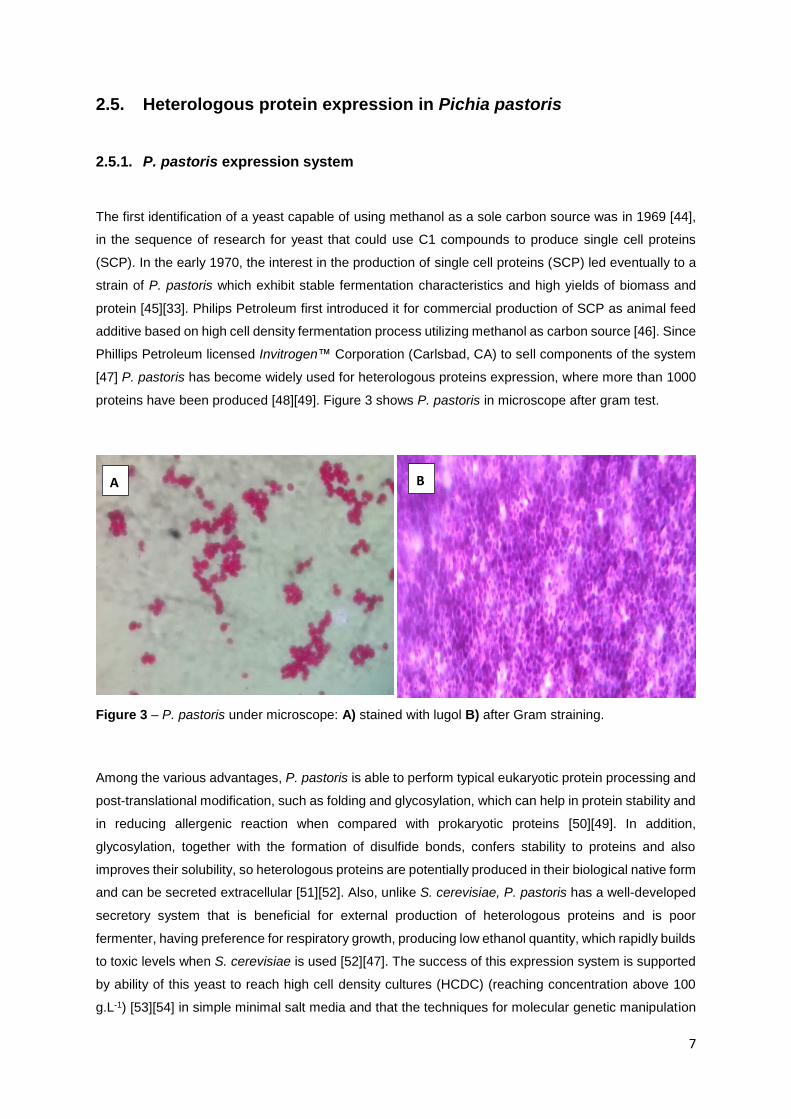
proteins have been produced [48][49]. Figure 3 shows P. pastoris in microscope after gram test.
Among the various advantages, P. pastoris is able to perform typical eukaryotic protein processing and
post-translational modification, such as folding and glycosylation, which can help in protein stability and
in reducing allergenic reaction when compared with prokaryotic proteins [50][49]. In addition,
glycosylation, together with the formation of disulfide bonds, confers stability to proteins and also
improves their solubility, so heterologous proteins are potentially produced in their biological native form
and can be secreted extracellular [51][52]. Also, unlike S. cerevisiae, P. pastoris has a well-developed
secretory system that is beneficial for external production of heterologous proteins and is poor
fermenter, having preference for respiratory growth, producing low ethanol quantity, which rapidly builds
to toxic levels when S. cerevisiae is used [52][47]. The success of this expression system is supported
by ability of this yeast to reach high cell density cultures (HCDC) (reaching concentration above 100
g.L-1) [53][54] in simple minimal salt media and that the techniques for molecular genetic manipulation
Figure 3 – P. pastoris under microscope: A) stained with lugol B) after Gram straining.
A B
8
are simple [47]. Also, it has a very strong and tightly regulated gene promoters of the methanol utilization
pathway (MUT), specially the promoter of the gene coding for alcohol oxidase 1 (AOX1) that allow for
high protein production [45][55].
2.5.2. Metabolism and AOX promoters
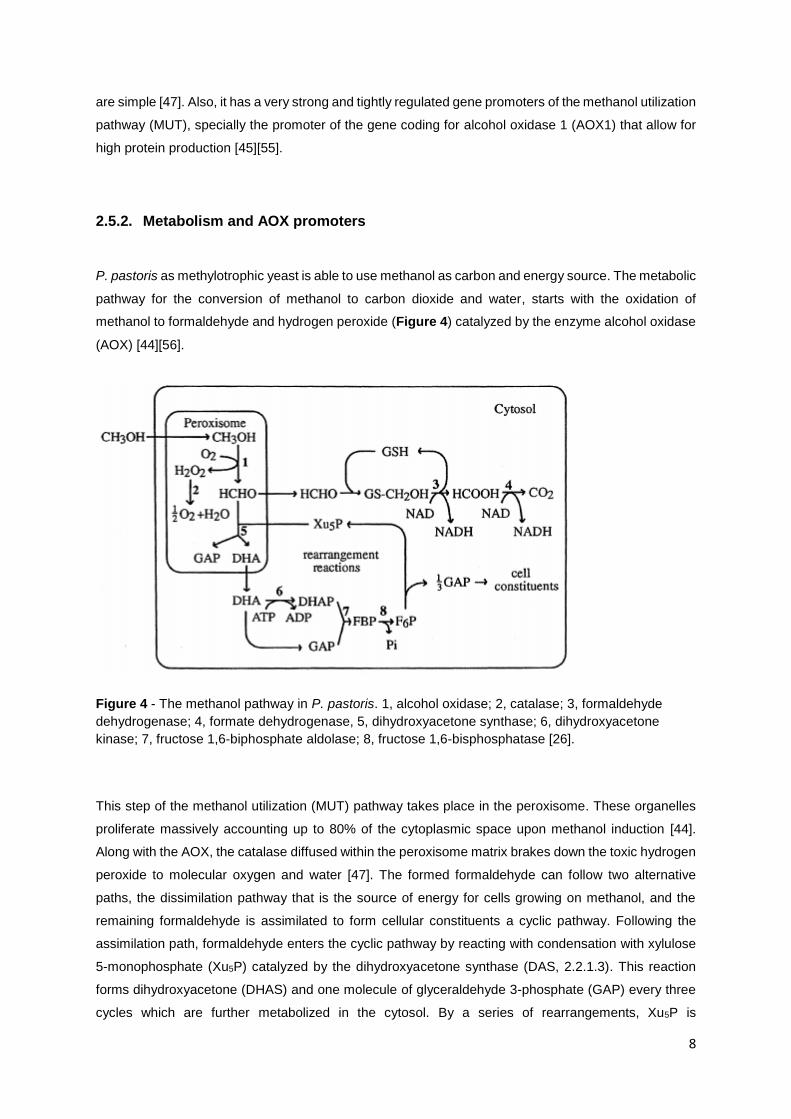
P. pastoris as methylotrophic yeast is able to use methanol as carbon and energy source. The metabolic
pathway for the conversion of methanol to carbon dioxide and water, starts with the oxidation of
methanol to formaldehyde and hydrogen peroxide (Figure 4) catalyzed by the enzyme alcohol oxidase
(AOX) [44][56].
Figure 4 - The methanol pathway in P. pastoris. 1, alcohol oxidase; 2, catalase; 3, formaldehyde
dehydrogenase; 4, formate dehydrogenase, 5, dihydroxyacetone synthase; 6, dihydroxyacetone
kinase; 7, fructose 1,6-biphosphate aldolase; 8, fructose 1,6-bisphosphatase [26].
This step of the methanol utilization (MUT) pathway takes place in the peroxisome. These organelles
proliferate massively accounting up to 80% of the cytoplasmic space upon methanol induction [44].
Along with the AOX, the catalase diffused within the peroxisome matrix brakes down the toxic hydrogen
peroxide to molecular oxygen and water [47]. The formed formaldehyde can follow two alternative
paths, the dissimilation pathway that is the source of energy for cells growing on methanol, and the
remaining formaldehyde is assimilated to form cellular constituents a cyclic pathway. Following the
assimilation path, formaldehyde enters the cyclic pathway by reacting with condensation with xylulose
5-monophosphate (Xu5P) catalyzed by the dihydroxyacetone synthase (DAS, 2.2.1.3). This reaction
forms dihydroxyacetone (DHAS) and one molecule of glyceraldehyde 3-phosphate (GAP) every three
cycles which are further metabolized in the cytosol. By a series of rearrangements, Xu5P is
9
subsequently regenerated to form the cyclic pathway. Through the dissimilation pathway, a portion of
the formaldehyde generated spontaneously react with glutathione to form S-hydroxymethylglutathione
which then is oxidized to carbon dioxide with the help of glutathione (GSH) and two NAD+ dependent
dehydrogenases (formaldehyde dehydrogenase - FLD, EC 1.2.1.1 and formate dehydrogenase - FDH
1.2.1.2). The NADH2 produced is then used for energy production [55][57][44][58].
However, methanol utilization regulation is a very complex. Methanol oxidase, the first enzyme of the
MUT pathway accounts for up 35% of the total protein in cell grown in limited amounts of methanol but
it is not detectable in cells grow in other carbon sources, such as glucose, glycerol or ethanol [56][59][57]
At the transcriptional level, the carbon source plays an important role in regulating enzyme synthesis
[60]. There is induction of the highly regulated methanol oxidase gene promoter (AOX1) by C1
compounds and catabolite repression by multi-carbon compounds, especially by glucose and ethanol
[61][62]. While ethanol metabolism is repressed only by C1 compounds in methylotrophic yeast. This
predicts that P. pastoris as a methylotrophic yeast cannot simultaneously utilize methanol and ethanol
form a mixture of both [61][44].
P. pastoris it is also able to grow on other carbon sources, such as glucose and glycerol (can even
metabolize ethanol) [63][64][65][66]. The glycerol metabolism involves a passive diffusion of glycerol
across the cell membrane, followed by phosphorylation by glycerol kinase, producing L-glycerol 3-
phosphate, which it then oxidized to dihydroxyacetone phosphate [66]. The dihydroxyacetone
phosphate is converted into glyceraldehyde 3-phosphate by the triosephosphate isomerase, which is
used in the glycolytic pathway [66][67][68].
2.5.3. Methanol utilization phenotypes (MUT+, MUTS and MUT-)
The expression of heterologous proteins in P. pastoris is driven by the action of the strong, tightly
regulated alcohol oxidase gene promoters [57][69]. The wild type P. pastoris’ genome contains two
different genes that encode for alcohol oxidase: AOX1 and AOX2 that were first isolated and clone by
Ellis et al 1985 [56]. Both gene are regulated similarly [70]. The AOX1 gene product makes up to 85%
of total alcohol oxidase activity, while the AOX2 makes up only for a minor fraction [71]. A variety of P.
pastoris expression vectors and host strains are available [57][46]. Recombinant P. pastoris methanol
utilizing strains are obtained by integrating foreign gene into one of the two AOX genes or into the HIS4
(histidinol dehydrogenase) gene by homologous recombination [72]. Depending on gene knocked out,
three distinct P. pastoris phenotypes that differ concerning their ability to utilize methanol are available
[73]. The insertion of the expression cassette into HIS4 locus produces a MUT+ (methanol utilization
plus) strain, which as both AOX genes intact is generated. The MUT+ phenotype characteristics are
indistinguishable from the wild type P. pastoris, presenting similar growth to the wild strain when grown
with methanol as sole carbon source [74][68]. Like the wild strains, the MUT+ strains are sensitive to
transient high residual methanol concentration, where sudden changes in methanol levels often result
10
in loss of AOX activity and even cell death [71]. In addition, a significant amount of alcohol oxidase is
produced with this strain, which may compete with the target protein [71]. When the expression cassette
is inserted within the AOX1 locus, a MUTs (methanol utilization slow) strain is obtained, such as KM71
(arg4 his4 aox1Δ::ARG6) where AOX1 has been partially deleted and replaced with S. cerevisiae ARG4
gene, [67] Since this strain relies only on the weaker promoter AOX2 for methanol metabolism, which
yields 10-20 times less AOX activity than the AOX1 gene, it has a slower grow rate than the wild P.
pastoris [60][38]. Although MUT+ have higher growth rates that result in higher productivity, the MUTs
strains are not as sensitive to residual methanol in the culture medium making then easier the scale up
[75]. Alternatively, when both AOX 1and AOX 2 genes are disrupted, MUT- (methanol utilization
negative) strain is generated. This third strain, as a result of having both AOX genes disrupted, cannot
utilize methanol as its sole carbon source, which only acts as inducing agent for recombinant protein
production [71][76]. Through this strain cannot grow on methanol, it requires the use of an alternative
carbon source, such as glycerol, to support growth and recombinant protein production [45]. This study
is based on the MUTs phenotype
2.5.4. Pichia pastoris high cell concentration fermentation
2.5.4.1. Fermentation media
A hallmark of P. pastoris system is the ease to scale up from shake-flask to large volume without the
loss of specific productivity. Unlike other widely used expression systems such as E. coli and S.
cerevisiae, P. pastoris is able to grow to very high cell density (above 100 g.L-1) on simple, inexpensive
and chemically defined media without animal derived growth factors or other troublesome media
components [77]. The most broadly used fermentation growth media for P. pastoris consists of basal
salts (basal salt medium – BSM) described in “Pichia fermentation process guidelines” from Invitrogen™
corporation [54] supplemented with basal salt solution (Pichia trace medium - PTM1). Although this
standard medium is widely used [78][79][80][81][77], it presents some problems, namely unbalanced
composition, salt precipitation and undesirable ionic strength [82][83][84][73]. In this regard, various
modification and alternative medium have been reported, such the proposed by d’Anjou [69], the FM22
medium formulated by Stratton [75] or the medium composition obtain through response surface
methodology by Ghosalkar [84]. All of these culture media were developed for high cell density cultures.
One the most important points in formulation is the nitrogen source. While in BSM and FM22 this
element is added by ammonium hydroxide when controlling pH, in d’Anjou medium formulation was all
add in the initial formulation with ammonium sulfate and not supplied during culture [69][54][75].
However, Cos and coworkers estimated that nitrogen starvation starts around 50g.L-1, when d’Anjou
medium formulation is used [73]. Also, several of the metals required for cell growth react with
orthophosphate (added as H3PO4 in BSM medium and KH2PO4 in FM22 and d’Anjou’s medium) to form
metallophosphates that have very low solubility [85][68]. The BSM will show some cloudiness when the
pH goes above 5.0, due to salt precipitation and obvious precipitates appear when the pH is around 6.0
11
or higher, although the optimal fermentation pH of most recombinant protein fermentation varies
between 5.5 and 7.0 [83][68]. Precipitation formation can have adverse effects on fermentation process
such as enhance cell disruption and unbalanced nutrient supply or even nutrient starvation. Curless
and colleagues [85] proposed the use of polyphosphate glass (sodium hexametaphosphate, sodium
polyphosphate, glassy) as phosphate source, that is more soluble that any other organic phosphate
source, do not form metallophosphate precipitates when mixed with other nutrients in proportions found
in fermentation media. A 40% increase in cell density was obtained when compared with the same
medium without orthophosphate. Other phosphorus source proposed by Zhang et al 2006 [83] to avoid
phosphate precipitation was by using sodium glycerophosphate that does not result in precipitation up
pH 10.5.
2.5.4.2. Operational strategies
The cultivation of recombinant P. pastoris expressing a product under the control of the AOX promoter
is usually grown in multi-stage process to achieve high cell density [83][50] using three phases
[86][60][47][38][54], or in some case four phases [87][88][69][80] that compose the two major stages:
the growth and the induction [67][89]. In the growth stage, a large cell mass is generated using glycerol
as carbon source as P. pastoris grows significantly faster in this substrate than in methanol [90] and it
is divided in two phases: glycerol batch phase (GBP), glycerol fed-batch phase (GFP). While during the
second stage, production of the recombinant protein takes place using a methanol fed-batch phase
(MFP) and some cases is added a transition phase (TP) [90]. During fed-batch culture, it is essential to
design a feeding strategy to prevent over feeding or underfeeding of substrate to culture.
The excess glycerol, in the batch phase, allows a rapid production of biomass [60]. Upon depletion of
glycerol, the second phase (GFP) is initiated, where glycerol is fed at growth limiting rates for further
cell growth until desired cell concentration, minimizing by-product formation (e.g. ethanol) and
maximizing biomass yield, followed by exhaustion. Further, the absence of glycerol excess allows the
derepressing the methanol metabolic pathway and smoothly transition from glycerol to methanol growth
[63][68][74]. After the desired high cell density is achieved, the carbon source is changed, for AOX1
promoter induction and heterologous protein production, by methanol feed (MFP). In this phase, the
methanol feeding and control strategy in bioreactor differ for each MUT phenotypes due to their different
methanol assimilation ability, and it greatly influences heterologous protein production, specific growth
rate and residual methanol concentration [91][68]. In some cases, an additional optional phase for
transition between glycerol and methanol feed to allow the P. pastoris cell to better adapt to methanol
metabolism shortening the time for cells to fully adapt to methanol [88]. In this phase a co-feeding of
methanol and other carbon source or a short starvation period after glycerol feed for total glycerol and
ethanol total depletion are used [87][88][69][44][80].
Conventional protocols describe feed profiles for recombinant protein production [54][75] but they are
not optimized and the suitable protocol for a particular strain depends on the strain specific maximum
12
specific growth rate in methanol [90]. During fed-batch culture, it is essential to design a feeding strategy
to prevent over feeding or underfeeding of substrate to culture and maintain optimum substrate
condition.
2.5.4.3. Glycerol Batch and fed-batch phases
The objective of the two first phases is to obtain a high level of biomass prior to protein production in
the minimum time possible and are used the same strategies for all three phenotypes of strains MUT+,
MUTs and MUT- since their growth on glycerol is similar. Through the first glycerol phase, the excess of
glycerol highly represses the AOX promoter. The increase in initial glycerol concentration for rapid
biomass growth has its limitation due to problems of growth inhibition [73][67] and ethanol accumulation
[67]. For that reason, the use of a second glycerol phase performed under glycerol-limiting condition
enable the generation of even higher cell concentrations with specific growth rate up to 0.26 h-1 and
biomass yield of 0.7 g.gglycerol-1 [68][92]. Brierley recommend a maximum glycerol concentration of 6%.
After the initial glycerol consumption there is easily identifiable sharp increase in dissolve oxygen (DO)
that is the most common parameter used to decide when the glycerol limited feed is initiated
[93][77][73][79].
Limited feed benefits AOX derepression by facilitating the consumption of secondary metabolites that
accumulate during the batch phase, such as acetate and ethanol [64] that are AOX inhibitors [87]. To
avoid AOX repression and at the same time decrease the time duration of this stage the glycerol
concentration must be carefully controlled [81]. Some authors use a simpler constant glycerol feeding
rate or an initial step like increase in glycerol feed until the pretended constant feed rate is achieved
[54][80][81] while other selected an exponential feed rate [69][70][74][94][95] in the GFP to get a growth-
limited glycerol concentration [73].
2.5.4.4. Methanol fed-batch strategies
The induction strategy has a great impact in the overall process productivity, requiring tight control of
methanol feed rate and concentration in the reactor. For instance, the widely “Pichia fermentation
Process Guideline’ from Invitrogen™ (San Diego, CA) suggests two different empirical methanol
feeding strategies: the DO spike method and the use of preprogramed linear feed rates designed to
maintain low methanol level in the broth [54][96]. However, unlike the GFP, the methanol feed that
dictates the specific growth rate depends on differ assimilation capacity of each strain and the selection
of feed strategy with its own specific parameters must be individually optimized for each heterologous
protein. MUT+ and MUT- can use methanol as sole carbon and energy during protein production
[90][68][45][38].
13
Monetarizing and controlling the methanol is particularly important in the induction phase because high
levels of the methanol are toxic to P. pastoris, but too low methanol concentrations may not be enough
to initiate the AOX transcription [51][68][47]. Therefore, methanol concentration, which dictates the
specific growth rate in the MFP is a crucial parameter for maximizing heterologous protein production,
as it acts at the same time as carbon source and inducer[73] [68][87]. Also, methanol metabolism
utilizes oxygen at a high rate, and expression of heterologous genes is negatively affected by oxygen
limitation [47].
To maximize product yield, different control schemes often based on the most critical aspects in the
induction phase that count between then, oxygen and methanol concentration as the most common.
Methanol levels in the bioreactor must be fully controlled in order to avoid its accumulation to toxic
levels. The main strategies are: a) Constant methanol concentration feed; b) Constant dissolved oxygen
based feeding (DO-stat); c) Constant growth-rate feeding (µ-stat).
2.5.4.4.1. Constant methanol concentration control
Methanol concentration of P. pastoris culture broth is detrimental in protein productivity and an important
parameter to control. Accurate regulation of methanol concentration while preventing accumulation of
methanol to toxic levels [91][97]. The maintenance of constant methanol concentration during the
induction phase has positive effects on the production of foreign protein [91][96][97].
Depending on the methanol set point concentration different specific growth, consumption and
production rates are obtain, which makes the implementation of a robust control needed [98].
Methods for monitoring methanol can be problematic. For example, the most common methods for
measuring methanol in offline mode use a biochemistry analyzer by means of enzymatic reactions of
alcohol oxidase or are based on chromatographic methods (GC and HPLC) that can be problematic by
needing processing of the sample before measurement and is usually located some distance from the
bioreactor. These methods are time consuming and are expensive, as well running the risk of allowing
the methanol evaporate before the concentration can be determined [73][51]. So to have an accurate
measurement of methanol in the bioreactor any given time the use of on-line is needed and in on-line
mode are based on liquid gas equilibrium [91][99][100][101].
The simplest closed loop strategy for is the on-off control mode has been report to present satisfactory
results [73][79]. However, the metrology own nature of turning the methanol feed on and off to maintain
a certain concentration around the set-point result in methanol flotation in the fermentation broth, which
makes it inadequate for precise methanol control [73].
Other methanol concentration strategies have been proposed, whether using PI (proportional-integral)
or PID (proportional-integral-derivative) control with Bode stabilization criterion that obtained good
results on methanol regulation in short time fermentations or using algorithms to increase the methanol
14
concentration control [68][91][102][98][103]. Also, Model based on-line parameters estimation and on-
line optimization algorithms have been developed to determine optimal inducer feeding rates[101].
2.5.4.4.2. µ-stat control
The specific growth rate (µ) is a critical parameter in optimization of product formation [73][89] and is
one of the most important factors for maximizing recombinant protein production, since product
formation is directly (intra cellular) or indirectly (extra cellular production) associated with cell growth as
methanol is both the inducer and the carbon source [68][102]. Maintaining a constant µ enhances
process reproducibility that is crucial for industrial processes and facilitates study of growth rate related
effects on recombinant protein production [101].
When on-line methanol concentration monitoring is not available or methanol concentration is below
the sensor’s detection limit this control method presents a pre-determined methanol feeding rate
calculated from mass balance equation to maintain a constant µ under methanol limiting conditions that
simple to implement [68][98][101].
Zhang and colleagues were the first to propose a model describing the relationship between specific
growth rate and methanol concentration, and successfully develop a rational feeding strategy to deliver
a constant desired µ for limited growth that could be optimized to maximize protein production. The
model was build using a µmax of 0.08 h-1 at a methanol concentration of 3.65 g.L-1, while the actual µmax
was 0.0709 h-1 [68][73]. Later Jahic developed a kinetic model that could predict biomass growth and
oxygen consumption in process with and without oxygen enricher air [70] and d’Anjou a simple accurate
model capable of predicating cell growth and methanol utilization during the mixed substrate fed-batch
fermentation of MUTs [69], [103]. Other authors have similar approaches, based on growth models
without any methanol on line information about the system [94][95][98].
However, to implement pre-programed feed rate strategy, biomass concentration, volume and
maximum specific growth rate at the beginning of the methanol feed is needed and is assumed that
biomass/substrate yield is maintained along the induction phase [101]. Regardless of the control
parameter chosen to set the feeding profiles, strain specific parameter should be determined. This could
be done using continuous fermentation or multiple fed-batch fermentation, which is very time
consuming. Dietzsch et al 2011 developed a fast approach to determine the fed batch feed profile for
recombinant P. pastoris based on fast easy-to-do batch cultivations with repeated methanol pulses to
obtain the minimal set of relevant parameters: the adaptation time of the culture to methanol; the specific
substrate up take rate during the adaptation phase and the maximum specific substrate uptake rate
[104][105].
To improve this methodology, the bioreactor was coupled with methanol sensor to ensure constant µ is
used. Sinha et al 2003 applied a combination of feedforward control based on mass balance equations
15
obtain substrate-feed equation and feedback control with a PI controller. An optimal value of 0.025 h−1
for specific growth rate (µ) was reported. The recombinant protein production can be performed at an
optimal yield by directly controlling the methanol feed rate by a computer-controlled model [106]. Later
Ren et al 2005 focused on the model-based set point control of the specific growth rate during methanol
growth by regulation of methanol feeding rate that allowed to maintain µ.with reasonable accuracy by
the combination of linear and exponential feeding profiles [107]. To avoid methanol accumulation in the
bioreactor, the specific growth rate (μ) is maintained at a set value lower than μmax. [102][87].
2.5.4.4.3. DO stat Control
The dissolved oxygen concentration (DO) in the broth is a crucial parameter for heterologous protein
production in high cell density cultures of P. pastoris as it utilizes methanol as carbon and energy source
through the oxidative pathway only when oxygen is non-limiting. In the MFP, methanol is simultaneously
used as carbon source and as an inducer for heterologous protein production [61][55]. The change in
DO concentration delivers information on available carbon sources in fermentation broth [108].
Methanol metabolism has high oxygen demands and cultures can readily become oxygen-limited [109],
which can hinder cell growth under methanol feed and protein production [47].
To avoid negative effects due to the lack of oxygen, the DO-stat control strategy directly correlates the
methanol feeding with the DO in the broth by maintain a set point value of DO [73]. Whenever DO
increases above the set point, the methanol feeding rate is started or increased [96]. On the contrary,
if DO drops below the set point the feed is cut or slowed down [109].
Bushel reported that protein production below 15 % as negligible [109]. Because of high demand of
oxygen by P. pastoris, DO is usually to be kept above 20% to ensure no oxygen limitation [74][110].
In order to improve DO stat methods, different feedback control strategies where the methanol feeding
rate is adjusted using a control algorithm that attempts to control DO concentration in the reactor have
been developed [73]. Chung et al 2000 designed a proportional-integral (PI) feedback controller based
on the Bode stability criterion [68][73]. Oliveira employed an adaptive DO control to maximize the total
amount of carbon source material fed to the process obeying the maximum oxygen transfer rate
constraint [111].
Although different DO-stat have been developed [68][109] [110], it can’t distinguish between the
increase in DO due methanol depletion or due inhibitory effect of methanol accumulation, which would
be aggravated with the DO-controller response to increase methanol feeding. This could be problematic
in the begging of the induction when the AOX1 is not yet strongly induced and the culture is still adapting
to the new carbon source, making the methanol metabolism slow with low oxygen consumption that
result in DO levels not reflecting the actual methanol accumulated in the broth [101]. Also, variation in
methanol concentration will affect the protein production and the methanol consumption [96].
16
3. Materials and Methods
3.1. Equipment
- Bioreactor New Brunswick Bioflo® 115
- Orbital shaker incubator Brunswick Scientific shaker incubator, Excella® E24 incubator shaker
series
- Thermoshaker Fisher®
- MOC63u unibloc Moisture Analyzer, Shimadzu®
- Centrifuge 5810R, Eppendorf®
- Centrifuge 5418, Eppendorf®
- Spectrometer spectramax® plus 384, molecular devices
- ÄKTA purifier®
- Automatic fraction collector, FRAC 920
- Ultrasonic cleaner, Thornton
3.2. Pichia pastoris expression system
The research seed bank used during this work was prepared from a single cell isolate of P. pastoris
muts strain KM71 (arg4 his4 aox1Δ::ARG6), (InvitrogenTM) constructed with vector pPIC9K
(InvitrogenTM) under the control of the AOX1 promoter for ASP3 gene for expression of L-asparaginase
II from Saccharomyces cerevisiae.
3.3. Culture medium formulation
Yeast Peptone Dextrose (YPD) medium: Dextrose 20 g.L-1, Peptone 20 g.L-1, Yeast extract 10 g.L-1,
agar 20 g.L-1
Buffered glycerol complex medium (BGMY): Yeast extract 10 g.L-1, 20 g.L-1 peptone, 100 mM
potassium phosphate (pH 6.0), yeast nitrogen base (YNB) medium 3.4 g.L-1, (NH₄)₂SO₄ 10 g.L-1 and
biotin 4 mg.L-1,glycerol 10 g.L-1with and without supplementation (casein 5 g.L-1 or corn steep powder
5 g.L-1);
Buffered methanol complex medium (BMMY): identical to BGMY except for the 30 mL.L-1 methanol
instead of 10 g.L-1.
17
Basal salt medium (BSM): Basal salt medium (BSM) 85% H3PO4 26.7 mL.L-1, CaSO4 0.93 g.L-1,
K2SO4 18.2 g.L-1, MgSO4•7H2O 14.9 g.L-1, KOH 4.13 g.L-1, Pichia trace medium (PTM) 4.35 mL.L-1 at
pH 5.0 adjusted with 25% NH4OH.
Basal salt medium modified (BSMm): 85% H3PO4 26.7 mL.L-1, CaSO4 0.93 g.L-1, K2SO4 18.2 g.L-1, ,
MgSO4•7H2O 14.9 g.L-1, KOH 4.13 g.L-1, (NH4)2SO4, 13-20 g.L-1, Pichia trace medium (PTM1) modified
4.35 mL.L-1. Initial pH 5.0 adjusted 10 M NaOH.
Salt Fermentation Medium (SFM): KH2PO4 12 g.L-1, MgSO4•7H2O 4.7 g.L-1, CaCl2•2H2O 0.36 g.L-1,
(NH4)2SO4, 13-20 g.L-1, PTM1 4,35 ml.L-1. Initial pH 5.0 was adjusted with 10 M NaOH.
Pichia trace medium (PTM): CuSO4•5H2O 6.0 g.L-1, KI 0,088 g.L-1, MnSO4•H2O 3.0 g.L-1,
Na2MoO4•2H2O 0.2 g.L-1, H3BO3 0.02 g.L-1, CoCl2 0.5 g.L-1, ZnCl2 20.0 g.L-1, FeSO4•7H2O 65.0 g.L-1,
Biotin 0.2 g.L-1, concentrated H2SO4 5.0 ml.L-1.
3.4. Pichia pastoris cell bank – Cell line preservation and revival
To ensure consistency of the properties and homogeneity of the P. pastoris cell culture, the colonies
were replica plated each 3 month in YPD solid medium and incubated for 24h at 30 °C. The colonies
from the Petri dish were used to inoculate a 500 mL Erlenmeyer baffled flask (100 mL of BGMY liquid
medium per flask) in Brunswick Scientific shaker incubator (Excella® E24 incubator shaker series), at
30 °C and 250 rpm for 24h and optical density above 30. After the period of incubation, the cells were
stored at -80 °C in BGMY with glycerol (20% v/v) in 1.5 mL Eppendorfs (1 mL each Eppendorf) to
maintain the frozen cell stock.
The strain revival was done by inoculation with 500-1000 µL of the unfrozen cell suspension in a 250
mL Erlenmeyer baffled flask (50 mL of BGMY growth medium), at 30 °C and 250 rpm in shaker incubator
for 24h.
3.5. Pichia pastoris Cultivation in Erlenmeyer flask
Pichia pastoris (KM71, MUTs) cultures were homogeneous from a previously prepared pre-inoculum
were the frozen suspension was revived. The inoculation was carried out with 1 g.L-1 of initial cell
concentration in the different. Were tested in BGMY (glycerol 10 g.L-1) with or without casein or corn
step powder, BSM medium (glycerol 10; 40 g.L-1), BSM medium modified (40 g.L-1 glycerol) to keep
carbon to nitrogen relation of Pichia pastoris strain (6.55 Cmol: 1 Nmol) by adjusting (NH₄)₂SO₄ added
(13 g.L-1) and SFM (glycerol 40 g.L-1) with same carbon to nitrogen ratio. The incubation in Erlenmeyer
flask of 250 mL (50 mL per flask) was at 30 °C and 250 rpm in shaker incubator until glycerol depletion.
18
The cell culture (50 mL) were centrifuged in a 50 mL Falcon tube at 3320 xg and 4 °C for 10 minutes
and resuspended in 250 mL Erlenmeyer baffled flask (50 mL). The induction phase was carried on the
same medium used in the growth phase respectively per flask) and the induction of ASNase production
was carried by addition of methanol pulses (30 mL/L) every 24 hours for 48 hours at 20 °C and 250 rpm
in shaker incubator.
Figure 5 - Diagram describing the methodology used for the experiment in Erlenmeyer, divided in three
stages: A) Cell line revival: the unfrozen cells were grown for 22 to 24 h at 250 rpm, 30°C, after which
was transferred to Falcon tubes and centrifuged to recover the cells for the inoculation; B) Growth
phase: the BSM medium, BSM modified medium or SFM medium inoculated with ~1 gdcw.L-1 and put
in incubator shaker at 250 rpm, 30°C, pHinitial 5.0 for a period of 24h, after which the full volume of liquid
in the Erlenmeyer was transferred to Falcon tubes and centrifuged to recover the cells for the
resuspension in fresh medium without glycerol ; C) Induction Phase: ASNase production was induced
every 24h using methanol pulses, 30 mL.L-1, in the same medium used during the growth phase in
shaker incubator at 250 rpm, 20°C, pHinitial 5.0 for a period of 48h.
3.6. Pichia pastoris cultivation in bioreactor
3.6.1. kLa experiments
The Pichia pastoris (KM71, MUTs) cultures grown in batch using the BSM modified, with 40 g.L-1 glycerol
as the sole carbon source and 13 g.L-1 (NH₄)₂SO₄ as nitrogen source. The inoculation was carried out
so that the cell concentration was approximately 1 g.L-1. The P. pastoris were cultivated 3 L bioreactor,
(2 L working volume) at 30 °C during cell growth phase and pH was controlled at 5.0 with 10 M NaOH.
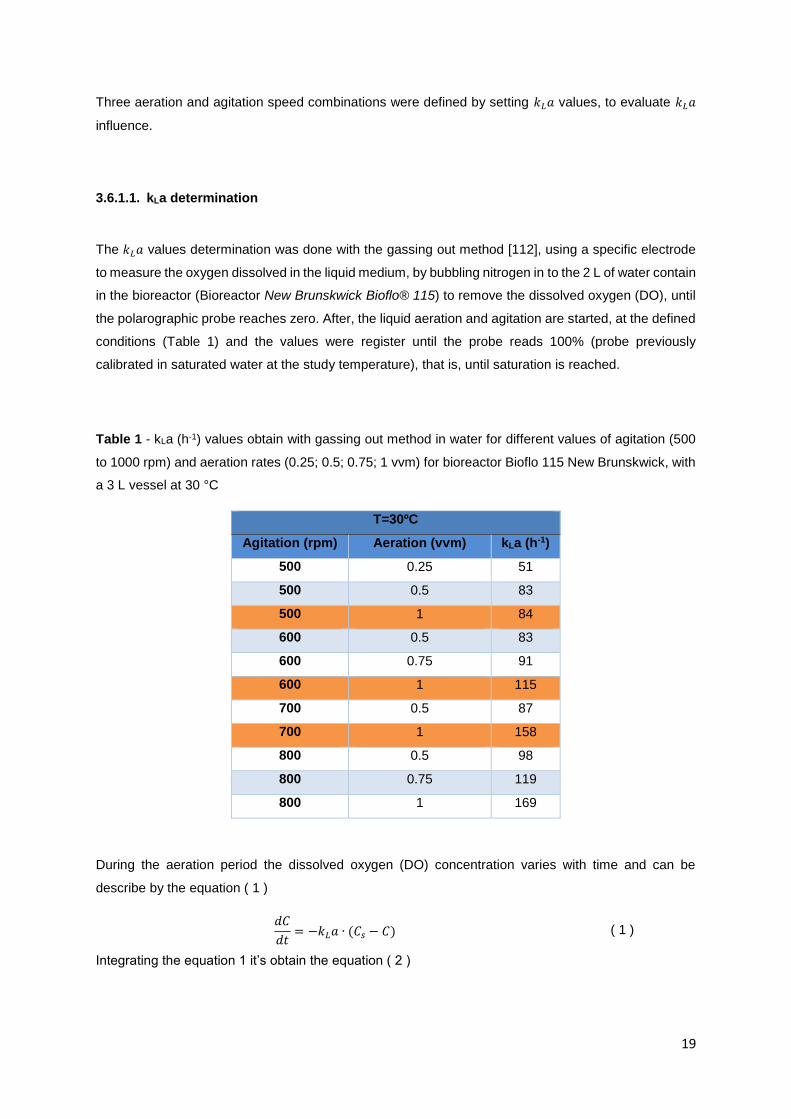
19
Three aeration and agitation speed combinations were defined by setting 𝑘𝐿𝑎 values, to evaluate 𝑘𝐿𝑎
influence.
3.6.1.1. kLa determination
The 𝑘𝐿𝑎 values determination was done with the gassing out method [112], using a specific electrode
to measure the oxygen dissolved in the liquid medium, by bubbling nitrogen in to the 2 L of water contain
in the bioreactor (Bioreactor New Brunskwick Bioflo® 115) to remove the dissolved oxygen (DO), until
the polarographic probe reaches zero. After, the liquid aeration and agitation are started, at the defined
conditions (Table 1) and the values were register until the probe reads 100% (probe previously
calibrated in saturated water at the study temperature), that is, until saturation is reached.
Table 1 - kLa (h-1) values obtain with gassing out method in water for different values of agitation (500
to 1000 rpm) and aeration rates (0.25; 0.5; 0.75; 1 vvm) for bioreactor Bioflo 115 New Brunskwick, with
a 3 L vessel at 30 °C
T=30ºC
Agitation (rpm) Aeration (vvm) kLa (h-1)
500 0.25 51
500 0.5 83
500 1 84
600 0.5 83
600 0.75 91
600 1 115
700 0.5 87
700 1 158
800 0.5 98
800 0.75 119
800 1 169
During the aeration period the dissolved oxygen (DO) concentration varies with time and can be
describe by the equation ( 1 )
Integrating the equation 1 it’s obtain the equation ( 2 )
𝑑𝐶
𝑑𝑡= −𝑘𝐿𝑎 ∙ (𝐶𝑠 − 𝐶) ( 1 )
20
𝐿𝑛 (1 −𝐶
𝐶𝑠) = −𝑘𝐿𝑎 ( 2 )
Where 𝐶𝑠 is DO saturation concentration (mg.L-1), 𝐶 is DO (mg.L-1) and e 𝑘𝐿𝑎 the volumetric oxygen
mass transfer coefficient (h-1).
Plotting 𝐿𝑛 (1 −𝐶
𝐶𝑠) against time (h-1) for the different aeration rates and agitation conditions was
determined 𝑘𝐿𝑎 on water at 30 °C on Table 1.
To evaluate influence of 𝑘𝐿𝑎 in cell growth and ethanol production, three different 𝑘𝐿𝑎 were chosen
(highlighted on Table 1): i) 84 h-1, which was already used in previous study with BMY medium (data
not publish); ii) 115 h-1, a value that allows a variation of more than 30% (so the method associated
errors don’t overlap) and is close to the 𝑘𝐿𝑎 of 100 h-1 that was reported to reduce ethanol production
during batch phase [113]; iii) 158 h-1, was chosen to ensure 𝑘𝐿𝑎 variation 30% higher on the 115 h-1
value and it was decided to use it instead of the 𝑘𝐿𝑎 169 h-1 to have lower agitation and power
consumption.
3.6.2. Two stages fermentation – high cell density fermentation with P.pastoris
recombinant
To achieve higher cell concentration (above 50 g.L-1) before inducing the L-asparaginase production
the P. pastoris was grown in batch at 30 °C, using 𝑘𝐿𝑎 determined in item 1.6.1 and the pH was
controlled at 5.0 with NaOH 10M. After glycerol depletion occurs, it was initiated the glycerol feed at 20
h of fermentation. Two different feeding were used, with glycerol solution 50 % (w/v), PTM1 solution 15
mLPTM1.Lglycerolsolution-1 and ammonium sulfate mass flow of 0.325 𝑔(𝑁𝐻4)2𝑆𝑂4
. 𝑔𝑔𝑙𝑦𝑐𝑒𝑟𝑜𝑙−1 for 12h.
3.6.3. Three stages fermentation – Induction experiments of L-asparaginase
production
After 12 h the glycerol fed-batch and achieving a desired high cell density (above 50 gdcw.L-1), it was
performed 1-2 h starvation period to ensure no glycerol and neither ethanol were present in the medium
before induction and 10 g.L-1 (NH₄)₂SO₄ were supplemented. The methanol fed-batch phase used
methanol 100% with PTM1 solution (15 mLPTM1.Lmethanol-1) to induce the protein production [54][69][80],
with different feeding strategies (pulses 0.5 to 3 % (v/v) by dissolved oxygen spikes and continuous
feeding 2.4-3.5 mL.L-1.h-1). Although P. pastoris is able to grow at pH values ranging from 3.0 to 7.0
with a minimal effect on its growth rate, S. cerevisiae L-asparaginase II (ASNase) optimum pH is 7.0
and the periplasmic enzyme activity is affect by the pH of the medium, being fully inactivated at pH
values below 3.2. In accordance to with previous reports [37][80], the highest levels of ASNase II
produced by S. cerevisiae was at pH 6.0-7.0. To avoid negative effect of low pH in ASNase activity
21
produced was chosen to work at pH 6.0 during the induction phase with methanol [80]. During methanol
fed batch phase the temperature was reduced for recombinant protein production and in accordance
with previous reports [114] and data from our laboratory it was found that a temperature of 20◦C was
optimum for ASNase production in the recombinant P. pastoris.
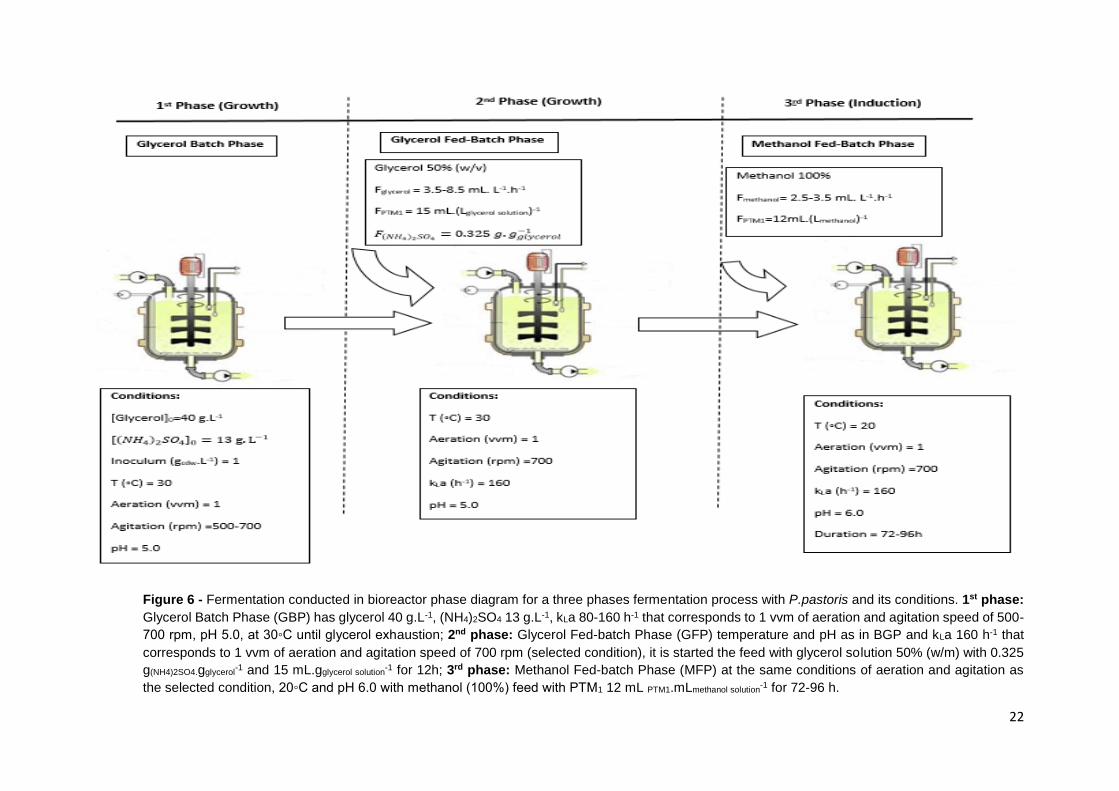
22
Figure 6 - Fermentation conducted in bioreactor phase diagram for a three phases fermentation process with P.pastoris and its conditions. 1st phase:
Glycerol Batch Phase (GBP) has glycerol 40 g.L-1, (NH4)2SO4 13 g.L-1, kLa 80-160 h-1 that corresponds to 1 vvm of aeration and agitation speed of 500-
700 rpm, pH 5.0, at 30◦C until glycerol exhaustion; 2nd phase: Glycerol Fed-batch Phase (GFP) temperature and pH as in BGP and kLa 160 h-1 that
corresponds to 1 vvm of aeration and agitation speed of 700 rpm (selected condition), it is started the feed with glycerol solution 50% (w/m) with 0.325
g(NH4)2SO4.gglycerol-1 and 15 mL.gglycerol solution
-1 for 12h; 3rd phase: Methanol Fed-batch Phase (MFP) at the same conditions of aeration and agitation as
the selected condition, 20◦C and pH 6.0 with methanol (100%) feed with PTM1 12 mL PTM1.mLmethanol solution-1 for 72-96 h.
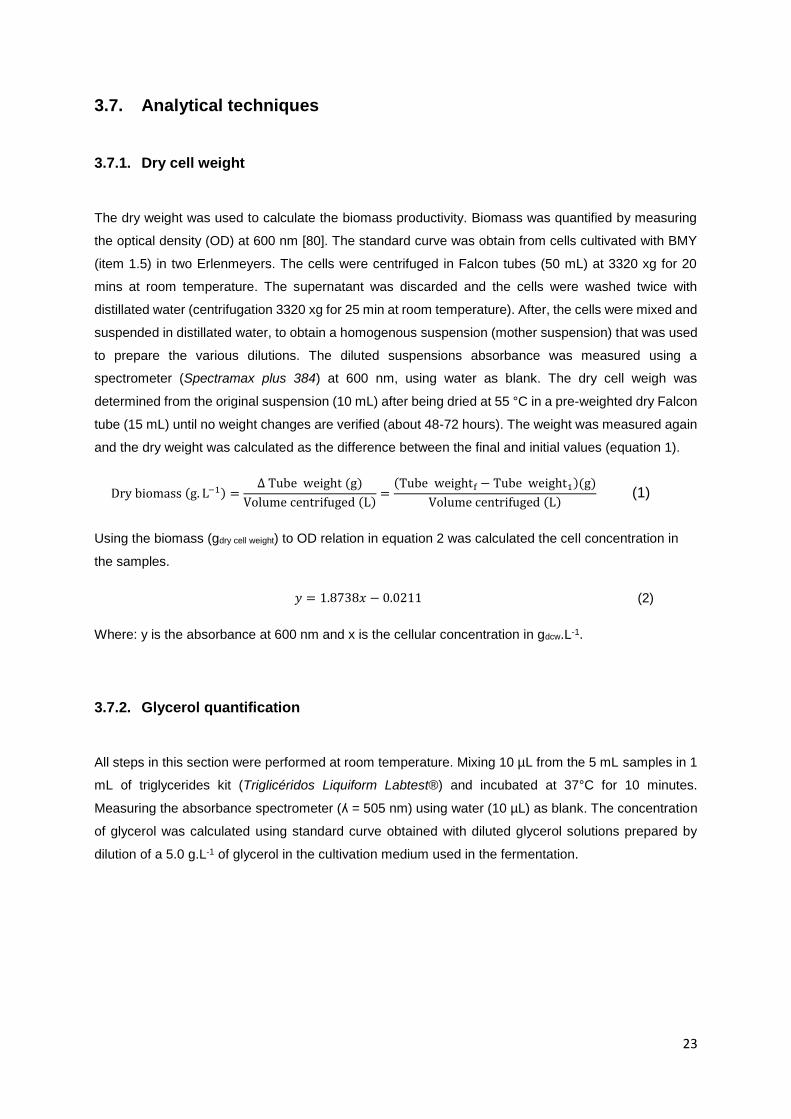
23
3.7. Analytical techniques
3.7.1. Dry cell weight
The dry weight was used to calculate the biomass productivity. Biomass was quantified by measuring
the optical density (OD) at 600 nm [80]. The standard curve was obtain from cells cultivated with BMY
(item 1.5) in two Erlenmeyers. The cells were centrifuged in Falcon tubes (50 mL) at 3320 xg for 20
mins at room temperature. The supernatant was discarded and the cells were washed twice with
distillated water (centrifugation 3320 xg for 25 min at room temperature). After, the cells were mixed and
suspended in distillated water, to obtain a homogenous suspension (mother suspension) that was used
to prepare the various dilutions. The diluted suspensions absorbance was measured using a
spectrometer (Spectramax plus 384) at 600 nm, using water as blank. The dry cell weigh was
determined from the original suspension (10 mL) after being dried at 55 °C in a pre-weighted dry Falcon
tube (15 mL) until no weight changes are verified (about 48-72 hours). The weight was measured again
and the dry weight was calculated as the difference between the final and initial values (equation 1).
Dry biomass (g. L−1) =∆ Tube weight (g)
Volume centrifuged (L)=
(Tube weightf − Tube weight1)(g)
Volume centrifuged (L) (1)
Using the biomass (gdry cell weight) to OD relation in equation 2 was calculated the cell concentration in
the samples.
𝑦 = 1.8738𝑥 − 0.0211 (2)
Where: y is the absorbance at 600 nm and x is the cellular concentration in gdcw.L-1.
3.7.2. Glycerol quantification
All steps in this section were performed at room temperature. Mixing 10 µL from the 5 mL samples in 1
mL of triglycerides kit (Triglicéridos Liquiform Labtest®) and incubated at 37°C for 10 minutes.
Measuring the absorbance spectrometer (ʎ = 505 nm) using water (10 µL) as blank. The concentration
of glycerol was calculated using standard curve obtained with diluted glycerol solutions prepared by
dilution of a 5.0 g.L-1 of glycerol in the cultivation medium used in the fermentation.
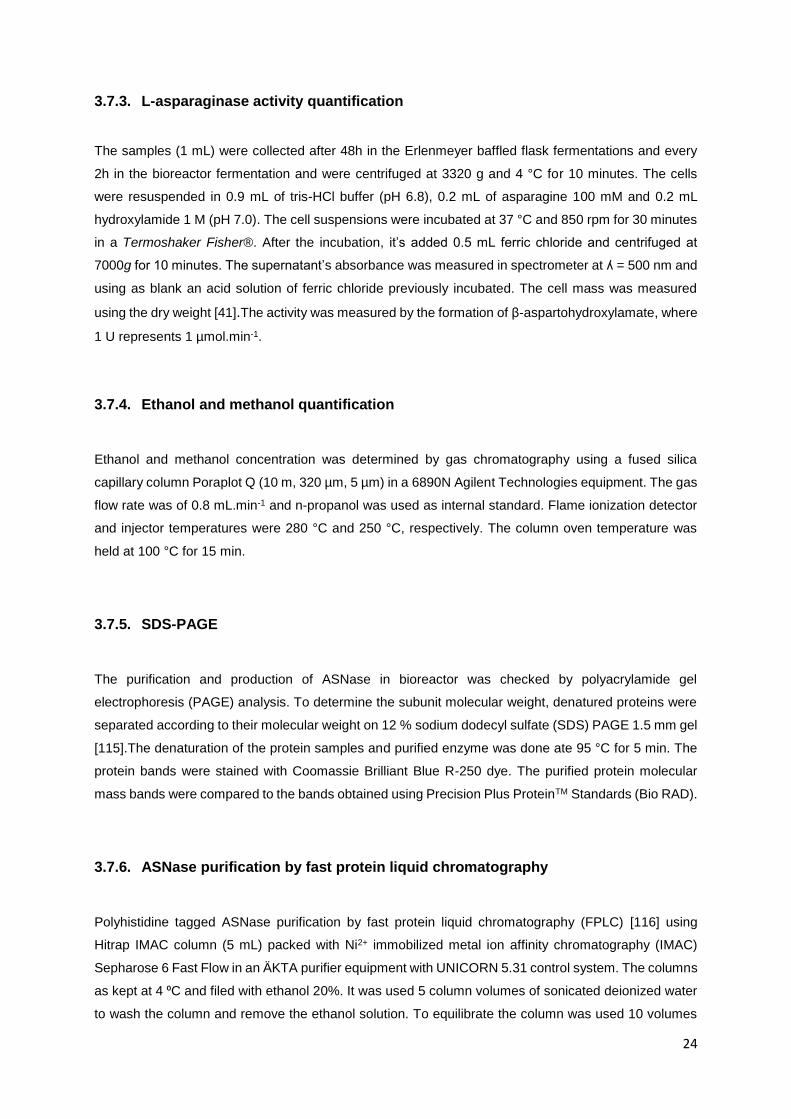
24
3.7.3. L-asparaginase activity quantification
The samples (1 mL) were collected after 48h in the Erlenmeyer baffled flask fermentations and every
2h in the bioreactor fermentation and were centrifuged at 3320 g and 4 °C for 10 minutes. The cells
were resuspended in 0.9 mL of tris-HCl buffer (pH 6.8), 0.2 mL of asparagine 100 mM and 0.2 mL
hydroxylamide 1 M (pH 7.0). The cell suspensions were incubated at 37 °C and 850 rpm for 30 minutes
in a Termoshaker Fisher®. After the incubation, it’s added 0.5 mL ferric chloride and centrifuged at
7000g for 10 minutes. The supernatant’s absorbance was measured in spectrometer at ʎ = 500 nm and
using as blank an acid solution of ferric chloride previously incubated. The cell mass was measured
using the dry weight [41].The activity was measured by the formation of β-aspartohydroxylamate, where
1 U represents 1 µmol.min-1.
3.7.4. Ethanol and methanol quantification
Ethanol and methanol concentration was determined by gas chromatography using a fused silica
capillary column Poraplot Q (10 m, 320 µm, 5 µm) in a 6890N Agilent Technologies equipment. The gas
flow rate was of 0.8 mL.min-1 and n-propanol was used as internal standard. Flame ionization detector
and injector temperatures were 280 °C and 250 °C, respectively. The column oven temperature was
held at 100 °C for 15 min.
3.7.5. SDS-PAGE
The purification and production of ASNase in bioreactor was checked by polyacrylamide gel
electrophoresis (PAGE) analysis. To determine the subunit molecular weight, denatured proteins were
separated according to their molecular weight on 12 % sodium dodecyl sulfate (SDS) PAGE 1.5 mm gel
[115].The denaturation of the protein samples and purified enzyme was done ate 95 °C for 5 min. The
protein bands were stained with Coomassie Brilliant Blue R-250 dye. The purified protein molecular
mass bands were compared to the bands obtained using Precision Plus ProteinTM Standards (Bio RAD).
3.7.6. ASNase purification by fast protein liquid chromatography
Polyhistidine tagged ASNase purification by fast protein liquid chromatography (FPLC) [116] using
Hitrap IMAC column (5 mL) packed with Ni2+ immobilized metal ion affinity chromatography (IMAC)
Sepharose 6 Fast Flow in an ÄKTA purifier equipment with UNICORN 5.31 control system. The columns
as kept at 4 ⁰C and filed with ethanol 20%. It was used 5 column volumes of sonicated deionized water
to wash the column and remove the ethanol solution. To equilibrate the column was used 10 volumes
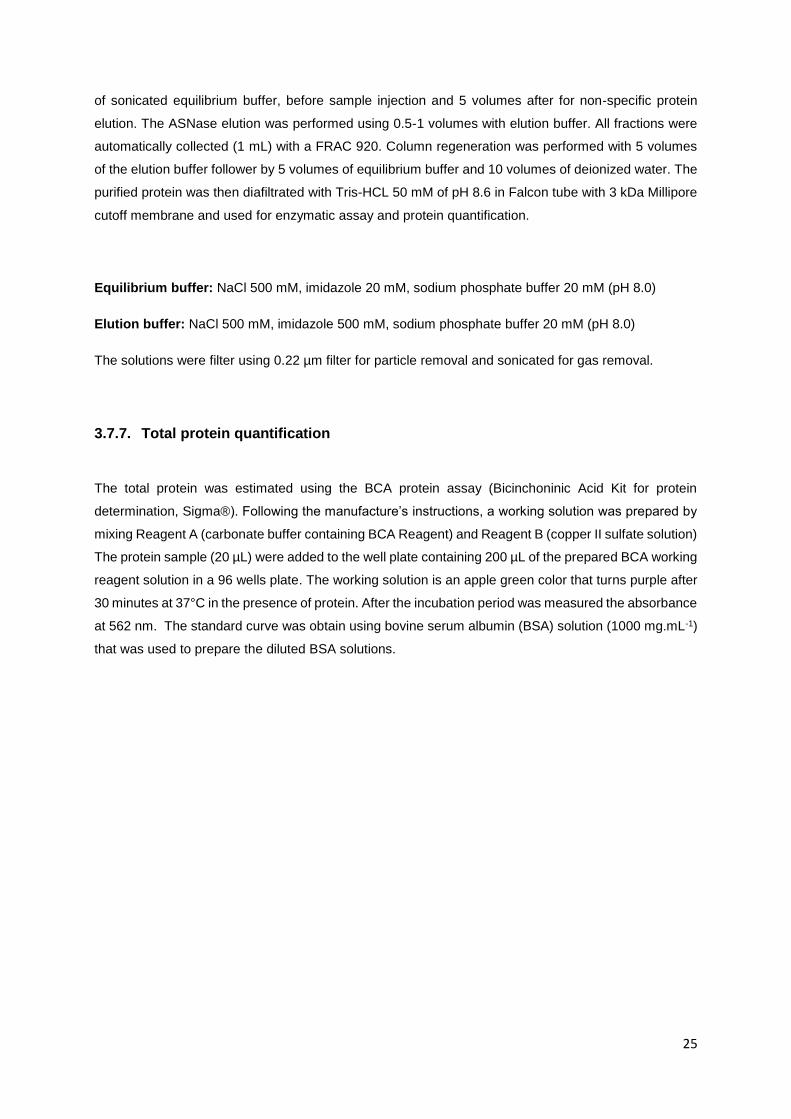
25
of sonicated equilibrium buffer, before sample injection and 5 volumes after for non-specific protein
elution. The ASNase elution was performed using 0.5-1 volumes with elution buffer. All fractions were
automatically collected (1 mL) with a FRAC 920. Column regeneration was performed with 5 volumes
of the elution buffer follower by 5 volumes of equilibrium buffer and 10 volumes of deionized water. The
purified protein was then diafiltrated with Tris-HCL 50 mM of pH 8.6 in Falcon tube with 3 kDa Millipore
cutoff membrane and used for enzymatic assay and protein quantification.
Equilibrium buffer: NaCl 500 mM, imidazole 20 mM, sodium phosphate buffer 20 mM (pH 8.0)
Elution buffer: NaCl 500 mM, imidazole 500 mM, sodium phosphate buffer 20 mM (pH 8.0)
The solutions were filter using 0.22 µm filter for particle removal and sonicated for gas removal.
3.7.7. Total protein quantification
The total protein was estimated using the BCA protein assay (Bicinchoninic Acid Kit for protein
determination, Sigma®). Following the manufacture’s instructions, a working solution was prepared by
mixing Reagent A (carbonate buffer containing BCA Reagent) and Reagent B (copper II sulfate solution)
The protein sample (20 µL) were added to the well plate containing 200 µL of the prepared BCA working
reagent solution in a 96 wells plate. The working solution is an apple green color that turns purple after
30 minutes at 37°C in the presence of protein. After the incubation period was measured the absorbance
at 562 nm. The standard curve was obtain using bovine serum albumin (BSA) solution (1000 mg.mL-1)
that was used to prepare the diluted BSA solutions.
26
4. Results and discussion
4.1. ASNase production in Shaker-flash cultures
4.1.1. Media evaluation by cell growth and ASNase periplasmic activity
Heterologous protein expression in shaker-flash cultures of P. pastoris is usually performed using
complex medium (BMY) [117][118]. The medium composition commonly used that is described in the
Invintrogen guidelines [54] it is not optimized and modifications have been proposed to improve the
protein expression and biomass yield [81][75][54][75][85][80 ]. The supplementation of BMY with casein
or corn step powder (CSP) could improve enzyme yield and enzymatic activity obtain [81][119]. These
supplementations would work as a substitute for ASNase that is hydrolyzed, protecting them from the
proteases released by the cells and indirectly increase the recombinant protein quantity obtain.
However, in bioreactor cultures of P. pastoris is usually carried out using a chemically defined high-salt
concentration medium consisting of a basal salt medium (BSM) and a trace metal solution PTM1
[78][80][81][77] which can have different or even an adverse effect in enzyme production
[120][69][82][85]. To evaluate different media for growth of P. pastoris and ASNase production, were
conducted cultivation in 250 mL Erlenmeyer as described in section 3.5 using both complex BMY, BMY
supplemented and chemically defined medium (BSM with PTM1).
Figure 7 and Figure 8 present respectively the biomass (gdry cell weight.L-1) and ASNase activity (U.gdry cell
weigh-1) produced after 24 h incubation in BMY with glycerol (BGMY), which was followed by the transfer
of the cells obtained, to fresh medium were the induction toke place using methanol pulses (30 mL.L-1)
every 24 h, both with supplementation and without supplementation of CSP (5 g.L-1) or casein (5 g.L-1).
Before the induction of enzyme expression by methanol addition, the cells were transferred to fresh
medium without the glycerol at initial pH 6.0 for the complex medium [54][80] and around pH 5.0 for
BSM to avoid salt precipitation that occurs at pH higher than 5.0 [73][121]. At the end of the 48 hours
induction period the dry cell weight and the ANSase activity levels were measured. Biomass produced
in the complex media were similar between each other, 32±2 g.L-1 for BMY without supplementation
and with casein, and 33±2 g.L-1 with BMY with CSP. However, with the BSM medium was achieved a
lower, 27±2 g.L-1. The difference in biomass concentration obtained between the complex media and
the defined media was due to the different amount of carbon source available in each one. During the
growth phase with glycerol, the complex media has less glycerol, 10 g.L-1, but it has other compounds
that work as carbon source with around 2.4 Cmol.L-1, while the BSM with glycerol 40 g.L-1 only has 1.3
Cmol.L-1. Effect that is even more relevant in the induction phase, as for two methanol pulses (30 mL.L-
1) the defined medium only has 1.4 Cmol.L-1, when compared with 2.5 Cmol.L-1 from the BMY. Taking
in account all carbon available in both phases of ASNase production, the BSM media achieved around
0.84 gdcw.Cmol while for complex media was 0.55 gdcw.Cmol.
27
Li et al 2013 reported improvement in recombinant protein produced in P. pastoris due to the reduction
of protease’s activity when supplemented with casein or corn step powder [81][119].
[81][81][80][80][79][80][80][80][80][80][80][80]However, after the 48 h induction period was measured
periplasmic ASNase activity revealing no significant improvement in ASNase with supplementation of
BMY. That may be explain by L-asparaginase II produced being in the periplasm and not exposed to
the proteases in extra cellular environment.
The ASNase levels expressed in BSM medium experiments were clear as due to data having flotation.
Those data flotations may be due to the precipitation of salts caused [73][83] by the difficulty in adjusting
the initial pH to 5.0 and pH variations throughout the induction phase as the defined medium did not use
any buffer [54], which appears to hider the L-asparaginase production and could be solved in bioreactor.
4.1.2. Basal salt medium nitrogen source modification
The BSM medium, one of the most broadly used media for P. pastoris expression system in bioreactor
due to its chemically defined composition and for allowing high cell density cultures, although it also has
some disadvantages, namely unbalanced composition, salt precipitation and uses NH4OH
simultaneously as nitrogen source and pH corrector, that may be responsible for several growth
constrains[84][122][83][82]. The use of ammonium hydroxide simultaneously as pH corrector and as
nitrogen source could lead to nitrogen limitation [73][69][82]. To address this drawback and remove the
restrains caused by using NH4OH as nitrogen source and pH corrector, the nitrogen source was
replaced by (NH4)2SO4 and to correct the pH it was used NaOH (10M). The use of this inorganic nitrogen
0
5
10
15
20
25
30
35
40
BSM BMGY +CSP
BMGY +Caseína
BMGY
[X]
(g/L
)
Cultivation medium
0123456789
BSM BMGY +CSP
BMGY +Caseína
BMGYU
(m
g /
g ce
lls
Cultivation medium
Figure 7 - Biomass Dry weight of P. pastoris in:
BSM with PTM1, BMGY with and without casein or
corn step powder and glycerol, after growth phase
with 40 and 10 g.L-1 glycerol respectively for 24 h
and in the induction phase with 3% methanol
during 48 h
Figure 8 - Periplasmic activity of ASNase obtained
with P. pastoris in: BSM with PTM1, BMGY with
and without casein or corn step powder and
glycerol, after growth phase with 40 and 10 g.L-1
glycerol respectively for 24 h and in the induction
phase with 3% methanol during 48 h.
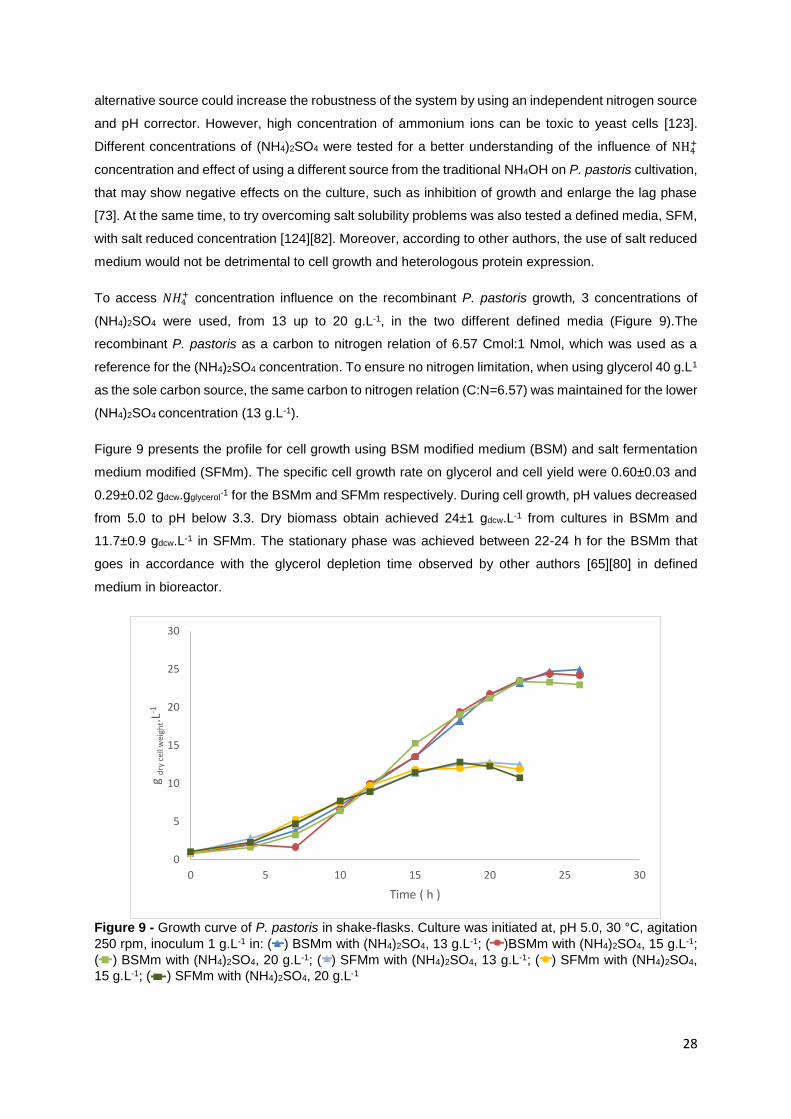
28
alternative source could increase the robustness of the system by using an independent nitrogen source
and pH corrector. However, high concentration of ammonium ions can be toxic to yeast cells [123].
Different concentrations of (NH4)2SO4 were tested for a better understanding of the influence of NH4+
concentration and effect of using a different source from the traditional NH4OH on P. pastoris cultivation,
that may show negative effects on the culture, such as inhibition of growth and enlarge the lag phase
[73]. At the same time, to try overcoming salt solubility problems was also tested a defined media, SFM,
with salt reduced concentration [124][82]. Moreover, according to other authors, the use of salt reduced
medium would not be detrimental to cell growth and heterologous protein expression.
To access 𝑁𝐻4+ concentration influence on the recombinant P. pastoris growth, 3 concentrations of
(NH4)2SO4 were used, from 13 up to 20 g.L-1, in the two different defined media (Figure 9).The
recombinant P. pastoris as a carbon to nitrogen relation of 6.57 Cmol:1 Nmol, which was used as a
reference for the (NH4)2SO4 concentration. To ensure no nitrogen limitation, when using glycerol 40 g.L1
as the sole carbon source, the same carbon to nitrogen relation (C:N=6.57) was maintained for the lower
(NH4)2SO4 concentration (13 g.L-1).
Figure 9 presents the profile for cell growth using BSM modified medium (BSM) and salt fermentation
medium modified (SFMm). The specific cell growth rate on glycerol and cell yield were 0.60±0.03 and
0.29±0.02 gdcw.gglycerol-1 for the BSMm and SFMm respectively. During cell growth, pH values decreased
from 5.0 to pH below 3.3. Dry biomass obtain achieved 24±1 gdcw.L-1 from cultures in BSMm and
11.7±0.9 gdcw.L-1 in SFMm. The stationary phase was achieved between 22-24 h for the BSMm that
goes in accordance with the glycerol depletion time observed by other authors [65][80] in defined
medium in bioreactor.
Figure 9 - Growth curve of P. pastoris in shake-flasks. Culture was initiated at, pH 5.0, 30 °C, agitation
250 rpm, inoculum 1 g.L-1 in: ( ) BSMm with (NH4)2SO4, 13 g.L-1; ( )BSMm with (NH4)2SO4, 15 g.L-1;
( ) BSMm with (NH4)2SO4, 20 g.L-1; ( ) SFMm with (NH4)2SO4, 13 g.L-1; ( ) SFMm with (NH4)2SO4,
15 g.L-1; ( ) SFMm with (NH4)2SO4, 20 g.L-1
0
5
10
15
20
25
30
0 5 10 15 20 25 30
g d
ry c
ell w
eigh
t.L-1
Time ( h )
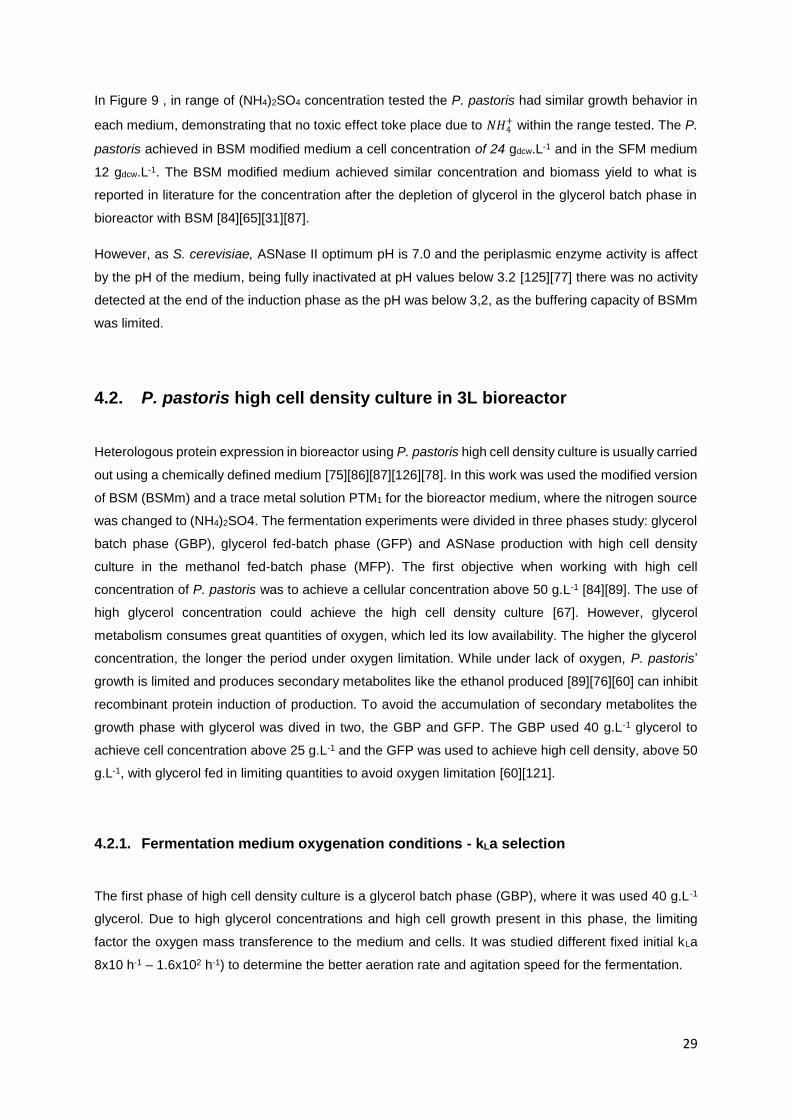
29
In Figure 9 , in range of (NH4)2SO4 concentration tested the P. pastoris had similar growth behavior in
each medium, demonstrating that no toxic effect toke place due to 𝑁𝐻4+ within the range tested. The P.
pastoris achieved in BSM modified medium a cell concentration of 24 gdcw.L-1 and in the SFM medium
12 gdcw.L-1. The BSM modified medium achieved similar concentration and biomass yield to what is
reported in literature for the concentration after the depletion of glycerol in the glycerol batch phase in
bioreactor with BSM [84][65][31][87].
However, as S. cerevisiae, ASNase II optimum pH is 7.0 and the periplasmic enzyme activity is affect
by the pH of the medium, being fully inactivated at pH values below 3.2 [125][77] there was no activity
detected at the end of the induction phase as the pH was below 3,2, as the buffering capacity of BSMm
was limited.
4.2. P. pastoris high cell density culture in 3L bioreactor
Heterologous protein expression in bioreactor using P. pastoris high cell density culture is usually carried
out using a chemically defined medium [75][86][87][126][78]. In this work was used the modified version
of BSM (BSMm) and a trace metal solution PTM1 for the bioreactor medium, where the nitrogen source
was changed to (NH4)2SO4. The fermentation experiments were divided in three phases study: glycerol
batch phase (GBP), glycerol fed-batch phase (GFP) and ASNase production with high cell density
culture in the methanol fed-batch phase (MFP). The first objective when working with high cell
concentration of P. pastoris was to achieve a cellular concentration above 50 g.L-1 [84][89]. The use of
high glycerol concentration could achieve the high cell density culture [67]. However, glycerol
metabolism consumes great quantities of oxygen, which led its low availability. The higher the glycerol
concentration, the longer the period under oxygen limitation. While under lack of oxygen, P. pastoris’
growth is limited and produces secondary metabolites like the ethanol produced [89][76][60] can inhibit
recombinant protein induction of production. To avoid the accumulation of secondary metabolites the
growth phase with glycerol was dived in two, the GBP and GFP. The GBP used 40 g.L-1 glycerol to
achieve cell concentration above 25 g.L-1 and the GFP was used to achieve high cell density, above 50
g.L-1, with glycerol fed in limiting quantities to avoid oxygen limitation [60][121].
4.2.1. Fermentation medium oxygenation conditions - kLa selection
The first phase of high cell density culture is a glycerol batch phase (GBP), where it was used 40 g.L-1
glycerol. Due to high glycerol concentrations and high cell growth present in this phase, the limiting
factor the oxygen mass transference to the medium and cells. It was studied different fixed initial kLa
8x10 h-1 – 1.6x10² h-1) to determine the better aeration rate and agitation speed for the fermentation.
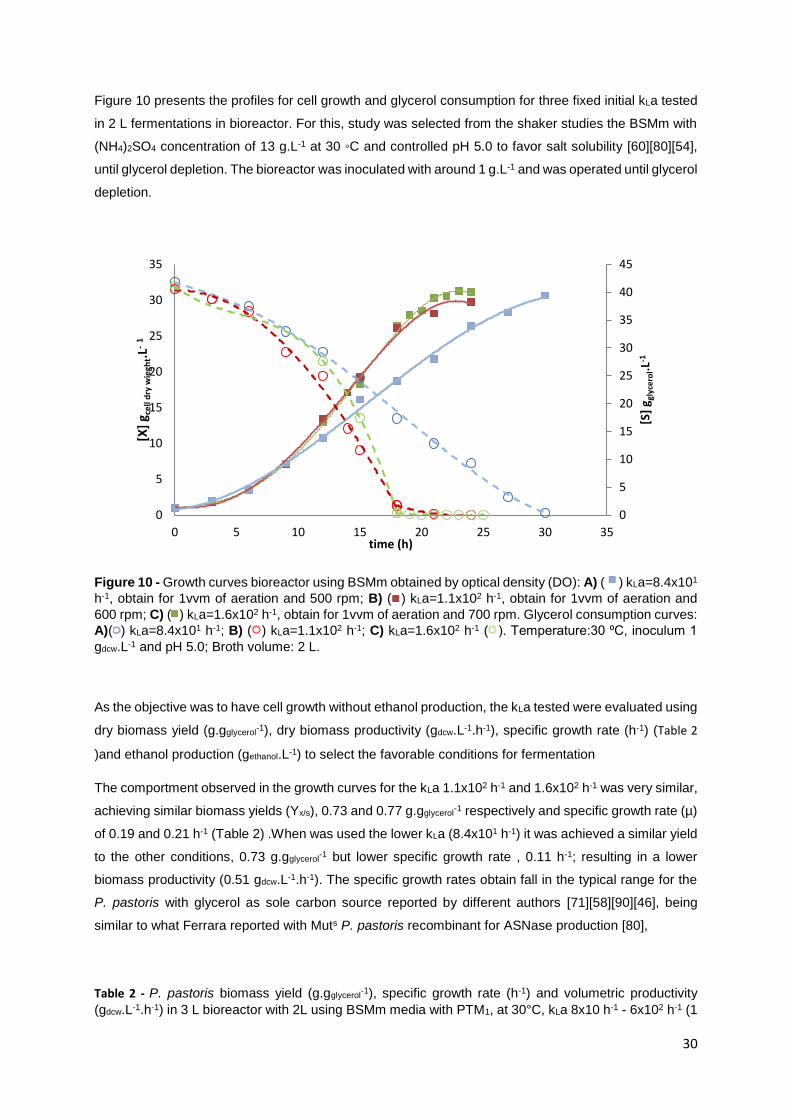
30
Figure 10 presents the profiles for cell growth and glycerol consumption for three fixed initial kLa tested
in 2 L fermentations in bioreactor. For this, study was selected from the shaker studies the BSMm with
(NH4)2SO4 concentration of 13 g.L-1 at 30 ◦C and controlled pH 5.0 to favor salt solubility [60][80][54],
until glycerol depletion. The bioreactor was inoculated with around 1 g.L-1 and was operated until glycerol
depletion.
Figure 10 - Growth curves bioreactor using BSMm obtained by optical density (DO): A) ( ) kLa=8.4x101
h-1, obtain for 1vvm of aeration and 500 rpm; B) ( ) kLa=1.1x10² h-1, obtain for 1vvm of aeration and
600 rpm; C) ( ) kLa=1.6x10² h-1, obtain for 1vvm of aeration and 700 rpm. Glycerol consumption curves:
A)( ) kLa=8.4x101 h-1; B) ( ) kLa=1.1x10² h-1; C) kLa=1.6x10² h-1 ( ). Temperature:30 ⁰C, inoculum 1
gdcw.L-1 and pH 5.0; Broth volume: 2 L.
As the objective was to have cell growth without ethanol production, the kLa tested were evaluated using
dry biomass yield (g.gglycerol-1), dry biomass productivity (gdcw.L-1.h-1), specific growth rate (h-1) (Table 2
)and ethanol production (gethanol.L-1) to select the favorable conditions for fermentation
The comportment observed in the growth curves for the kLa 1.1x10² h-1 and 1.6x10² h-1 was very similar,
achieving similar biomass yields (Yx/s), 0.73 and 0.77 g.gglycerol-1 respectively and specific growth rate (µ)
of 0.19 and 0.21 h-1 (Table 2) .When was used the lower kLa (8.4x101 h-1) it was achieved a similar yield
to the other conditions, 0.73 g.gglycerol-1 but lower specific growth rate , 0.11 h-1; resulting in a lower
biomass productivity (0.51 gdcw.L-1.h-1). The specific growth rates obtain fall in the typical range for the
P. pastoris with glycerol as sole carbon source reported by different authors [71][58][90][46], being
similar to what Ferrara reported with Muts P. pastoris recombinant for ASNase production [80],
Table 2 - P. pastoris biomass yield (g.gglycerol-1), specific growth rate (h-1) and volumetric productivity
(gdcw.L-1.h-1) in 3 L bioreactor with 2L using BSMm media with PTM1, at 30°C, kLa 8x10 h-1 - 6x10² h-1 (1
0
5
10
15
20
25
30
35
40
45
0
5
10
15
20
25
30
35
0 5 10 15 20 25 30 35
[S]
g gly
cero
l.L-1
[X]
g cel
l dry
wie
ght.
L-1
time (h)
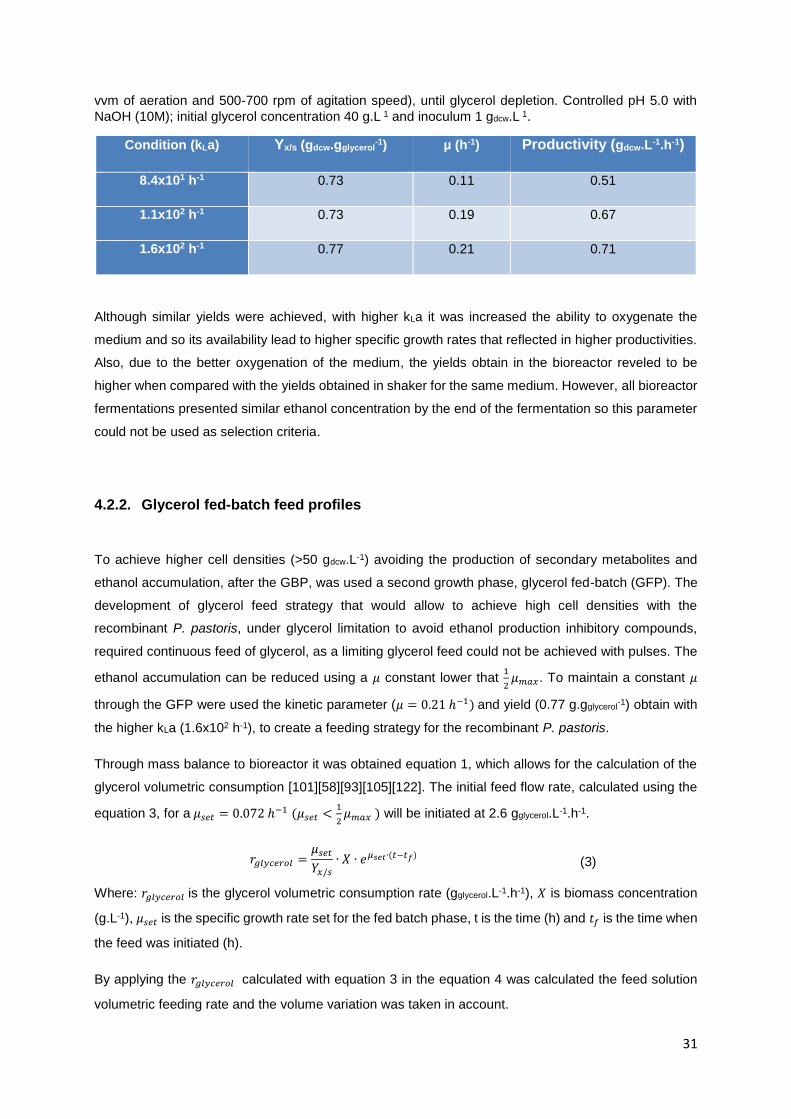
31
vvm of aeration and 500-700 rpm of agitation speed), until glycerol depletion. Controlled pH 5.0 with
NaOH (10M); initial glycerol concentration 40 g.L 1 and inoculum 1 gdcw.L 1.
Condition (kLa) Yx/s (gdcw.gglycerol-1) µ (h-1) Productivity (gdcw.L-1.h-1)
8.4x101 h-1 0.73 0.11 0.51
1.1x10² h-1 0.73 0.19 0.67
1.6x10² h-1 0.77 0.21 0.71
Although similar yields were achieved, with higher kLa it was increased the ability to oxygenate the
medium and so its availability lead to higher specific growth rates that reflected in higher productivities.
Also, due to the better oxygenation of the medium, the yields obtain in the bioreactor reveled to be
higher when compared with the yields obtained in shaker for the same medium. However, all bioreactor
fermentations presented similar ethanol concentration by the end of the fermentation so this parameter
could not be used as selection criteria.
4.2.2. Glycerol fed-batch feed profiles
To achieve higher cell densities (>50 gdcw.L-1) avoiding the production of secondary metabolites and
ethanol accumulation, after the GBP, was used a second growth phase, glycerol fed-batch (GFP). The
development of glycerol feed strategy that would allow to achieve high cell densities with the
recombinant P. pastoris, under glycerol limitation to avoid ethanol production inhibitory compounds,
required continuous feed of glycerol, as a limiting glycerol feed could not be achieved with pulses. The
ethanol accumulation can be reduced using a 𝜇 constant lower that 1
2𝜇𝑚𝑎𝑥. To maintain a constant 𝜇
through the GFP were used the kinetic parameter (𝜇 = 0.21 ℎ−1) and yield (0.77 g.gglycerol-1) obtain with
the higher kLa (1.6x10² h-1), to create a feeding strategy for the recombinant P. pastoris.
Through mass balance to bioreactor it was obtained equation 1, which allows for the calculation of the
glycerol volumetric consumption [101][58][93][105][122]. The initial feed flow rate, calculated using the
equation 3, for a 𝜇𝑠𝑒𝑡 = 0.072 ℎ−1 (𝜇𝑠𝑒𝑡 <1
2𝜇𝑚𝑎𝑥 ) will be initiated at 2.6 gglycerol.L-1.h-1.
𝑟𝑔𝑙𝑦𝑐𝑒𝑟𝑜𝑙 =𝜇𝑠𝑒𝑡
𝑌𝑥/𝑠
∙ 𝑋 ∙ 𝑒𝜇𝑠𝑒𝑡∙(𝑡−𝑡𝑓) (3)
Where: 𝑟𝑔𝑙𝑦𝑐𝑒𝑟𝑜𝑙 is the glycerol volumetric consumption rate (gglycerol.L-1.h-1), 𝑋 is biomass concentration
(g.L-1), 𝜇𝑠𝑒𝑡 is the specific growth rate set for the fed batch phase, t is the time (h) and 𝑡𝑓 is the time when
the feed was initiated (h).
By applying the 𝑟𝑔𝑙𝑦𝑐𝑒𝑟𝑜𝑙 calculated with equation 3 in the equation 4 was calculated the feed solution
volumetric feeding rate and the volume variation was taken in account.
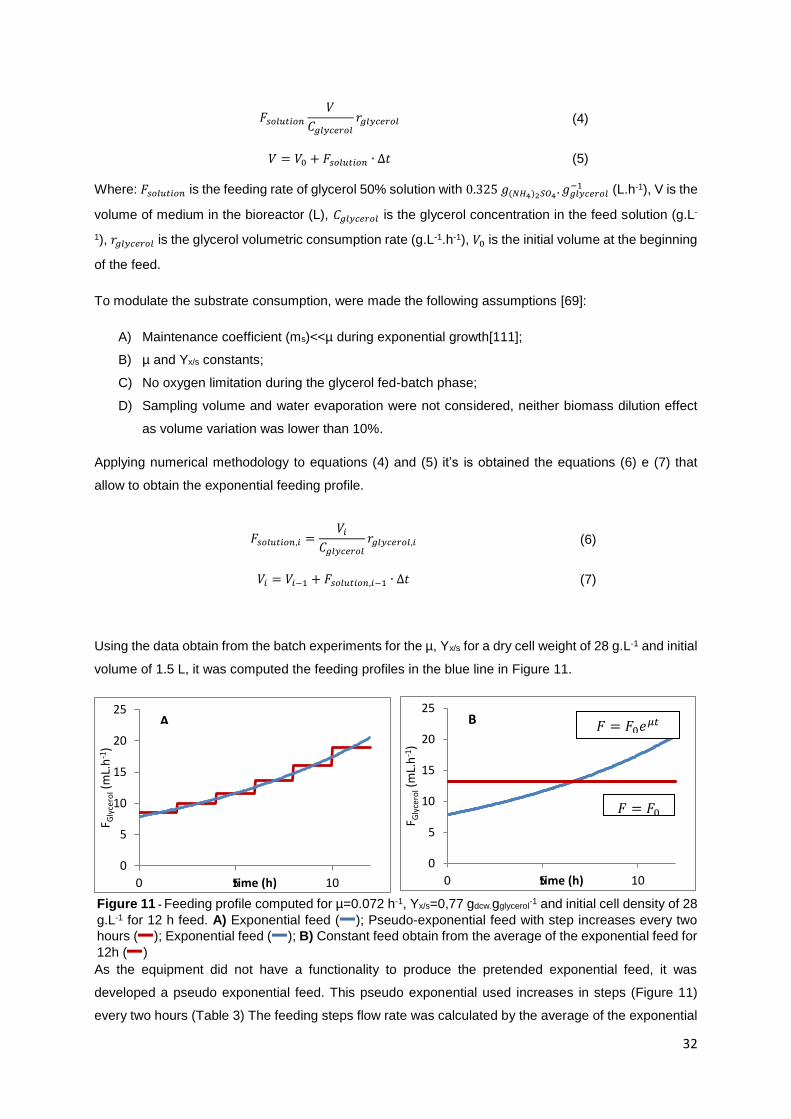
32
Where: 𝐹𝑠𝑜𝑙𝑢𝑡𝑖𝑜𝑛 is the feeding rate of glycerol 50% solution with 0.325 𝑔(𝑁𝐻4)2𝑆𝑂4. 𝑔𝑔𝑙𝑦𝑐𝑒𝑟𝑜𝑙
−1 (L.h-1), V is the
volume of medium in the bioreactor (L), 𝐶𝑔𝑙𝑦𝑐𝑒𝑟𝑜𝑙 is the glycerol concentration in the feed solution (g.L-
1), 𝑟𝑔𝑙𝑦𝑐𝑒𝑟𝑜𝑙 is the glycerol volumetric consumption rate (g.L-1.h-1), 𝑉0 is the initial volume at the beginning
of the feed.
To modulate the substrate consumption, were made the following assumptions [69]:
A) Maintenance coefficient (ms)<<µ during exponential growth[111];
B) µ and Yx/s constants;
C) No oxygen limitation during the glycerol fed-batch phase;
D) Sampling volume and water evaporation were not considered, neither biomass dilution effect
as volume variation was lower than 10%.
Applying numerical methodology to equations (4) and (5) it’s is obtained the equations (6) e (7) that
allow to obtain the exponential feeding profile.
Using the data obtain from the batch experiments for the µ, Yx/s for a dry cell weight of 28 g.L-1 and initial
volume of 1.5 L, it was computed the feeding profiles in the blue line in Figure 11.
As the equipment did not have a functionality to produce the pretended exponential feed, it was
developed a pseudo exponential feed. This pseudo exponential used increases in steps (Figure 11)
every two hours (Table 3) The feeding steps flow rate was calculated by the average of the exponential
𝐹𝑠𝑜𝑙𝑢𝑡𝑖𝑜𝑛
𝑉
𝐶𝑔𝑙𝑦𝑐𝑒𝑟𝑜𝑙
𝑟𝑔𝑙𝑦𝑐𝑒𝑟𝑜𝑙 (4)
𝑉 = 𝑉0 + 𝐹𝑠𝑜𝑙𝑢𝑡𝑖𝑜𝑛 ∙ ∆𝑡 (5)
𝐹𝑠𝑜𝑙𝑢𝑡𝑖𝑜𝑛,𝑖 =𝑉𝑖
𝐶𝑔𝑙𝑦𝑐𝑒𝑟𝑜𝑙
𝑟𝑔𝑙𝑦𝑐𝑒𝑟𝑜𝑙,𝑖 (6)
𝑉𝑖 = 𝑉𝑖−1 + 𝐹𝑠𝑜𝑙𝑢𝑡𝑖𝑜𝑛,𝑖−1 ∙ ∆𝑡 (7)
Figure 11 - Feeding profile computed for µ=0.072 h-1, Yx/s=0,77 gdcw.gglycerol-1 and initial cell density of 28
g.L-1 for 12 h feed. A) Exponential feed ( ); Pseudo-exponential feed with step increases every two
hours ( ); Exponential feed ( ); B) Constant feed obtain from the average of the exponential feed for
12h ( )
0
5
10
15
20
25
0 5 10
F Gly
cero
l(m
L.h
-1)
time (h)
𝐹 = 𝐹0
0
5
10
15
20
25
0 5 10
F Gly
cero
l(m
L.h
-1)
time (h)
B A 𝐹 = 𝐹0𝑒𝜇𝑡
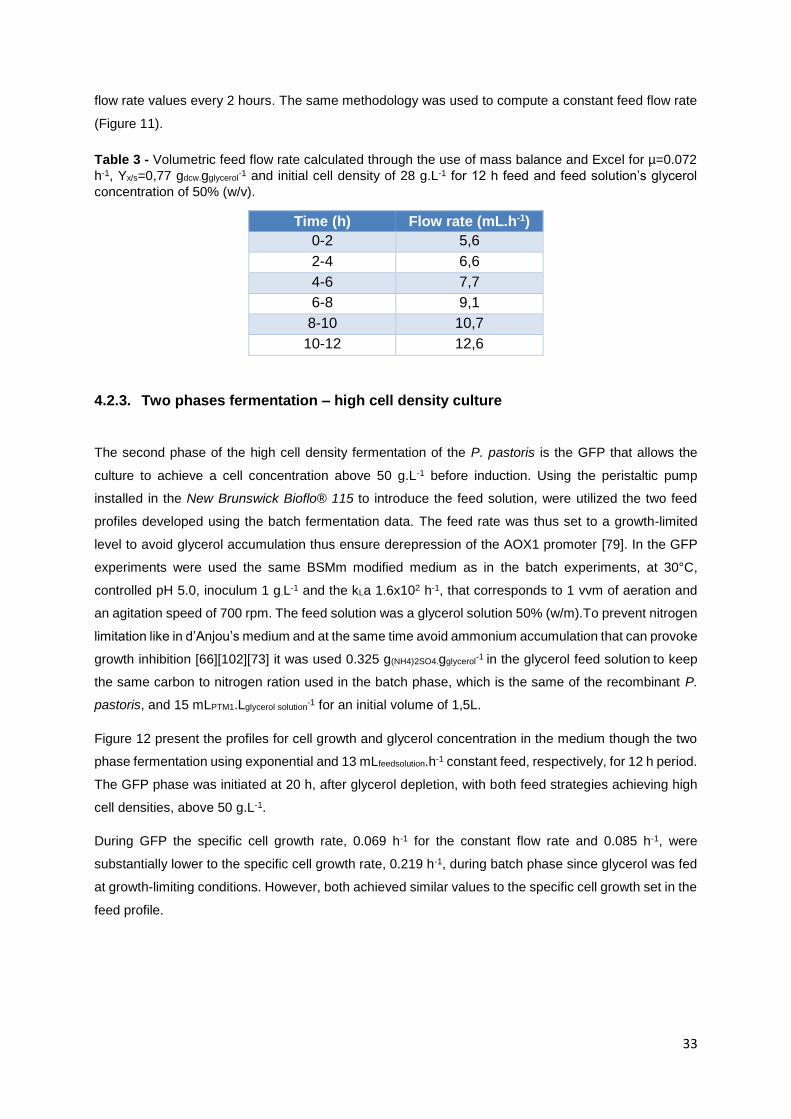
33
flow rate values every 2 hours. The same methodology was used to compute a constant feed flow rate
(Figure 11).
Table 3 - Volumetric feed flow rate calculated through the use of mass balance and Excel for µ=0.072
h-1, Yx/s=0,77 gdcw.gglycerol-1 and initial cell density of 28 g.L-1 for 12 h feed and feed solution’s glycerol
concentration of 50% (w/v).
Time (h) Flow rate (mL.h-1)
0-2 5,6
2-4 6,6
4-6 7,7
6-8 9,1
8-10 10,7
10-12 12,6
4.2.3. Two phases fermentation – high cell density culture
The second phase of the high cell density fermentation of the P. pastoris is the GFP that allows the
culture to achieve a cell concentration above 50 g.L-1 before induction. Using the peristaltic pump
installed in the New Brunswick Bioflo® 115 to introduce the feed solution, were utilized the two feed
profiles developed using the batch fermentation data. The feed rate was thus set to a growth-limited
level to avoid glycerol accumulation thus ensure derepression of the AOX1 promoter [79]. In the GFP
experiments were used the same BSMm modified medium as in the batch experiments, at 30°C,
controlled pH 5.0, inoculum 1 g.L-1 and the kLa 1.6x10² h-1, that corresponds to 1 vvm of aeration and
an agitation speed of 700 rpm. The feed solution was a glycerol solution 50% (w/m).To prevent nitrogen
limitation like in d’Anjou’s medium and at the same time avoid ammonium accumulation that can provoke
growth inhibition [66][102][73] it was used 0.325 g(NH4)2SO4.gglycerol-1
in the glycerol feed solution to keep
the same carbon to nitrogen ration used in the batch phase, which is the same of the recombinant P.
pastoris, and 15 mLPTM1.Lglycerol solution-1 for an initial volume of 1,5L.
Figure 12 present the profiles for cell growth and glycerol concentration in the medium though the two
phase fermentation using exponential and 13 mLfeedsolution.h-1 constant feed, respectively, for 12 h period.
The GFP phase was initiated at 20 h, after glycerol depletion, with both feed strategies achieving high
cell densities, above 50 g.L-1.
During GFP the specific cell growth rate, 0.069 h-1 for the constant flow rate and 0.085 h-1, were
substantially lower to the specific cell growth rate, 0.219 h-1, during batch phase since glycerol was fed
at growth-limiting conditions. However, both achieved similar values to the specific cell growth set in the
feed profile.
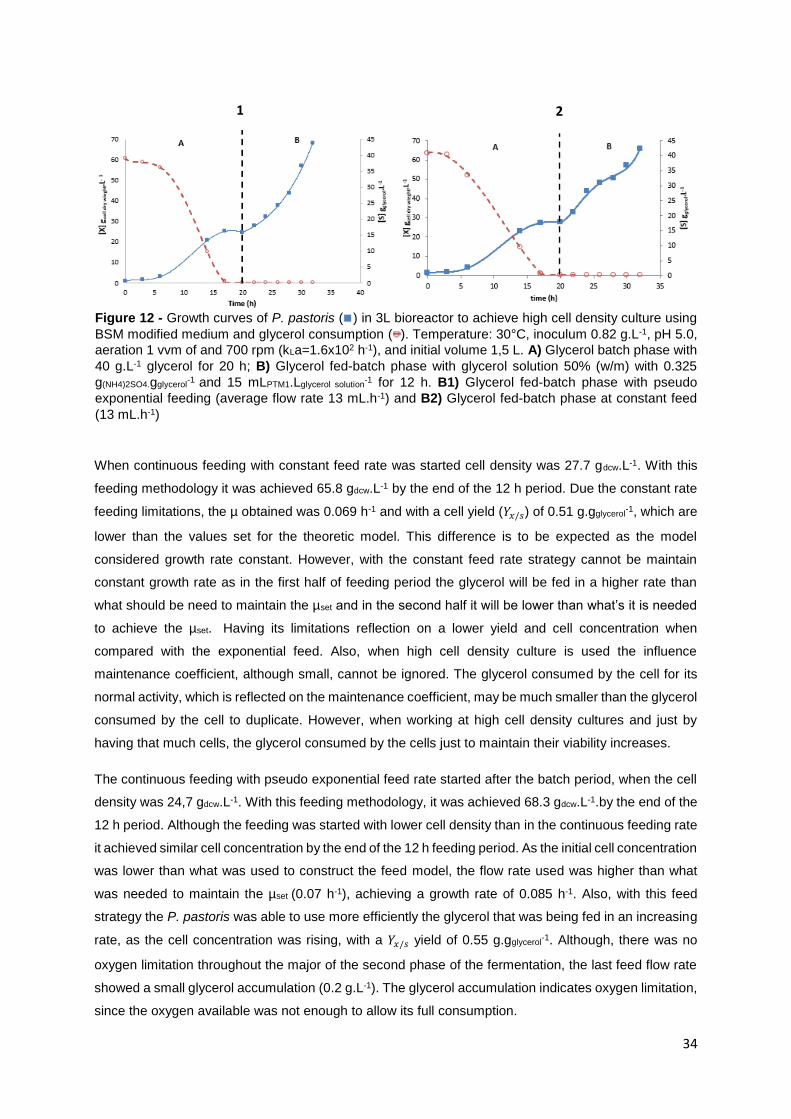
34
When continuous feeding with constant feed rate was started cell density was 27.7 gdcw.L-1. With this
feeding methodology it was achieved 65.8 gdcw.L-1 by the end of the 12 h period. Due the constant rate
feeding limitations, the µ obtained was 0.069 h-1 and with a cell yield (𝑌𝑥/𝑠) of 0.51 g.gglycerol-1, which are
lower than the values set for the theoretic model. This difference is to be expected as the model
considered growth rate constant. However, with the constant feed rate strategy cannot be maintain
constant growth rate as in the first half of feeding period the glycerol will be fed in a higher rate than
what should be need to maintain the µset and in the second half it will be lower than what’s it is needed
to achieve the µset. Having its limitations reflection on a lower yield and cell concentration when
compared with the exponential feed. Also, when high cell density culture is used the influence
maintenance coefficient, although small, cannot be ignored. The glycerol consumed by the cell for its
normal activity, which is reflected on the maintenance coefficient, may be much smaller than the glycerol
consumed by the cell to duplicate. However, when working at high cell density cultures and just by
having that much cells, the glycerol consumed by the cells just to maintain their viability increases.
The continuous feeding with pseudo exponential feed rate started after the batch period, when the cell
density was 24,7 gdcw.L-1. With this feeding methodology, it was achieved 68.3 gdcw.L-1.by the end of the
12 h period. Although the feeding was started with lower cell density than in the continuous feeding rate
it achieved similar cell concentration by the end of the 12 h feeding period. As the initial cell concentration
was lower than what was used to construct the feed model, the flow rate used was higher than what
was needed to maintain the µset (0.07 h-1), achieving a growth rate of 0.085 h-1. Also, with this feed
strategy the P. pastoris was able to use more efficiently the glycerol that was being fed in an increasing
rate, as the cell concentration was rising, with a 𝑌𝑥/𝑠 yield of 0.55 g.gglycerol-1. Although, there was no
oxygen limitation throughout the major of the second phase of the fermentation, the last feed flow rate
showed a small glycerol accumulation (0.2 g.L-1). The glycerol accumulation indicates oxygen limitation,
since the oxygen available was not enough to allow its full consumption.
Figure 12 - Growth curves of P. pastoris ( ) in 3L bioreactor to achieve high cell density culture using
BSM modified medium and glycerol consumption ( ). Temperature: 30°C, inoculum 0.82 g.L-1, pH 5.0,
aeration 1 vvm of and 700 rpm (kLa=1.6x10² h-1), and initial volume 1,5 L. A) Glycerol batch phase with
40 g.L-1 glycerol for 20 h; B) Glycerol fed-batch phase with glycerol solution 50% (w/m) with 0.325
g(NH4)2SO4.gglycerol-1
and 15 mLPTM1.Lglycerol solution-1 for 12 h. B1) Glycerol fed-batch phase with pseudo
exponential feeding (average flow rate 13 mL.h-1) and B2) Glycerol fed-batch phase at constant feed
(13 mL.h-1)
1 2
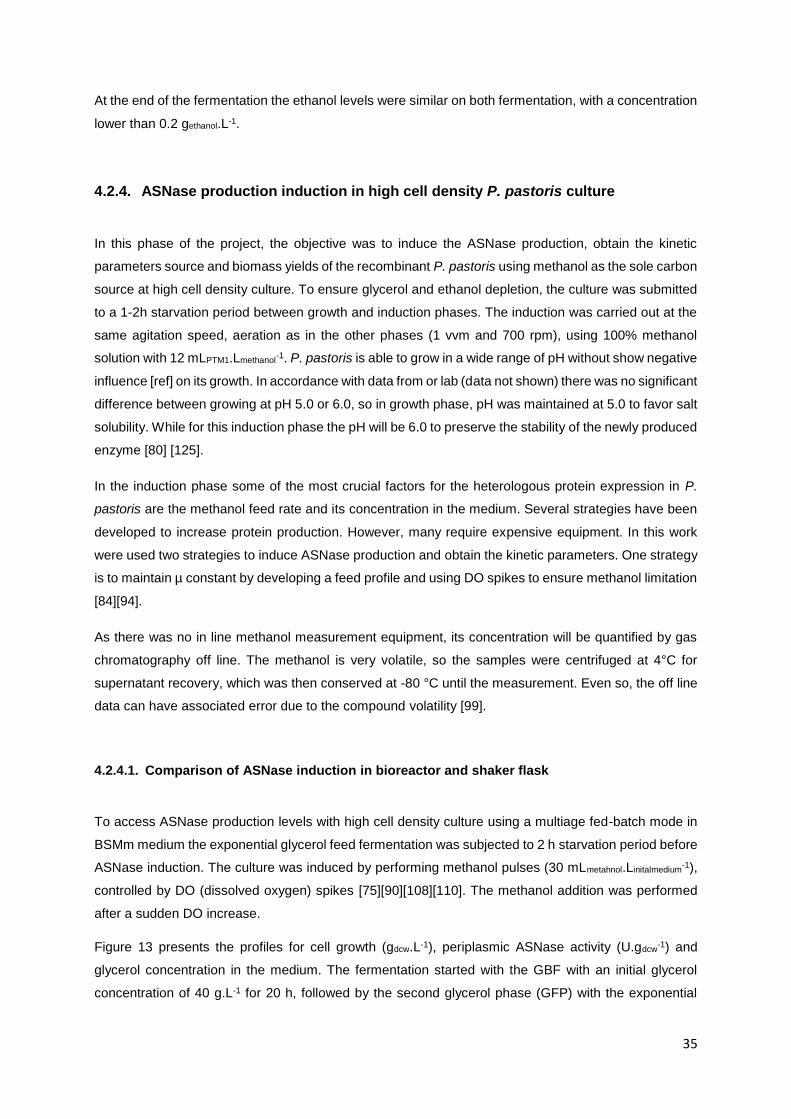
35
At the end of the fermentation the ethanol levels were similar on both fermentation, with a concentration
lower than 0.2 gethanol.L-1.
4.2.4. ASNase production induction in high cell density P. pastoris culture
In this phase of the project, the objective was to induce the ASNase production, obtain the kinetic
parameters source and biomass yields of the recombinant P. pastoris using methanol as the sole carbon
source at high cell density culture. To ensure glycerol and ethanol depletion, the culture was submitted
to a 1-2h starvation period between growth and induction phases. The induction was carried out at the
same agitation speed, aeration as in the other phases (1 vvm and 700 rpm), using 100% methanol
solution with 12 mLPTM1.Lmethanol-1. P. pastoris is able to grow in a wide range of pH without show negative
influence [ref] on its growth. In accordance with data from or lab (data not shown) there was no significant
difference between growing at pH 5.0 or 6.0, so in growth phase, pH was maintained at 5.0 to favor salt
solubility. While for this induction phase the pH will be 6.0 to preserve the stability of the newly produced
enzyme [80] [125].
In the induction phase some of the most crucial factors for the heterologous protein expression in P.
pastoris are the methanol feed rate and its concentration in the medium. Several strategies have been
developed to increase protein production. However, many require expensive equipment. In this work
were used two strategies to induce ASNase production and obtain the kinetic parameters. One strategy
is to maintain µ constant by developing a feed profile and using DO spikes to ensure methanol limitation
[84][94].
As there was no in line methanol measurement equipment, its concentration will be quantified by gas
chromatography off line. The methanol is very volatile, so the samples were centrifuged at 4°C for
supernatant recovery, which was then conserved at -80 °C until the measurement. Even so, the off line
data can have associated error due to the compound volatility [99].
4.2.4.1. Comparison of ASNase induction in bioreactor and shaker flask
To access ASNase production levels with high cell density culture using a multiage fed-batch mode in
BSMm medium the exponential glycerol feed fermentation was subjected to 2 h starvation period before
ASNase induction. The culture was induced by performing methanol pulses (30 mLmetahnol.Linitalmedium-1),
controlled by DO (dissolved oxygen) spikes [75][90][108][110]. The methanol addition was performed
after a sudden DO increase.
Figure 13 presents the profiles for cell growth (gdcw.L-1), periplasmic ASNase activity (U.gdcw-1) and
glycerol concentration in the medium. The fermentation started with the GBF with an initial glycerol
concentration of 40 g.L-1 for 20 h, followed by the second glycerol phase (GFP) with the exponential
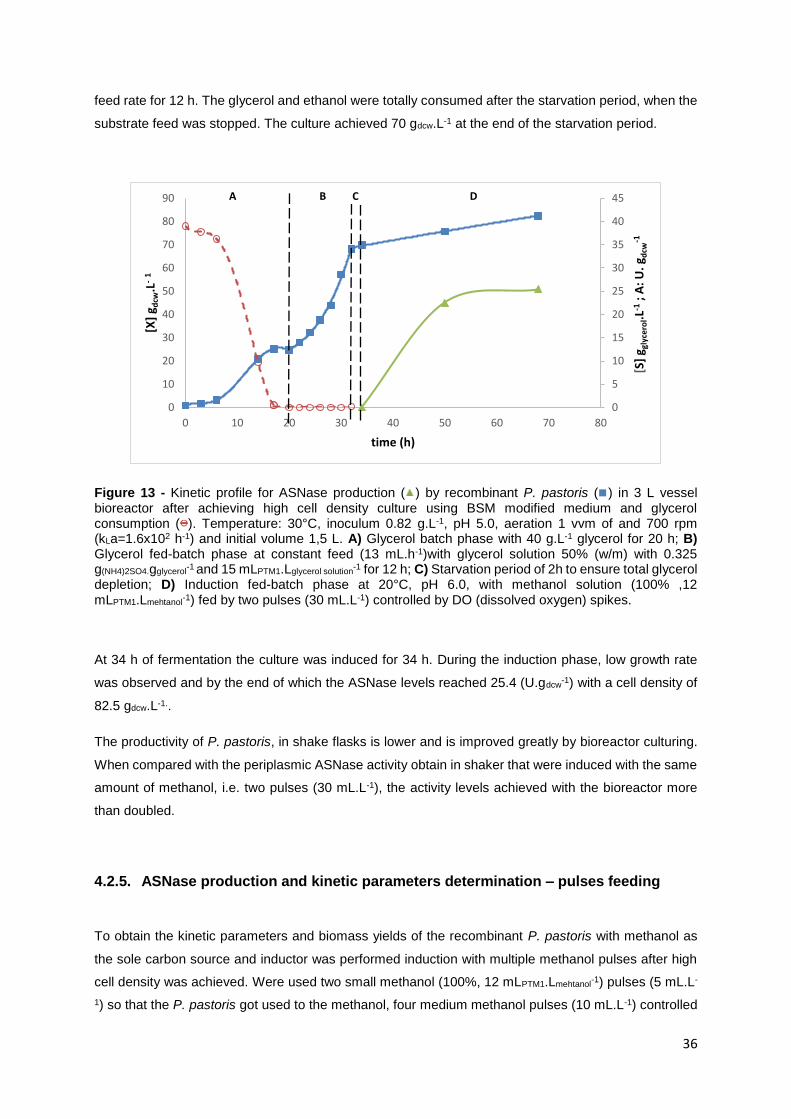
36
feed rate for 12 h. The glycerol and ethanol were totally consumed after the starvation period, when the
substrate feed was stopped. The culture achieved 70 gdcw.L-1 at the end of the starvation period.
Figure 13 - Kinetic profile for ASNase production ( ) by recombinant P. pastoris ( ) in 3 L vessel bioreactor after achieving high cell density culture using BSM modified medium and glycerol consumption ( ). Temperature: 30°C, inoculum 0.82 g.L-1, pH 5.0, aeration 1 vvm of and 700 rpm (kLa=1.6x10² h-1) and initial volume 1,5 L. A) Glycerol batch phase with 40 g.L-1 glycerol for 20 h; B) Glycerol fed-batch phase at constant feed (13 mL.h-1)with glycerol solution 50% (w/m) with 0.325 g(NH4)2SO4.gglycerol
-1 and 15 mLPTM1.Lglycerol solution
-1 for 12 h; C) Starvation period of 2h to ensure total glycerol depletion; D) Induction fed-batch phase at 20°C, pH 6.0, with methanol solution (100% ,12 mLPTM1.Lmehtanol
-1) fed by two pulses (30 mL.L-1) controlled by DO (dissolved oxygen) spikes.
At 34 h of fermentation the culture was induced for 34 h. During the induction phase, low growth rate
was observed and by the end of which the ASNase levels reached 25.4 (U.gdcw-1) with a cell density of
82.5 gdcw.L-1..
The productivity of P. pastoris, in shake flasks is lower and is improved greatly by bioreactor culturing.
When compared with the periplasmic ASNase activity obtain in shaker that were induced with the same
amount of methanol, i.e. two pulses (30 mL.L-1), the activity levels achieved with the bioreactor more
than doubled.
4.2.5. ASNase production and kinetic parameters determination – pulses feeding
To obtain the kinetic parameters and biomass yields of the recombinant P. pastoris with methanol as
the sole carbon source and inductor was performed induction with multiple methanol pulses after high
cell density was achieved. Were used two small methanol (100%, 12 mLPTM1.Lmehtanol-1) pulses (5 mL.L-
1) so that the P. pastoris got used to the methanol, four medium methanol pulses (10 mL.L-1) controlled
0
5
10
15
20
25
30
35
40
45
0
10
20
30
40
50
60
70
80
90
0 10 20 30 40 50 60 70 80
[S]
g gly
cero
l.L-1
; A
: U
.g d
cw-1
[X]
g dcw
.L-
1
time (h)
A B C D
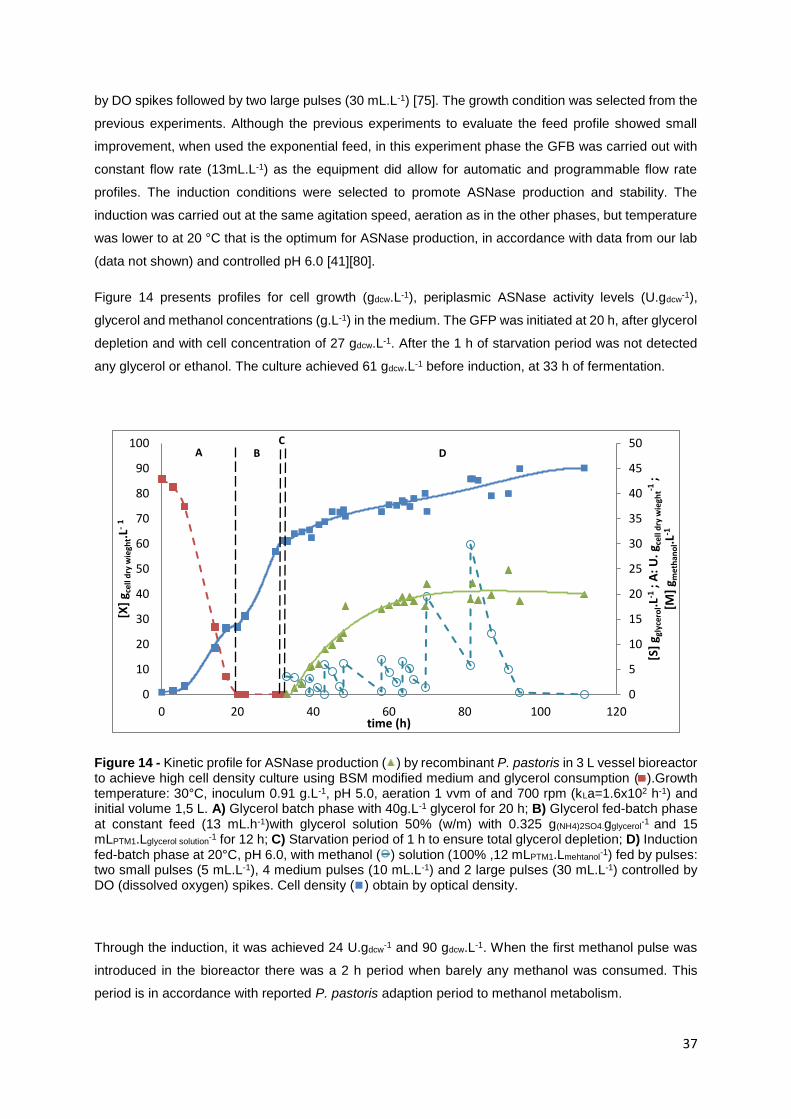
37
by DO spikes followed by two large pulses (30 mL.L-1) [75]. The growth condition was selected from the
previous experiments. Although the previous experiments to evaluate the feed profile showed small
improvement, when used the exponential feed, in this experiment phase the GFB was carried out with
constant flow rate (13mL.L-1) as the equipment did allow for automatic and programmable flow rate
profiles. The induction conditions were selected to promote ASNase production and stability. The
induction was carried out at the same agitation speed, aeration as in the other phases, but temperature
was lower to at 20 °C that is the optimum for ASNase production, in accordance with data from our lab
(data not shown) and controlled pH 6.0 [41][80].
Figure 14 presents profiles for cell growth (gdcw.L-1), periplasmic ASNase activity levels (U.gdcw-1),
glycerol and methanol concentrations (g.L-1) in the medium. The GFP was initiated at 20 h, after glycerol
depletion and with cell concentration of 27 gdcw.L-1. After the 1 h of starvation period was not detected
any glycerol or ethanol. The culture achieved 61 gdcw.L-1 before induction, at 33 h of fermentation.
Figure 14 - Kinetic profile for ASNase production ( ) by recombinant P. pastoris in 3 L vessel bioreactor to achieve high cell density culture using BSM modified medium and glycerol consumption ( ).Growth temperature: 30°C, inoculum 0.91 g.L-1, pH 5.0, aeration 1 vvm of and 700 rpm (kLa=1.6x10² h-1) and initial volume 1,5 L. A) Glycerol batch phase with 40g.L-1 glycerol for 20 h; B) Glycerol fed-batch phase at constant feed (13 mL.h-1)with glycerol solution 50% (w/m) with 0.325 g(NH4)2SO4.gglycerol
-1 and 15
mLPTM1.Lglycerol solution-1 for 12 h; C) Starvation period of 1 h to ensure total glycerol depletion; D) Induction
fed-batch phase at 20°C, pH 6.0, with methanol ( ) solution (100% ,12 mLPTM1.Lmehtanol-1) fed by pulses:
two small pulses (5 mL.L-1), 4 medium pulses (10 mL.L-1) and 2 large pulses (30 mL.L-1) controlled by DO (dissolved oxygen) spikes. Cell density ( ) obtain by optical density.
Through the induction, it was achieved 24 U.gdcw-1 and 90 gdcw.L-1. When the first methanol pulse was
introduced in the bioreactor there was a 2 h period when barely any methanol was consumed. This
period is in accordance with reported P. pastoris adaption period to methanol metabolism.
0
5
10
15
20
25
30
35
40
45
50
0
10
20
30
40
50
60
70
80
90
100
0 20 40 60 80 100 120
[S]
g gly
cero
l.L-1
; A
: U
.g c
ell d
ry w
iegh
t-1;
[M]
g met
han
ol.L
-1
[X]
g cel
l dry
wie
ght.L
-1
time (h)
C D B A
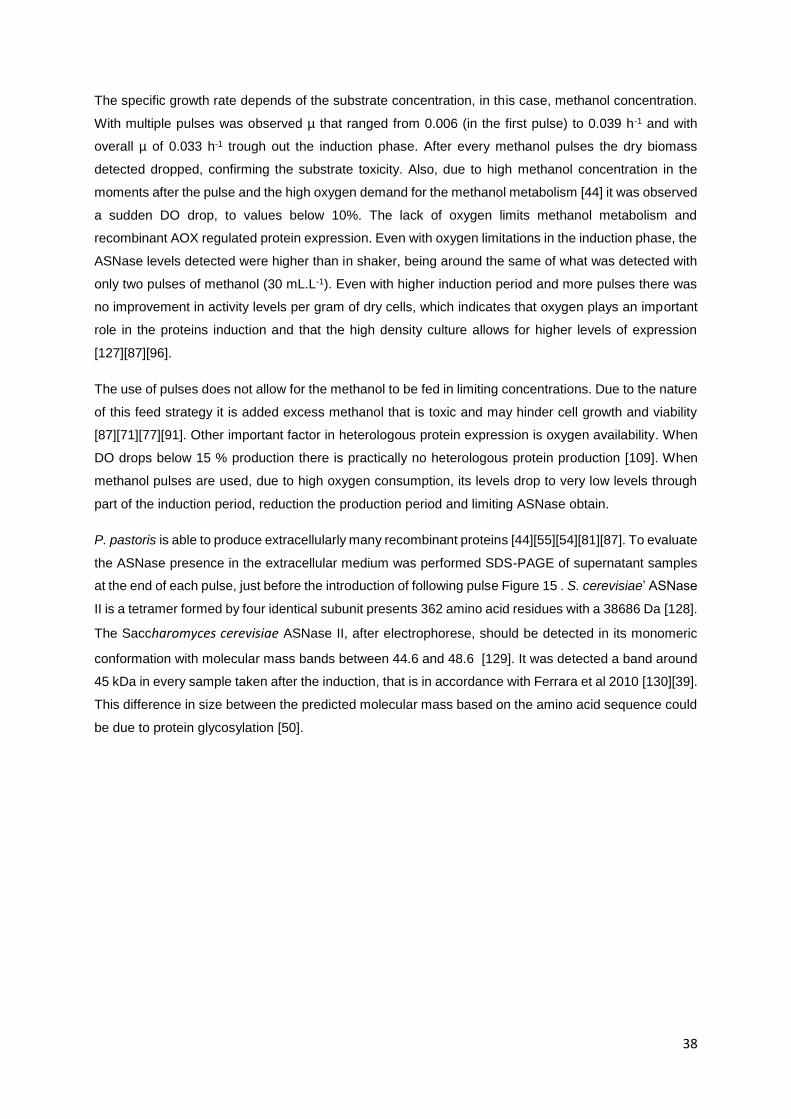
38
The specific growth rate depends of the substrate concentration, in this case, methanol concentration.
With multiple pulses was observed µ that ranged from 0.006 (in the first pulse) to 0.039 h-1 and with
overall µ of 0.033 h-1 trough out the induction phase. After every methanol pulses the dry biomass
detected dropped, confirming the substrate toxicity. Also, due to high methanol concentration in the
moments after the pulse and the high oxygen demand for the methanol metabolism [44] it was observed
a sudden DO drop, to values below 10%. The lack of oxygen limits methanol metabolism and
recombinant AOX regulated protein expression. Even with oxygen limitations in the induction phase, the
ASNase levels detected were higher than in shaker, being around the same of what was detected with
only two pulses of methanol (30 mL.L-1). Even with higher induction period and more pulses there was
no improvement in activity levels per gram of dry cells, which indicates that oxygen plays an important
role in the proteins induction and that the high density culture allows for higher levels of expression
[127][87][96].
The use of pulses does not allow for the methanol to be fed in limiting concentrations. Due to the nature
of this feed strategy it is added excess methanol that is toxic and may hinder cell growth and viability
[87][71][77][91]. Other important factor in heterologous protein expression is oxygen availability. When
DO drops below 15 % production there is practically no heterologous protein production [109]. When
methanol pulses are used, due to high oxygen consumption, its levels drop to very low levels through
part of the induction period, reduction the production period and limiting ASNase obtain.
P. pastoris is able to produce extracellularly many recombinant proteins [44][55][54][81][87]. To evaluate
the ASNase presence in the extracellular medium was performed SDS-PAGE of supernatant samples
at the end of each pulse, just before the introduction of following pulse Figure 15 . S. cerevisiae’ ASNase
II is a tetramer formed by four identical subunit presents 362 amino acid residues with a 38686 Da [128].
The Saccharomyces cerevisiae ASNase II, after electrophorese, should be detected in its monomeric
conformation with molecular mass bands between 44.6 and 48.6 [129]. It was detected a band around
45 kDa in every sample taken after the induction, that is in accordance with Ferrara et al 2010 [130][39].
This difference in size between the predicted molecular mass based on the amino acid sequence could
be due to protein glycosylation [50].
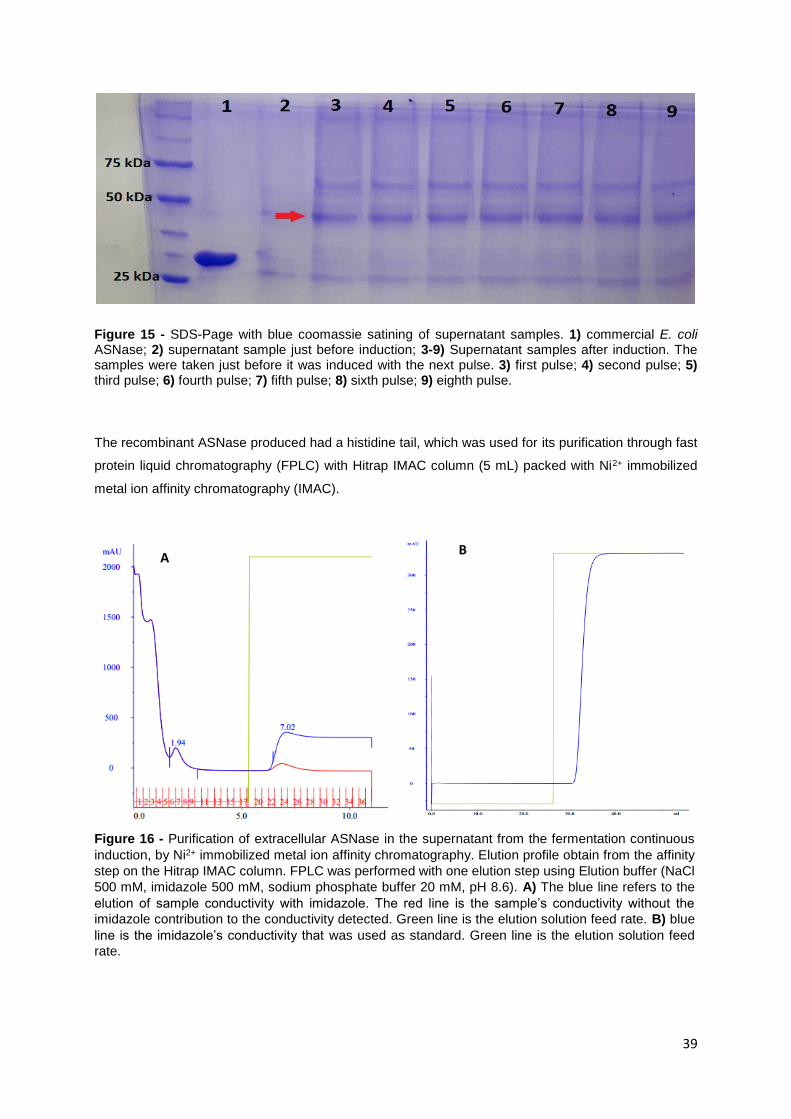
39
Figure 15 - SDS-Page with blue coomassie satining of supernatant samples. 1) commercial E. coli ASNase; 2) supernatant sample just before induction; 3-9) Supernatant samples after induction. The samples were taken just before it was induced with the next pulse. 3) first pulse; 4) second pulse; 5) third pulse; 6) fourth pulse; 7) fifth pulse; 8) sixth pulse; 9) eighth pulse.
The recombinant ASNase produced had a histidine tail, which was used for its purification through fast
protein liquid chromatography (FPLC) with Hitrap IMAC column (5 mL) packed with Ni2+ immobilized
metal ion affinity chromatography (IMAC).
A B
Figure 16 - Purification of extracellular ASNase in the supernatant from the fermentation continuous
induction, by Ni2+ immobilized metal ion affinity chromatography. Elution profile obtain from the affinity
step on the Hitrap IMAC column. FPLC was performed with one elution step using Elution buffer (NaCl
500 mM, imidazole 500 mM, sodium phosphate buffer 20 mM, pH 8.6). A) The blue line refers to the
elution of sample conductivity with imidazole. The red line is the sample’s conductivity without the
imidazole contribution to the conductivity detected. Green line is the elution solution feed rate. B) blue
line is the imidazole’s conductivity that was used as standard. Green line is the elution solution feed
rate.
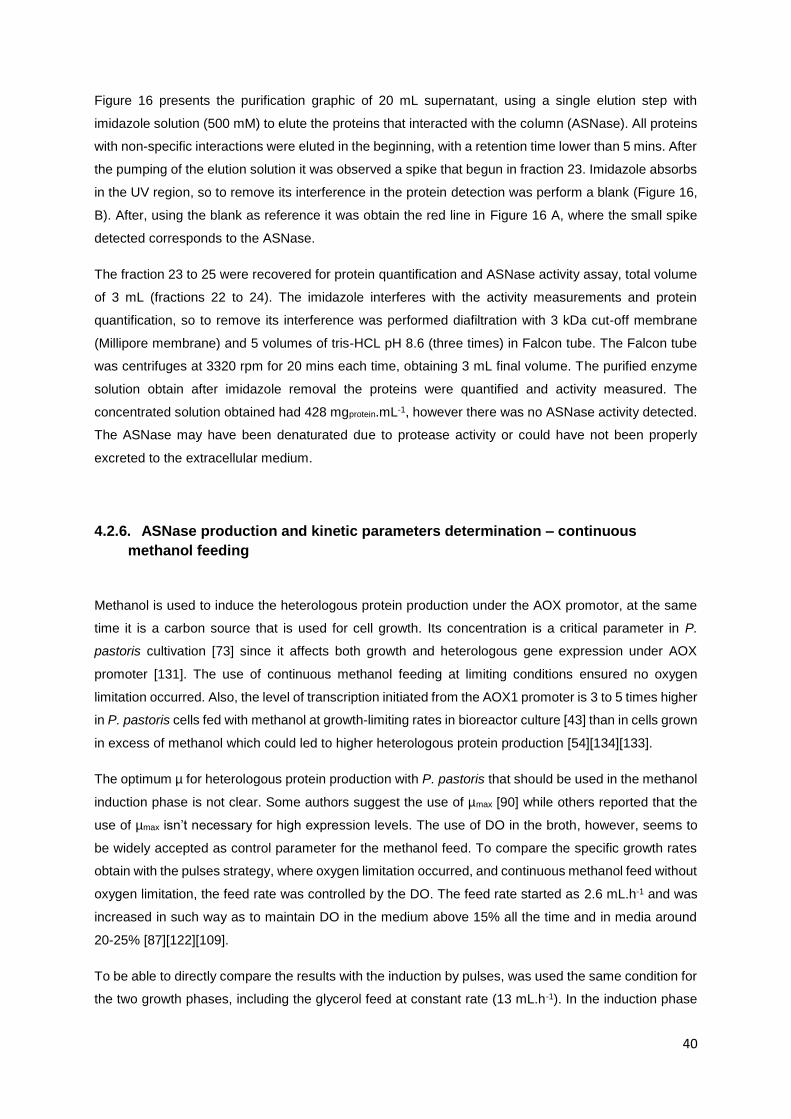
40
Figure 16 presents the purification graphic of 20 mL supernatant, using a single elution step with
imidazole solution (500 mM) to elute the proteins that interacted with the column (ASNase). All proteins
with non-specific interactions were eluted in the beginning, with a retention time lower than 5 mins. After
the pumping of the elution solution it was observed a spike that begun in fraction 23. Imidazole absorbs
in the UV region, so to remove its interference in the protein detection was perform a blank (Figure 16,
B). After, using the blank as reference it was obtain the red line in Figure 16 A, where the small spike
detected corresponds to the ASNase.
The fraction 23 to 25 were recovered for protein quantification and ASNase activity assay, total volume
of 3 mL (fractions 22 to 24). The imidazole interferes with the activity measurements and protein
quantification, so to remove its interference was performed diafiltration with 3 kDa cut-off membrane
(Millipore membrane) and 5 volumes of tris-HCL pH 8.6 (three times) in Falcon tube. The Falcon tube
was centrifuges at 3320 rpm for 20 mins each time, obtaining 3 mL final volume. The purified enzyme
solution obtain after imidazole removal the proteins were quantified and activity measured. The
concentrated solution obtained had 428 mgprotein.mL-1, however there was no ASNase activity detected.
The ASNase may have been denaturated due to protease activity or could have not been properly
excreted to the extracellular medium.
4.2.6. ASNase production and kinetic parameters determination – continuous
methanol feeding
Methanol is used to induce the heterologous protein production under the AOX promotor, at the same
time it is a carbon source that is used for cell growth. Its concentration is a critical parameter in P.
pastoris cultivation [73] since it affects both growth and heterologous gene expression under AOX
promoter [131]. The use of continuous methanol feeding at limiting conditions ensured no oxygen
limitation occurred. Also, the level of transcription initiated from the AOX1 promoter is 3 to 5 times higher
in P. pastoris cells fed with methanol at growth-limiting rates in bioreactor culture [43] than in cells grown
in excess of methanol which could led to higher heterologous protein production [54][134][133].
The optimum µ for heterologous protein production with P. pastoris that should be used in the methanol
induction phase is not clear. Some authors suggest the use of µmax [90] while others reported that the
use of µmax isn’t necessary for high expression levels. The use of DO in the broth, however, seems to
be widely accepted as control parameter for the methanol feed. To compare the specific growth rates
obtain with the pulses strategy, where oxygen limitation occurred, and continuous methanol feed without
oxygen limitation, the feed rate was controlled by the DO. The feed rate started as 2.6 mL.h-1 and was
increased in such way as to maintain DO in the medium above 15% all the time and in media around
20-25% [87][122][109].
To be able to directly compare the results with the induction by pulses, was used the same condition for
the two growth phases, including the glycerol feed at constant rate (13 mL.h-1). In the induction phase
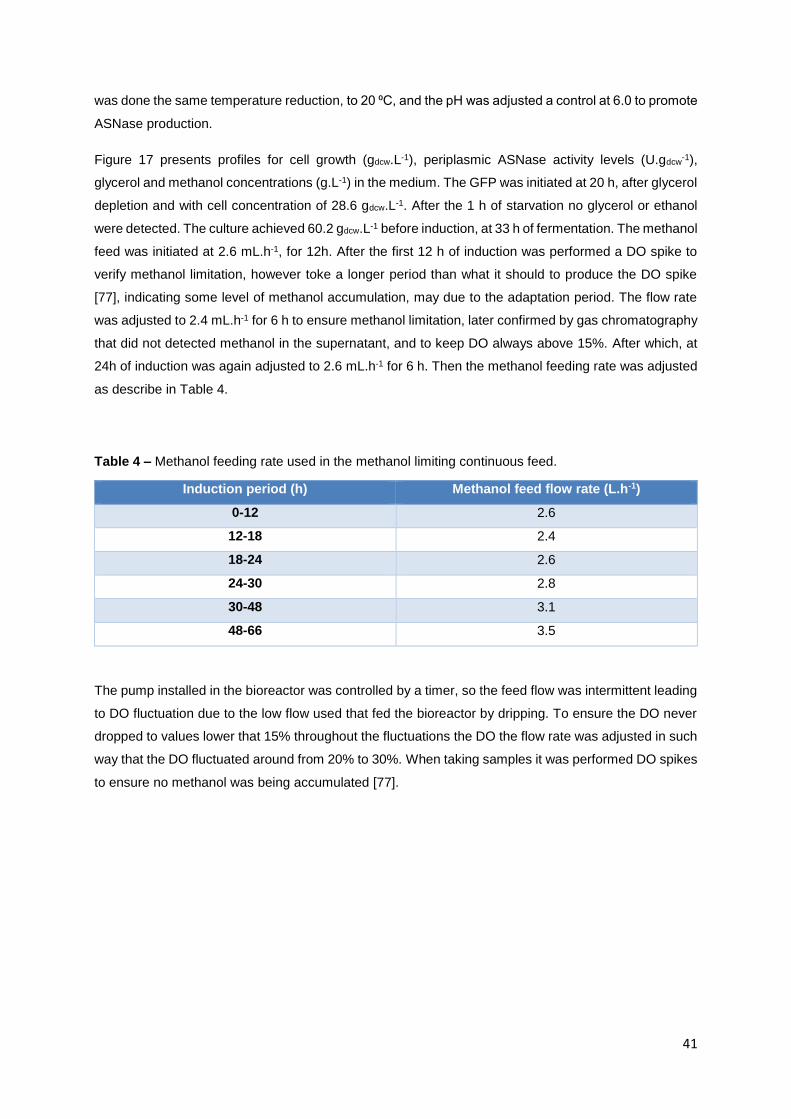
41
was done the same temperature reduction, to 20 ⁰C, and the pH was adjusted a control at 6.0 to promote
ASNase production.
Figure 17 presents profiles for cell growth (gdcw.L-1), periplasmic ASNase activity levels (U.gdcw-1),
glycerol and methanol concentrations (g.L-1) in the medium. The GFP was initiated at 20 h, after glycerol
depletion and with cell concentration of 28.6 gdcw.L-1. After the 1 h of starvation no glycerol or ethanol
were detected. The culture achieved 60.2 gdcw.L-1 before induction, at 33 h of fermentation. The methanol
feed was initiated at 2.6 mL.h-1, for 12h. After the first 12 h of induction was performed a DO spike to
verify methanol limitation, however toke a longer period than what it should to produce the DO spike
[77], indicating some level of methanol accumulation, may due to the adaptation period. The flow rate
was adjusted to 2.4 mL.h-1 for 6 h to ensure methanol limitation, later confirmed by gas chromatography
that did not detected methanol in the supernatant, and to keep DO always above 15%. After which, at
24h of induction was again adjusted to 2.6 mL.h-1 for 6 h. Then the methanol feeding rate was adjusted
as describe in Table 4.
Table 4 – Methanol feeding rate used in the methanol limiting continuous feed.
Induction period (h) Methanol feed flow rate (L.h-1)
0-12 2.6
12-18 2.4
18-24 2.6
24-30 2.8
30-48 3.1
48-66 3.5
The pump installed in the bioreactor was controlled by a timer, so the feed flow was intermittent leading
to DO fluctuation due to the low flow used that fed the bioreactor by dripping. To ensure the DO never
dropped to values lower that 15% throughout the fluctuations the DO the flow rate was adjusted in such
way that the DO fluctuated around from 20% to 30%. When taking samples it was performed DO spikes
to ensure no methanol was being accumulated [77].
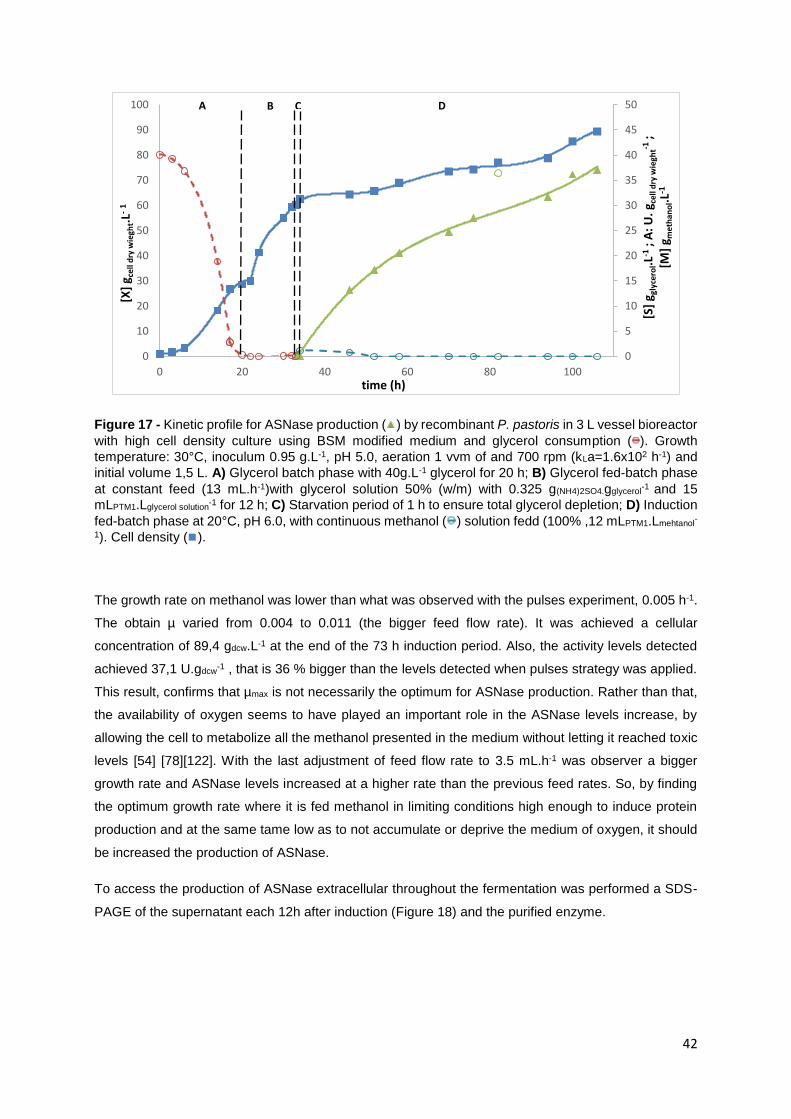
42
Figure 17 - Kinetic profile for ASNase production ( ) by recombinant P. pastoris in 3 L vessel bioreactor
with high cell density culture using BSM modified medium and glycerol consumption ( ). Growth
temperature: 30°C, inoculum 0.95 g.L-1, pH 5.0, aeration 1 vvm of and 700 rpm (kLa=1.6x10² h-1) and
initial volume 1,5 L. A) Glycerol batch phase with 40g.L-1 glycerol for 20 h; B) Glycerol fed-batch phase
at constant feed (13 mL.h-1)with glycerol solution 50% (w/m) with 0.325 g(NH4)2SO4.gglycerol-1
and 15
mLPTM1.Lglycerol solution-1 for 12 h; C) Starvation period of 1 h to ensure total glycerol depletion; D) Induction
fed-batch phase at 20°C, pH 6.0, with continuous methanol ( ) solution fedd (100% ,12 mLPTM1.Lmehtanol-
1). Cell density ( ).
The growth rate on methanol was lower than what was observed with the pulses experiment, 0.005 h-1.
The obtain µ varied from 0.004 to 0.011 (the bigger feed flow rate). It was achieved a cellular
concentration of 89,4 gdcw.L-1 at the end of the 73 h induction period. Also, the activity levels detected
achieved 37,1 U.gdcw-1 , that is 36 % bigger than the levels detected when pulses strategy was applied.
This result, confirms that µmax is not necessarily the optimum for ASNase production. Rather than that,
the availability of oxygen seems to have played an important role in the ASNase levels increase, by
allowing the cell to metabolize all the methanol presented in the medium without letting it reached toxic
levels [54] [78][122]. With the last adjustment of feed flow rate to 3.5 mL.h-1 was observer a bigger
growth rate and ASNase levels increased at a higher rate than the previous feed rates. So, by finding
the optimum growth rate where it is fed methanol in limiting conditions high enough to induce protein
production and at the same tame low as to not accumulate or deprive the medium of oxygen, it should
be increased the production of ASNase.
To access the production of ASNase extracellular throughout the fermentation was performed a SDS-
PAGE of the supernatant each 12h after induction (Figure 18) and the purified enzyme.
0
5
10
15
20
25
30
35
40
45
50
0
10
20
30
40
50
60
70
80
90
100
0 20 40 60 80 100
[S]
g gly
cero
l.L-1
; A
: U
.g c
ell
dry
wie
ght-1
; [M
] g m
eth
ano
l.L-1
[X]
g ce
ll d
ry w
iegh
t.L-
1
time (h)
B C A D
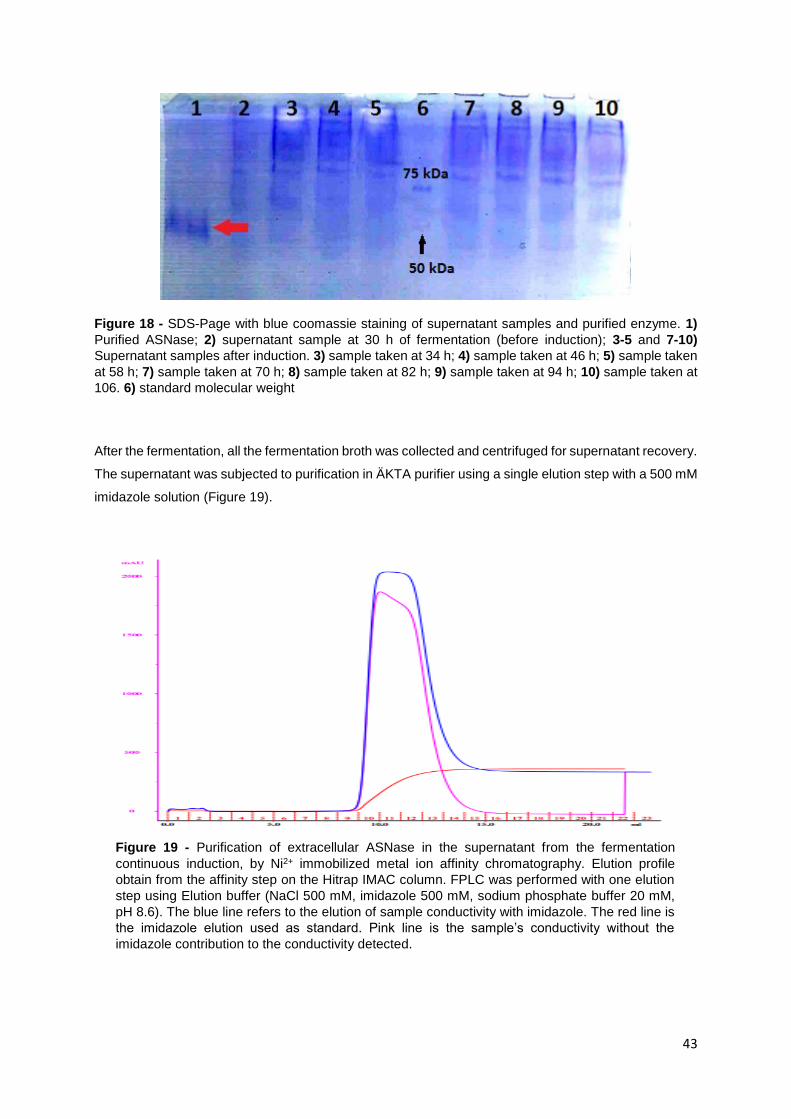
43
Figure 18 - SDS-Page with blue coomassie staining of supernatant samples and purified enzyme. 1)
Purified ASNase; 2) supernatant sample at 30 h of fermentation (before induction); 3-5 and 7-10)
Supernatant samples after induction. 3) sample taken at 34 h; 4) sample taken at 46 h; 5) sample taken
at 58 h; 7) sample taken at 70 h; 8) sample taken at 82 h; 9) sample taken at 94 h; 10) sample taken at
106. 6) standard molecular weight
After the fermentation, all the fermentation broth was collected and centrifuged for supernatant recovery.
The supernatant was subjected to purification in ÄKTA purifier using a single elution step with a 500 mM
imidazole solution (Figure 19).
Figure 19 - Purification of extracellular ASNase in the supernatant from the fermentation
continuous induction, by Ni2+ immobilized metal ion affinity chromatography. Elution profile
obtain from the affinity step on the Hitrap IMAC column. FPLC was performed with one elution
step using Elution buffer (NaCl 500 mM, imidazole 500 mM, sodium phosphate buffer 20 mM,
pH 8.6). The blue line refers to the elution of sample conductivity with imidazole. The red line is
the imidazole elution used as standard. Pink line is the sample’s conductivity without the
imidazole contribution to the conductivity detected.
44
After removing the imidazole, was measured the purified enzyme activity. There was no activity detected
after purification. So the enzyme produced may not been secreted correctly, the protease could have
denaturated them or throughout the purification process the enzymes were degraded. The pH change
to 6.0 caused some degree of precipitation, which could cause cell disruption and contamination of
secreted products with intracellular products with intracellular materials[83]. This phenomenon could
also explain the presence of L-asparaginase extracellular in the supernatant, even when in shaker none
was detected and the lack of activity. Also, the use methanol limiting feed ensured that the methanol did not
reach toxic levels. Thus, it can be hypnotized that this caused lower cell death and that was the reason for the lack
of mass bands in the unpurified samples (Figure 18) while it was present for the purified concentrated sample and
in the pulses experiment (Figure 15), i.e., the ASNase in the extracellular medium may be due to cell lyses.
Enzyme yield per dry cell mass reached 37 U.gdcw-1 with no active enzyme detected in the supernatant,
resulted in a volumetric yield 3315 U.L-1 and global volumetric productivity of 31 U.L-1.h-1. Despite the
relatively lower ASNase to biomass yield than that of nitrogen de-repressed strain of S. cerevisiae ure2
dal80 (106 U.gdcw-1) [42], the ability to reach high cell density during the fermentative growth allowed
a higher volumetric productivities.
45
5. Conclusions
The goal of this project is to obtain a viable industrial process for the production of the therapeutic drug
L-asparaginase. For that purpose, was studied its production in methylotrophic yeast P. pastoris
recombinant system with ASP3 gene that encodes for the ASNase II from S. cerevisiae, having the
objective of developing a process to achieve high cell density concentration and obtaining the kinetic
parameter for further process development.
The product levels of 37 U.g-1 in periplasmic activity were achieved by the production process designed,
representing a volumetric yield 3315 U.L-1 and global volumetric productivity of 31 U.L-1.h-1.
In the first approach, flask cultures were used with two separate study phases: medium evaluation and
selection, and medium modification. The use of the BSM medium in shaker was difficult, as the pH had
to be corrected after heat sterilization, which did not allow for precise pH values. However the BSM
medium allows for a better yield biomass to carbon source and is widely accepted medium for the growth
of P. pastoris, as it is a cheap defined medium that supports high cell concentration (above 100 gdcw.L-
1). Comparing the complex medium with the defined medium, similar results were observed in biomass
yields for BSM media was achieved around 0.84 gdcw.Cmol while for complex media was 0.55 gdcw.Cmol.
As P. pastoris is able to grow in a large pH range (3.0-7.0) [39][40] the lack of buffering power in the
defined medium did not pose a problem in the shaker experiments. However, the low pH greatly
influenced the ASNase activity, that was fully inactivated at pH lower than 3.2 [125]. To improve ASNase
activity levels obtain in shaker were evaluated the effected of casein and CSP supplementation in
buffered complex media, to avoid the problems with ASNase inactivity due to low pH. Even so, the
supplementation did not have any effect, so they weren’t added to the medium modifications for the
following study phases.
The defined medium used was a modified version of the traditional BSM medium described in the P.
pastoris handbook, from Invitrogen™[54]. This modified version replaced the volatile ammonium
hydroxide, which was used simultaneously as pH corrector and as nitrogen source, by ammonium
sulfate. By evaluating up to 20 g.L-1 of ammonium sulfate it was not detected any toxic effect due to
ammonium concentration. The use of the lower ammonium concentration (13 g.L-1) was selected to
decrease reagent costs as it showed similar results to the higher concentration tested, demonstrating
that no nitrogen limitation occurred.
To develop a process for the recombinant Pichia pastoris and obtain the kinetic parameter and biomass
yields, was separated in three phases: I) kLa conditions, where it was determined the optimum aeration
and agitation conditions for the recombinant P. pastoris with glycerol (40 g.L-1) as the sole carbon source
were 700 rpm and 1 vvm. II) Development of glycerol feed strategy to achieve high cell densities under
glycerol limitation to avoid secondary metabolites accumulation. III) Methanol induction of ASNase
46
production to obtain the kinetic parameters that would allow for further process development, by
developing an optimum methanol feed strategy and control.
Thought the glycerol batch experiments was selected the conditions that allowed for higher biomass
productivity, which was the better medium oxygenation condition. The specific growth rate obtain was
0.21 h-1 with a biomass yield of 0.77%. By assuming these values constant in exponential microbial
growth was developed two strategies for limiting glycerol feed. Both strategies proved successful in
achieved high cell density, with 68.3 gdcw.L-1 and 65.8 gdcw.L-1 for the exponential feed rate and for the
constant feed rate respectively. The glycerol limitation was confirmed by its concentration
measurements with values near zero. With glycerol limiting feeding rate, the production of ethanol was
very low, with concentration lower than 0.2 g.L-1. However, the glycerol feed profile developed did not
take in account the maintenance coefficient that at high cell densities cannot be ignored, leading to lower
yields (0.51 g.gglycerol-1 for the constant feed rate and 0.55 for the exponential feed rate) than the
theoretical yields used (0.77 g.gglycerol-1).
By using the starvation period before methanol feed, was ensured that there was no AOX repression
due to the presence of ethanol or residual glycerol left from the GFP, which was confirmed by off line
measurements.
Using methanol pulses was obtained the maximum of growth rate of 0.013 for the conditions used, with
methanol no limiting concentrations. At the same time was observed adaptation period of 2 h to
methanol feed, when there was low or no methanol consumption. The growth rates obtained with the
pulses strategy fall in the typical range for MUTs P. pastoris with methanol as sole carbon source. The
growth rate values obtain under oxygen limitation might increase by increasing the kLa in the induction
phase.
The use of continuous methanol feed allowed having a better control of methanol concentration in the
medium. The use of DO spikes to ensure methanol limitation and the use of DO in the medium to indicate
the methanol feed rate increases in such way that the methanol was always the limiting substrate. As
there was no oxygen limitation, the methanol metabolism was not hindered, which reflected in higher
ASNase levels detected. In accordance with the literature, this leads to the conclusion that not only
methanol concentration but also the oxygen availability in the induction phase is crucial for high
recombinant protein production under the AOX regulation.
On both methanol feed strategies were detected ASNase in the supernatant, indicating its extracellular
production. However, in both cases there was no activity detected. The lack of activity might be
speculated that was due to incorrect protein secretion, protease activity or even due to cell lise.
With the limiting methanol continuous feed was achieved higher volumetric yield (3315 U.L-1) in
comparison to that of nitrogen derepressed strain of S. cerevisiae ure2 dal80 (265 U.L-1) [42].
However, even with the 3 times increase in activity levels detect in bioreactor, it was not enough to reach
the value range of Ferrara et al 2006 (800 U g−1) [80]. This great difference was already evident at the
47
shaker scale and was greatly amplified in the bioreactor, which indicates use of different recombinant
P. pastoris may be behind this difference. To achieve better asparaginase yields, the strain used should
be improved. However, these values are not fully comparable since assay conditions were different.
In summary, the key findings of the thesis were as follows:
I) The use of glycerol in limiting concentration in the fed batch phase gave production only to
low concentration of ethanol (0.2 g.L-1)
II) Oxygen concentration is a crucial factor though out all the fermentation, in the growth phase
to avoid secondary metabolites production and its accumulation, and in the induction phase
by playing a crucial role in the methanol metabolism;
III) The use of methanol pulses is simple strategy for recombinant protein production and
allowed to obtain the kinetic parameters with methanol as sole carbon source as reported
by Dietzsch et al 2011. [134]
IV) The methanol concentration in medium though out the induction phase plays a crucial role
in the heterologous protein expression. However, the concentration of oxygen does not lose
in terms of importance. For microbial processes the oxygen transfer rate was the limiting
parameter that is even more evident for this system were high cell concentration and high
oxygen consuming methanol metabolism are used. At low oxygen concentration, the
production of heterologous proteins is hinder.
The development of processes for microbial high cell density cultivation are challenging in this system
and further optimization of the relevant bioprocess variables, such as methanol feed, dissolved oxygen
levels by using control methodologies to maintain optimum conditions and different induction strategies
might increase ASNase levels.
48
6. Recommendations
The recombinant P. pastoris used was able to achieve high cell density and produce ASNase. However,
Ferrara et al 2006 reported higher levels of expression, even in the shaker experiments. Therefore, it
should be developed a new P. pastoris recombinant with better expression levels.
The GFP phase could be improved by testing the maximum limiting glycerol concentration to achieve
even high cellular concentration, which by itself would improve ASNase production.
The induction phase is the most crucial part of ASNase production. If the equipment is available, it
should be evaluated the performance with different controlled feed strategies. However, it should be
developed a simple induction strategy by studying the optimum µ for ASNase production using
continuous methanol feed with rational feed profile.
49
7. Bibliography
[1] V. D. S. Serafim, “Projeto visa desenvolvimento de tecnologia para a produção nacional de medicamento contra leucemia.” [Online]. Available: http://www.usp.br/aun/exibir?id=7738.
[2] YouGov, “YouGov _ Cancer Britons most feared disease.” [Online]. Available: https://yougov.co.uk/news/2011/08/15/cancer-britons-most-feared-disease/.
[3] N. F. Grigoropoulos, R. Petter, M. B. Van ’t Veer, M. A. Scott, and G. A. Follows, “Leukaemia update. Part 1: diagnosis and management.,” BMJ, vol. 346, no. March, p. f1660, 2013.
[4] B. L. Asselin, P. Gaynon, and J. a Whitlock, “Recent advances in acute lymphoblastic leukemia in children and adolescents: an expert panel discussion.,” Curr. Opin. Oncol., vol. 25 Suppl 3,
no. Suppl 3, pp. S1-13–6, 2013.
[5] M. Hiroto Inaba, MD, Prof.Mel Greaves, PhD, and Charles G.Mullighan, “Acute Lymphoblastic Leukemia,” Lancet, vol. 381, no. 9881, pp. 1–27, 2013.
[6] European Environment and Health Information System, “Incidence of Childhood Leukaemia,” vol. 2000, no. December, 2009.
[7] C.-H. Pui, L. L. Robison, and A. T. Look, “Acute lymphoblastic leukaemia.,” Lancet, vol. 371, no.
9617, pp. 1030–43, 2008.
[8] Instituto Nacional de Câncer José Alencar Gomes da Silva, Estimativa 2016. 2016.
[9] C. G. Mullighan and C. L. Willman, “Advances in the Biology of Acute Lymphoblastic Leukemia-From Genomics to the Clinic.,” J. Adolesc. Young Adult Oncol., vol. 1, no. 2, pp. 77–86, 2011.
[10] U. States, “Acute Lymphoblastic Leukemia ( ALL ) Fact Sheet,” pp. 20–21, 2011.
[11] L. N. Ramya, M. Doble, V. P. B. Rekha, and K. K. Pulicherla, “L-asparaginase as potent anti-leukemic agent and its significance of having reduced glutaminase side activity for better treatment of acute lymphoblastic leukaemia,” Appl. Biochem. Biotechnol., vol. 167, no. 8, pp.
2144–2159, 2012.
[12] C. H. Pui, C. G. Mullighan, W. E. Evans, and M. V. Relling, “Pediatric acute lymphoblastic leukemia: Where are we going and how do we get there?,” Blood, vol. 120, no. 6, pp. 1165–1174, 2012.
[13] American Cancer Society, “Cancer Facts & Figures 2015,” Cancer Facts Fig. 2015, pp. 1–9, 2015.
[14] R. Masetti and A. Pession, “First-line treatment of acute lymphoblastic leukemia with pegasparaginase.,” Biologics, vol. 3, pp. 359–368, 2009.
[15] S. Farber, L. K. Diamon, R. D. Mercer, R. F. Sylvester, and J. A. Wolf, “Temporary Remissions in Acute Leukemia in Children produced by folic acid antafonist, 4-aminopteroyl-glutamic acid (aminopterin),” N. Engl. J. Med., vol. 238, no. 23, pp. 787–793, 1948.
[16] C.-H. Pui and E. E. Evans, “A 50-Year Journey to Cure Childhood Acute Lymphoblastic Leukemia,” 2013.
[17] R. J. A. Aur, J. Simone, H. O. Hustu, T. Walters, L. Borella, C. Pratt, and P. Donald, “Central Nervous System Therapy and Combination Chemothreapy of Childhod Lymphocytic Leukemia,” Blood J., vol. 37, no. 3, pp. 272–281, 1971.
[18] D. Pinkel, “Five-year follow-up of ‘total therapy’ of childhood lymphocytic leukemia.,” JAMA, vol.
216, no. 4, pp. 648–52, 1971.
[19] S. E. Sallan, S. Hitchcock-Bryan, R. Gelber, J. R. Cassady, E. Frei, and D. G. Nathan, “Influence
50
of intensive asparaginase in the treatment of childhood non T cell acute lymphoblastic leukemia,” Cancer Res, vol. 43, no. 11, pp. 5601–5607, 1983.
[20] B. P. Jakubas, M. Krawczyk-Kuliś, S. Giebel, M. Adamczyk-Cioch, A. Czyż, E. Lech-marańda,
M. Paluszewska, G. Pałynyczko, J. Piszcz, and J. Hołowiecki, “Use of L ‑ asparaginase in acute lymphoblastic leukemia: recommendations of the Polish Adult Leukemia Group,” Pol. Arch. Med. WEWNĘTRZNEJ, vol. 118, no. 11, pp. 664–668, 2008.
[21] J. A. Ortega, M. E. Nesbit Jr., M. H. Donaldson, R. E. Hittle, J. Weiner, M. Karon, and D. Hammond, “L-Asparaginase, vincristine, and prednisone for induction of first remission in acute lymphocytic leukemia,” Cancer Res, vol. 37, no. 2, pp. 535–540, 1977.
[22] P. Song, L. Ye, J. Fan, Y. Li, X. Zeng, Z. Wang, S. Wang, G. Zhang, P. Yang, Z. Cao, and D. Ju, “Asparaginase induces apoptosis and cytoprotective autophagy in chronic myeloid leukemia cells.,” Oncotarget, vol. 6, no. 6, pp. 3861–73, 2015.
[23] A. Clementi, “La Désamidation Enzymatique de ‘Asparagine Chez Les Différentes Espèces Animales et la signification Physiologique de sa présence dans l’Organisme,” Arch. Int. Physiol.,
vol. 19, no. 4, pp. 369–372, 1922.
[24] A. M. Lopes, L. de Oliveira-Nascimento, A. Ribeiro, C. A. Tairum, C. A. Breyer, M. A. de Oliveira, G. Monteiro, C. M. de Souza-Motta, P. de O. Magalhães, J. G. F. Avendaño, A. M. Cavaco-Paulo, P. G. Mazzola, C. de O. Rangel-Yagui, L. D. Sette, A. Converti, and A. Pessoa, “Therapeutic <scp>l</scp> -asparaginase: upstream, downstream and beyond,” Crit. Rev. Biotechnol., no. December, pp. 1–18, 2015.
[25] U. K. Narta, S. S. Kanwar, and W. Azmi, “Pharmacological and clinical evaluation of l-asparaginase in the treatment of leukemia,” Crit. Rev. Oncol. Hematol., vol. 61, no. 3, pp. 208–
221, 2007.
[26] U. Ali, M. Naveed, A. Ullah, K. Ali, S. Afzal, S. Fahad, and A. Samad, “L-asparaginase as a critical component to combat Acute Lymphoblastic Leukaemia ( ALL ): A novel approach to target ALL,” Eur. J. Pharmacol., vol. 771, pp. 199–210, 2016.
[27] J. D. Broome, “Evidence That L-asparaginase of Guinea Pig Serum is responsible for its antilympoma effects,” J. Exp. Med., vol. 118, no. 1, pp. 99–120, 1963.
[28] J. G. Kidd, “Regretion of transplanted lymphomas induced in vivo by means of normall guinea pig serum,” J. Exp. Med., vol. 8, pp. 583–605, 1953.
[29] N. R. E. and T. A. McCoy, “Dual Requirement of Walke Carcinosarcoma 256 in vitro for Asparagine and glutamine,” Science (80-. )., vol. 124, pp. 124–125, 1956.
[30] A. Shrivastava, A. A. Khan, M. Khurshid, M. A. Kalam, S. K. Jain, and P. K. Singhal, “Recent developments in l-asparaginase discovery and its potential as anticancer agent.,” Crit. Rev. Oncol. Hematol., pp. 1–12, 2015.
[31] S. Yadav, S. K. Verma, J. Singh, and A. Kumar, “Industrial Production and Clinical Application of L-Asparaginase : A Chemotherapeutic Agent,” Int. Sch. Sci. Res. Innov., vol. 8, no. 1, pp. 54–
60, 2014.
[32] J. D. Kawedia and M. E. Rytting, “Asparaginase in acute lymphoblastic leukemia,” Clin. Lymphoma, Myeloma Leuk., vol. 14, no. September, pp. S14–S17, 2014.
[33] G. H. Wegner, “Emerging applications of the methylotrophic yeast,” FEMS Microbiol Rev, vol.
87, pp. 279–284, 1990.
[34] L. T. Mashburn and J. C. Wriston, “Tumor Inhibitory Effect of L-Asparaginase From Escherichia Coli.,” Arch. Biochem. Biophys., vol. 105, pp. 450–452, 1964.
[35] R. Pieters, S. P. Hunger, J. Boos, C. Rizzari, L. Silverman, A. Baruchel, N. Goekbuget, M. Schrappe, and C.-H. Pui, “L-asparaginase treatment in acute lymphoblastic leukemia: a focus
51
on Erwinia asparaginase,” Cancer, vol. 117, no. 2, pp. 238–249, 2011.
[36] A. L. Soares, G. M. Guimarães, B. Polakiewicz, R. N. D. M. Pitombo, and J. Abrahão-Neto, “Effects of polyethylene glycol attachment on physicochemical and biological stability of E. coli L-asparaginase,” Int. J. Pharm., vol. 237, no. 1–2, pp. 163–170, 2002.
[37] P. C. Dunlop, G. M. Meyer, D. Ban, and R. J. Roon, “Characterization of two forms of asparaginase in Saccharomyces cerevisiae,” J. Biol. Chem., vol. 253, no. 4, pp. 1297–1304, 1978.
[38] J. M. Cregg, T. S. Vedvick, and W. C. Raschke, “Recent advances in the expression of foreign genes in Pichia pastoris,” Biotechnology, vol. 11, pp. 905–910, 1993.
[39] P. C. Dunlop, G. M. Meyer, D. Ban, and R. J. Roon, “Characterization of two forms of asparaginase in Saccharomyces cerevisiae,” J. Biol. Chem., vol. 253, no. 4, pp. 1297–1304,
1977.
[40] G. E. Jones, “Genetic and physiologival relationships between L-asparaginase I and asparaginase II in Sacharomyces cerevisiae,” J. Bacteriol., vol. 130, no. 1, pp. 128–130, 1977.
[41] P. C. Dunlop, G. M. Meyer, and R. J. Roon, “Reactions of Asparaginase II of Saccharomyces cerevisiae,” J. Biol. Chem., vol. 255, no. 4, pp. 1542–1546, 1980.
[42] M. A. Ferrara, “Produção de asparaginase por Saccharomyces cerevisiae e por expressão heteróloga do gene ASP3 em Pichia pastoris,” Universidade Federal do Rio de Janeiro, 2004.
[43] G. P. L. Cereghino and J. M. Cregg, “Applications of yeast in biotechnology : protein production and genetic analysis,” Curr. Opin. Biotechonology, vol. 10, no. 5, pp. 422–427, 1999.
[44] M. A. Gleeson and P. E. Sudbery, “The Methylotrophic Yeasts,” yeast, vol. 4, pp. 1–15, 1988.
[45] K. N. Faber, W. Harder, G. Ab, and M. Veenhuis, “Review: methylotrophic yeasts as factories for the production of foreign proteins.,” Yeast, vol. 11, no. 14, pp. 1331–44, 1995.
[46] M. Ahmad, M. Hirz, and H. Pichler, “Protein expression in Pichia pastoris : recent achievements and perspectives for heterologous protein production,” Appl. Microbiol. Biotechnol., pp. 5301–
5317, 2014.
[47] J. L. Cereghino and J. M. Cregg, “Heterologous protein expression in the methylotrophic yeast Pichia pastoris,” FEMS Microbiol. Rev., vol. 24, no. 1, pp. 45–66, 2000.
[48] G. Lin Cereghino, J. Lin Cereghino, A. Sunga, M. Johnson, M. Lim, M. Gleeson, and J. Cregg, “New selectablemarker/auxotrophic host strain combinations formolecu- lar genetic manipulation of Pichia pastoris.,” Gene, vol. 263, pp. 159–169, 2001.
[49] A. Itzel, P. D. L. Santos, M. Cayetano-cruz, M. Gutiérrez-antón, A. Santiago-hernández, M. Plascencia-espinosa, A. Farrés, and M. E. Hidalgo-lara, “Enzyme and Microbial Technology Improvement of catalytical properties of two invertases highly tolerant to sucrose after expression in Pichia pastoris . Effect of glycosylation on enzyme properties,” Enzyme Microb. Technol., vol. 83, pp. 48–56, 2016.
[50] W. Sun, Y. Lai, H. Li, T. Nie, Y. Kuang, X. Tang, K. Li, P. R. Dunbar, A. Xu, P. Li, and D. Wu, “High level expression and puri fi cation of active recombinant human interleukin-15 in Pichia pastoris,” J. Immunol. Methods, vol. 428, pp. 50–57, 2016.
[51] S. Macauley-Patrick, M. L. Fazenda, B. McNeil, and L. M. Harvey, “Heterologous protein production using the Pichia pastoris expression system,” Yeast, vol. 22, no. 4, pp. 249–270,
2005.
[52] G. Degani, M. Colzani, A. Tettamanzi, L. Sorrentino, A. Aliverti, G. Fritz, G. Aldini, and L. Popolo, “An improved expression system for the VC1 ligand binding domain of the receptor for advanced glycation end products in Pichia pastoris,” PROTEIN Expr. Purif., vol. 114, pp. 48–57, 2015.
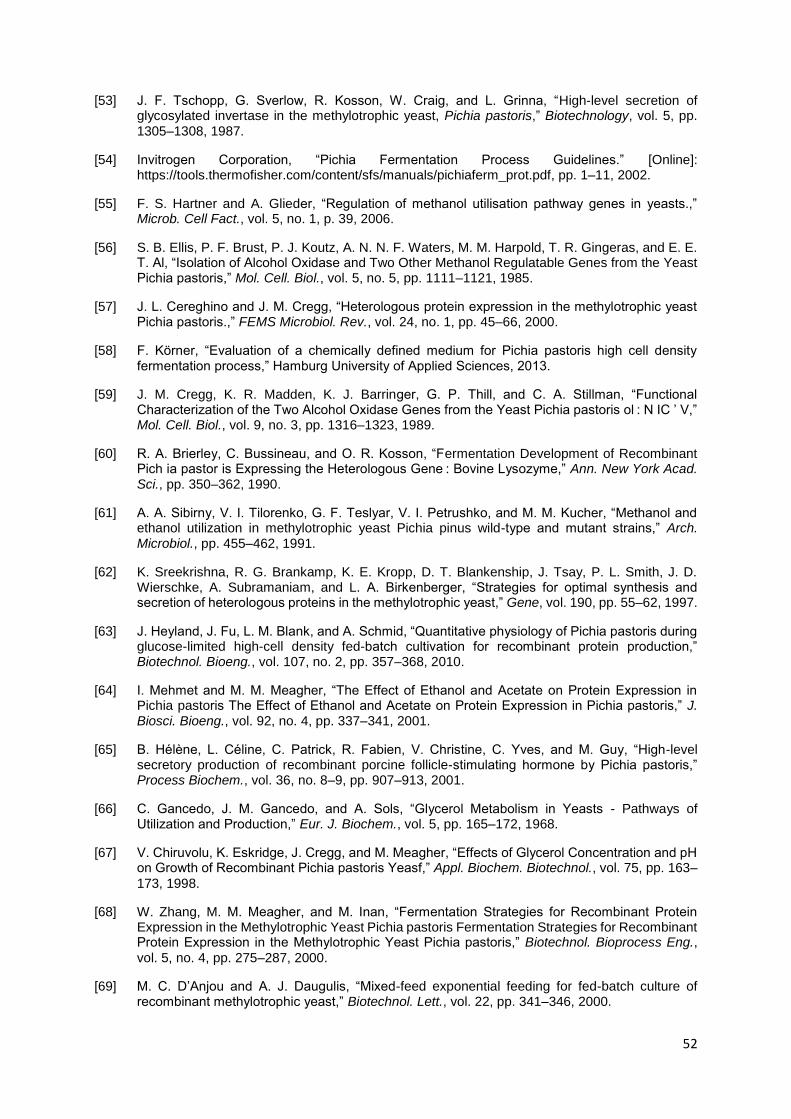
52
[53] J. F. Tschopp, G. Sverlow, R. Kosson, W. Craig, and L. Grinna, “High-level secretion of glycosylated invertase in the methylotrophic yeast, Pichia pastoris,” Biotechnology, vol. 5, pp. 1305–1308, 1987.
[54] Invitrogen Corporation, “Pichia Fermentation Process Guidelines.” [Online]: https://tools.thermofisher.com/content/sfs/manuals/pichiaferm_prot.pdf, pp. 1–11, 2002.
[55] F. S. Hartner and A. Glieder, “Regulation of methanol utilisation pathway genes in yeasts.,” Microb. Cell Fact., vol. 5, no. 1, p. 39, 2006.
[56] S. B. Ellis, P. F. Brust, P. J. Koutz, A. N. N. F. Waters, M. M. Harpold, T. R. Gingeras, and E. E. T. Al, “Isolation of Alcohol Oxidase and Two Other Methanol Regulatable Genes from the Yeast Pichia pastoris,” Mol. Cell. Biol., vol. 5, no. 5, pp. 1111–1121, 1985.
[57] J. L. Cereghino and J. M. Cregg, “Heterologous protein expression in the methylotrophic yeast Pichia pastoris.,” FEMS Microbiol. Rev., vol. 24, no. 1, pp. 45–66, 2000.
[58] F. Körner, “Evaluation of a chemically defined medium for Pichia pastoris high cell density fermentation process,” Hamburg University of Applied Sciences, 2013.
[59] J. M. Cregg, K. R. Madden, K. J. Barringer, G. P. Thill, and C. A. Stillman, “Functional Characterization of the Two Alcohol Oxidase Genes from the Yeast Pichia pastoris ol : N IC ’ V,” Mol. Cell. Biol., vol. 9, no. 3, pp. 1316–1323, 1989.
[60] R. A. Brierley, C. Bussineau, and O. R. Kosson, “Fermentation Development of Recombinant Pich ia pastor is Expressing the Heterologous Gene : Bovine Lysozyme,” Ann. New York Acad. Sci., pp. 350–362, 1990.
[61] A. A. Sibirny, V. I. Tilorenko, G. F. Teslyar, V. I. Petrushko, and M. M. Kucher, “Methanol and ethanol utilization in methylotrophic yeast Pichia pinus wild-type and mutant strains,” Arch. Microbiol., pp. 455–462, 1991.
[62] K. Sreekrishna, R. G. Brankamp, K. E. Kropp, D. T. Blankenship, J. Tsay, P. L. Smith, J. D. Wierschke, A. Subramaniam, and L. A. Birkenberger, “Strategies for optimal synthesis and secretion of heterologous proteins in the methylotrophic yeast,” Gene, vol. 190, pp. 55–62, 1997.
[63] J. Heyland, J. Fu, L. M. Blank, and A. Schmid, “Quantitative physiology of Pichia pastoris during glucose-limited high-cell density fed-batch cultivation for recombinant protein production,” Biotechnol. Bioeng., vol. 107, no. 2, pp. 357–368, 2010.
[64] I. Mehmet and M. M. Meagher, “The Effect of Ethanol and Acetate on Protein Expression in Pichia pastoris The Effect of Ethanol and Acetate on Protein Expression in Pichia pastoris,” J. Biosci. Bioeng., vol. 92, no. 4, pp. 337–341, 2001.
[65] B. Hélène, L. Céline, C. Patrick, R. Fabien, V. Christine, C. Yves, and M. Guy, “High-level secretory production of recombinant porcine follicle-stimulating hormone by Pichia pastoris,” Process Biochem., vol. 36, no. 8–9, pp. 907–913, 2001.
[66] C. Gancedo, J. M. Gancedo, and A. Sols, “Glycerol Metabolism in Yeasts - Pathways of Utilization and Production,” Eur. J. Biochem., vol. 5, pp. 165–172, 1968.
[67] V. Chiruvolu, K. Eskridge, J. Cregg, and M. Meagher, “Effects of Glycerol Concentration and pH on Growth of Recombinant Pichia pastoris Yeasf,” Appl. Biochem. Biotechnol., vol. 75, pp. 163–
173, 1998.
[68] W. Zhang, M. M. Meagher, and M. Inan, “Fermentation Strategies for Recombinant Protein Expression in the Methylotrophic Yeast Pichia pastoris Fermentation Strategies for Recombinant Protein Expression in the Methylotrophic Yeast Pichia pastoris,” Biotechnol. Bioprocess Eng.,
vol. 5, no. 4, pp. 275–287, 2000.
[69] M. C. D’Anjou and A. J. Daugulis, “Mixed-feed exponential feeding for fed-batch culture of recombinant methylotrophic yeast,” Biotechnol. Lett., vol. 22, pp. 341–346, 2000.
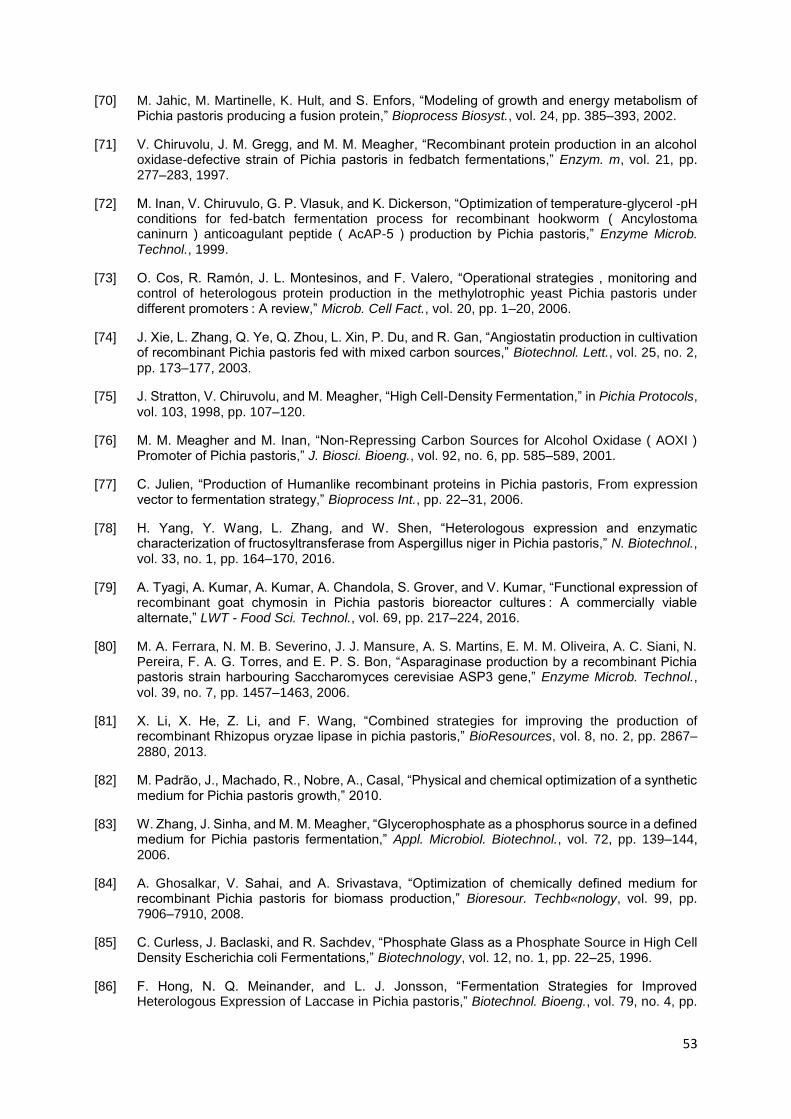
53
[70] M. Jahic, M. Martinelle, K. Hult, and S. Enfors, “Modeling of growth and energy metabolism of Pichia pastoris producing a fusion protein,” Bioprocess Biosyst., vol. 24, pp. 385–393, 2002.
[71] V. Chiruvolu, J. M. Gregg, and M. M. Meagher, “Recombinant protein production in an alcohol oxidase-defective strain of Pichia pastoris in fedbatch fermentations,” Enzym. m, vol. 21, pp. 277–283, 1997.
[72] M. Inan, V. Chiruvulo, G. P. Vlasuk, and K. Dickerson, “Optimization of temperature-glycerol -pH conditions for fed-batch fermentation process for recombinant hookworm ( Ancylostoma caninurn ) anticoagulant peptide ( AcAP-5 ) production by Pichia pastoris,” Enzyme Microb. Technol., 1999.
[73] O. Cos, R. Ramón, J. L. Montesinos, and F. Valero, “Operational strategies , monitoring and control of heterologous protein production in the methylotrophic yeast Pichia pastoris under different promoters : A review,” Microb. Cell Fact., vol. 20, pp. 1–20, 2006.
[74] J. Xie, L. Zhang, Q. Ye, Q. Zhou, L. Xin, P. Du, and R. Gan, “Angiostatin production in cultivation of recombinant Pichia pastoris fed with mixed carbon sources,” Biotechnol. Lett., vol. 25, no. 2,
pp. 173–177, 2003.
[75] J. Stratton, V. Chiruvolu, and M. Meagher, “High Cell-Density Fermentation,” in Pichia Protocols,
vol. 103, 1998, pp. 107–120.
[76] M. M. Meagher and M. Inan, “Non-Repressing Carbon Sources for Alcohol Oxidase ( AOXI ) Promoter of Pichia pastoris,” J. Biosci. Bioeng., vol. 92, no. 6, pp. 585–589, 2001.
[77] C. Julien, “Production of Humanlike recombinant proteins in Pichia pastoris, From expression vector to fermentation strategy,” Bioprocess Int., pp. 22–31, 2006.
[78] H. Yang, Y. Wang, L. Zhang, and W. Shen, “Heterologous expression and enzymatic characterization of fructosyltransferase from Aspergillus niger in Pichia pastoris,” N. Biotechnol., vol. 33, no. 1, pp. 164–170, 2016.
[79] A. Tyagi, A. Kumar, A. Kumar, A. Chandola, S. Grover, and V. Kumar, “Functional expression of recombinant goat chymosin in Pichia pastoris bioreactor cultures : A commercially viable alternate,” LWT - Food Sci. Technol., vol. 69, pp. 217–224, 2016.
[80] M. A. Ferrara, N. M. B. Severino, J. J. Mansure, A. S. Martins, E. M. M. Oliveira, A. C. Siani, N. Pereira, F. A. G. Torres, and E. P. S. Bon, “Asparaginase production by a recombinant Pichia pastoris strain harbouring Saccharomyces cerevisiae ASP3 gene,” Enzyme Microb. Technol.,
vol. 39, no. 7, pp. 1457–1463, 2006.
[81] X. Li, X. He, Z. Li, and F. Wang, “Combined strategies for improving the production of recombinant Rhizopus oryzae lipase in pichia pastoris,” BioResources, vol. 8, no. 2, pp. 2867–
2880, 2013.
[82] M. Padrão, J., Machado, R., Nobre, A., Casal, “Physical and chemical optimization of a synthetic medium for Pichia pastoris growth,” 2010.
[83] W. Zhang, J. Sinha, and M. M. Meagher, “Glycerophosphate as a phosphorus source in a defined medium for Pichia pastoris fermentation,” Appl. Microbiol. Biotechnol., vol. 72, pp. 139–144,
2006.
[84] A. Ghosalkar, V. Sahai, and A. Srivastava, “Optimization of chemically defined medium for recombinant Pichia pastoris for biomass production,” Bioresour. Techb«nology, vol. 99, pp. 7906–7910, 2008.
[85] C. Curless, J. Baclaski, and R. Sachdev, “Phosphate Glass as a Phosphate Source in High Cell Density Escherichia coli Fermentations,” Biotechnology, vol. 12, no. 1, pp. 22–25, 1996.
[86] F. Hong, N. Q. Meinander, and L. J. Jonsson, “Fermentation Strategies for Improved Heterologous Expression of Laccase in Pichia pastoris,” Biotechnol. Bioeng., vol. 79, no. 4, pp.
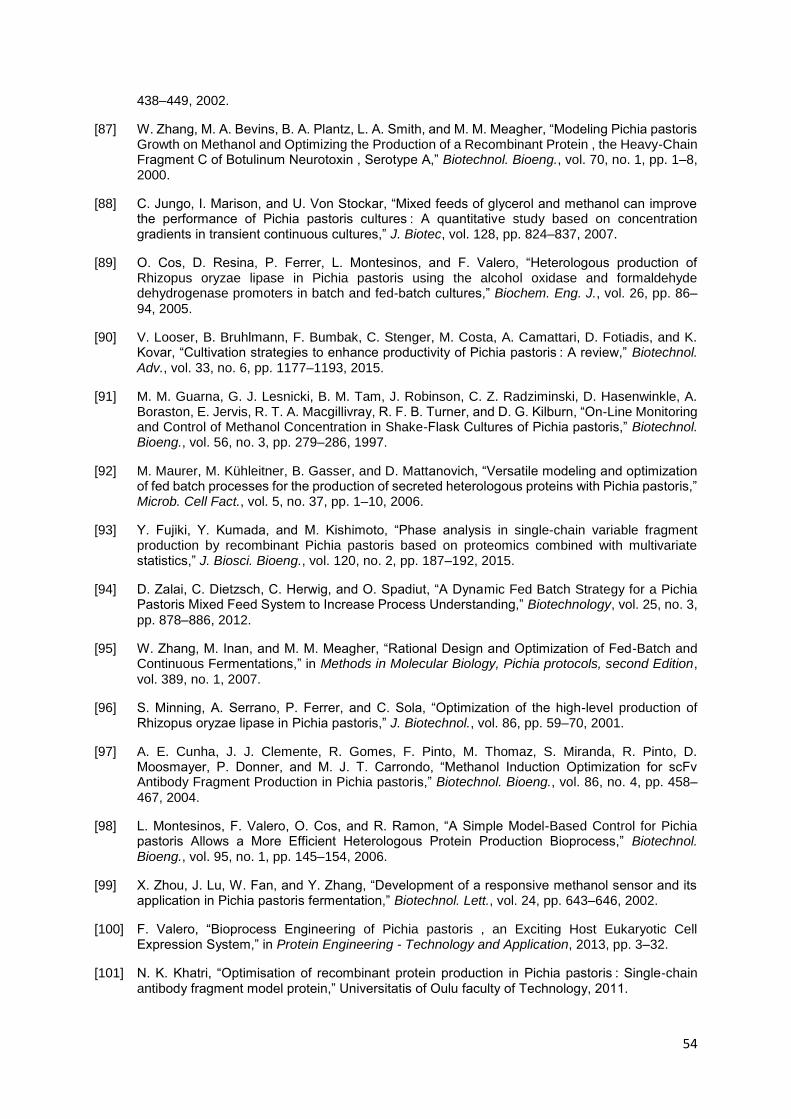
54
438–449, 2002.
[87] W. Zhang, M. A. Bevins, B. A. Plantz, L. A. Smith, and M. M. Meagher, “Modeling Pichia pastoris Growth on Methanol and Optimizing the Production of a Recombinant Protein , the Heavy-Chain Fragment C of Botulinum Neurotoxin , Serotype A,” Biotechnol. Bioeng., vol. 70, no. 1, pp. 1–8, 2000.
[88] C. Jungo, I. Marison, and U. Von Stockar, “Mixed feeds of glycerol and methanol can improve the performance of Pichia pastoris cultures : A quantitative study based on concentration gradients in transient continuous cultures,” J. Biotec, vol. 128, pp. 824–837, 2007.
[89] O. Cos, D. Resina, P. Ferrer, L. Montesinos, and F. Valero, “Heterologous production of Rhizopus oryzae lipase in Pichia pastoris using the alcohol oxidase and formaldehyde dehydrogenase promoters in batch and fed-batch cultures,” Biochem. Eng. J., vol. 26, pp. 86–
94, 2005.
[90] V. Looser, B. Bruhlmann, F. Bumbak, C. Stenger, M. Costa, A. Camattari, D. Fotiadis, and K. Kovar, “Cultivation strategies to enhance productivity of Pichia pastoris : A review,” Biotechnol. Adv., vol. 33, no. 6, pp. 1177–1193, 2015.
[91] M. M. Guarna, G. J. Lesnicki, B. M. Tam, J. Robinson, C. Z. Radziminski, D. Hasenwinkle, A. Boraston, E. Jervis, R. T. A. Macgillivray, R. F. B. Turner, and D. G. Kilburn, “On-Line Monitoring and Control of Methanol Concentration in Shake-Flask Cultures of Pichia pastoris,” Biotechnol. Bioeng., vol. 56, no. 3, pp. 279–286, 1997.
[92] M. Maurer, M. Kühleitner, B. Gasser, and D. Mattanovich, “Versatile modeling and optimization of fed batch processes for the production of secreted heterologous proteins with Pichia pastoris,” Microb. Cell Fact., vol. 5, no. 37, pp. 1–10, 2006.
[93] Y. Fujiki, Y. Kumada, and M. Kishimoto, “Phase analysis in single-chain variable fragment production by recombinant Pichia pastoris based on proteomics combined with multivariate statistics,” J. Biosci. Bioeng., vol. 120, no. 2, pp. 187–192, 2015.
[94] D. Zalai, C. Dietzsch, C. Herwig, and O. Spadiut, “A Dynamic Fed Batch Strategy for a Pichia Pastoris Mixed Feed System to Increase Process Understanding,” Biotechnology, vol. 25, no. 3,
pp. 878–886, 2012.
[95] W. Zhang, M. Inan, and M. M. Meagher, “Rational Design and Optimization of Fed-Batch and Continuous Fermentations,” in Methods in Molecular Biology, Pichia protocols, second Edition,
vol. 389, no. 1, 2007.
[96] S. Minning, A. Serrano, P. Ferrer, and C. Sola, “Optimization of the high-level production of Rhizopus oryzae lipase in Pichia pastoris,” J. Biotechnol., vol. 86, pp. 59–70, 2001.
[97] A. E. Cunha, J. J. Clemente, R. Gomes, F. Pinto, M. Thomaz, S. Miranda, R. Pinto, D. Moosmayer, P. Donner, and M. J. T. Carrondo, “Methanol Induction Optimization for scFv Antibody Fragment Production in Pichia pastoris,” Biotechnol. Bioeng., vol. 86, no. 4, pp. 458–
467, 2004.
[98] L. Montesinos, F. Valero, O. Cos, and R. Ramon, “A Simple Model-Based Control for Pichia pastoris Allows a More Efficient Heterologous Protein Production Bioprocess,” Biotechnol. Bioeng., vol. 95, no. 1, pp. 145–154, 2006.
[99] X. Zhou, J. Lu, W. Fan, and Y. Zhang, “Development of a responsive methanol sensor and its application in Pichia pastoris fermentation,” Biotechnol. Lett., vol. 24, pp. 643–646, 2002.
[100] F. Valero, “Bioprocess Engineering of Pichia pastoris , an Exciting Host Eukaryotic Cell Expression System,” in Protein Engineering - Technology and Application, 2013, pp. 3–32.
[101] N. K. Khatri, “Optimisation of recombinant protein production in Pichia pastoris : Single-chain antibody fragment model protein,” Universitatis of Oulu faculty of Technology, 2011.
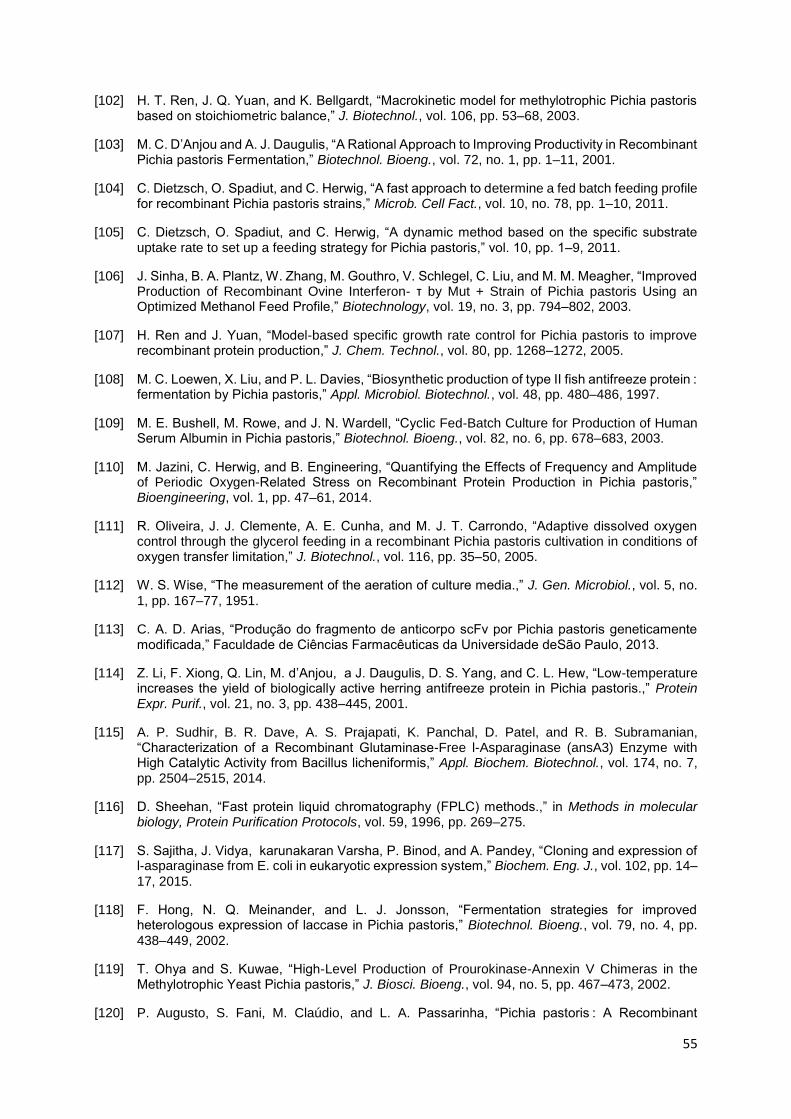
55
[102] H. T. Ren, J. Q. Yuan, and K. Bellgardt, “Macrokinetic model for methylotrophic Pichia pastoris based on stoichiometric balance,” J. Biotechnol., vol. 106, pp. 53–68, 2003.
[103] M. C. D’Anjou and A. J. Daugulis, “A Rational Approach to Improving Productivity in Recombinant Pichia pastoris Fermentation,” Biotechnol. Bioeng., vol. 72, no. 1, pp. 1–11, 2001.
[104] C. Dietzsch, O. Spadiut, and C. Herwig, “A fast approach to determine a fed batch feeding profile for recombinant Pichia pastoris strains,” Microb. Cell Fact., vol. 10, no. 78, pp. 1–10, 2011.
[105] C. Dietzsch, O. Spadiut, and C. Herwig, “A dynamic method based on the specific substrate uptake rate to set up a feeding strategy for Pichia pastoris,” vol. 10, pp. 1–9, 2011.
[106] J. Sinha, B. A. Plantz, W. Zhang, M. Gouthro, V. Schlegel, C. Liu, and M. M. Meagher, “Improved Production of Recombinant Ovine Interferon- τ by Mut + Strain of Pichia pastoris Using an Optimized Methanol Feed Profile,” Biotechnology, vol. 19, no. 3, pp. 794–802, 2003.
[107] H. Ren and J. Yuan, “Model-based specific growth rate control for Pichia pastoris to improve recombinant protein production,” J. Chem. Technol., vol. 80, pp. 1268–1272, 2005.
[108] M. C. Loewen, X. Liu, and P. L. Davies, “Biosynthetic production of type II fish antifreeze protein : fermentation by Pichia pastoris,” Appl. Microbiol. Biotechnol., vol. 48, pp. 480–486, 1997.
[109] M. E. Bushell, M. Rowe, and J. N. Wardell, “Cyclic Fed-Batch Culture for Production of Human Serum Albumin in Pichia pastoris,” Biotechnol. Bioeng., vol. 82, no. 6, pp. 678–683, 2003.
[110] M. Jazini, C. Herwig, and B. Engineering, “Quantifying the Effects of Frequency and Amplitude of Periodic Oxygen-Related Stress on Recombinant Protein Production in Pichia pastoris,” Bioengineering, vol. 1, pp. 47–61, 2014.
[111] R. Oliveira, J. J. Clemente, A. E. Cunha, and M. J. T. Carrondo, “Adaptive dissolved oxygen control through the glycerol feeding in a recombinant Pichia pastoris cultivation in conditions of oxygen transfer limitation,” J. Biotechnol., vol. 116, pp. 35–50, 2005.
[112] W. S. Wise, “The measurement of the aeration of culture media.,” J. Gen. Microbiol., vol. 5, no.
1, pp. 167–77, 1951.
[113] C. A. D. Arias, “Produção do fragmento de anticorpo scFv por Pichia pastoris geneticamente modificada,” Faculdade de Ciências Farmacêuticas da Universidade deSão Paulo, 2013.
[114] Z. Li, F. Xiong, Q. Lin, M. d’Anjou, a J. Daugulis, D. S. Yang, and C. L. Hew, “Low-temperature increases the yield of biologically active herring antifreeze protein in Pichia pastoris.,” Protein Expr. Purif., vol. 21, no. 3, pp. 438–445, 2001.
[115] A. P. Sudhir, B. R. Dave, A. S. Prajapati, K. Panchal, D. Patel, and R. B. Subramanian, “Characterization of a Recombinant Glutaminase-Free l-Asparaginase (ansA3) Enzyme with High Catalytic Activity from Bacillus licheniformis,” Appl. Biochem. Biotechnol., vol. 174, no. 7, pp. 2504–2515, 2014.
[116] D. Sheehan, “Fast protein liquid chromatography (FPLC) methods.,” in Methods in molecular biology, Protein Purification Protocols, vol. 59, 1996, pp. 269–275.
[117] S. Sajitha, J. Vidya, karunakaran Varsha, P. Binod, and A. Pandey, “Cloning and expression of l-asparaginase from E. coli in eukaryotic expression system,” Biochem. Eng. J., vol. 102, pp. 14–
17, 2015.
[118] F. Hong, N. Q. Meinander, and L. J. Jonsson, “Fermentation strategies for improved heterologous expression of laccase in Pichia pastoris,” Biotechnol. Bioeng., vol. 79, no. 4, pp.
438–449, 2002.
[119] T. Ohya and S. Kuwae, “High-Level Production of Prourokinase-Annexin V Chimeras in the Methylotrophic Yeast Pichia pastoris,” J. Biosci. Bioeng., vol. 94, no. 5, pp. 467–473, 2002.
[120] P. Augusto, S. Fani, M. Claúdio, and L. A. Passarinha, “Pichia pastoris : A Recombinant
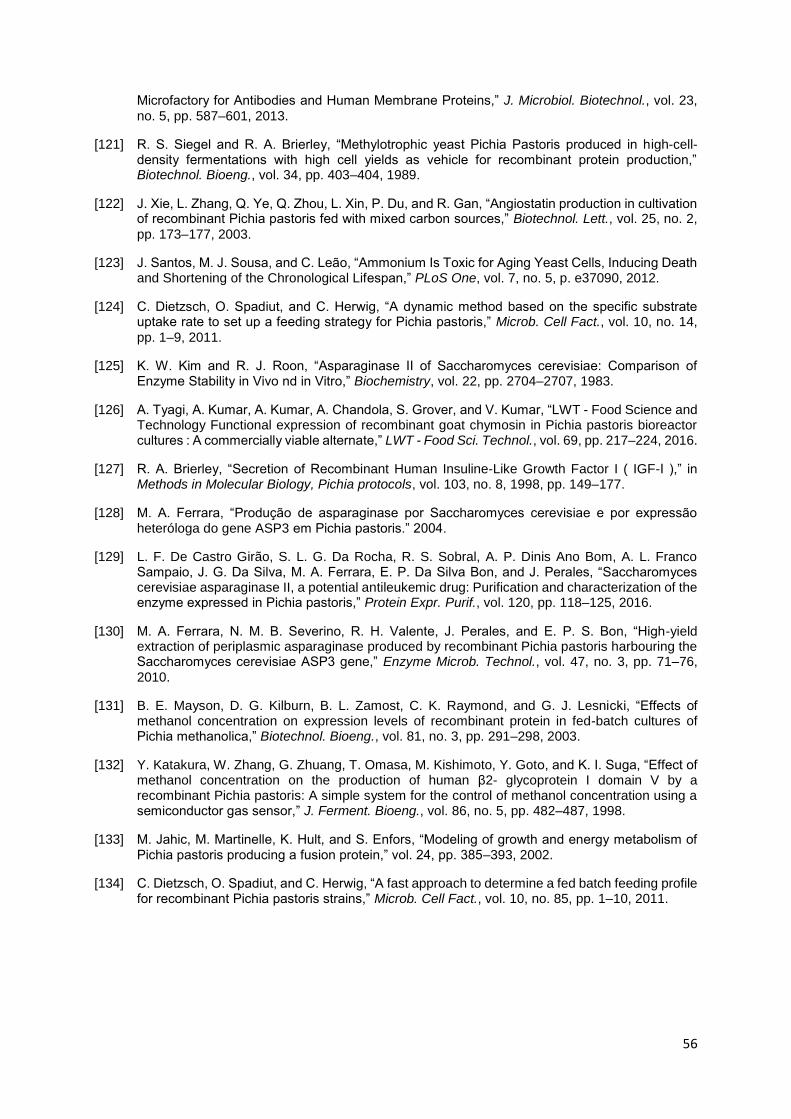
56
Microfactory for Antibodies and Human Membrane Proteins,” J. Microbiol. Biotechnol., vol. 23,
no. 5, pp. 587–601, 2013.
[121] R. S. Siegel and R. A. Brierley, “Methylotrophic yeast Pichia Pastoris produced in high-cell-density fermentations with high cell yields as vehicle for recombinant protein production,” Biotechnol. Bioeng., vol. 34, pp. 403–404, 1989.
[122] J. Xie, L. Zhang, Q. Ye, Q. Zhou, L. Xin, P. Du, and R. Gan, “Angiostatin production in cultivation of recombinant Pichia pastoris fed with mixed carbon sources,” Biotechnol. Lett., vol. 25, no. 2,
pp. 173–177, 2003.
[123] J. Santos, M. J. Sousa, and C. Leão, “Ammonium Is Toxic for Aging Yeast Cells, Inducing Death and Shortening of the Chronological Lifespan,” PLoS One, vol. 7, no. 5, p. e37090, 2012.
[124] C. Dietzsch, O. Spadiut, and C. Herwig, “A dynamic method based on the specific substrate uptake rate to set up a feeding strategy for Pichia pastoris,” Microb. Cell Fact., vol. 10, no. 14,
pp. 1–9, 2011.
[125] K. W. Kim and R. J. Roon, “Asparaginase II of Saccharomyces cerevisiae: Comparison of Enzyme Stability in Vivo nd in Vitro,” Biochemistry, vol. 22, pp. 2704–2707, 1983.
[126] A. Tyagi, A. Kumar, A. Kumar, A. Chandola, S. Grover, and V. Kumar, “LWT - Food Science and Technology Functional expression of recombinant goat chymosin in Pichia pastoris bioreactor cultures : A commercially viable alternate,” LWT - Food Sci. Technol., vol. 69, pp. 217–224, 2016.
[127] R. A. Brierley, “Secretion of Recombinant Human Insuline-Like Growth Factor I ( IGF-I ),” in Methods in Molecular Biology, Pichia protocols, vol. 103, no. 8, 1998, pp. 149–177.
[128] M. A. Ferrara, “Produção de asparaginase por Saccharomyces cerevisiae e por expressão heteróloga do gene ASP3 em Pichia pastoris.” 2004.
[129] L. F. De Castro Girão, S. L. G. Da Rocha, R. S. Sobral, A. P. Dinis Ano Bom, A. L. Franco Sampaio, J. G. Da Silva, M. A. Ferrara, E. P. Da Silva Bon, and J. Perales, “Saccharomyces cerevisiae asparaginase II, a potential antileukemic drug: Purification and characterization of the enzyme expressed in Pichia pastoris,” Protein Expr. Purif., vol. 120, pp. 118–125, 2016.
[130] M. A. Ferrara, N. M. B. Severino, R. H. Valente, J. Perales, and E. P. S. Bon, “High-yield extraction of periplasmic asparaginase produced by recombinant Pichia pastoris harbouring the Saccharomyces cerevisiae ASP3 gene,” Enzyme Microb. Technol., vol. 47, no. 3, pp. 71–76,
2010.
[131] B. E. Mayson, D. G. Kilburn, B. L. Zamost, C. K. Raymond, and G. J. Lesnicki, “Effects of methanol concentration on expression levels of recombinant protein in fed-batch cultures of Pichia methanolica,” Biotechnol. Bioeng., vol. 81, no. 3, pp. 291–298, 2003.
[132] Y. Katakura, W. Zhang, G. Zhuang, T. Omasa, M. Kishimoto, Y. Goto, and K. I. Suga, “Effect of methanol concentration on the production of human β2- glycoprotein I domain V by a recombinant Pichia pastoris: A simple system for the control of methanol concentration using a semiconductor gas sensor,” J. Ferment. Bioeng., vol. 86, no. 5, pp. 482–487, 1998.
[133] M. Jahic, M. Martinelle, K. Hult, and S. Enfors, “Modeling of growth and energy metabolism of Pichia pastoris producing a fusion protein,” vol. 24, pp. 385–393, 2002.
[134] C. Dietzsch, O. Spadiut, and C. Herwig, “A fast approach to determine a fed batch feeding profile for recombinant Pichia pastoris strains,” Microb. Cell Fact., vol. 10, no. 85, pp. 1–10, 2011.
57
Appendices
Appendix A: Pichia pastoris recombinant strain and BMY’s components analytical composition
Table 5 - Carbon and nitrogen elementary composition analysis of BMY compounds Central Analítica
do Instituto de química from Universidade de São Paulo
Compound Carbon* (%) Nitrogen* (%)
Yeast extract (Difco) 38,92 ± 0,50 10,94 ± 0,13
Peptona Bacto (Difco) 43,25 ± 0,30 14,92 ± 0,13
Casamioacids (Difco) 33,26 ± 0,23 10,74 ± 0,95
YNB (Difco) 0,21 ± 0,22 15,71 ± 0,89
*results media (n=3) ± standard deviation
Table 6 - Elementary composition of yeast Pichia pastoris recombinant strain by Central Analítica do
Instituto de química from Universidade de São Paulo
Elements Yeast composition
(% m/m)
C 42.705000
O 36.400000
N 7.575000
H 6.535000
S 0.258500
K 3.097500
Na 0.010800
Ca 0.008430
P 1.974000
Mg 0.210500
Fe 0.000001
Cu 0.000002
Mn 0.000001
others 1.225200