A resurrection experiment finds evidence of bothreduced genetic diversity and potential adaptiveevolution in the agricultural weed Ipomoea purpurea
ADAM KUESTER,* ARIANA WILSON,* SHU-MEI CHANG† and REGINA S. BAUCOM*
*Department of Ecology and Evolutionary Biology, University of Michigan, 2059 Kraus Natural Science Building, 830 North
University, Ann Arbor, MI 48109, USA, †Plant Biology Department, University of Georgia, 2502 Plant Sciences Building, 120
Carlton Street, Athens, GA 30602, USA
Abstract
Despite the negative economic and ecological impact of weeds, relatively little is
known about the evolutionary mechanisms that influence their persistence in agricul-
tural fields. Here, we use a resurrection approach to examine the potential for geno-
typic and phenotypic evolution in Ipomoea purpurea, an agricultural weed that is
resistant to glyphosate, the most widely used herbicide in current-day agriculture. We
found striking reductions in allelic diversity between cohorts sampled nine years apart
(2003 vs. 2012), suggesting that populations of this species sampled from agricultural
fields have experienced genetic bottleneck events that have led to lower neutral genetic
diversity. Heterozygosity excess tests indicate that these bottlenecks may have occurred
prior to 2003. A greenhouse assay of individuals sampled from the field as seed found
that populations of this species, on average, exhibited modest increases in herbicide
resistance over time. However, populations differed significantly between sampling
years for resistance: some populations maintained high resistance between the sam-
pling years whereas others exhibited increased or decreased resistance. Our results
show that populations of this noxious weed, capable of adapting to strong selection
imparted by herbicide application, may lose genetic variation as a result of this or
other environmental factors. We probably uncovered only modest increases in resis-
tance on average between sampling cohorts due to a strong and previously identified
fitness cost of resistance in this species, along with the potential that nonresistant
migrants germinate from the seed bank.
Keywords: agriculture, allelic diversity, genetic drift, selection, temporal evolution
Received 11 September 2015; revision received 30 May 2016; accepted 22 June 2016
Introduction
The influence of human-mediated selection is perhaps
nowhere more prevalent than in the agricultural sys-
tem. Agricultural weeds, in particular, provide excellent
case studies of adaptation to human-mediated selection
(Baker 1974). They are exposed to fertilizers, herbicides,
irrigation, as well as variable cropping techniques, and
these manipulations can impose frequent, strong and
highly predictable disturbance regimes (Barrett 1988).
Examples of rapid adaptation to these scenarios are
present in the literature from early cases of crop mimi-
cry (Baker 1974; Barrett 1983) to the many recent exam-
ples of the evolution of herbicide resistance (Barrett
1988). Weedy plants, broadly defined as ‘plants that are
growing out of place’ (Kuester et al. 2014), are models
for understanding rapid evolution and persistence in
stressful environments. We currently have a limited
understanding, however, of the broad genetic changes
that may influence weed populations growing in
agricultural landscapes (Vigueira et al. 2013; Waselkov
& Olsen 2014). These lapses in our knowledge are strik-
ing because the population dynamics of agricultural
weeds are directly relevant to the global food supply.
Agricultural weed infestations reduce worldwide cropCorrespondence: Regina S. Baucom, Fax: 1 (734) 763 0544;
E-mail: [email protected]
© 2016 John Wiley & Sons Ltd
Molecular Ecology (2016) 25, 4508–4520 doi: 10.1111/mec.13737
yield by as much as 10% (Oerke 2005), and it has been
estimated that crop losses caused by weeds cost the US
agricultural economy ~33B USD per year (Pimentel et al.
2005). Clarifying the evolutionary forces that impact
agricultural weeds can provide information on the pro-
cess of rapid evolution more broadly as well as insight
on how weeds survive and persist in agricultural
regimes.
Agricultural weeds, which coexist and compete with
crops, evolve though unintentional human-mediated
selection rather than through direct artificial selection
(Stewart & Warwick 2005) and as such they exist in a
state that is considered ‘neither wild nor domesticated’
(Vigueira et al. 2013). Weeds are subject to the same
forces influencing evolution in nature – notably, genetic
drift, selection and gene flow (Jasieniuk et al. 1996) –but they often experience a selection intensity that is
much higher than what is usually found in other natu-
ral systems. For example, the predominant form of
weed control in current farming is through the use of
herbicides, which are designed to remove 90% of the
weed population (Jasieniuk et al. 1996; D�elye et al.
2013). Individuals that survive this high intensity of
selection due to either chance or genetic predisposition
are founders for the next generation. As the point of
weedy plant control regimes – whether through the use
of herbicide or another control technique – is to remove
of a large portion of the population, populations that
recolonize are hypothesized to show evidence of genetic
bottleneck (Jasieniuk et al. 1996; Vigueira et al. 2013). As
a result, weeds could lose rare alleles important to
future adaptation (Nei et al. 1975).
In support of this idea, population genetic surveys
have found that weeds tend to exhibit less genetic vari-
ation than other groups of plants (Hamrick et al. 1979),
and there is some evidence that weed populations from
cultivated land exhibit decreased neutral genetic diver-
sity compared to wild populations (Kane & Rieseberg
2008). The majority of the work to date, however, has
compared populations across space, that is from culti-
vated and noncultivated areas (Muller et al. 2010), or
‘wild’ vs. ‘weedy’ populations (Kane & Rieseberg 2008).
In contrast, a novel approach that can provide direct
evidence for evolutionary change through time is by
the use of a resurrection approach in which ancestor
and descendant strains of species are compared. In this
type of experiment, seeds or propagules sampled from
an earlier time point are germinated after remaining
dormant for a number of years and compared to
descendant populations sampled from the same loca-
tion (Franks et al. 2007; Orsini et al. 2013). Although res-
urrection experiments have been used to address key
questions about evolutionary constraints in microbial
systems (Lenski & Travisano 1994; Lenski 1998), such
experiments in eukaryotes have thus far used either a
limited number of accessions (Baucom & Mauricio
2010) or a limited number of distinct populations
(Franks et al. 2007; Thomann et al. 2015).
Here, we perform a resurrection experiment to deter-
mine whether populations of an agricultural weed exhi-
bit evidence of genetic bottlenecks and phenotypic
evolution over time. To do so, we use temporally sam-
pled populations of Ipomoea purpurea, an introduced
invader of agricultural and disturbed areas in the Uni-
ted States (Defelice 2001). Ipomoea purpurea is native to
the central highlands of Mexico (Clegg & Durbin 2000;
Defelice 2001), and lineages sampled from natural pop-
ulations in the USA exhibit low diversity relative to
Mexican accessions, suggesting a severe bottleneck
occurred following introduction (Fang et al. 2013).
Recent work shows a mosaic of glyphosate resistance in
populations of I. purpurea across the USA, with some
populations exhibiting high resistance (a high propor-
tion of the population that survives glyphosate) and
others showing high susceptibility post-herbicide appli-
cation (Kuester et al. 2015). Previous work has also
found that an additive genetic basis underlies glypho-
sate resistance in I. purpurea (Baucom & Mauricio 2008)
and that resistance segregates in genetic lines developed
from a single experimental population (Debban et al.
2015).
Although populations of I. purpurea are found pri-
marily within agricultural fields that are treated with
glyphosate and other herbicides, the impact of such
strong selection and any associated environmental
changes on the population genetics of this species
remains largely unknown. Given genetic variation
underlying resistance, the consistent application of gly-
phosate should lead to both genotypic and phenotypic
evolution, that is evidence of genetic bottlenecks and
increased resistance. Here, we test the prediction that
agricultural populations, consistently exposed to herbi-
cide over a nine-year period, show both reduced genetic
diversity and increased resistance using temporally
sampled cohorts of I. purpurea populations. Specifically,
we first determine whether the neutral genetic differen-
tiation and diversity of I. purpurea populations have
changed between sampling years. We pair this with
greenhouse experiments to examine the potential that
these populations, sampled from the same fields nine
years apart (Fig. 1; Table S1, Supporting information),
exhibit increased resistance over time. We find evidence
of both genetic bottlenecks and slight increase in the
level of resistance, indicating that a noxious weed can
adapt to the extreme selection imposed by herbicide
applications even as genetic diversity decreases. We fur-
ther find some indication that highly resistant popula-
tions exhibit lower genetic diversity than less resistant
© 2016 John Wiley & Sons Ltd
ADAPTIVE EVOLUTION IN AN AGRICULTURAL WEED 4509
populations, suggesting that herbicide application is
responsible for the reduction in neutral genetic diver-
sity. This is the first examination, to our knowledge, of
a resurrection experiment that simultaneously identifies
both loss of genetic diversity of an agricultural weed
over time and potential evidence for adaptive evolu-
tion.
Materials and methods
Population sampling
Locations and sampling strategies for 44 Ipomoea pur-
purea populations were previously described in Kuester
et al. (2015). Twenty-six of these populations were sam-
pled in 2003 and resampled in 2012 (see Fig. 1 and
Table S1, Supporting information). In 2003, we collected
replicate seeds from between 6 and 30 maternal individ-
uals at least 1 m apart from one another along a linear
transect. We located the same populations in the fall of
2012 using GPS coordinates, which are accurate to
within a few metres. Agricultural fields are highly dis-
turbed by tilling and harvesting each year, and morning
glories are predominantly found in areas that have
recently experienced soil disturbance via tilling; as a
result, this system is not amenable to the maintenance
of long-term transects. We are thus making the assump-
tion that adult plants present within the same agricul-
tural field and located within the nearest distance to the
GPS coordinates in 2012 are the descendants of the 2003
cohort. Preliminary data from >5000 SNPs generated by
genotype-by-sequencing have identified a high number
of independent genetic clusters in population structure
analyses and a low proportion of recent immigrants
into populations (D. Alvarado-Serrano & R. S. Baucom,
unpublished data), indicating that our assumptions
herein are largely realistic. We estimated population
size in the 2012 sampling year by counting the numbers
of individuals down a linear transect.
Of the 26 populations that were sampled both years,
we randomly chose 10 to examine potential changes in
genetic diversity between 2003 and 2012. One seed from
an average of 18 maternal lines per population per sam-
pling year (355 individuals total) was germinated, and
cotyledons were used for DNA isolation using a CTAB
method modified from Culley & Stokes, 2012 [see
Kuester et al. (2015)]. The numbers of maternal lines
sampled per population were approximately equal
between the sampling years and exact numbers are
presented in Table S2 (Supporting information).
To assay herbicide resistance among populations and
between sampling years, we planted two replicate
greenhouse experiments of all 26 populations at the
University of Georgia Plant Biology Greenhouses
(Athens, GA). One seed from 10 maternal lines per pop-
ulation per sampling year was scarified and planted in
pine bark soil in SC10 super conetainers (Stuewe and
Sons, Tangent, OR) in six experimental treatments,
described below. This design was replicated in its
entirety in another greenhouse for a total of 20 seeds
per population within each treatment and thus an over-
all total of 5381 experimental individuals. Plants were
randomly assigned to racks that were then randomly
assigned to flow trays (4 racks per flow tray). Conetain-
ers were watered daily, and flow trays were filled with
water to prevent desiccation. Germination was slightly
higher in 2003 compared to 2012 samples (87% and 84%
in 2003 and 2012, respectively, (v21 = 12.27, P < 0.001)
and ranged from 50 to 98% across populations.
Plants were sprayed with RoundUp PowerMax�
(Monsanto, St Louis, MO, USA) 22 days after planting
at rates around the recommended field rate (1.54 kg
ai/ha) of 0, 0.21, 0.42, 0.84, 1.70 and 3.40 kg a.i./ha (the
0 kg a.i./ha control treatment was sprayed with water)
using a hand-held, CO2-pressurized sprayer (R & D
Sprayers, Opelousas, LA, USA) that delivered 187 L/ha
at 206 kPa, 1.5 m above the plants. Three weeks after
Survival0–20%20–40%40–60%60–100%
(A)
(B)
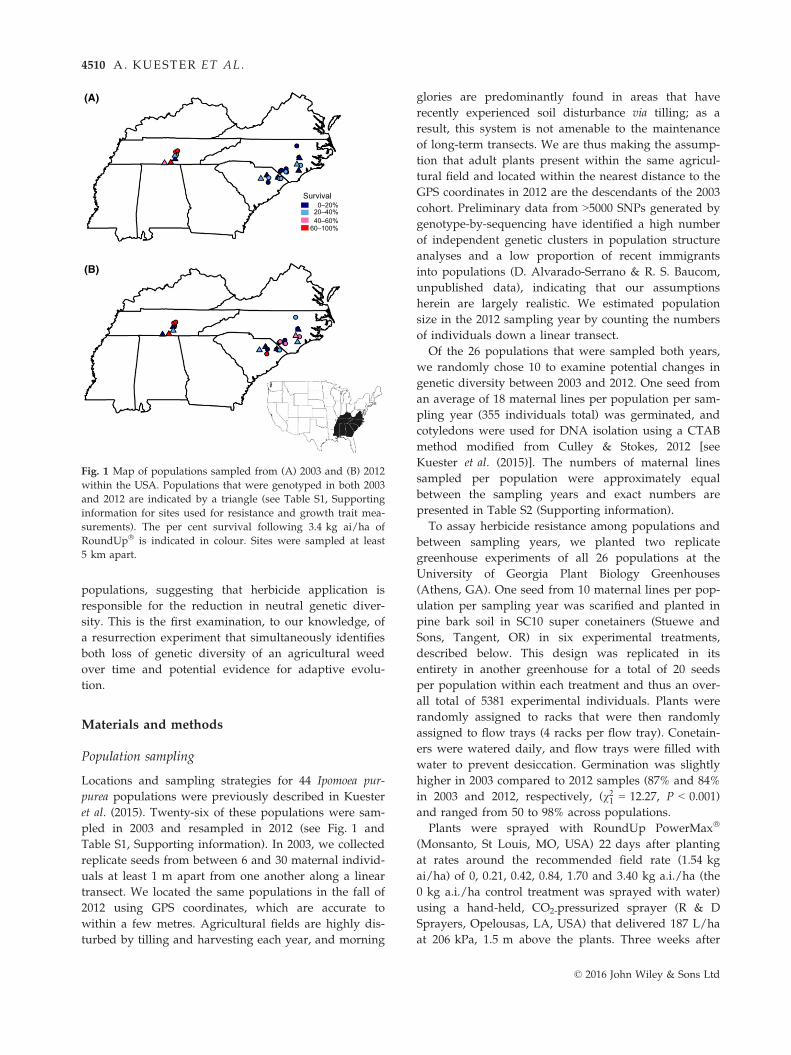
Fig. 1 Map of populations sampled from (A) 2003 and (B) 2012
within the USA. Populations that were genotyped in both 2003
and 2012 are indicated by a triangle (see Table S1, Supporting
information for sites used for resistance and growth trait mea-
surements). The per cent survival following 3.4 kg ai/ha of
RoundUp� is indicated in colour. Sites were sampled at least
5 km apart.
© 2016 John Wiley & Sons Ltd
4510 A. KUESTER ET AL.
glyphosate application, we scored survival of each
plant. Plants were harvested, dried at 72 °C for 48 h and
measured for total above ground biomass. Biomass val-
ues were adjusted to the nonsprayed controls by dividing
each individual by the average biomass of its population
grown in the nonspray control treatment following stan-
dard protocols (Tehranchian et al. 2015). At the time of
sampling survival and biomass remaining post-herbicide
(3 weeks after herbicide application), none of the plants
exhibited signs of regrowth indicating that our measure
of resistance does not confound resistance with tolerance
(see Baucom &Mauricio 2008).
SSR genotyping and scoring errors
Details on multiplexing SSR markers and scoring proce-
dures can be found in Kuester et al. (2015). Briefly, 15
polymorphic microsatellite loci were used to examine
genetic diversity across populations and sampling
years, and all individuals were scored by hand. To
check accuracy of multilocus genotypes we rescored
loci from 200 randomly chosen individuals and found
very few scoring errors. We did not find any large allele
dropouts or errors due to stutter in any of the locus by
population by year combinations. We also examined the
influence of null alleles on genetic diversity and found
little evidence that potential null alleles altered our esti-
mates or the main conclusions. Details of these analyses
are presented in the Supporting Information section.
Temporal genetic differentiation and diversity
We examined the potential that seeds sampled across
collection years were genetically differentiated from one
another in two ways. First, we estimated genetic differ-
entiation between years (FRT) using hierarchical
AMOVA in GENALEX v. 6.5 (Peakall & Smouse 2012). We
also performed individual assignment (Paetkau et al.
1995; Cornuet et al. 1999) of individuals to sampling
year using GENECLASS2 (Piry et al. 2004). For individual
assignment, the inability to assign individuals to a
specific sampling year would indicate that individuals
sampled in 2012 had not diverged in allelic composition
compared to the individuals sampled in 2003. We used
the Bayesian method described by Baudouin & Lebrun
(2000) as a criterion for computation, and individual
assignment was performed using the leave-one-out pro-
cedure (Paetkau et al. 2004), where the genotype to be
assigned was not included in the population from
which it was sampled. We report the –log likelihood of
being assigned in each sampled year, by plotting the –log likelihood value of individual assignment to 2003
sample year against the –log likelihood of being
assigned to the 2012 sampling year. Lack of temporal
change across sampling years would be indicated by
overlap of individuals sampled from each year. We cal-
culated expected and observed heterozygosity (He and
Ho), the number of alleles (Na) and the number of effec-
tive alleles (Ne) using GENALEX v 6.5 (Peakall & Smouse
2012) and allelic richness (AR) using FSTAT v. 2.9.3.2
(Goudet 2005) and determined whether there were
reductions in diversity estimates between 2003 and 2012
using Wilcoxon matched-pairs rank-sum tests (Zar 1996).
We estimated the inbreeding coefficient (FIS) of each pop-
ulation in each sampling year using GENEPOP v 4.5.1
(Rousset 2008) to determine whether there was evidence
of inbreeding among populations and whether this sig-
nificantly differed according to sampling year. Finally,
we examined the possibility that populations experi-
enced genetic bottleneck using the program BOTTLENECK
(Piry et al. 1999). This program examines the potential for
greater expected heterozygosity based on allelic diversity
relative to expected heterozygosity estimated under
mutation–drift equilibrium (Nei et al. 1975; Cornuet &
Luikart 1996). If a significantly high proportion of loci
exhibit an allele deficiency relative to expectations based
on mutation–drift equilibrium, the population would
show signs of a recent reduction in the effective popula-
tion size and thus a bottleneck (Nei et al. 1975; Cornuet &
Luikart 1996). We conditioned analyses on the infinite
alleles model (IAM), the stepwise-mutation model
(SMM) and the two-phase model (TPM) of microsatellite
mutation as we are using microsatellites with a range of
repeat motif types – dimeric, trimeric and imperfect
motifs – and thus, we have no a priori reason to select
one particular mutational model over another [repeat
types presented in Table S2, Supporting information of
(Kuester et al. 2015)]. All analyses were performed across
1000 iterations assuming mutation–drift equilibrium, and
significance was calculated using the Wilcoxon test [ap-
propriate for sample sizes of <30 individuals (Luikart &
Cornuet 1998; Luikart et al. 1998)].
Resistance screen
We examined the potential that populations and sam-
pling years varied for resistance using univariate mixed-
model analyses of variance. We operationally defined
resistance in two ways – first, as a measure of the num-
ber of individuals within populations that died as a
result of herbicide application, and second, as a measure
of the amount of biomass change following herbicide
application standardized to controls. Because none of the
experimental individuals showed signs of regrowth
when survival and biomass postspray were measured,
our operational measures of resistance do not conflate
resistance with tolerance (which is the ability to regrow
following damage). We used the glmer option of the
© 2016 John Wiley & Sons Ltd
ADAPTIVE EVOLUTION IN AN AGRICULTURAL WEED 4511
lme4 package in R (Bates et al. 2011) to model survival as
a binary character; further, we used the lmer option to
assess biomass remaining postherbicide. In each model,
replicate greenhouse experiment, herbicide treatment,
collection year and population were the independent
variables with survival or standardized biomass as the
dependent variables. We included interactions between
population and collection year as well as population, col-
lection year and treatment. Population and its interaction
terms were considered random effects in each model
whereas all other effects were fixed. We previously iden-
tified a significant population effect from the 2012 cohort
for survival postherbicide application, which indicated
that populations vary in their respective level of resis-
tance (Kuester et al. 2015). Here, we are specifically inter-
ested in the year term as well as interaction terms
including the year effect, which would indicate that
resistance varies between sampling years and/or that
populations vary in their level of resistance between
years. An F-test was used to determine the significance
of fixed effects, and the significance of each random
effect in the model was determined using a likelihood
ratio test (LRT) in which the full model was compared to
a reduced model with the effect of interest removed. The
P-value was determined using a chi-square test with one
degree of freedom. Prior to analysis, we examined the
normality of our estimates of biomass with the Shapiro–Wilk test and by visual inspection of quantile–quantile(q-q) plot, and square root transformed this variable to
improve normality of the residuals.
Results
Genetic diversity and differentiation
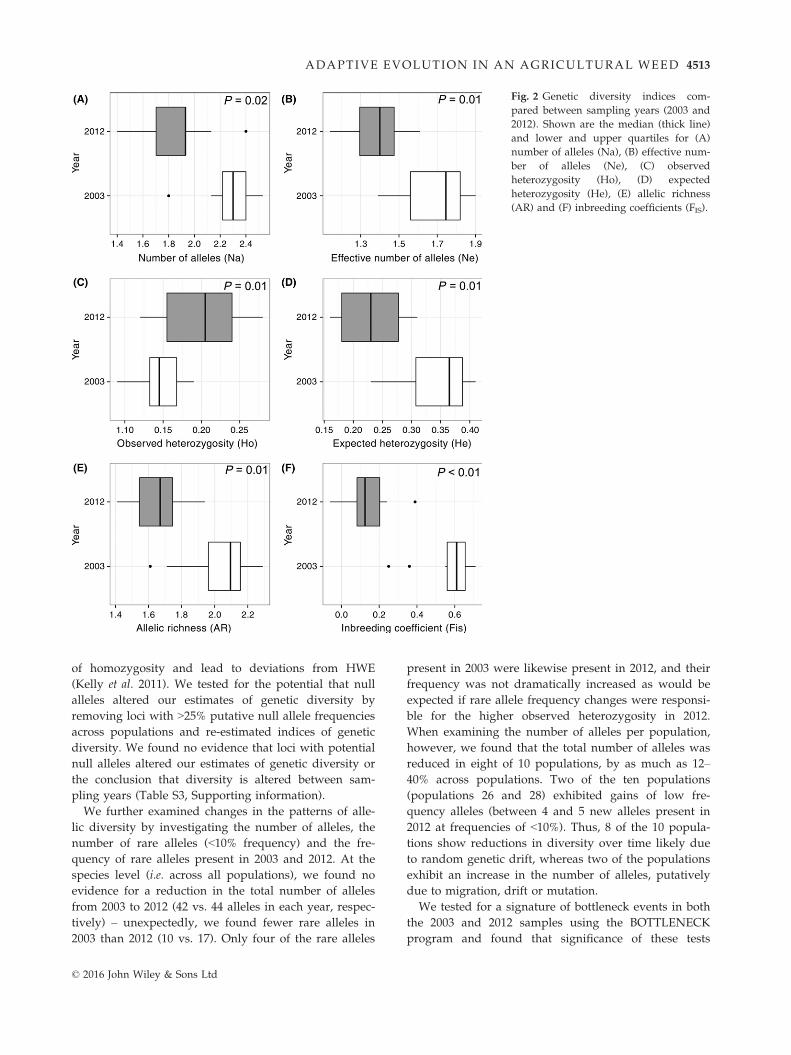
We uncovered reductions in genetic diversity between
sampling years among populations (Table 1), with most
measures of diversity significantly reduced in 2012 com-
pared to 2003 (Fig. 2). For example, expected heterozy-
gosity was 32% lower in 2012 (W = 51, P = 0.01), allelic
richness was 18% lower (W = 52, P = 0.01), the effective
number of alleles was 43% lower (W = 51, P = 0.01)
and the absolute number of alleles per locus were
reduced by 19% in 2012 compared to 2003 (W = 50,
P = 0.01). The observed heterozygosity was 27% higher,
on average, in 2012 compared to 2003 (W = 4,
P = 0.005). This difference is probably due to the low
observed compared to expected heterozygosity of the
2003 cohort; that is, the inbreeding coefficient (FIS = 1 �Ho/He) was higher in 2003 vs. 2012 (F2003 = 0.57 � 0.05
(�SE) vs. F2012 = 0.13 � 0.04, respectively; Fig. 2). The
difference in average FIS value between 2003 and 2012
was significant (W = 55, P < 0.01). Although this differ-
ence could be due to selection against heterozygotes in
2003, it is more likely indicative of differences in the
mating system between sampling years of this mixed-
mating, hermaphroditic species. Populations were sam-
pled during a slightly longer window of time in 2003
than in 2012 (10/10–11/3 in 2003 vs. 10/15–10/20 in
2012); however, at least five of the 10 populations were
sampled during the same temporal window (10/10–10/20 both years), and these populations exhibit similar
differences in F values (F2003 = 0.47 � 0.08 vs.
F2012 = 0.12 � 0.03). We do not have information
regarding pollinator abundance or any other reason to
expect differences in the mating system between years.
Bonferroni-corrected HWE tests, consequently, indi-
cated that more loci were not in HWE equilibrium
within populations in 2003 (39 of 150 locus 9 popula-
tion combinations), compared to 2012 (1 of 150 locus 9
population combinations). Processes that lead to
heterozygote deficit, such as inbreeding or population
substructure, can cause deviations from HWE; alterna-
tively, the presence of null alleles could inflate estimates
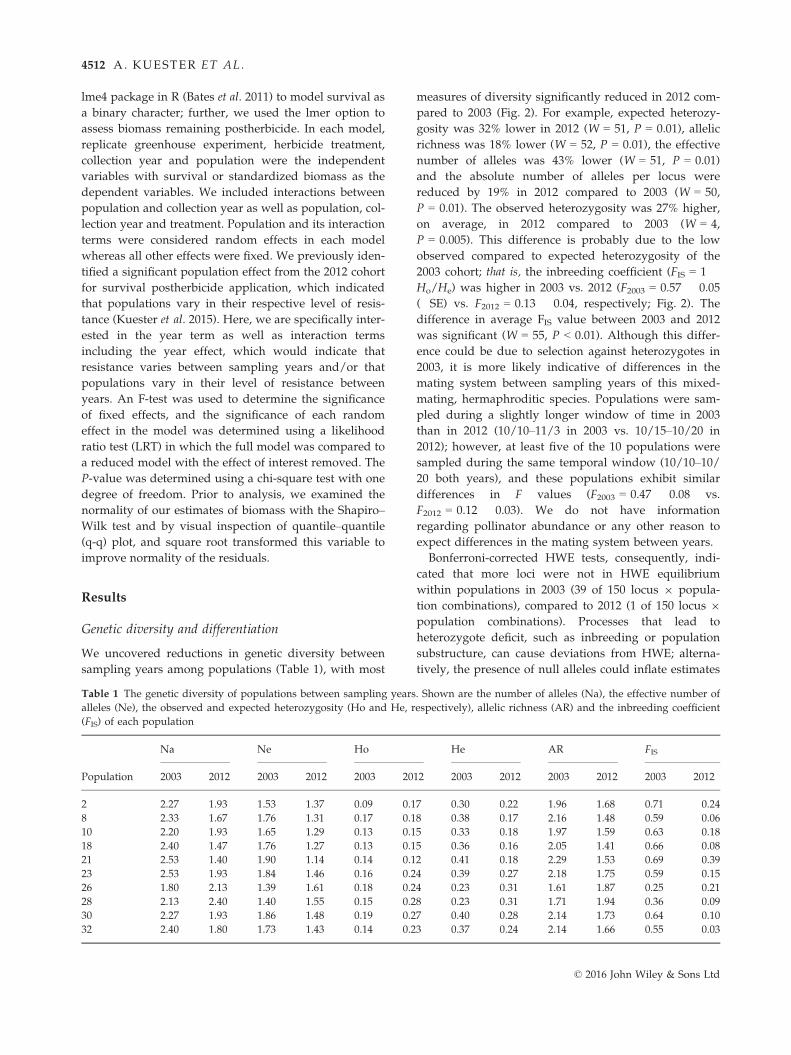
Table 1 The genetic diversity of populations between sampling years. Shown are the number of alleles (Na), the effective number of
alleles (Ne), the observed and expected heterozygosity (Ho and He, respectively), allelic richness (AR) and the inbreeding coefficient
(FIS) of each population
Population
Na Ne Ho He AR FIS
2003 2012 2003 2012 2003 2012 2003 2012 2003 2012 2003 2012
2 2.27 1.93 1.53 1.37 0.09 0.17 0.30 0.22 1.96 1.68 0.71 0.24
8 2.33 1.67 1.76 1.31 0.17 0.18 0.38 0.17 2.16 1.48 0.59 �0.06
10 2.20 1.93 1.65 1.29 0.13 0.15 0.33 0.18 1.97 1.59 0.63 0.18
18 2.40 1.47 1.76 1.27 0.13 0.15 0.36 0.16 2.05 1.41 0.66 0.08
21 2.53 1.40 1.90 1.14 0.14 0.12 0.41 0.18 2.29 1.53 0.69 0.39
23 2.53 1.93 1.84 1.46 0.16 0.24 0.39 0.27 2.18 1.75 0.59 0.15
26 1.80 2.13 1.39 1.61 0.18 0.24 0.23 0.31 1.61 1.87 0.25 0.21
28 2.13 2.40 1.40 1.55 0.15 0.28 0.23 0.31 1.71 1.94 0.36 0.09
30 2.27 1.93 1.86 1.48 0.19 0.27 0.40 0.28 2.14 1.73 0.64 0.10
32 2.40 1.80 1.73 1.43 0.14 0.23 0.37 0.24 2.14 1.66 0.55 0.03
© 2016 John Wiley & Sons Ltd
4512 A. KUESTER ET AL.
of homozygosity and lead to deviations from HWE
(Kelly et al. 2011). We tested for the potential that null
alleles altered our estimates of genetic diversity by
removing loci with >25% putative null allele frequencies
across populations and re-estimated indices of genetic
diversity. We found no evidence that loci with potential
null alleles altered our estimates of genetic diversity or
the conclusion that diversity is altered between sam-
pling years (Table S3, Supporting information).
We further examined changes in the patterns of alle-
lic diversity by investigating the number of alleles, the
number of rare alleles (<10% frequency) and the fre-
quency of rare alleles present in 2003 and 2012. At the
species level (i.e. across all populations), we found no
evidence for a reduction in the total number of alleles
from 2003 to 2012 (42 vs. 44 alleles in each year, respec-
tively) – unexpectedly, we found fewer rare alleles in
2003 than 2012 (10 vs. 17). Only four of the rare alleles
present in 2003 were likewise present in 2012, and their
frequency was not dramatically increased as would be
expected if rare allele frequency changes were responsi-
ble for the higher observed heterozygosity in 2012.
When examining the number of alleles per population,
however, we found that the total number of alleles was
reduced in eight of 10 populations, by as much as 12–40% across populations. Two of the ten populations
(populations 26 and 28) exhibited gains of low fre-
quency alleles (between 4 and 5 new alleles present in
2012 at frequencies of <10%). Thus, 8 of the 10 popula-
tions show reductions in diversity over time likely due
to random genetic drift, whereas two of the populations
exhibit an increase in the number of alleles, putatively
due to migration, drift or mutation.
We tested for a signature of bottleneck events in both
the 2003 and 2012 samples using the BOTTLENECK
program and found that significance of these tests
Fig. 2 Genetic diversity indices com-
pared between sampling years (2003 and
2012). Shown are the median (thick line)
and lower and upper quartiles for (A)
number of alleles (Na), (B) effective num-
ber of alleles (Ne), (C) observed
heterozygosity (Ho), (D) expected
heterozygosity (He), (E) allelic richness
(AR) and (F) inbreeding coefficients (FIS).
© 2016 John Wiley & Sons Ltd
ADAPTIVE EVOLUTION IN AN AGRICULTURAL WEED 4513
depended on both the specific model employed (IAM,
SMM or TPM) and the sampling year. Under the IAM,
six populations sampled from 2003 exhibited significant
heterozygote excess following corrections for multiple
tests, whereas only one – population 32 – exhibited sig-
nificant heterozygote excess under all three models of
microsatellite evolution (Table 2). No populations from
2012 exhibited evidence of heterozygote excess and thus
signs of a bottleneck following corrections for multiple
tests (Table 2).
We next estimated the effective number of individu-
als from each sampling year using expected heterozy-
gosity and the equation He = 4Nel (Nagylaki 1998) with
a mutation rate, l, of 10�3 (Marriage et al. 2009). We
found that the estimated number of individuals from
the 2003 populations was significantly higher, on
average, compared to that of the 2012 populations
(Ne, 2003 = 85, Ne, 2012 = 58; W = 67, P = 0.005). Further-
more, we found no significant difference between our
census sample size from the 2012 populations and the
estimated effective number of individuals from that
sampling year (Population size average from cen-
sus = 70 individuals; W = 36.5, P = 0.32). While the dif-
ference in estimated number of individuals between
sampling years indicated that most populations experi-
enced reductions in size (reductions ranging from 20 to
55 individuals fewer in 2012), populations 26 and 28
both exhibited an estimated gain of 20 individuals.
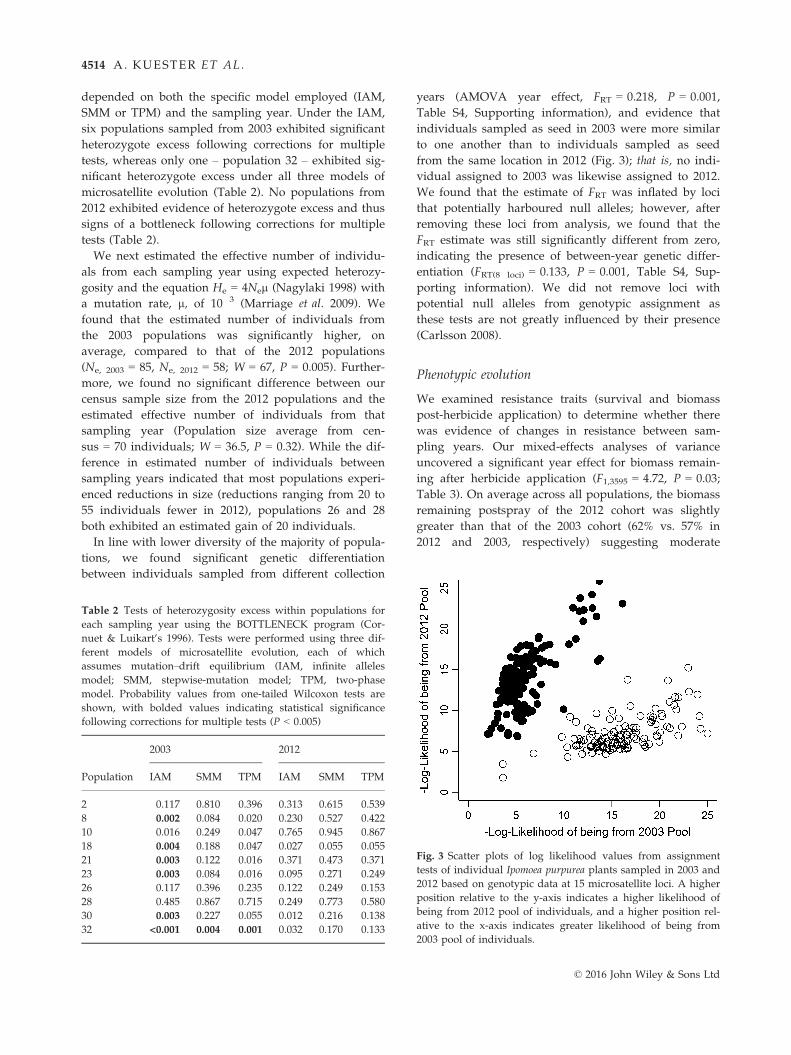
In line with lower diversity of the majority of popula-
tions, we found significant genetic differentiation
between individuals sampled from different collection
years (AMOVA year effect, FRT = 0.218, P = 0.001,
Table S4, Supporting information), and evidence that
individuals sampled as seed in 2003 were more similar
to one another than to individuals sampled as seed
from the same location in 2012 (Fig. 3); that is, no indi-
vidual assigned to 2003 was likewise assigned to 2012.
We found that the estimate of FRT was inflated by loci
that potentially harboured null alleles; however, after
removing these loci from analysis, we found that the
FRT estimate was still significantly different from zero,
indicating the presence of between-year genetic differ-
entiation (FRT(8 loci) = 0.133, P = 0.001, Table S4, Sup-
porting information). We did not remove loci with
potential null alleles from genotypic assignment as
these tests are not greatly influenced by their presence
(Carlsson 2008).
Phenotypic evolution
We examined resistance traits (survival and biomass
post-herbicide application) to determine whether there
was evidence of changes in resistance between sam-
pling years. Our mixed-effects analyses of variance
uncovered a significant year effect for biomass remain-
ing after herbicide application (F1,3595 = 4.72, P = 0.03;
Table 3). On average across all populations, the biomass
remaining postspray of the 2012 cohort was slightly
greater than that of the 2003 cohort (62% vs. 57% in
2012 and 2003, respectively) suggesting moderate
Table 2 Tests of heterozygosity excess within populations for
each sampling year using the BOTTLENECK program (Cor-
nuet & Luikart’s 1996). Tests were performed using three dif-
ferent models of microsatellite evolution, each of which
assumes mutation–drift equilibrium (IAM, infinite alleles
model; SMM, stepwise-mutation model; TPM, two-phase
model. Probability values from one-tailed Wilcoxon tests are
shown, with bolded values indicating statistical significance
following corrections for multiple tests (P < 0.005)
Population
2003 2012
IAM SMM TPM IAM SMM TPM
2 0.117 0.810 0.396 0.313 0.615 0.539
8 0.002 0.084 0.020 0.230 0.527 0.422
10 0.016 0.249 0.047 0.765 0.945 0.867
18 0.004 0.188 0.047 0.027 0.055 0.055
21 0.003 0.122 0.016 0.371 0.473 0.371
23 0.003 0.084 0.016 0.095 0.271 0.249
26 0.117 0.396 0.235 0.122 0.249 0.153
28 0.485 0.867 0.715 0.249 0.773 0.580
30 0.003 0.227 0.055 0.012 0.216 0.138
32 <0.001 0.004 0.001 0.032 0.170 0.133
Fig. 3 Scatter plots of log likelihood values from assignment
tests of individual Ipomoea purpurea plants sampled in 2003 and
2012 based on genotypic data at 15 microsatellite loci. A higher
position relative to the y-axis indicates a higher likelihood of
being from 2012 pool of individuals, and a higher position rel-
ative to the x-axis indicates greater likelihood of being from
2003 pool of individuals.
© 2016 John Wiley & Sons Ltd
4514 A. KUESTER ET AL.
increases in resistance across populations sampled in
2012 (see Table S5, Supporting information for averages
(�SE) among all populations). Likewise, a higher per-
centage of individuals sampled in 2012 survived herbi-
cide application compared to those sampled from 2003
(49% vs. 42%), but this difference was not significant
(F1,5365 = 2.58, P = 0.11; Table 3).
As in previous work (Kuester et al. 2015), we identi-
fied significant population effects for both measures of
resistance (Table 3), indicating that populations vary
across the landscape for their relative level of herbicide
resistance. Here, however, we also find population by
year effects in each analysis, indicating that populations
differ in their level of resistance across years (Survival,
v21 = 23.74, P < 0.001; Biomass, v21 = 7.92, P = 0.005;
Table 3), a result that was significant across all treat-
ment levels of herbicide (Table 3). At the herbicide level
closest to the field dose (1.7 kg ai/ha), 16 populations
exhibited either the same or increased survival in 2012
compared to 2003 whereas 10 populations exhibited
lower survival in 2012 compared to 2003 (Table S5, Sup-
porting information). One population’s survival
increased by 79% compared to 2003, indicating that
some populations may respond more readily with
increased resistance than others. These differences are
likewise apparent at the highest dose of herbicide
(3.4 kg ai/ha; approximately 29 the field dose), with a
significant population by year interaction for both sur-
vival and biomass remaining postherbicide application
(Survival: Population 9 Year, v21 = 16.23, P < 0.001; Bio-
mass: Population 9 Year, v21 = 4.11, P = 0.04) indicating
that the populations differed in resistance level between
sampling years. Notably, three populations sampled
from TN that were highly resistant in 2012 (Kuester
et al. 2015) were similarly resistant in 2003 (Fig. 1A, B,
shown at 29 field rate of RoundUp�). The majority of
the significant increases identified in the 2012 cohort
compared to the 2003 cohort were located in NC and
SC (Fig. 1A, B) – while five populations from the 2012
cohort of this region exhibit resistance values signifi-
cantly greater than the specieswide average (56% sur-
vival at 29 the field rate of RoundUp�, presented in
Kuester et al. 2015), the 2003 cohorts of these popula-
tions exhibited only ~14% survival at 29 field rate.
Overall, we identified a slight increase in resistance
between sampling years (biomass remaining post-herbi-
cide), and found that the resistance phenotype appears
to be dynamic between sampling years, with some pop-
ulations (central TN) retaining high resistance between
sampling cohorts at high levels of herbicide, some pop-
ulations (Carolinas) showing increased resistance and
other populations exhibiting resistance declines.
Discussion
Despite the ubiquity and persistence of weedy plant
populations, there are few examinations of how their
neutral and adaptive genetic diversity may change over
time. Here, we use a resurrection experiment to show
that populations of weedy Ipomoea purpurea sampled
from crop fields concomitantly lose genetic diversity
and show signs of potential adaptive evolution in
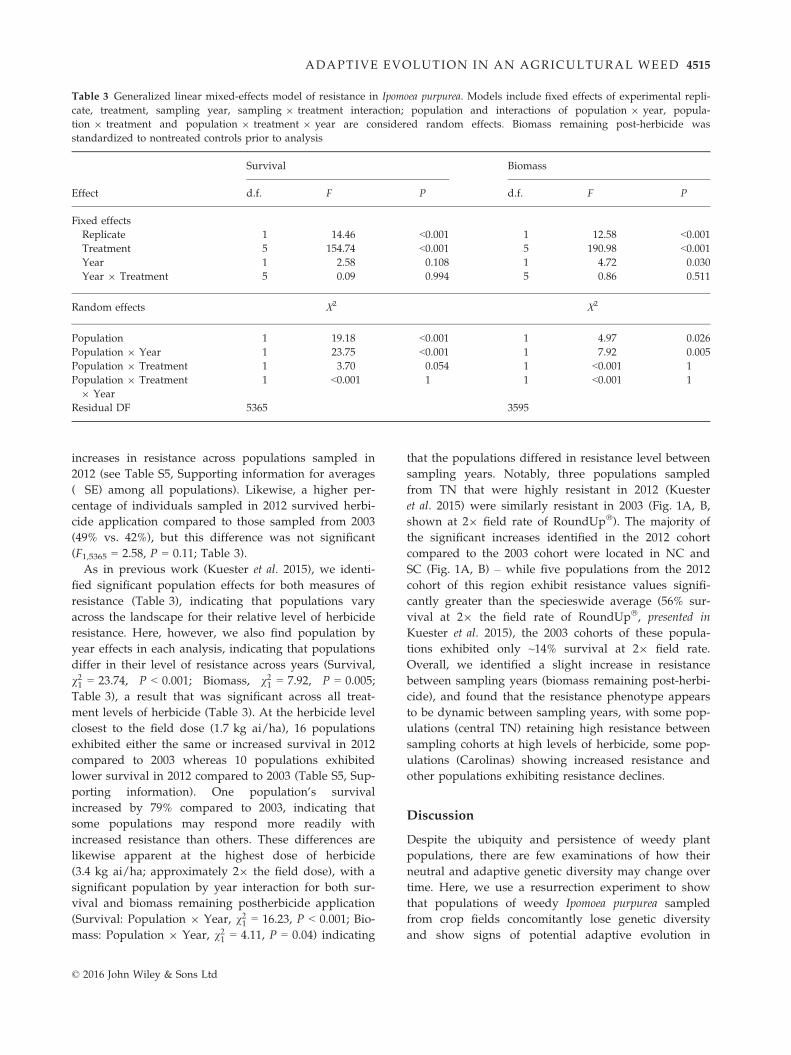
Table 3 Generalized linear mixed-effects model of resistance in Ipomoea purpurea. Models include fixed effects of experimental repli-
cate, treatment, sampling year, sampling 9 treatment interaction; population and interactions of population 9 year, popula-
tion 9 treatment and population 9 treatment 9 year are considered random effects. Biomass remaining post-herbicide was
standardized to nontreated controls prior to analysis
Effect
Survival Biomass
d.f. F P d.f. F P
Fixed effects
Replicate 1 14.46 <0.001 1 12.58 <0.001Treatment 5 154.74 <0.001 5 190.98 <0.001Year 1 2.58 0.108 1 4.72 0.030
Year 9 Treatment 5 0.09 0.994 5 0.86 0.511
Random effects Χ2 Χ2
Population 1 19.18 <0.001 1 4.97 0.026
Population 9 Year 1 23.75 <0.001 1 7.92 0.005
Population 9 Treatment 1 3.70 0.054 1 <0.001 1
Population 9 Treatment
9 Year
1 <0.001 1 1 <0.001 1
Residual DF 5365 3595
© 2016 John Wiley & Sons Ltd
ADAPTIVE EVOLUTION IN AN AGRICULTURAL WEED 4515
herbicide resistance. Our experiments yielded three
novel findings. First, we found that seed progenies from
populations sampled in 2012 exhibited lower genetic
diversity and higher genetic differentiation than seed
progenies sampled from the same fields and locations
in 2003, suggesting that populations have experienced
genetic bottlenecks between sampling periods. Second,
heterozygosity excess tests indicated that a significant
genetic bottleneck probably also occurred prior to 2003,
perhaps due to the dramatic increase in glyphosate use
in the late 1990s [see Fig. 1 (Baucom & Mauricio 2004)].
Although we cannot ascribe the loss of neutral genetic
variation to the widespread use of herbicide per se, we
show that a resistance trait – the amount of biomass
maintained following herbicide application – has
increased, on average, from 2003 to 2012. We combine
these results with a retrospective analysis of a larger
and previously published data set showing that highly
resistant populations sampled in 2012 exhibit signifi-
cantly reduced heterozygosity and allelic richness esti-
mates compared to less resistant populations. Below,
we discuss each of these major findings.
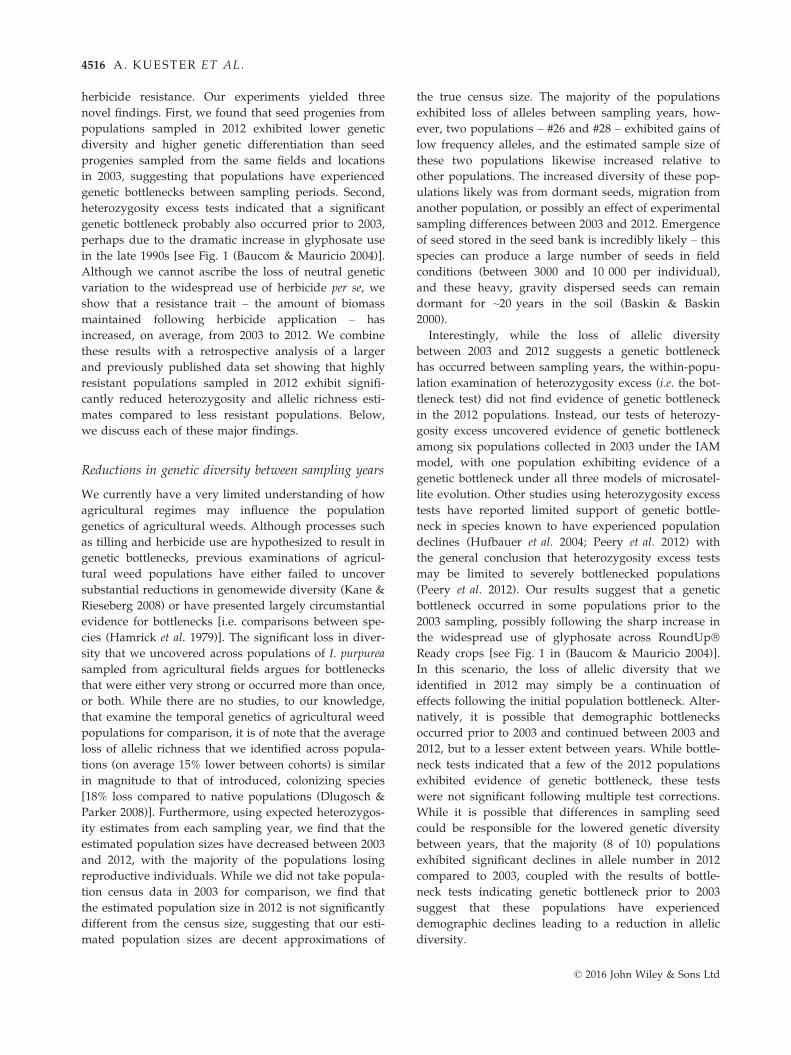
Reductions in genetic diversity between sampling years
We currently have a very limited understanding of how
agricultural regimes may influence the population
genetics of agricultural weeds. Although processes such
as tilling and herbicide use are hypothesized to result in
genetic bottlenecks, previous examinations of agricul-
tural weed populations have either failed to uncover
substantial reductions in genomewide diversity (Kane &
Rieseberg 2008) or have presented largely circumstantial
evidence for bottlenecks [i.e. comparisons between spe-
cies (Hamrick et al. 1979)]. The significant loss in diver-
sity that we uncovered across populations of I. purpurea
sampled from agricultural fields argues for bottlenecks
that were either very strong or occurred more than once,
or both. While there are no studies, to our knowledge,
that examine the temporal genetics of agricultural weed
populations for comparison, it is of note that the average
loss of allelic richness that we identified across popula-
tions (on average 15% lower between cohorts) is similar
in magnitude to that of introduced, colonizing species
[18% loss compared to native populations (Dlugosch &
Parker 2008)]. Furthermore, using expected heterozygos-
ity estimates from each sampling year, we find that the
estimated population sizes have decreased between 2003
and 2012, with the majority of the populations losing
reproductive individuals. While we did not take popula-
tion census data in 2003 for comparison, we find that
the estimated population size in 2012 is not significantly
different from the census size, suggesting that our esti-
mated population sizes are decent approximations of
the true census size. The majority of the populations
exhibited loss of alleles between sampling years, how-
ever, two populations – #26 and #28 – exhibited gains of
low frequency alleles, and the estimated sample size of
these two populations likewise increased relative to
other populations. The increased diversity of these pop-
ulations likely was from dormant seeds, migration from
another population, or possibly an effect of experimental
sampling differences between 2003 and 2012. Emergence
of seed stored in the seed bank is incredibly likely – this
species can produce a large number of seeds in field
conditions (between 3000 and 10 000 per individual),
and these heavy, gravity dispersed seeds can remain
dormant for ~20 years in the soil (Baskin & Baskin
2000).
Interestingly, while the loss of allelic diversity
between 2003 and 2012 suggests a genetic bottleneck
has occurred between sampling years, the within-popu-
lation examination of heterozygosity excess (i.e. the bot-
tleneck test) did not find evidence of genetic bottleneck
in the 2012 populations. Instead, our tests of heterozy-
gosity excess uncovered evidence of genetic bottleneck
among six populations collected in 2003 under the IAM
model, with one population exhibiting evidence of a
genetic bottleneck under all three models of microsatel-
lite evolution. Other studies using heterozygosity excess
tests have reported limited support of genetic bottle-
neck in species known to have experienced population
declines (Hufbauer et al. 2004; Peery et al. 2012) with
the general conclusion that heterozygosity excess tests
may be limited to severely bottlenecked populations
(Peery et al. 2012). Our results suggest that a genetic
bottleneck occurred in some populations prior to the
2003 sampling, possibly following the sharp increase in
the widespread use of glyphosate across RoundUp�Ready crops [see Fig. 1 in (Baucom & Mauricio 2004)].
In this scenario, the loss of allelic diversity that we
identified in 2012 may simply be a continuation of
effects following the initial population bottleneck. Alter-
natively, it is possible that demographic bottlenecks
occurred prior to 2003 and continued between 2003 and
2012, but to a lesser extent between years. While bottle-
neck tests indicated that a few of the 2012 populations
exhibited evidence of genetic bottleneck, these tests
were not significant following multiple test corrections.
While it is possible that differences in sampling seed
could be responsible for the lowered genetic diversity
between years, that the majority (8 of 10) populations
exhibited significant declines in allele number in 2012
compared to 2003, coupled with the results of bottle-
neck tests indicating genetic bottleneck prior to 2003
suggest that these populations have experienced
demographic declines leading to a reduction in allelic
diversity.
© 2016 John Wiley & Sons Ltd
4516 A. KUESTER ET AL.
Another attribute of the data suggests populations
experienced a genetic bottleneck prior to 2003 – we
found more locus by population combinations out of
HWE compared to 2012. In addition to the evolutionary
forces of genetic drift, selection, mutation, migration
and nonrandom mating (i.e. inbreeding or nonassorta-
tive mating), null alleles can also cause deviations from
Hardy–Weinberg equilibrium and will appear as
heterozygote deficiency (Dazbrowski et al. 2014). The
pattern that we uncovered of low observed heterozy-
gosity relative to expected heterozygosity in our 2003
populations is consistent with the presence of null alle-
les but also consistent with high levels of inbreeding.
To investigate the potential that null alleles influenced
our results, we removed loci with putative null alleles
from analyses and found that estimates of genetic diver-
sity remained lower in the 2012 populations compared
to their 2003 counterparts; further, F indices remained
significantly higher in the 2003 sample, implicating
widespread inbreeding following a potential bottleneck.
Ipomoea purpurea is a hermaphroditic species that dis-
plays a wide range of outcrossing rates in nature
(tm range: 0.2–0.8, across 20 populations; Kuester et al.
unpublished data); thus, it is plausible that inbreeding
could follow a large demographic bottleneck in this spe-
cies. The majority of our loci exhibited FIS > 0 in 2003
across populations, further pointing to a scenario of
inbreeding following a large demographic change
rather than the influence of null alleles. Finally, it is of
note that null allele detection methods have been
shown to exhibit low reliability when applied to
nonequilibrium populations and will overestimate their
frequency when populations have recently experienced
demographic bottleneck (Dazbrowski et al. 2014).
Phenotypic evolution
Recent work provides an interesting contrast between
the phenotypic and neutral genetic variations spatially
distributed within this system – while neutral genetic dif-
ferentiation among 44 I. purpurea populations is low (i.e.
FST = 0.127), populations are significantly differentiated
for herbicide resistance across the landscape, with some
populations exhibiting high and others very low resis-
tance (Kuester et al. 2015). Our screen of herbicide resis-
tance in 26 of these temporally sampled populations
shows that, in addition to a mosaic of resistance across
the landscape, the level of resistance has slightly
increased, on average, between sampling dates. This
finding is interesting in the light of the reduced neutral
genetic variation that we identified in eight of our 10
temporally sampled populations, and alternatively, in
the light of evidence of potential migrants in two of the
10 populations – reductions in diversity as well as influx
of presumably nonadapted variation would either act to
impede or to counteract adaptation. These forces, along
with recent work showing a severe fitness penalty of her-
bicide resistance in this species (Van Etten et al. 2015),
probably explain why the average increase in resistance
that we identified among all populations was modest –perhaps the populations that maintained resistance
between sampling years (TN populations) or those that
exhibit large increases in resistance (NC/SC populations)
were less influenced by susceptible migrants germinating
from the seed bank and/or costs of resistance than other
populations. The low average increase in resistance
across populations could also be due to a range of other
factors: it is possible that few populations house additive
genetic diversity for resistance, populations may experi-
ence different selective regimes, or the response to selec-
tion via glyphosate has been constrained by bottleneck
events. Interestingly, there was no evidence that plants
were different in size between the years (data not shown),
indicating that the increased resistance we detected is
not due to plants simply being larger in the 2012 cohort
and thus better able to withstand herbicide application.
Although we find evidence for a moderate increase in
the level of resistance across populations, it is important
to note that our phenotypic comparisons were made
using field-collected seeds. Thus, our resistance estimates
include potential genetic components as well as environ-
mental and maternal effects. This could explain the slight
increase in resistance over time: if more 2012 populations
had experienced glyphosate application relative to the
2003 populations, we would perhaps be sampling from a
subset of the population that experienced herbicide rela-
tive to plants that had not, potentially inflating estimates
of resistance in the 2012 samples. In 2003, between 80
and 92% of the soya fields in the USA were RoundUp�
Ready, and thus sprayed with the herbicide, whereas
approximately 20% of corn was RoundUp Ready� in that
sampling year. In 2012, 93% of soya planted was
RoundUp Ready� and between 73 and 80% of corn was
RoundUp Ready� (National Agricultural Statistics Ser-
vice, 2015, www.nass.usda.gov). Thus, it is possible that
our comparison of the temporally sampled phenotypes is
influenced by exposure to the herbicide itself in 2012. We
considered this using crop type as a proxy for herbicide
use, and determined whether biomass remaining post-
spray differed according to crop (restricted to soya and
corn) separately for both 2003 and 2012. There was no
difference in biomass remaining postherbicide according
to crop either year – for example the biomass remaining
postherbicide of morning glories sampled from soya was
no different than those sampled from corn – suggesting
that the population-level estimates of resistance are not
dependent on the crop type (as a proxy for spraying
regime) in one particular sampling year.
© 2016 John Wiley & Sons Ltd
ADAPTIVE EVOLUTION IN AN AGRICULTURAL WEED 4517
While we cannot conclude that the phenotypic evolu-
tion of resistance identified here is solely due to adap-
tive evolution, we have previously identified an additive
genetic basis underlying glyphosate resistance in one
population of this species (Baucom & Mauricio 2008),
positive selection for increased resistance in the field
(Baucom & Mauricio 2008), and further, have shown that
resistance segregates in crosses (Debban et al. 2015) indi-
cating that the genetic potential is present within at least
one population. In general, our results suggest that resis-
tance evolution is dynamic in this system, with some
populations maintaining high resistance (as measured by
survival) between sampling years, other populations
exhibiting large increases in resistance and others exhibit-
ing declines in resistance. Continued sampling and
assessment of resistance across these populations over
time will be necessary to determine whether the popula-
tions that exhibited large increases in resistance between
2003 and 2012 maintain high resistance as did popula-
tions from central TN. Identification of the genetic basis
of resistance across populations, and an assessment of
how alleles associated with resistance change over time
will decisively test our hypothesis that selection from the
use of this herbicide is leading to adaptation in natural
populations.
Has herbicide application caused the geneticbottleneck?
The populations used in this study were all sampled
from crop fields that were farmed prior to and from
2003 onward. While we do not have specific informa-
tion on herbicide use over this time period, we have
historical record for six of 10 years (Table S1, Support-
ing information) showing that these locations were used
for corn and soya crops, both of which make use of her-
bicides – and largely glyphosate – for weed control.
Although other environmental factors (e.g. those associ-
ated with climate change) could be responsible for the
genetic bottleneck that we report herein, herbicide use
is an obvious potential factor. We examined this idea
by making use of a larger and previously published
data set of 32 populations, sampled in 2012, for which
we have estimates of both survival and genetic diver-
sity (Kuester et al. 2015). We performed separate regres-
sions of expected heterozygosity (He) and allelic
richness (AR) on estimates of herbicide resistance (pro-
portion survival) at 3.4 kg ai/ha of glyphosate and
found a significant negative relationship; that is, more
resistant populations exhibit lower genetic diversity (He
vs. resistance: R = �0.375, P = 0.04; AR vs. resistance:
R = �0.345, P = 0.05). There is thus some indication
that selection via herbicide application has led to the
genetic bottleneck among populations. Interestingly, a
population used in both analyses – population 32 –exhibits high survival at 3.4 kg ai/ha of glyphosate,
and was the population for which we found evidence
of a pre-2003 bottleneck under all models of microsatel-
lite evolution.
Conclusions
Weedy plant species found in agricultural fields experi-
ence strong selection and thus are hypothesized to be
either plastic, capable of adaptation, or saved from
extinction through gene flow (Baker 1974; Parker et al.
2003). Using a resurrection approach, we provide evi-
dence that even though genetic variation is lost from
the system, some populations show potential signs of
adaptation to herbicide application. While previous
work indicates that the majority of the gene flow across
southeastern populations occurred prior to the wide-
spread adoption and use of glyphosate, suggesting that
resistance evolution is due to selection on standing or
novel variation within populations, that we identified
evidence of potential migrants into the 2012 gene pool
(in at least two populations) does not allow us to rule
out the hypothesis that resistance can be introduced
from outside sources.
Further, while we find evidence of increased resis-
tance, we also show that the absolute change between
years was not drastic; large resistance gains were lim-
ited to particular populations. These data suggest
heightened measures should be taken to reduce the
likelihood that seeds are accidentally moved between
crop fields through farm machinery or through contam-
inated seed lots. Finally, we have some evidence that
the lower genomewide diversity identified across popu-
lations is due to the application of glyphosate; however,
we note that we cannot rule out other potential factors,
as other herbicides with different mechanisms of action
are often applied in crops, other cropping techniques
that reduce population sizes might have been
employed, and it is also possible that populations have
lost diversity due to changes in the climate. The results
shown here suggest that this weed, while being a ‘gen-
eral purpose genotype’ (Baker 1974; Chaney & Baucom
2014), is also capable of adaptive evolution even while
losing significant allelic diversity. How likely future
adaptation to novel selective forces may be in the
future, in the light of reduced variation is unknown.
Acknowledgements
The authors wish to thank M. Van Etten, Y. Brandvain, D.
Alvarado Serrano, S. Colom, J. Ross-Ibarra, members of the R-I
lab, three anonymous reviewers and A. Caicedo for providing
feedback that improved this manuscript, and A. Wilson, E.
Fall, A. Teodorescu, S. Colom and S. Smitka for assistance with
© 2016 John Wiley & Sons Ltd
4518 A. KUESTER ET AL.
greenhouse and laboratory work. This work was funded by
USDA NIFA grants 04180 and 07191 to RSB and SMC.
References
Baker HG (1974) The evolution of weeds. Annual Review of
Ecology and Systematics, 5, 1–25.Barrett SH (1983) Crop mimicry in weeds. Economic Botany, 37,
255–282.Barrett SCH (1988) Genetics and evolution of agricultural
weeds. In: Weed Management in Agroecosystems Ecological
Approaches (eds Altieri M, Liebman MZ), pp. 57–75. CRC
Press, Boca Raton, Florida.
Baskin CC, Baskin JM (2000) Seeds. Academic Press, San Diego,
California.
Bates D, Maechler M, Bolker B (2011) lme4: linear mixed-effects
models using S4 classes.
Baucom RS, Mauricio R (2004) Fitness costs and benefits of
novel herbicide tolerance in a noxious weed. Proceedings of
the National Academy of Sciences of the United States of America,
101, 13386–13390.Baucom RS, Mauricio R (2008) Constraints on the evolution of
tolerance to herbicide in the common morning glory: resis-
tance and tolerance are mutually exclusive. Evolution, 62,
2842–2854.Baucom RS, Mauricio R (2010) Defence against the herbicide
Round Up (R) predates its widespread use. Evolutionary Ecol-
ogy Research, 12, 131–141.Baudouin L, Lebrun P (2000) An operational Bayesian
approach for the identification of sexually reproduced cross
fertilized populations using molecular markers. In: Interna-
tional Symposium on Molecular Markers for Characterizing
Genotypes and Identifying Cultivars in Horticulture 546, pp.
81–93.Carlsson J (2008) Effects of microsatellite null alleles on assign-
ment testing. The Journal of Heredity, 99, 616–623.Chaney L, Baucom RS (2014) The costs and benefits of toler-
ance to competition in Ipomoea purpurea, the common morn-
ing glory. Evolution, 68, 1698–1709.Clegg MT, Durbin ML (2000) Flower color variation: a model
for the experimental study of evolution. Proceedings of the
National Academy of Sciences of the United States of America, 97,
7016–7023.Cornuet JM, Luikart G (1996) Description and power analysis
of two tests for detecting recent population bottlenecks from
allele frequency data. Genetics, 144, 2001–2014.Cornuet JM, Piry S, Luikart G, Estoup A, Solignac M (1999)
New methods employing multilocus genotypes to select or
exclude populations as origins of individuals. Genetics, 153,
1989–2000.Culley TM, Stokes RL (2012) Genetic structure and outcrossing
rates in Viola pedunculata (Violaceae), a California endemic
violet lacking Cleistogamous flowers. Madrono, 59, 181–189.Dazbrowski MJ, Pilot M, Kruczyk M et al. (2014) Reliability
assessment of null allele detection: inconsistencies between
and within different methods. Molecular Ecology Resources,
14, 361–373.Debban CL, Okum S, Pieper KE, Wilson A, Baucom RS (2015)
An examination of fitness costs of glyphosate resistance in
the common morning glory, Ipomoea purpurea. Ecology and
Evolution, 5, 5284–5294.
Defelice MS (2001) Tall morningglory, Ipomoea purpurea (L.)
Roth - Flower or Foe? Weed Technology, 15, 601–606.D�elye C, Jasieniuk M, Le Corre V (2013) Deciphering the evolu-
tion of herbicide resistance in weeds. Trends in Genetics, 29,
649–658.Dlugosch KM, Parker IM (2008) Founding events in species
invasions: genetic variation, adaptive evolution, and the role
of multiple introductions. Molecular Ecology, 17, 431–449.Fang Z, Gonzales AM, Durbin ML et al. (2013) Tracing the geo-
graphic origins of weedy Ipomoea purpurea in the southeast-
ern United States. The Journal of Heredity, 104, 666–677.Franks SJ, Sim S, Weis AE (2007) Rapid evolution of flowering
time by an annual plant in response to a climate fluctuation.
Proceedings of the National Academy of Sciences of the United
States of America, 104, 1278–1282.Goudet J (2005) FSTAT (version 1.2): a computer program to
calculate F-statistics. The Journal of Heredity, 86, 485–486.Hamrick JL, Linhart YB, Mitton JB (1979) Relationships
between life history characteristics and electrophoretically
detectable genetic variation in plants. Annual Review of Ecol-
ogy and Systematics, 10, 173–200.Hufbauer RA, Bogdanowicz SM, Harrison RG (2004) The pop-
ulation genetics of a biological control introduction: mito-
chondrial DNA and microsatellie variation in native and
introduced populations of Aphidus ervi, a parisitoid wasp.
Molecular Ecology, 13, 337–348.Jasieniuk M, BruleBabel AL, Morrison IN (1996) The evolution
and genetics of herbicide resistance in weeds. Weed Science,
44, 176–193.Kane NC, Rieseberg LH (2008) Genetics and evolution of
weedy Helianthus annuus populations: adaptation of an agri-
cultural weed. Molecular Ecology, 17, 384–394.Kelly AC, Mateus-Pinilla NE, Douglas M et al. (2011)
Microsatellites behaving badly: empirical evaluation of geno-
typing errors and subsequent impacts on population studies.
Genetics and Molecular Research, 10, 2534–2553.Kuester A, Conner JK, Culley T, Baucom RS (2014) How weeds
emerge: a taxonomic and trait-based examination using Uni-
ted States data. New Phytologist, 202, 1055–1068.Kuester A, Chang S-M, Baucom RS (2015) The geographic
mosaic of herbicide resistance evolution: evidence for resis-
tance hotspots and low genetic differentiation across the
landscape. Evolutionary Applications, 8, 821–833.Lenski RE (1998) Bacterial evolution and the cost of antibiotic
resistance. International Microbiology, 1, 265–270.Lenski RE, Travisano M (1994) Dynamics of adaptation and
diversification: a 10,000-generation experiment with bacterial
populations. Proceedings of the National Academy of Sciences of
the United States of America, 91, 6808–6814.Luikart G, Cornuet J-M (1998) Empirical evaluation of a test
for identifying recently bottlenecked populations from allele
frequency data. Conservation Biology, 12, 228–237.Luikart G, Allendorf FW, Cornuet JM, Sherwin WB (1998) Dis-
tortion of allele frequency distributions provides a test for
recent population bottlenecks. The Journal of Heredity, 89,
238–247.Marriage TN, Hudman S, Mort ME et al. (2009) Direct estimation
of the mutation rate at dinucleotide microsatellite loci in Ara-
bidopsis thaliana (Brassicaceae). Heredity, 103, 310–317.Muller M-H, Latreille M, Tollon C (2010) The origin and
evolution of a recent agricultural weed: population genetic
© 2016 John Wiley & Sons Ltd
ADAPTIVE EVOLUTION IN AN AGRICULTURAL WEED 4519
diversity of weedy populations of sunflower (Helianthus
annuus L.) in Spain and France. Evolutionary Applications, 4,
499–514.Nagylaki T (1998) The expected number of heterozygous sites
in a subdivided population. Genetics, 149, 1599–1604.Nei M, Maruyama T, Chakraborty R (1975) The bottleneck effect
and genetic variability in populations. Evolution, 29, 1–10.Oerke EC (2005) Crop losses to pests. The Journal of Agricultural
Science, 144, 31–14.Orsini L, Schwenk K, De Meester L et al. (2013) The evolution-
ary time machine: using dormant propagules to forecast how
populations can adapt to changing environments. Trends in
Ecology & Evolution, 28, 274–282.Paetkau D, Calvert W, Stirling I, Strobeck C (1995) Microsatel-
lite analysis of population structure in Canadian polar bears.
Molecular Ecology, 4, 347–354.Paetkau D, Slade R, Burden M, Estoup A (2004) Genetic assign-
ment methods for the direct, real-time estimation of migra-
tion rate: a simulation-based exploration of accuracy and
power. Molecular Ecology, 13, 55–59.Parker IM, Rodriguez J, Loik ME (2003) An evolutionary
approach to understanding the biology of invasions: local
adaptation and general-purpose genotypes in the weed Ver-
bascum thapsus. Conservation Biology, 17, 59–72.Peakall R, Smouse PE (2012) GenAlEx 6.5: genetic analysis in
Excel. Population genetic software for teaching and research
—an update. Bioinformatics, 28, 2537–2539.Peery MZ, Kirby R, Reid BN et al. (2012) Reliability of genetic
bottleneck tests for detecting recent population declines.
Molecular Ecology, 21, 3403–3418.Pimentel D, Zuniga R, Morrison D (2005) Update on the envi-
ronmental and economic costs associated with alien-invasive
species in the United States. Ecological Economics, 52, 273–288.Piry S, Luikart G, Cornuet J-M (1999) BOTTLENECK: a program
for detecting recent effective population size reductions from
allele data frequencies. The Journal of Heredity, 90, 502–503.Piry S, Alapetite A, Cornuet JM et al. (2004) GENECLASS2: a
software for genetic assignment and first-generation migrant
detection. The Journal of Heredity, 95, 536–539.Rousset F (2008) genepop’007: a complete re-implementation of
the genepop software for Windows and Linux. Molecular
Ecology Resources, 8, 103–106.Stewart NC, Warwick SI (2005) Crops Come from Wild Plants —
How Domestication, Transgenes, and Linkage Together Shape
Ferality. In: Crop Ferality and Volunteerism (ed. Gressel J), pp.
9–30. CRC Press, Boca Raton, FL, USA.
Tehranchian P, Riar DS, Norsworthy JK et al. (2015) ALS-resis-
tant smallflower umbrella sedge (Cyperus difformis) in Arkan-
sas rice: physiological and molecular basis of resistance.
Weed Science, 63, 561–568.Thomann M, Imbert E, Engstrand RC, Cheptou PO (2015) Con-
temporary evolution of plant reproductive strategies under
global change is revealed by stored seeds. Journal of Evolu-
tionary Biology, 28, 766–778.
Van Etten ML, Chang S-M, Baucom RS (2015) Reduced seed
viability as a cost of glyphosate resistance in an agricultural
weed. Evolution, in press. doi: 10.1101/030833.
Vigueira CC, Olsen KM, Caicedo AL (2013) The red queen in
the corn: agricultural weeds as models of rapid adaptive
evolution. Heredity, 110, 303–311.Waselkov KE, Olsen KM (2014) Population genetics and origin
of the native North American agricultural weed waterhemp
(Amaranthus tuberculatus; Amaranthaceae). American Journal of
Botany, 101, 1726–1736.Zar JH (1996) Biostatistical Analysis. Prentice Hall, Upper Saddle
River, New Jersey.
A.K collected seeds, performed experiments, analyzed
data and wrote the paper; A.W collected data; S.M.C
collected data and contributed to the manuscript; R.S.B
designed the study, performed the analyses, and wrote
the paper. All authors discussed the results and com-
mented on the manuscript.
Data accessibility
SSR Genotyping and morphological data are available
on Dryad, doi: http://dx.doi.org/10.5061/dryad.38j37.
Supporting information
Additional supporting information may be found in the online ver-
sion of this article.
Appendix S1 Materials and methods.
Table S1 Site and location information for I. purpurea popula-
tions used in genetic, growth and herbicide resistant assays.
Table S2 Sampling information for temporally-sampled popu-
lations of Ipomoea purpurea.
Table S3 The genetic diversity of populations between sam-
pling years with loci with putative null alleles removed (retain-
ing 8 of the original 15).
Table S4 Analysis of Molecular Variance (AMOVA) of neutral
genetic data estimated using GENEALEX v 6.5 (Pekall and Smouse
2012).
Table S5 The (A) survival and (B) above-ground biomass (s-
tandardized to controls) at each treatment level popula-
tion 9 year combination.
© 2016 John Wiley & Sons Ltd
4520 A. KUESTER ET AL.
Recommended