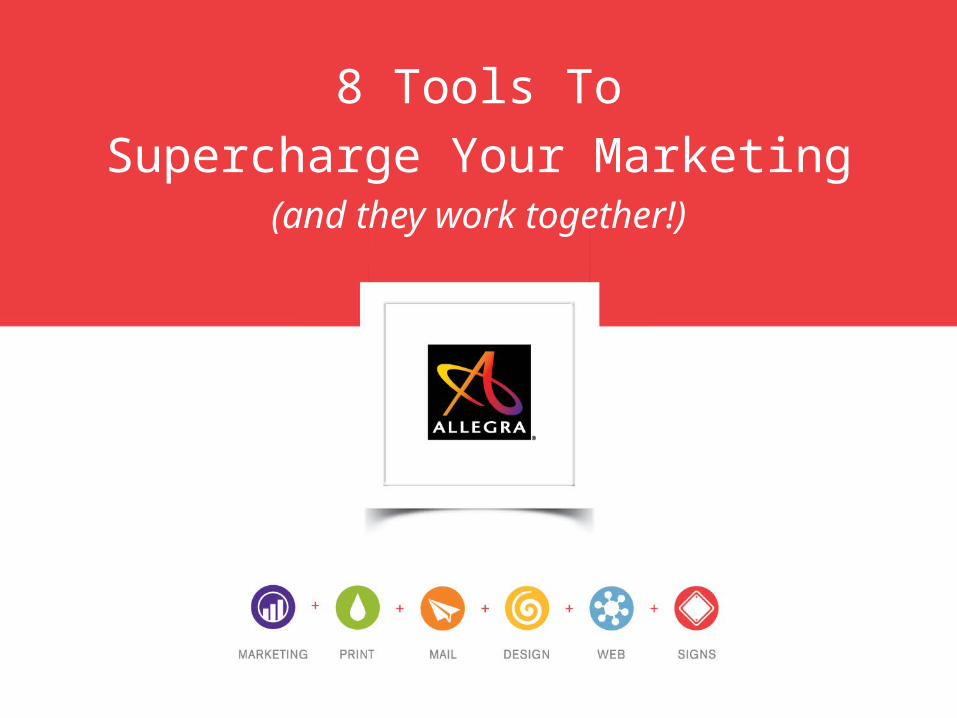
8 Tools To
Supercharge Your Marketing(and they work together!)
About the Presenter
• Jim Elder
– President of Allegra Design Web Print, an integrated marketing
services agency
– Local work• Board member Missouri Venture Forum
• Board member Children’s Home Society
• Board member Creve Coeur Olivette Chamber of Commerce
• Board member Maryland Heights Chamber of Commerce
– Past lives• Asst. Professor at Lindenwood University
– Chair, Dept of Entrepreneurial Studies
– Marketing, pricing and channel strategies
• Former SVP Marketing at healthcare services & biotechnology companies
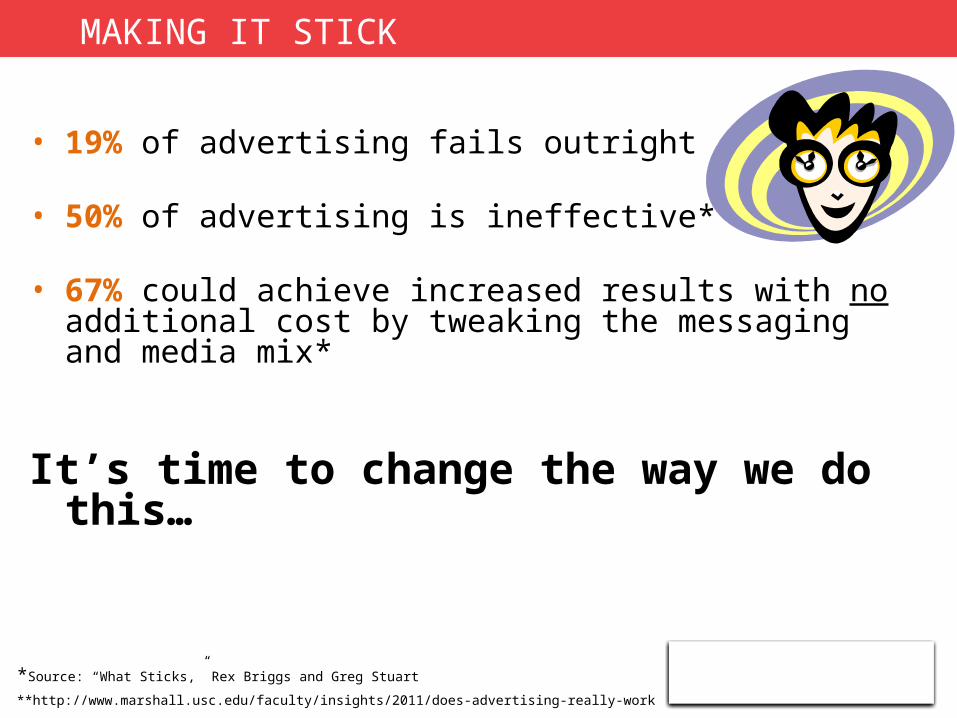
• 19% of advertising fails outright
• 50% of advertising is ineffective**
• 67% could achieve increased results with no additional cost by tweaking the messaging and media mix*
It’s time to change the way we do this…
*Source: “What Sticks,” Rex Briggs and Greg Stuart
**http://www.marshall.usc.edu/faculty/insights/2011/does-advertising-really-work
MAKING IT STICK
Who’s Your Customer?
Of course you know that the more you know about someone, the easier it is to find out what they need and sell to them, right?
• So, how many kids do most of your customers have?
• Are they married?
• How old are they?
• Do they own a house? What’s it worth?
You know this stuff, right?
• What do they do for fun?
• What are their hobbies?
• What’s their education level?
• What’s their net worth?
• How do they invest their money?
• Where do they like to shop?
• How do they shop?
Knowing this is a lot harder, isn’t it? If you did know this, would it influence how you communicate with your customers? With how you prospect for new customers? Let’s hope so.
Who’s Your Customer?
…and Find More Like Them
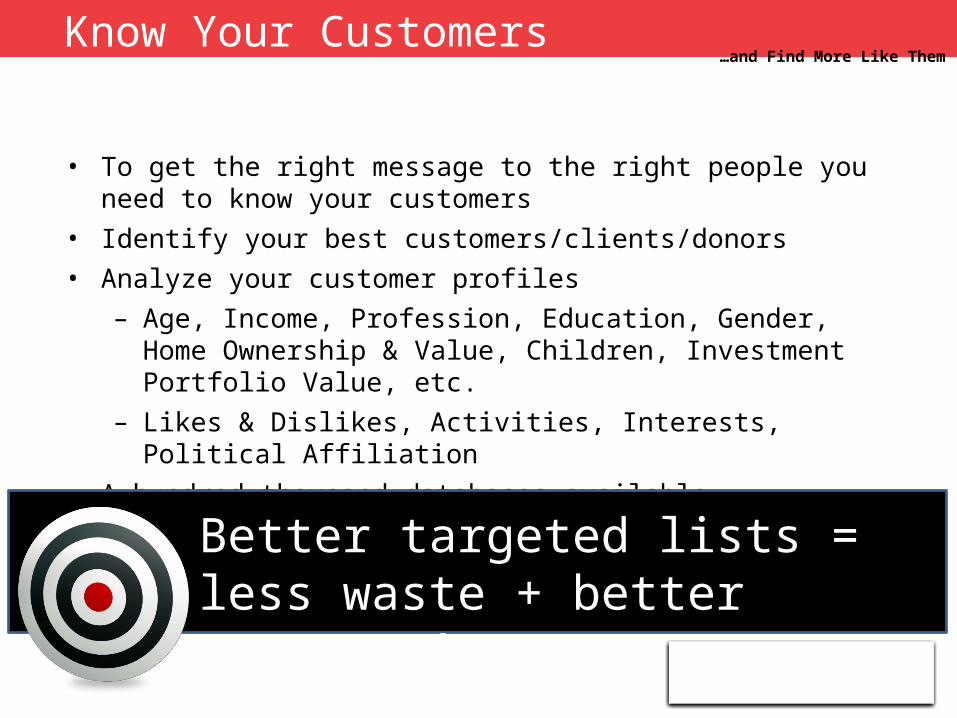
• To get the right message to the right people you need to know your customers
• Identify your best customers/clients/donors
• Analyze your customer profiles
– Age, Income, Profession, Education, Gender, Home Ownership & Value, Children, Investment Portfolio Value, etc.
– Likes & Dislikes, Activities, Interests, Political Affiliation
• A hundred thousand databases available
Know Your Customers
Better targeted lists = less waste + better response!
Knowing Your Customers
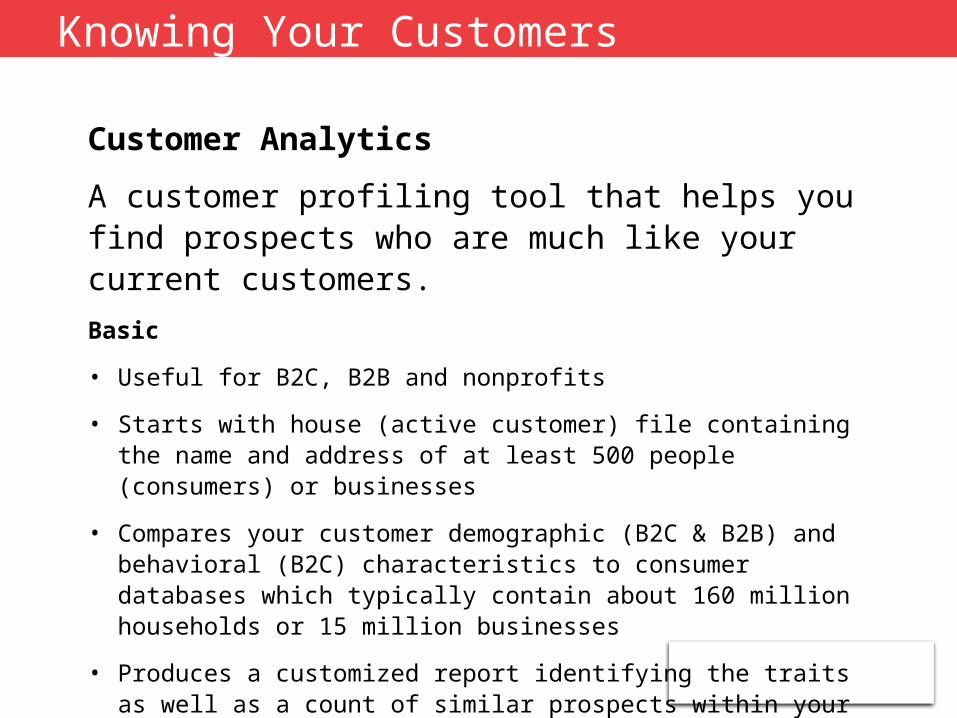
Customer Analytics
A customer profiling tool that helps you find prospects who are much like your current customers.
Basic
• Useful for B2C, B2B and nonprofits
• Starts with house (active customer) file containing the name and address of at least 500 people (consumers) or businesses
• Compares your customer demographic (B2C & B2B) and behavioral (B2C) characteristics to consumer databases which typically contain about 160 million households or 15 million businesses
• Produces a customized report identifying the traits as well as a count of similar prospects within your selected target geography
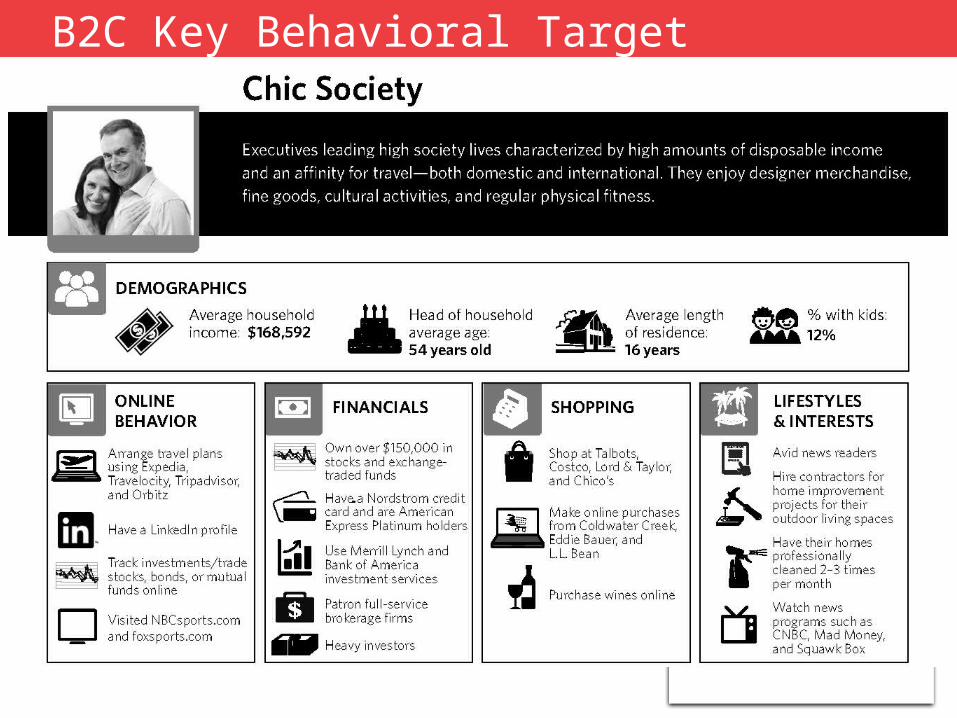
B2C Key Behavioral Target
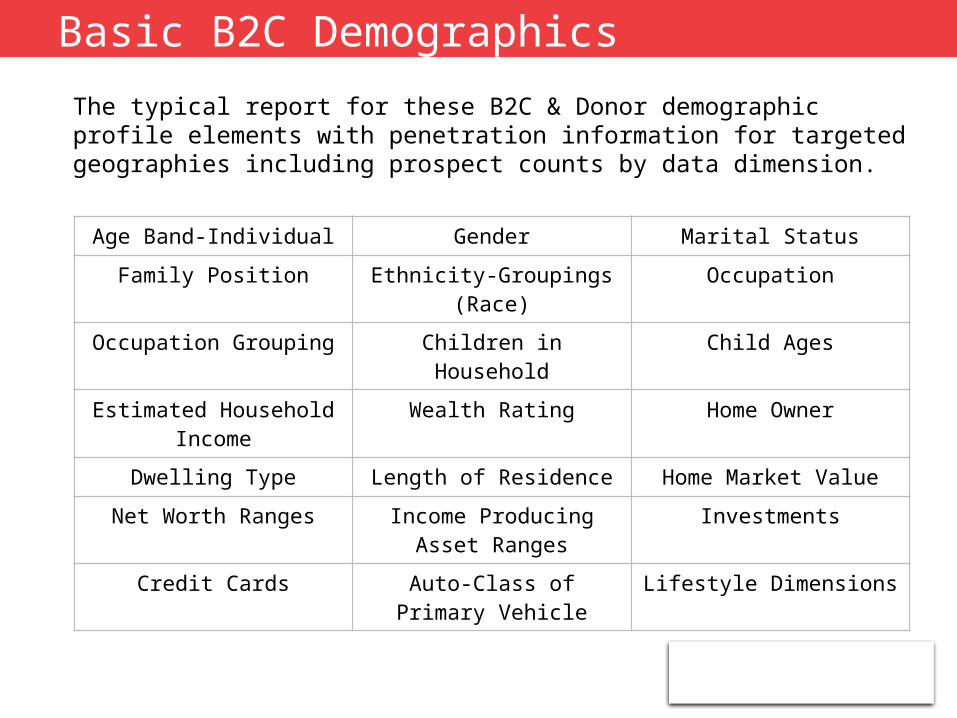
Basic B2C Demographics
Age Band-Individual Gender Marital Status
Family Position Ethnicity-Groupings (Race) Occupation
Occupation Grouping Children in Household Child Ages
Estimated Household Income
Wealth Rating Home Owner
Dwelling Type Length of Residence Home Market Value
Net Worth Ranges Income Producing Asset Ranges
Investments
Credit Cards Auto-Class of Primary Vehicle
Lifestyle Dimensions
The typical report for these B2C & Donor demographic profile elements with penetration information for targeted geographies including prospect counts by data dimension.
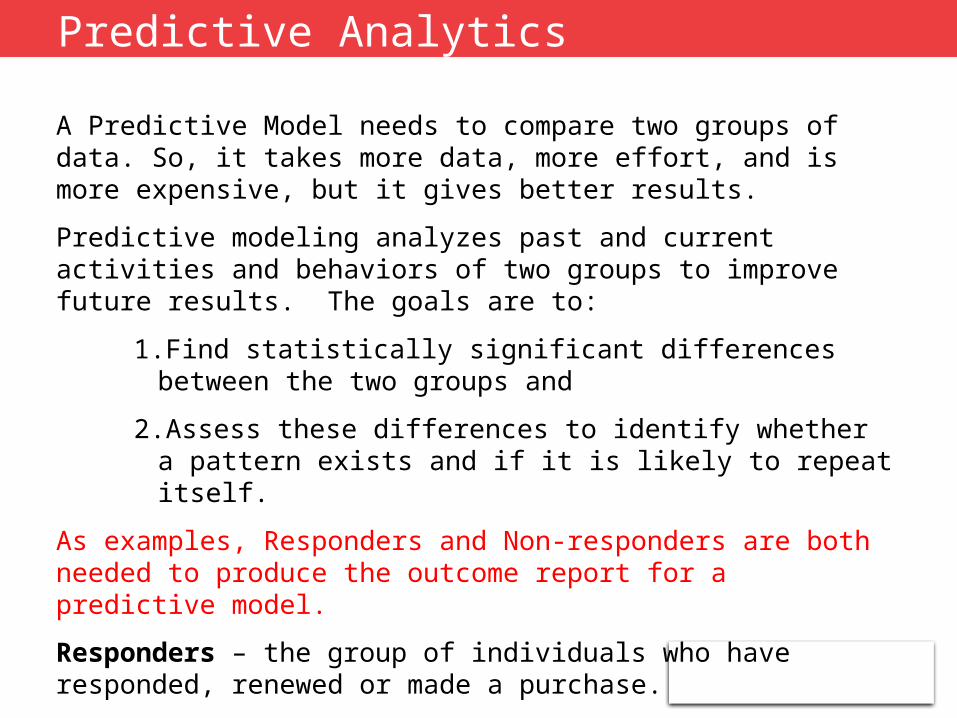
Predictive Analytics
A Predictive Model needs to compare two groups of data. So, it takes more data, more effort, and is more expensive, but it gives better results.
Predictive modeling analyzes past and current activities and behaviors of two groups to improve future results. The goals are to:
1.Find statistically significant differences between the two groups and
2.Assess these differences to identify whether a pattern exists and if it is likely to repeat itself.
As examples, Responders and Non-responders are both needed to produce the outcome report for a predictive model.
Responders – the group of individuals who have responded, renewed or made a purchase.
Non-responders - the group of individuals who were marketed to or contacted and did not respond, renew or make a purchase.
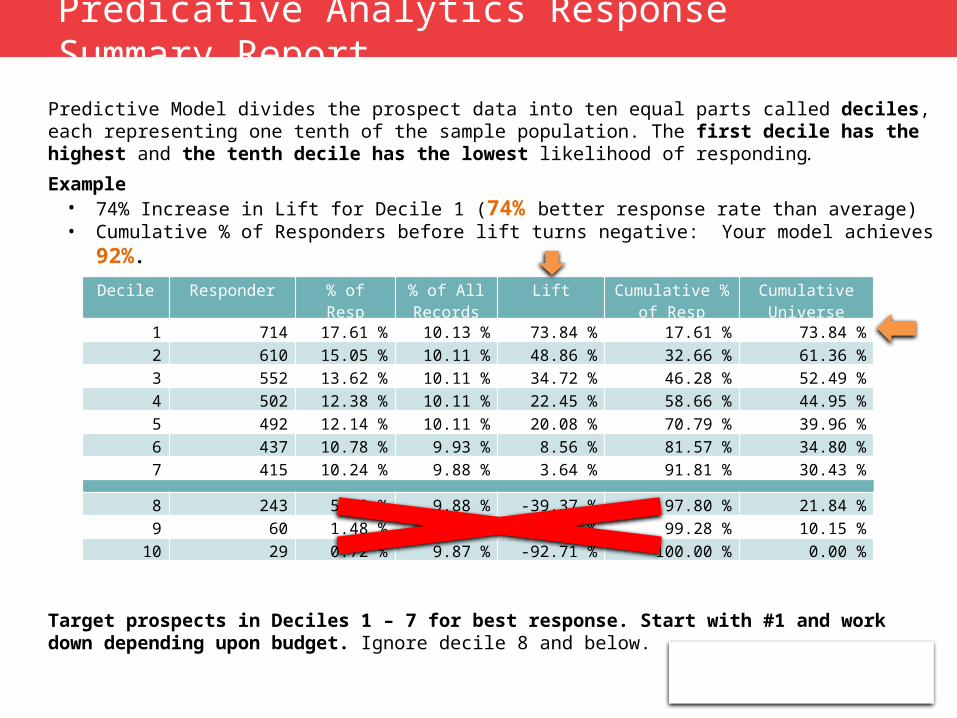
Predicative Analytics Response Summary Report
Predictive Model divides the prospect data into ten equal parts called deciles, each representing one tenth of the sample population. The first decile has the highest and the tenth decile has the lowest likelihood of responding.
Example• 74% Increase in Lift for Decile 1 (74% better response rate than average)• Cumulative % of Responders before lift turns negative: Your model achieves 92%.
Target prospects in Deciles 1 – 7 for best response. Start with #1 and work down depending upon budget. Ignore decile 8 and below.
Decile Responder % of Resp % of All Records
Lift Cumulative % of Resp
Cumulative Universe
1 714 17.61 % 10.13 % 73.84 % 17.61 % 73.84 %
2 610 15.05 % 10.11 % 48.86 % 32.66 % 61.36 %
3 552 13.62 % 10.11 % 34.72 % 46.28 % 52.49 %
4 502 12.38 % 10.11 % 22.45 % 58.66 % 44.95 %
5 492 12.14 % 10.11 % 20.08 % 70.79 % 39.96 %
6 437 10.78 % 9.93 % 8.56 % 81.57 % 34.80 %
7 415 10.24 % 9.88 % 3.64 % 91.81 % 30.43 %
8 243 5.99 % 9.88 % -39.37 % 97.80 % 21.84 %
9 60 1.48 % 9.87 % -85.01 % 99.28 % 10.15 %
10 29 0.72 % 9.87 % -92.71 % 100.00 % 0.00 %
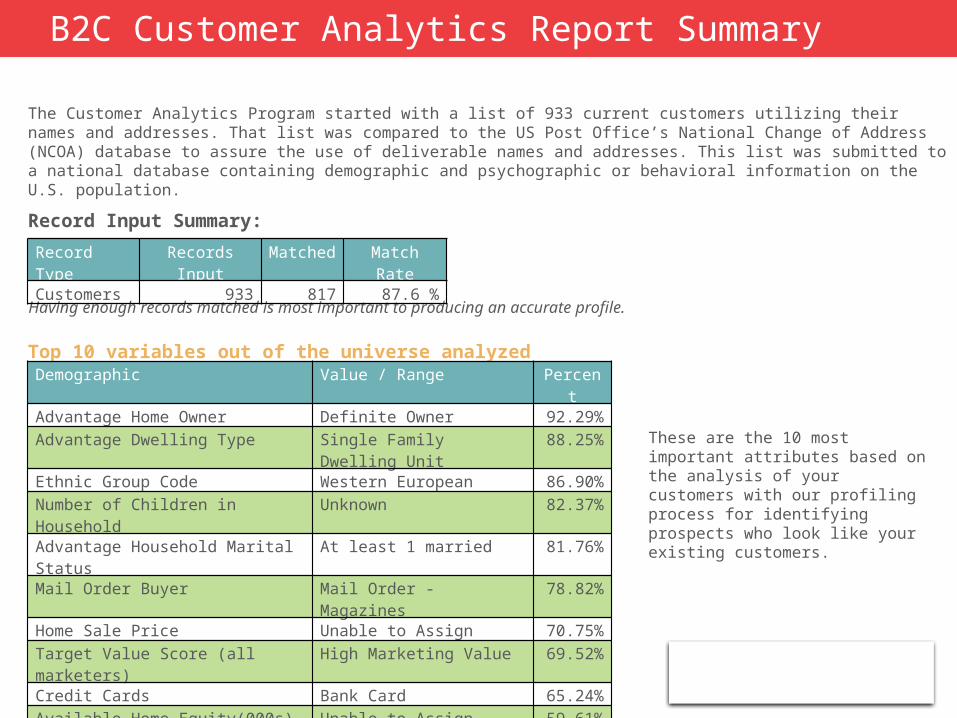
Record Input Summary:
Top 10 variables out of the universe analyzed
These are the 10 most important attributes based on the analysis of your customers with our profiling process for identifying prospects who look like your existing customers.
B2C Customer Analytics Report Summary
Having enough records matched is most important to producing an accurate profile.
Demographic Value / Range PercentAdvantage Home Owner Definite Owner 92.29%Advantage Dwelling Type Single Family Dwelling
Unit88.25%
Ethnic Group Code Western European 86.90%Number of Children in Household Unknown 82.37%Advantage Household Marital Status
At least 1 married 81.76%
Mail Order Buyer Mail Order - Magazines 78.82%Home Sale Price Unable to Assign 70.75%Target Value Score (all marketers)
High Marketing Value 69.52%
Credit Cards Bank Card 65.24%Available Home Equity(000s) Unable to Assign 59.61%
Record Type Records Input
Matched
Match Rate
Customers 933 817 87.6 %
The Customer Analytics Program started with a list of 933 current customers utilizing their names and addresses. That list was compared to the US Post Office’s National Change of Address (NCOA) database to assure the use of deliverable names and addresses. This list was submitted to a national database containing demographic and psychographic or behavioral information on the U.S. population.
What’s Next?
Now you know a lot more than before about
your customers. How can you use this
information to supercharge your marketing?
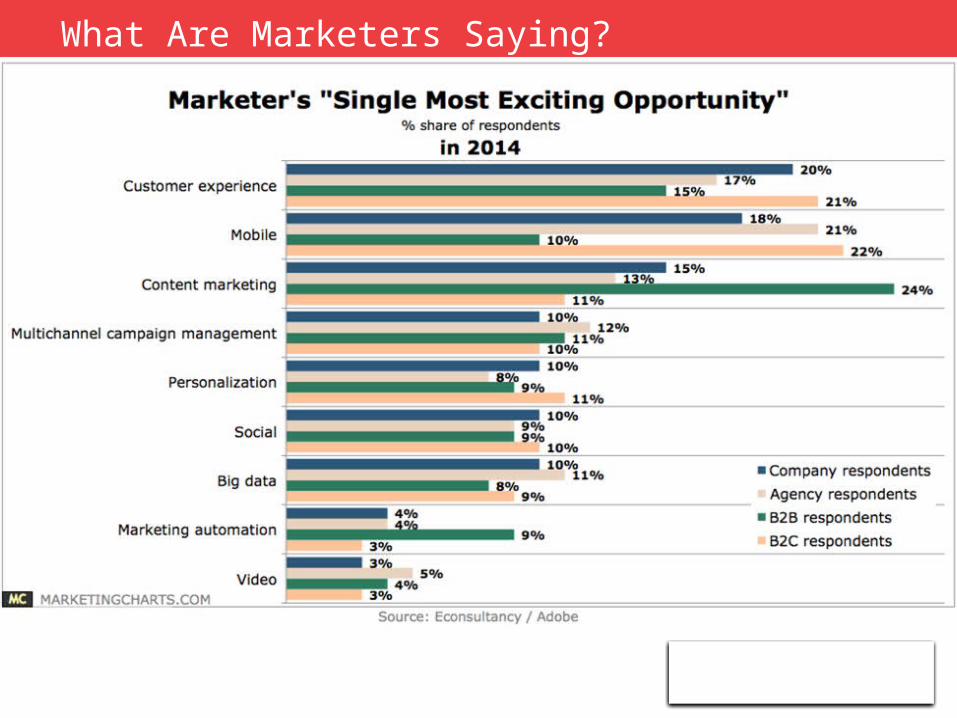
What Are Marketers Saying?
http://www.emarketer.com/Article/Do-Small-Business-Websites-Drive-Client-Engagement/1012105
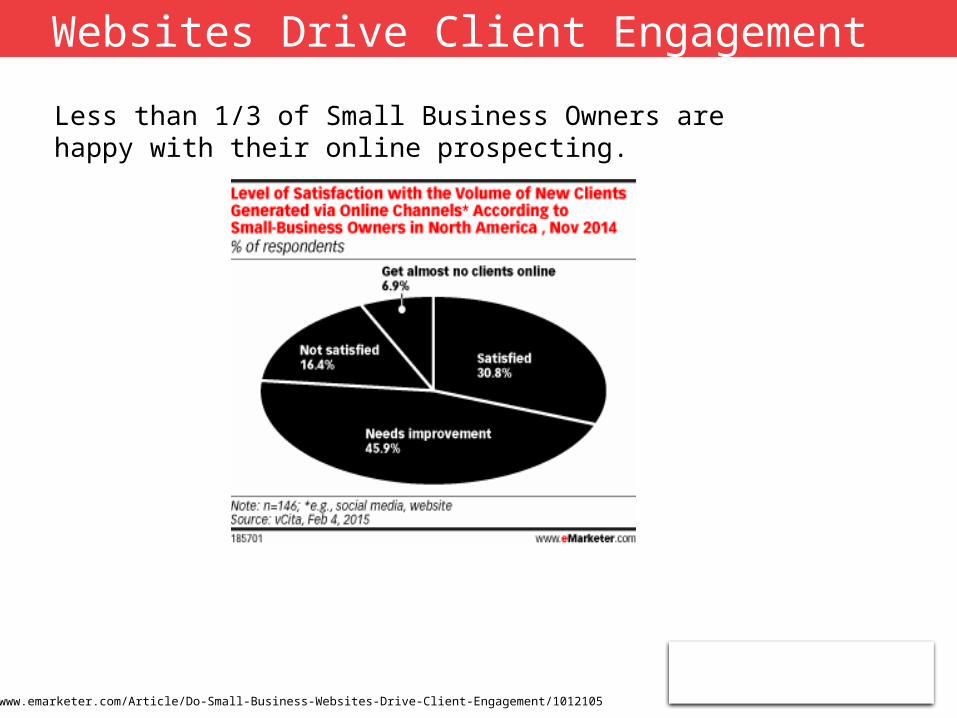
Websites Drive Client Engagement
Less than 1/3 of Small Business Owners are happy with their online prospecting.
Source: Google thinkinsight study, “The Mobile Movement: Understanding Smartphone Users,” April 2011
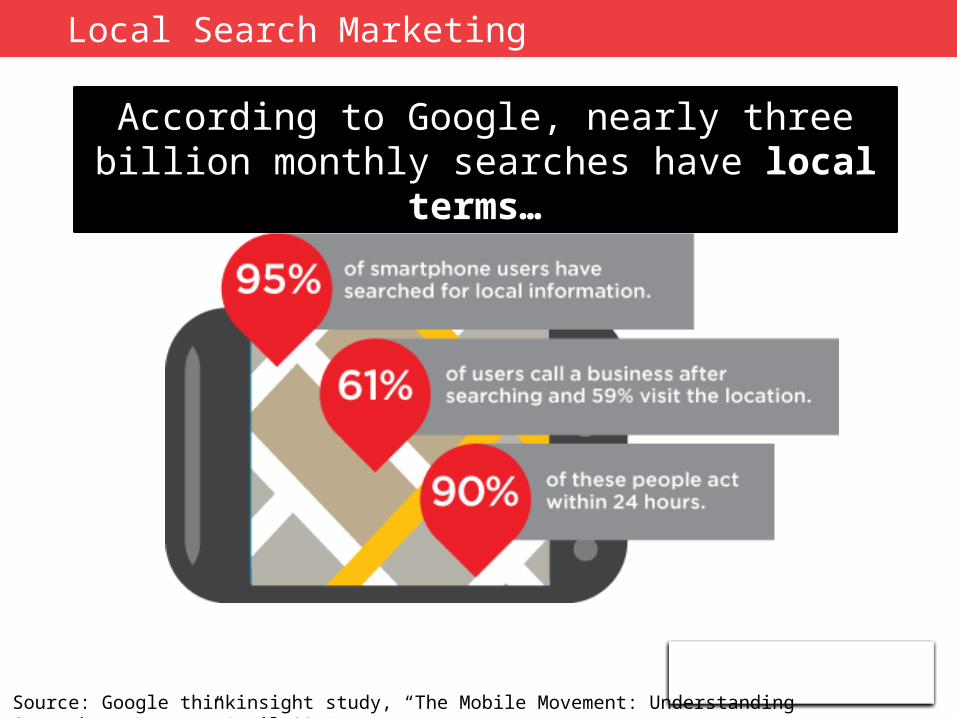
According to Google, nearly three billion monthly searches have local terms…
Local Search Marketing
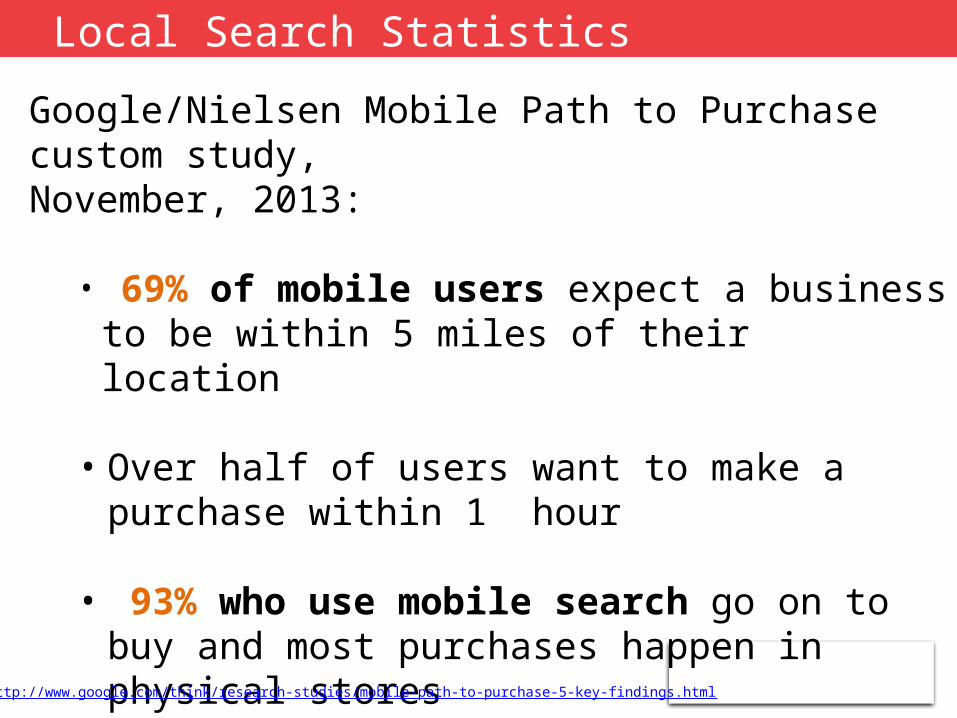
Google/Nielsen Mobile Path to Purchase custom study, November, 2013:
• 69% of mobile users expect a business to be within 5 miles of their location
• Over half of users want to make a purchase within 1 hour
• 93% who use mobile search go on to buy and most purchases happen in physical stores
Source: http://www.google.com/think/research-studies/mobile-path-to-purchase-5-key-findings.html
Local Search Statistics
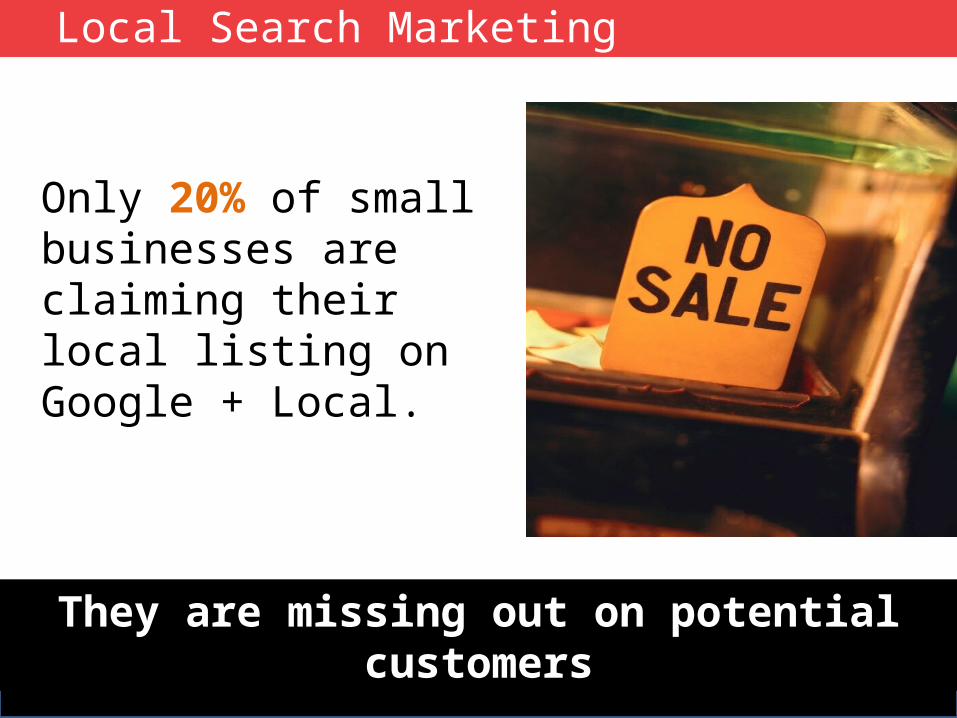
Local Search Marketing
Only 20% of small businesses are claiming their local listing on Google + Local.
They are missing out on potential customers
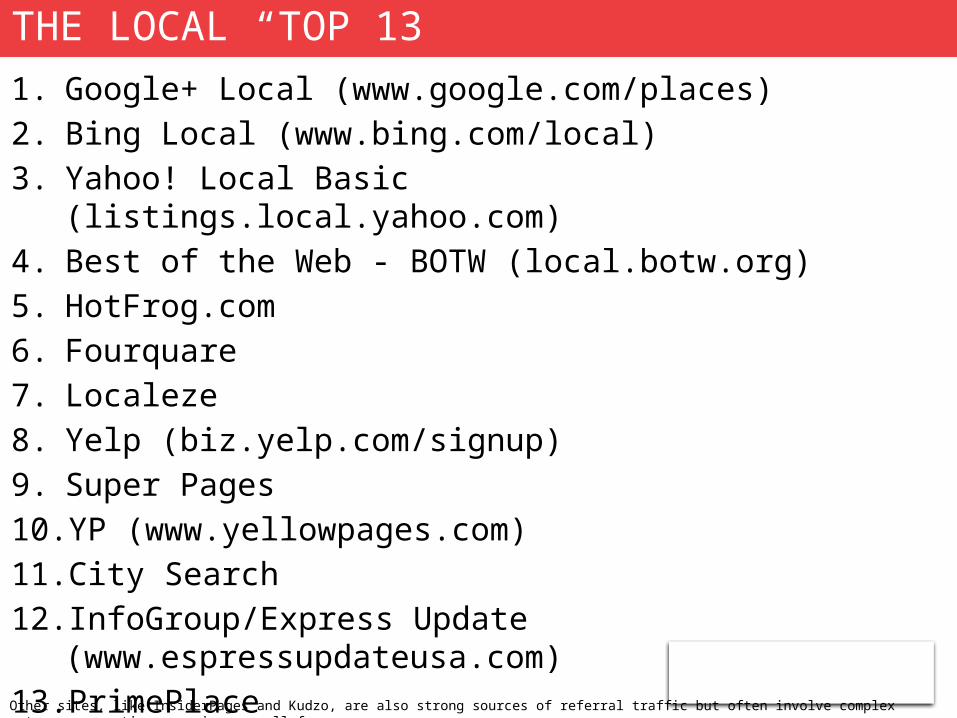
1. Google+ Local (www.google.com/places)2. Bing Local (www.bing.com/local)3. Yahoo! Local Basic (listings.local.yahoo.com)4. Best of the Web - BOTW (local.botw.org)5. HotFrog.com6. Fourquare7. Localeze8. Yelp (biz.yelp.com/signup)9. Super Pages10. YP (www.yellowpages.com)11. City Search12. InfoGroup/Express Update (www.espressupdateusa.com)13. PrimePlace
THE LOCAL “TOP 13”
Other sites, like InsiderPages and Kudzo, are also strong sources of referral traffic but often involve complex setups or sometimes require a small fee.
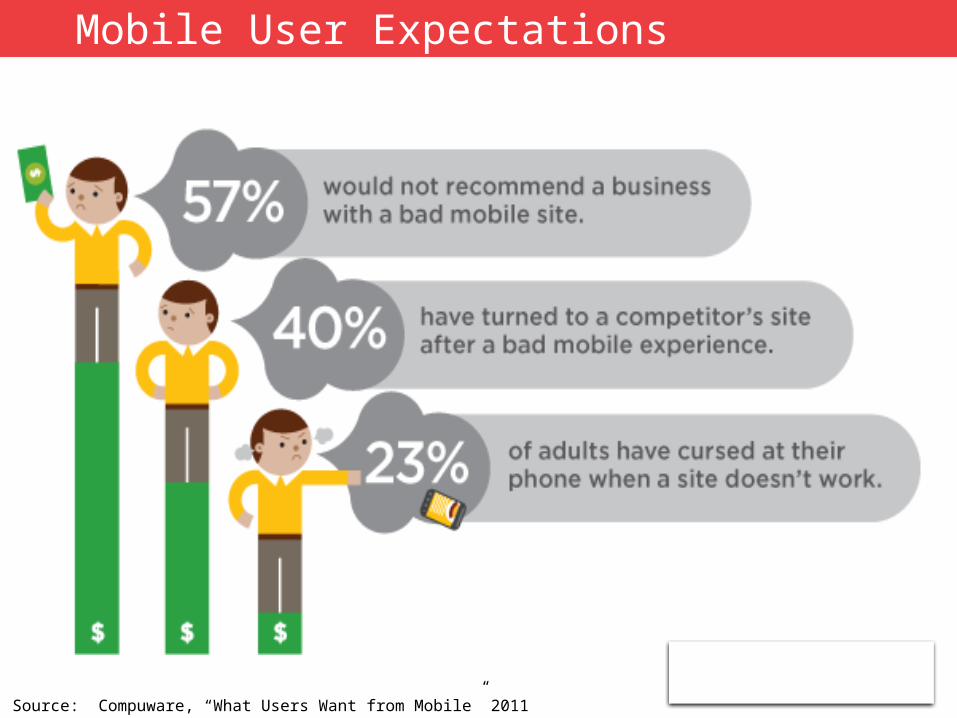
Source: Compuware, “What Users Want from Mobile” 2011
Mobile User Expectations
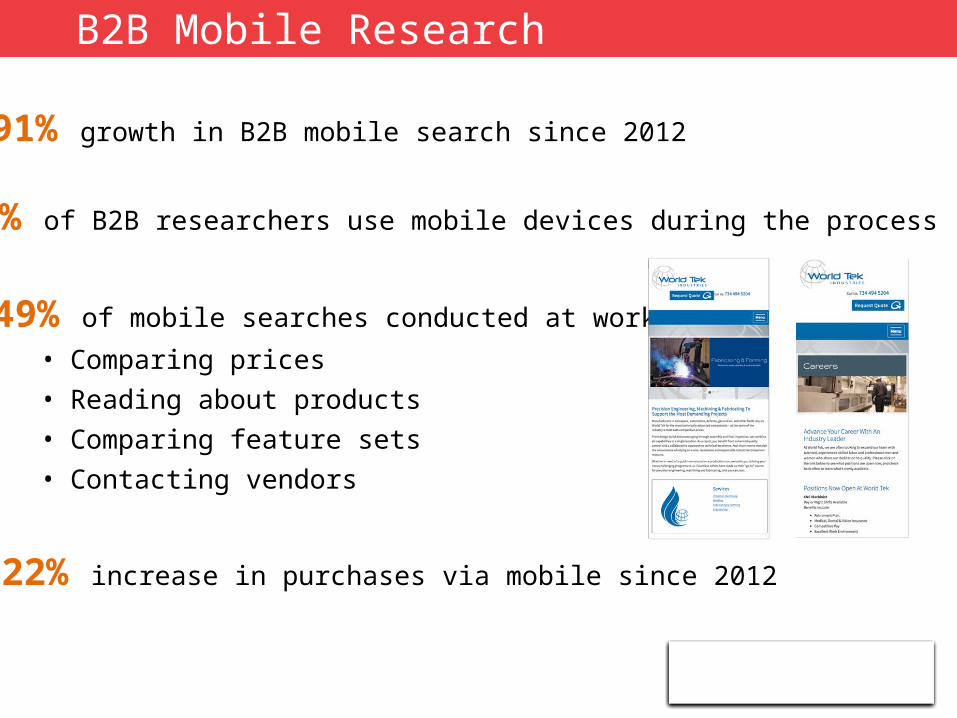
B2B Mobile Research
91% growth in B2B mobile search since 2012
42% of B2B researchers use mobile devices during the process
49% of mobile searches conducted at work
• Comparing prices
• Reading about products
• Comparing feature sets
• Contacting vendors
22% increase in purchases via mobile since 2012
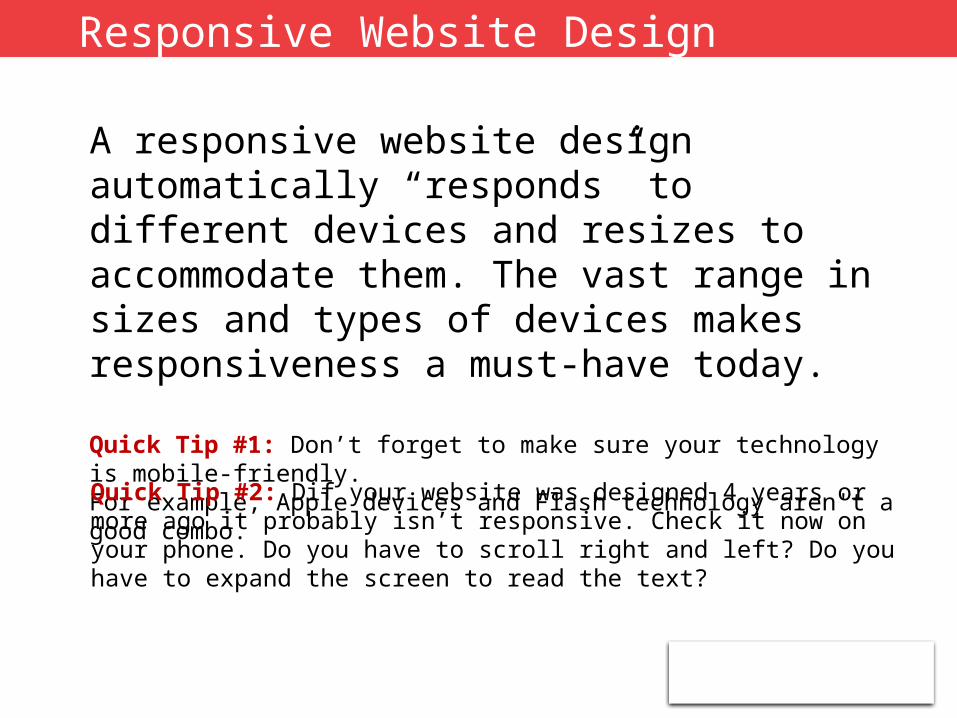
A responsive website design automatically “responds” to different devices and resizes to accommodate them. The vast range in sizes and types of devices makes responsiveness a must-have today.
Quick Tip #1: Don’t forget to make sure your technology is mobile-friendly. For example, Apple devices and Flash technology aren't a good combo.
Responsive Website Design
Quick Tip #2: Dif your website was designed 4 years or more ago it probably isn’t responsive. Check it now on your phone. Do you have to scroll right and left? Do you have to expand the screen to read the text?
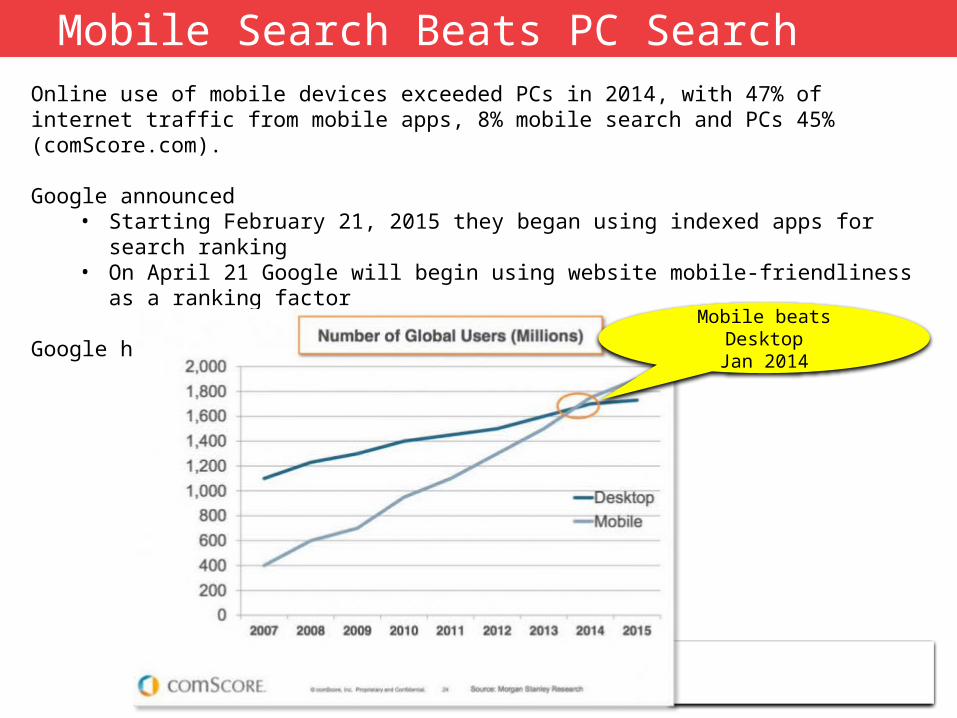
Mobile Search Beats PC SearchOnline use of mobile devices exceeded PCs in 2014, with 47% of internet traffic from mobile apps, 8% mobile search and PCs 45% (comScore.com).
Google announced • Starting February 21, 2015 they began using indexed apps for search ranking• On April 21 Google will begin using website mobile-friendliness as a ranking factor
Google has a Mobile-Friendly Test function to evaluate your website
Mobile beats DesktopJan 2014
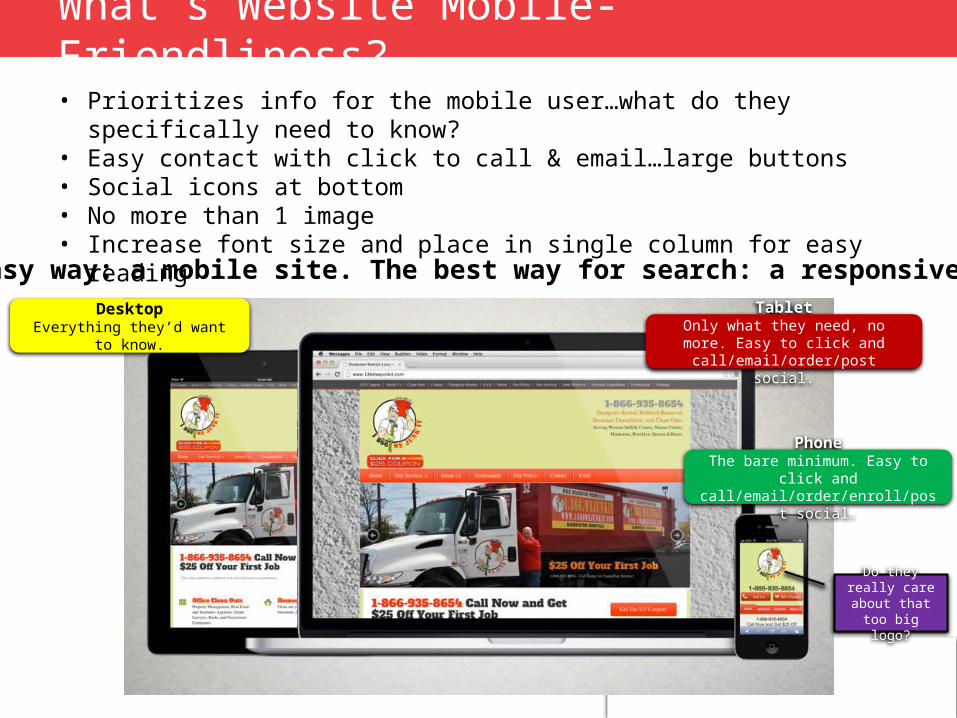
What’s Website Mobile-Friendliness?
• Prioritizes info for the mobile user…what do they specifically need to know?• Easy contact with click to call & email…large buttons• Social icons at bottom• No more than 1 image• Increase font size and place in single column for easy reading
The easy way: a mobile site. The best way for search: a responsive site.
DesktopEverything they’d want to know.
TabletOnly what they need, no more. Easy
to click and call/email/order/post social.
PhoneThe bare minimum. Easy to click and
call/email/order/enroll/post social.
Do they really care about that too big logo?
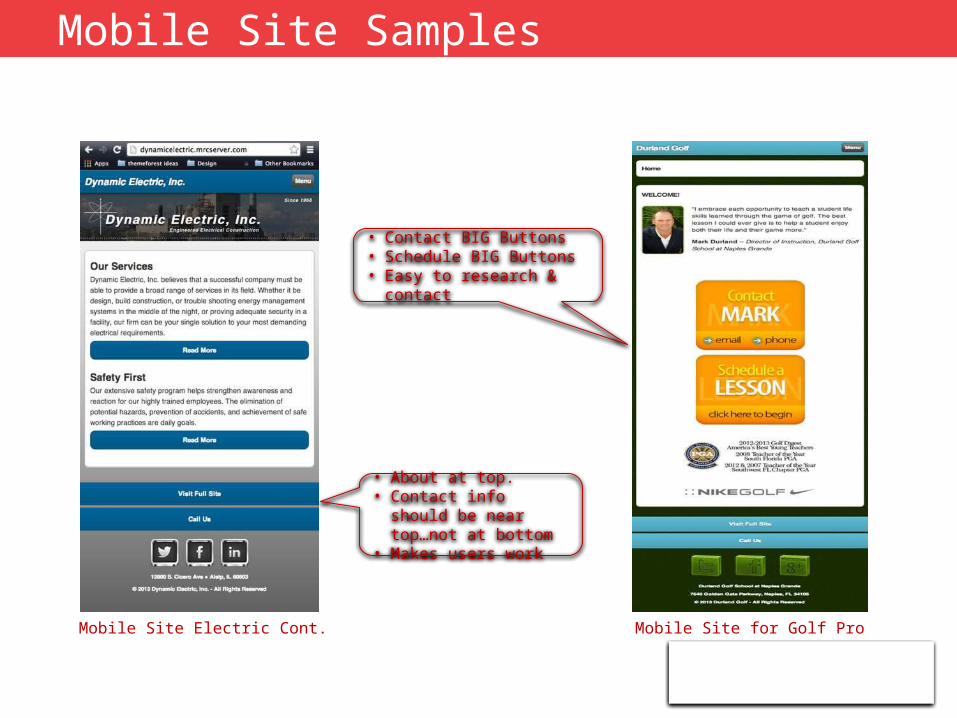
Mobile Site Samples
Mobile Site for Golf ProMobile Site Electric Cont.
• About at top. • Contact info should be
near top…not at bottom• Makes users work
• Contact BIG Buttons • Schedule BIG Buttons• Easy to research & contact
• Vertical scrolling (not horizontal)• One column• Drop-down menus and radio buttons • Minimal clicking • Fast load times • Product videos / images (close up)• Prominent phone number, hours of operation
Mobile Best Practices
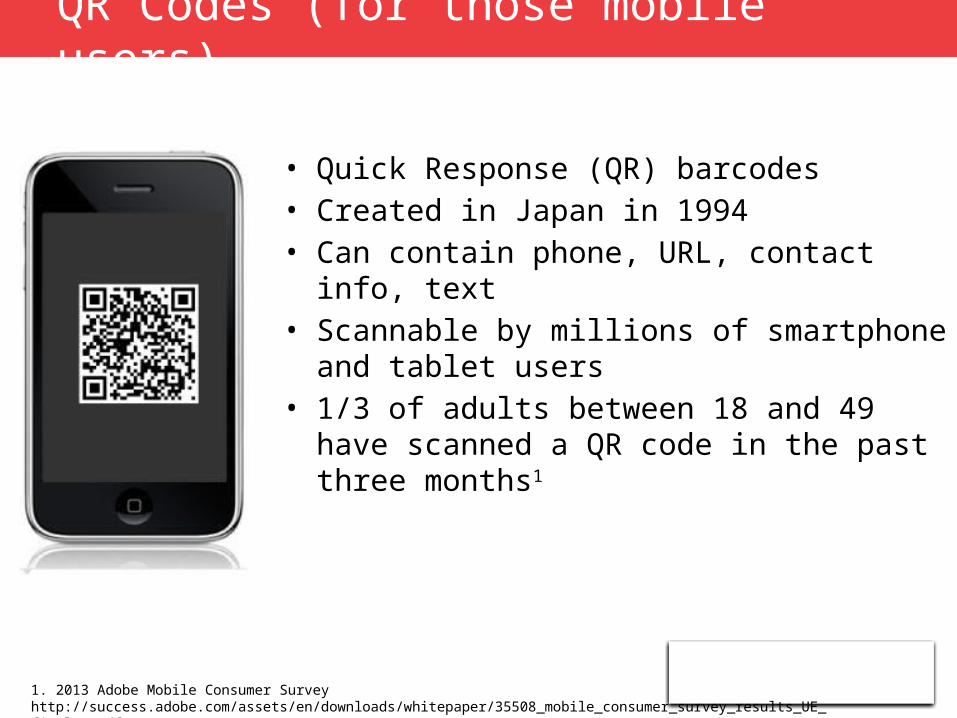
• Quick Response (QR) barcodes• Created in Japan in 1994• Can contain phone, URL, contact info, text• Scannable by millions of smartphone and
tablet users• 1/3 of adults between 18 and 49 have
scanned a QR code in the past three months1
1. 2013 Adobe Mobile Consumer Survey http://success.adobe.com/assets/en/downloads/whitepaper/35508_mobile_consumer_survey_results_UE_final-2.pdf
QR Codes (for those mobile users)
Image source: 2d-code.co.uk and qranywhere.blogspot.com
QR Code Do’s & Don’ts
Do:• Send users to a mobile-friendly site • Link to content that matters (YouTube video, special
event registration, coupon, product demo)• Provide instructions on how to use them• Make sure they work
Don’t:• Just send them to your home page• Send users to a non-responsive page
Email or Eblasts
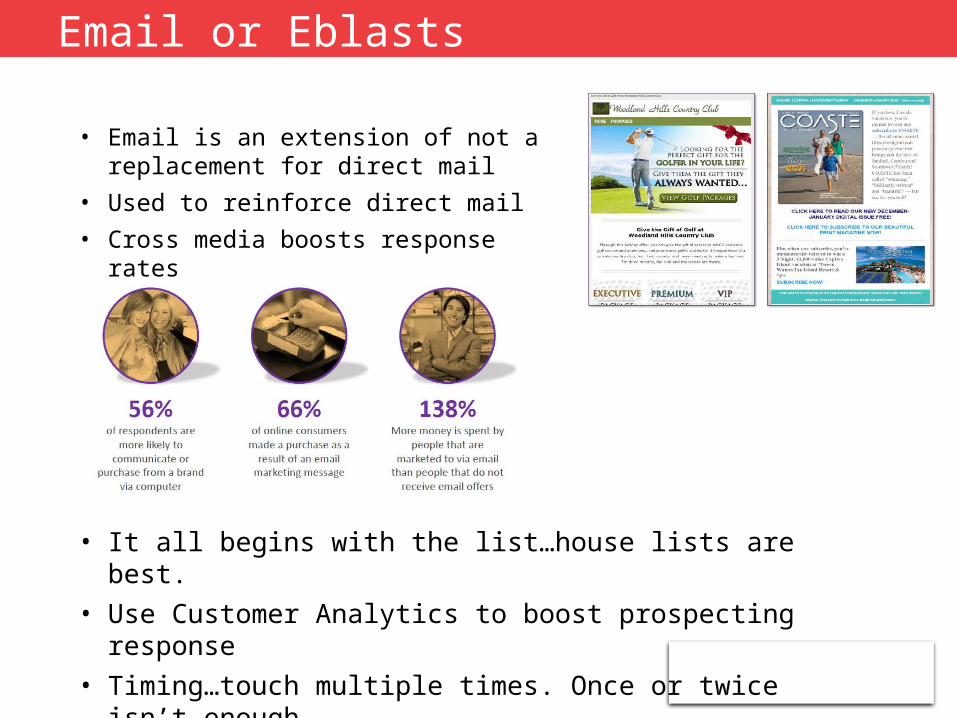
• Email is an extension of not a replacement for direct mail
• Used to reinforce direct mail
• Cross media boosts response rates
• It all begins with the list…house lists are best.
• Use Customer Analytics to boost prospecting response
• Timing…touch multiple times. Once or twice isn’t enough
• Branding…be consistent across channels
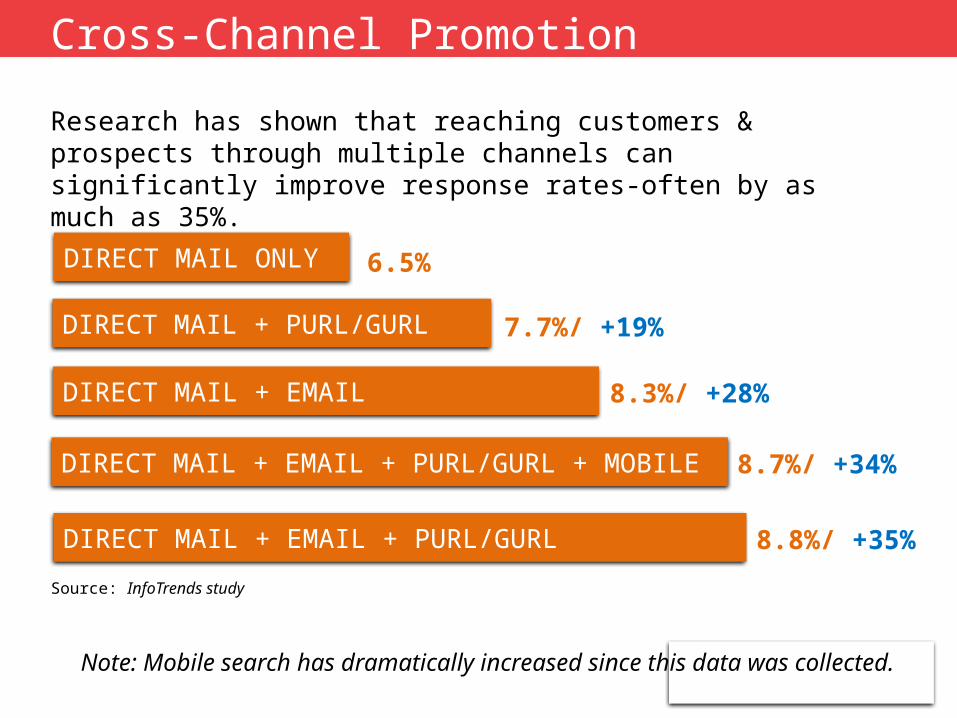
Cross-Channel Promotion
Source: InfoTrends study
DIRECT MAIL ONLY
DIRECT MAIL + PURL/GURL
DIRECT MAIL + EMAIL
DIRECT MAIL + EMAIL + PURL/GURL + MOBILE
DIRECT MAIL + EMAIL + PURL/GURL
6.5%
7.7%/ +19%
8.3%/ +28%
8.7%/ +34%
8.8%/ +35%
Research has shown that reaching customers & prospects through multiple channels can significantly improve response rates-often by as much as 35%.
Note: Mobile search has dramatically increased since this data was collected.
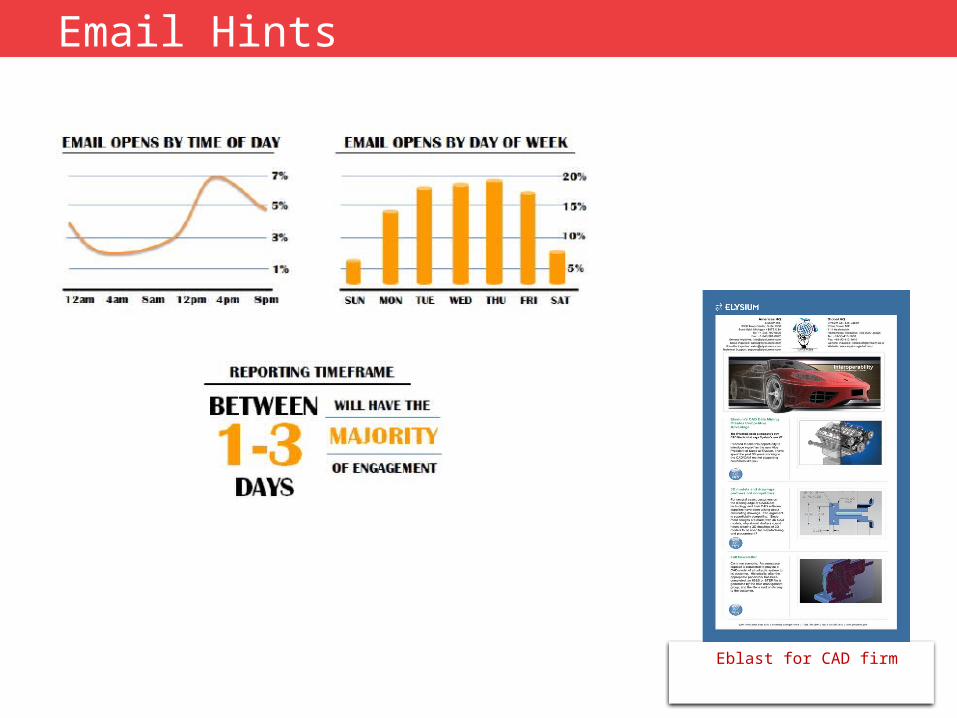
Email Hints
Eblast for CAD firm
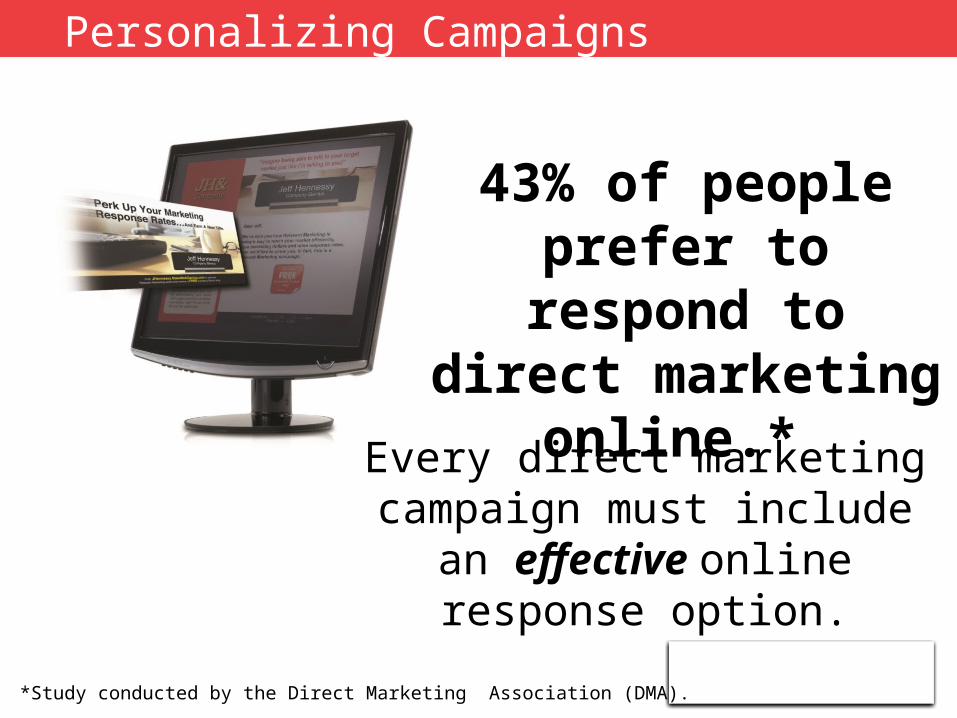
Personalizing Campaigns
43% of people prefer to respond to direct
marketing online.*
Every direct marketing campaign must include an effective online
response option.
*Study conducted by the Direct Marketing Association (DMA).
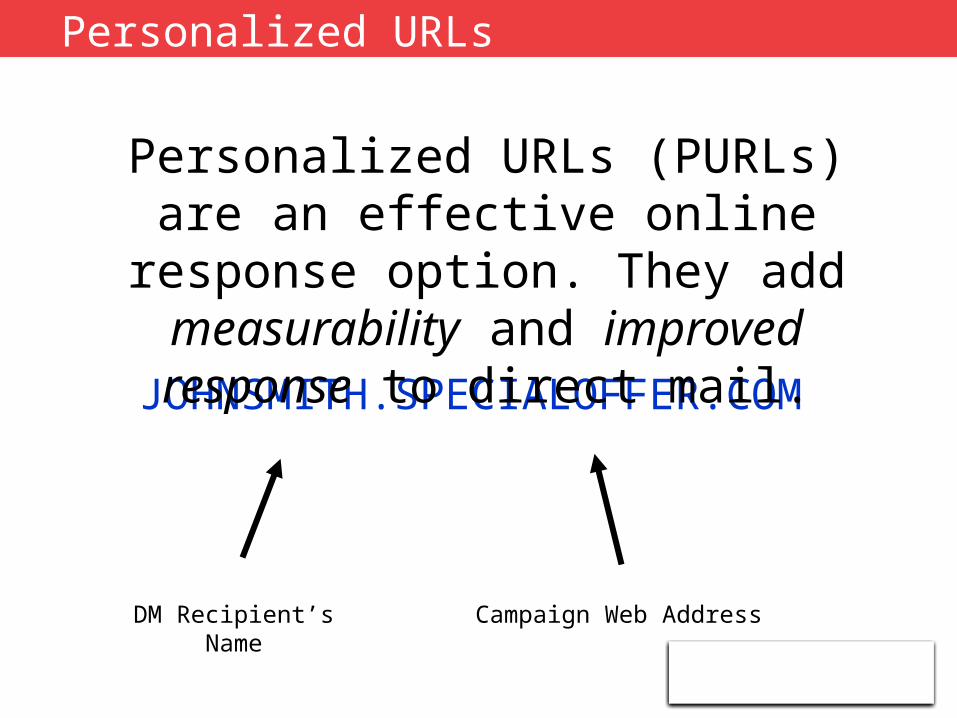
JOHNSMITH.SPECIALOFFER.COM
Personalized URLs (PURLs) are an effective online response option.
They add measurability and improved response to direct mail.
DM Recipient’s Name Campaign Web Address
Personalized URLs
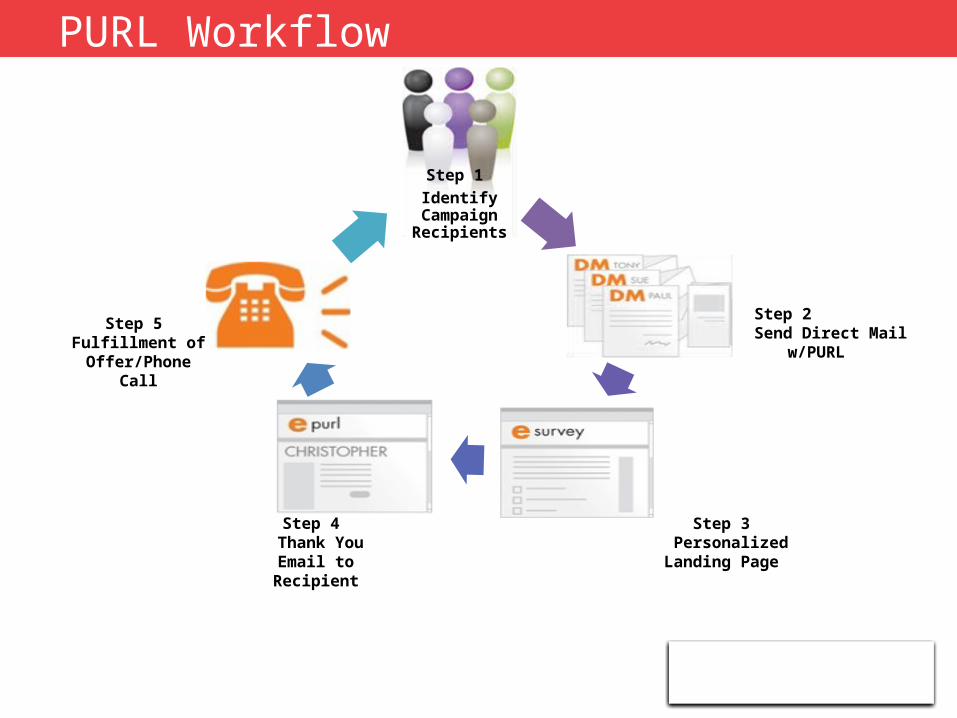
PURL Workflow
Step 1
Identify Campaign Recipients
Step 2 Send Direct Mail
w/PURL
Step 3 Personalized Landing Page
Step 4 Thank You Email
to Recipient
Step 5 Fulfillment of
Offer/Phone Call
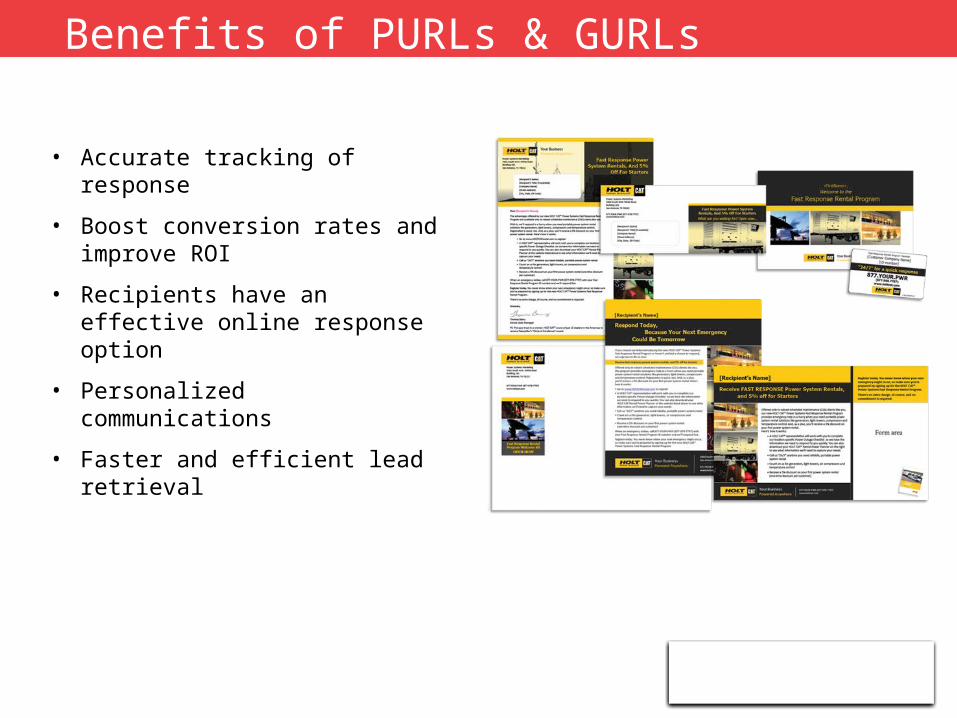
• Accurate tracking of response
• Boost conversion rates and improve ROI
• Recipients have an effective online response option
• Personalized communications
• Faster and efficient lead retrieval
Benefits of PURLs & GURLs
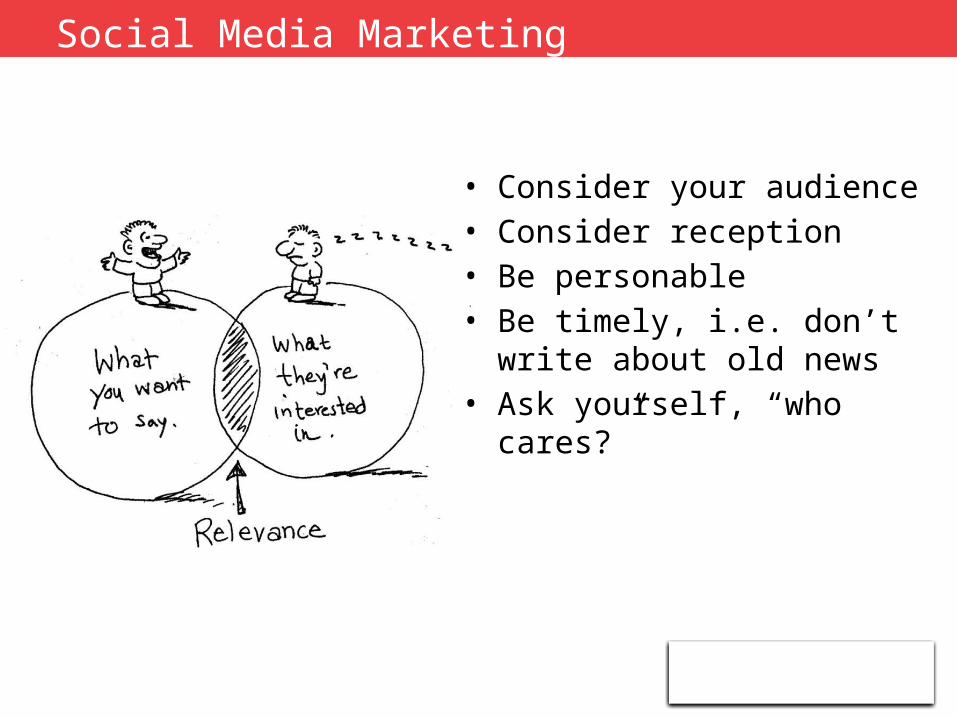
• Consider your audience• Consider reception• Be personable • Be timely, i.e. don’t write about
old news• Ask yourself, “who cares?”
Social Media Marketing
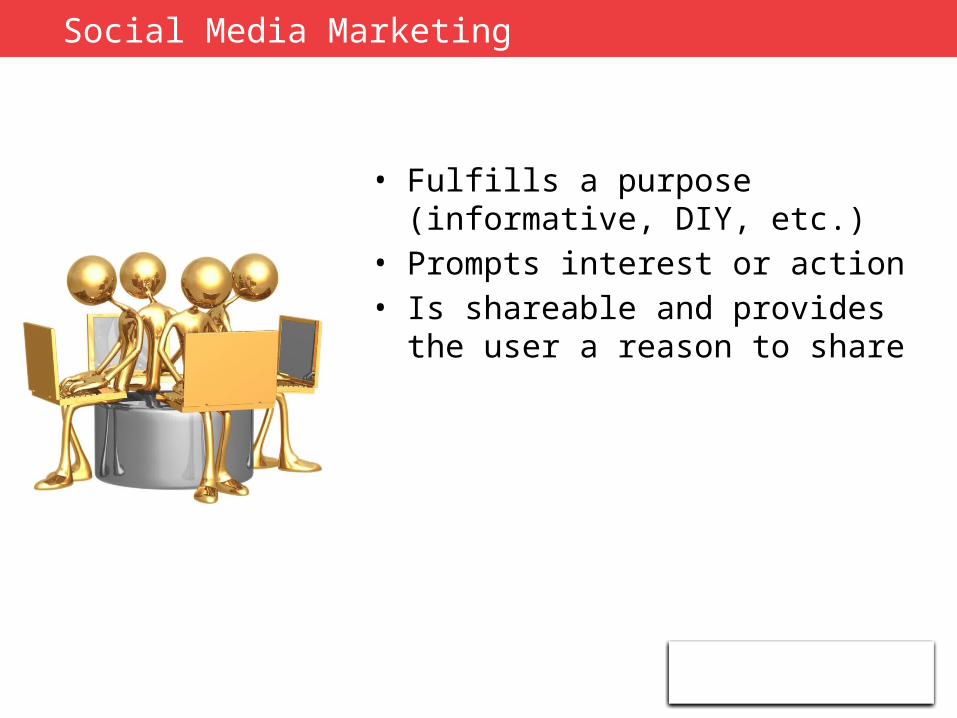
• Fulfills a purpose (informative, DIY, etc.)
• Prompts interest or action• Is shareable and provides the user
a reason to share
Social Media Marketing
• The phenomenal success of Instagram and the continued strength of Facebook, Twitter and Pinterest make image marketing a must.
• Take good quality photographs of your products in artful settings, and share them. Make them look interesting, and people will be more likely to share.
Images are worth a thousand words
Social Media & Image Marketing
• Capture your customers’ attention with image-centric content on Pinterest, Instagram, Tumblr, Slideshare and Vine
• A photo posted to Facebook gets 20x more engagement than other posts
• A press release paired with images, videos, and downloadable files will garner up to 9.7x more views than a text release alone (Source: PR Newswire)
Everyone’s skimming; no one’s reading
Social Media & Image Marketing
Video B2B Marketing
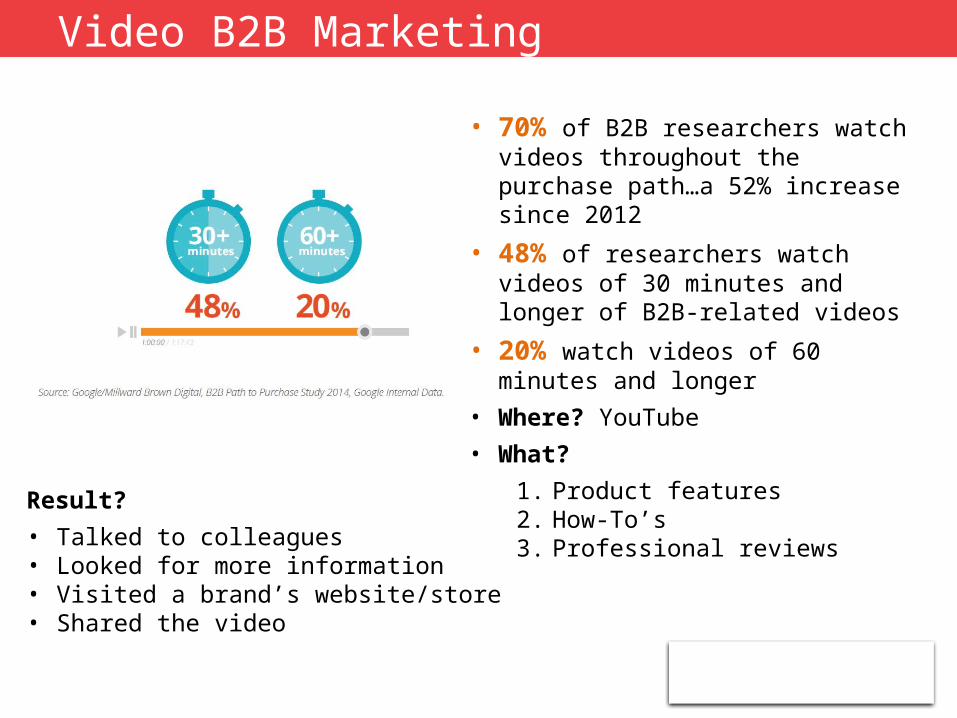
• 70% of B2B researchers watch videos throughout the purchase path…a 52% increase since 2012
• 48% of researchers watch videos of 30 minutes and longer of B2B-related videos
• 20% watch videos of 60 minutes and longer
• Where? YouTube
• What?
1. Product features2. How-To’s 3. Professional reviews
Result?
• Talked to colleagues• Looked for more information• Visited a brand’s website/store• Shared the video
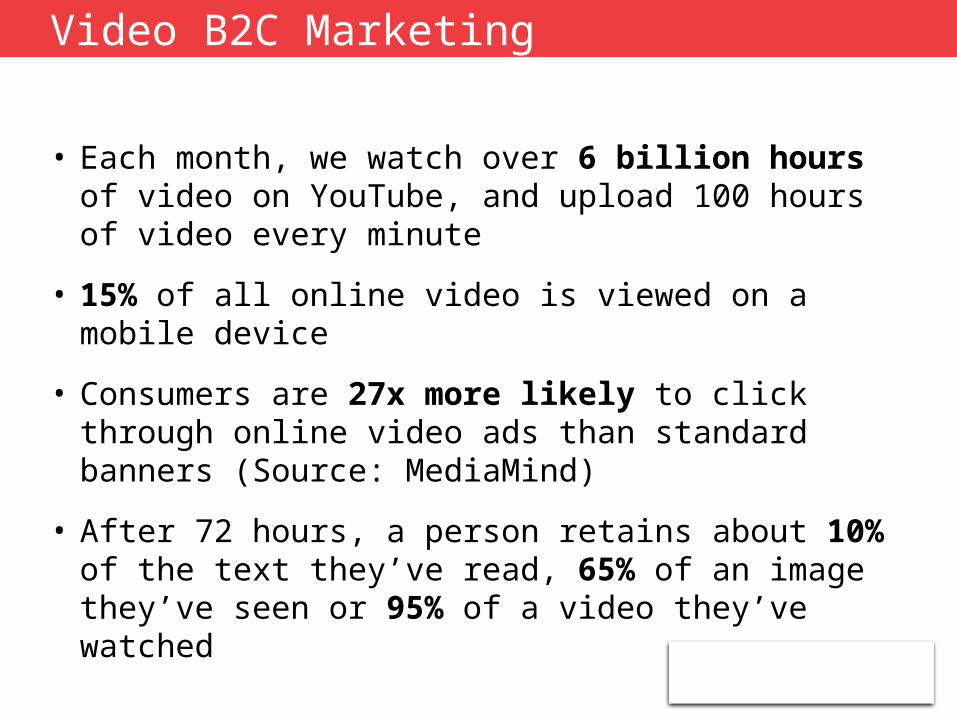
• Each month, we watch over 6 billion hours of video on YouTube, and upload 100 hours of video every minute
• 15% of all online video is viewed on a mobile device
• Consumers are 27x more likely to click through online video ads than standard banners (Source: MediaMind)
• After 72 hours, a person retains about 10% of the text they’ve read, 65% of an image they’ve seen or 95% of a video they’ve watched
Video B2C Marketing
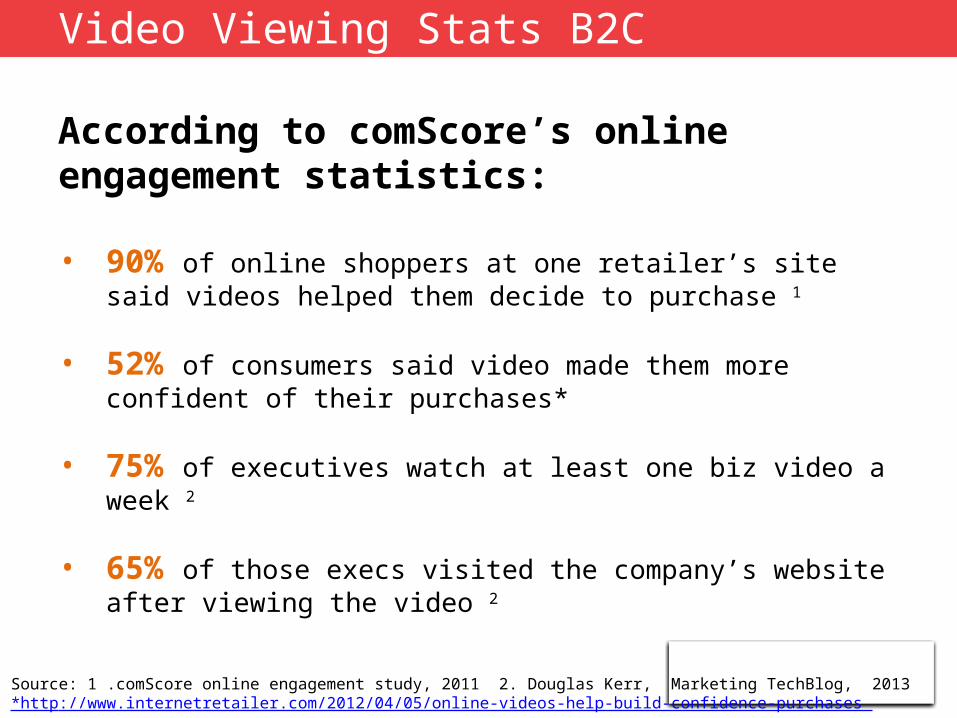
According to comScore’s online engagement statistics:
• 90% of online shoppers at one retailer’s site said videos helped them decide to purchase 1
• 52% of consumers said video made them more confident of their purchases*
• 75% of executives watch at least one biz video a week 2
• 65% of those execs visited the company’s website after viewing the video 2
Source: 1 .comScore online engagement study, 2011 2. Douglas Kerr, Marketing TechBlog, 2013*http://www.internetretailer.com/2012/04/05/online-videos-help-build-confidence-purchases
Video Viewing Stats B2C
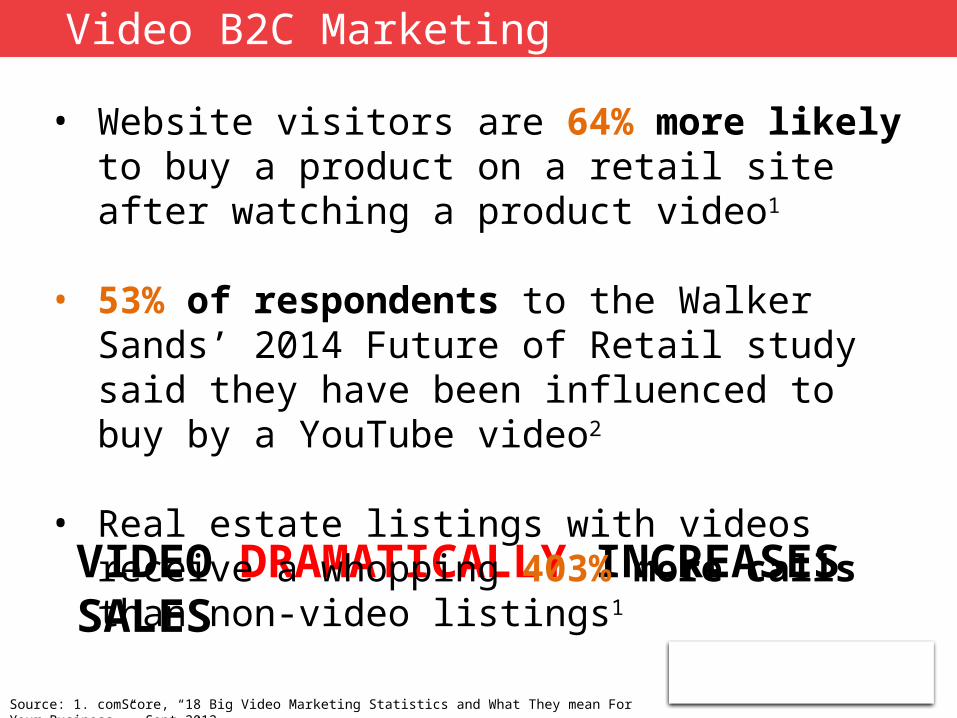
VIDEO DRAMATICALLY INCREASES SALES
• Website visitors are 64% more likely to buy a product on a retail site after watching a product video1
• 53% of respondents to the Walker Sands’ 2014 Future of Retail study said they have been influenced to buy by a YouTube video2
• Real estate listings with videos receive a whopping 403% more calls than non-video listings1
Source: 1. comScore, “18 Big Video Marketing Statistics and What They mean For Your Business,” Sept 2012
Video B2C Marketing
Be relevant and informative
Be concise (3-4 minutes is a long time)
Use good lighting, sound and video quality
Include brand identifiers
Include a call to action
Video Production

DONE!
Jim Elder
Allegra Design Web Print
314.429.4848
www.Allegrastlouiswest.com
A copy of this presentation can be found at
http://www.slideshare.net/JimElder1/adding-tech-to-your-communication-mix
or simply send a request
Recommended