Molecular Cell, Volume 64
Supplemental Information
53BP1 Integrates DNA Repair and p53-Dependent
Cell Fate Decisions via Distinct Mechanisms
Raquel Cuella-Martin, CatarinaOliveira, Helen E. Lockstone, Suzanne Snellenberg, NataliaGrolmusova, and J. Ross Chapman

A
B
C
53BP1∆sgRNA
E28E1
53BP1; Chr 15q15-q21
0
1
2
3
4
5
Fold
induction
Time (h) following Nutlin-3 addition
WT
53BP1∆-153BP1∆-2p53∆
0 0.5 1 2 4 8 16
BAX
0
5
10
15
Time (h) following Nutlin-3 addition
0 0.5 1 2 4 8 16
Fold
induction
BBC3 (PUMA)
WT
53BP1∆-153BP1∆-2p53∆
0 1 2 4 8
Fold
induction
Time (h) following 5 Gy IR
WT
53BP1∆-153BP1∆-2p53∆
0
1
2
3BAX
0
2
4
6
0 1 2 4 8Time (h) following 5 Gy IR
Fold
induction
BBC3 (PUMA)
WT
53BP1∆-153BP1∆-2p53∆
TP53: Chr 17p2
E11E1
p53∆sgRNA
D
WT
WT
p53∆
WT
p53∆
53B
P1∆-1
53B
P1∆-2
p53∆
53B
P1∆-1
53B
P1∆-2
53B
P1∆-1
53B
P1∆-2
53BP1
β-actin
p21
p53
MDM2
pCHK2T68
CHK2
untreated 2 h 4 h IR:
Figure S1

0
Ro c
WT p53∆53BP1∆-153BP1∆-2
Nutlin-3:
t in- n i n n i n
+ + + +- - - -
p53∆WT 53BP1∆-1 53BP1∆-2 WT p53∆53BP1∆-153BP1∆-2
+ + + +- -- -
p53∆ WT 53BP1∆-1 53BP1∆-2
IR:
WT
-
0
Ro c
B C
Figure S2
A
n***
UT N3 IR0
0
40
60
RN
A a
(C
PM
)
CDC25A
UT N3 IR0
0
40
60
80
RN
A a
(C
PM
)
CHEK1
nn
**
****
****
**
********n
****
UT N3 IR0
0
40
60
RN
A a
(C
PM
)
AP-4
***
**
****n ****
WT 53BP1∆-1 p53∆53BP1∆-2
UT N3 IR0
5
10
15
0
5
RN
A a
(C
PM
)
HPRT1nsE nsns
UT N3 IR
0
10
0
30
40
50
RN
A a
(C
PM
)
HBMSns nsns
UT N3 IR0
1400
1600
1800
0
RN
A a
(C
PM
)
GAPDHns nsns
**
0 4
- c
WT
(1)
WT
WT
(3
)
WT
(1
)
WT
WT
(3
)
53BP
1∆-2
(1)
53BP
1∆-2
53BP
1∆-2
(3)
53BP
1∆-2
(1
)
53BP
1∆-2
53BP
1∆-2
(3
)
53BP
1∆-1
53BP
1∆-1
(3)
53BP
1∆-1
(1)
53BP
1∆-1
53BP
1∆-1
(3)
53BP
1∆-1
(1)
p53∆
p53∆
(3)
p53∆
(1)
p53∆
p53∆
(3)
p53∆
(1)
- - - - - - - - - - - -++ + + + + + + + + ++
t in- n n n i n in WT (n=4970, adjp > 0.5)
Nutlin-3:
D

IR (5 Gy, 4 h)untreated
53BP1 53BP1merge mergeɣ-H2AX ɣ-H2AX
53BP1∆
53BP1
53BP1
53BP1
53BP1
53BP1
eGFP
Figure S3

53BP1
β-actin
p21
p53
MDM2p53
WT
53BP1
BRCT -A
53BP1
53BP1
BRCT -B
53BP1
β-actin
p21
p53
MDM2
pCHK2T68
CHK2
nt at 2 h 8 h t in-
p53
WT
53BP1
BRCT -A
53BP1
53BP1
BRCT -B
p53
WT
53BP1
BRCT -A
53BP1
53BP1
BRCT -B
p53
WT
53BP1
BRCT -A
53BP1
53BP1
BRCT -B
nt at 2 h 4 h
p53
WT
53BP1
BRCT -A
53BP1
53BP1
BRCT -B
p53
WT
53BP1
BRCT -A
53BP1
53BP1
BRCT -B
IR (5 Gy, 4 h)
WT
B
A
53BP1∆B
nt at
53BP1 53BP1RIF1 RIF1
53BP1 -2
A B
C
Figure S4

53BP1
53BP1Δ
eGFP
53BP1
53BP1D1861A
eGFP
GFP
53BP1R1811A
53BP1K1814M
53BP1N1845R
53BP1D1861R
53BP1N1845A
β-actin
WT
Lentivirus:
Figure S5
A B
p21
p53
WT
USP28
Nutlin-3:
RPA34
- + - + - + - + - + - +
GST
USP28
USP28C171A
USP28
USP28
P2
sgRNA3
nsgRNA4
n
Figure S6
0 4 8
0
5
10
15
WT P2 ∆-1 P2 ∆-2 p53∆
BBC3 PUMA
inctin
C

p53 Cyclin A DAPI
WT
N3 (4 µM, 2 h)Untreated
53BP1 -2
P2 -2
p53
p53 Cyclin A DAPI
53BP1
β-actin
p21
p53
MDM2
USP28
WT
53BP1
CHX/Time (min):
P2
0 15 30 45 60 90
WT
53BP1
P2WT
53BP1
P2WT
53BP1
P2WT
53BP1
P2WT
53BP1
P2
53BP1
β-actin
p21
p53
MDM2
USP28
WT
53BP1
P2
CHX/Time (min): - 20 40 60 120- 240
WT
53BP1
P2WT
53BP1
P2WT
53BP1
P2WT
53BP1
P2WT
53BP1
P2WT
53BP1
P2WT
53BP1
P2
-t in- i in - 140 160 180 240120 360360
A B
C
Figure S7
Cuella-Martin et al. 2016 1
SUPPLEMENTARY FIGURE LEGENDS
Supplementary Figure S1, related to Figure 1. 53BP1 is required for optimal p53-dependent
transactivation events.
Schematic representations of the human 53BP1 (A) and TP53 (B) loci, illustrating the hybridization sites
of the gRNAs selected for the generation of 53BP1∆ and p53∆ cell-lines in this study (gRNA sequences in
Supplementary Table S1). (C) Immunoblot analysis of lysates prepared from untreated or IR-treated (5
Gy) cells of indicated genotype. (D) 53BP1-loss impairs IR-induced p53-dependent transactivation events.
Total RNA was purified from cells treated with N3 (4 µM) or IR (5 Gy) and monitored for the abundance
of indicated p53-responsive transcripts by RT-qPCR. Data is representative of two independent
experiments, mean ± SD.
Supplementary Figure S2, related to Figure 1. 53BP1 is an enhancer of p53-dependent
transcriptional programs.
(A) 53BP1 is required for p53-dependent transcriptional repression events. Representative p53-responsive
transcripts from three RNA-seq replicates. Total RNA was sequenced from indicated MCF-7 lines
following N3 (4 µM, 8 h), IR (5 Gy, 4 h) or control treatments. CPM, counts per million; ns, non
significant; *p<0.05; **p<0.01; ***p<0.001; ****p<0.001 (two-way ANOVA). Bars represent mean ±
SD. (B), (C) RNA-seq results and reproducibility across biological replicates. Heatmaps showing relative
expression levels for each independent biological replicate of each condition for the top 1000 treatment-
responsive genes, in respect to the untreated control samples. Unsupervised hierarchical clustering was
used to cluster the samples based on expression levels of the respective set of 1000 genes for N3 and IR
treatments. (D) Normal expression of Nutlin-3 non-responsive genes in 53BP1∆ and p53∆ MCF-7.
Heatmaps showing relative expression levels for each independent biological replicate of each condition
for the 4970 treatment non-responsive genes in WT MCF-7, in respect to the untreated control samples.
Unsupervised hierarchical clustering was used to cluster the samples based on expression levels of the
respective set of 4970 genes for N3 and IR treatments. (E) As in A, but for three commonly employed
reference transcripts.
Supplementary Figure S3, related to Figure 2. Expected nuclear localization patterns of N3-
response defective 53BP1 mutants.
The localization and IR-dependent recruitment patterns of the indicated 53BP1 mutant proteins was
analyzed in stably transduced 53BP1∆ MCF-7 lines following mock or IR (5Gy 4 h) treatment. Cells were
fixed, immunostained with indicated antibodies, and then processed by indirect immunofluorescence.
Cuella-Martin et al. 2016 2
Notably, 53BP1 oligomerization mutant proteins formed residual IRIF, consistent with a previous report
(Lottersberger et al., 2013).
Supplementary Figure S4, related to Figure 3. 53BP1 dependent p53 regulation and DSB repair
activities are distinct and separable.
(A), (B) 53BP1∆BRCT cells show reduced MDM2 and p21 induction following N3 and IR treatments.
Western blot analysis of lysates prepared from indicated cell-lines following treatment with 4 µM N3 (A)
or 5 Gy IR (B) relative to untreated control samples. (C) Unlike 53BP1∆ cells, 53BP1BRCTΔ cells are
proficient in supporting RIF1 recruitment into IR-induced foci. Cells mock-treated or irradiated (5 Gy, 4
h), were fixed, immunostained with indicated antibodies, and processed by indirect immunofluorescence.
Supplementary Figure S5, related to Figure 4. The 53BP1 BRCT domain mediates bivalent
interactions with p53 and USP28.
Western blot showing stable expression of indicated WT and 53BP1 BRCT mutants in lentivirus-
transduced 53BP1Δ cells.
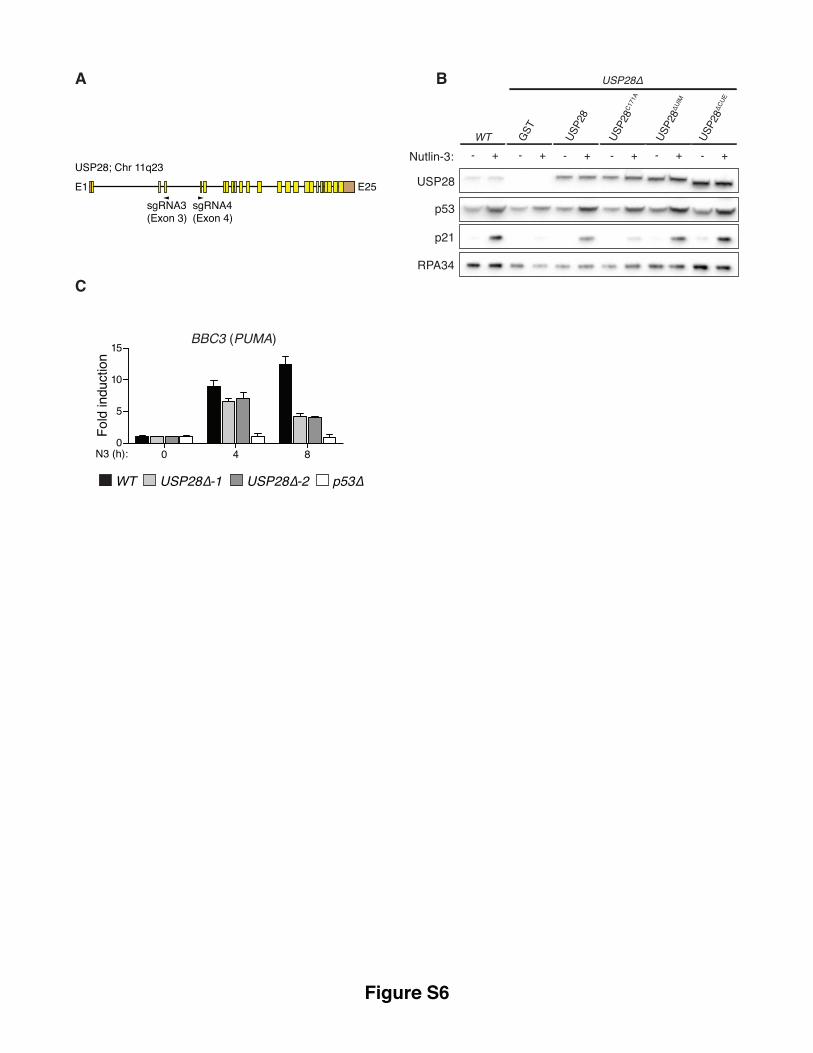
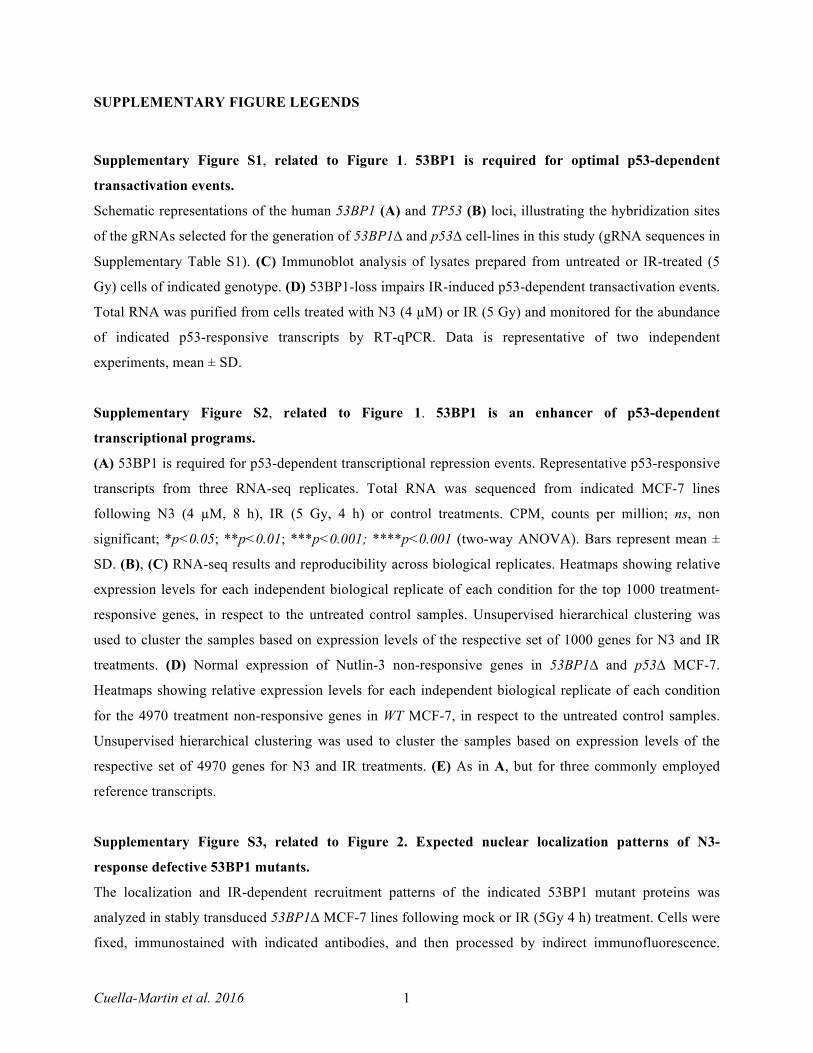
Supplementary Figure S6, related to Figure 5. USP28 is a novel component of the p53-53BP1 axis.
(A) Schematic representation of the human USP28 locus depicting the hybridization sites for each gRNA
used to generate USP28Δ cell-lines (gRNA sequences in supplementary Table S1). (B) USP28 catalytic
activity is required for its p53-regulatory role. Indicated WT and mutant USP28 transgenes were stably
expresses in USP28Δ cells following lentivirus-mediated transduction. Lysates were prepared from cells
following treatment with N3 (4 µM, 8 h), and immunoblotted with indicated antibodies. (C) USP28-loss
impairs N3-induced p53-dependent PUMA transactivation. Total RNA was purified from cells treated
with N3 (4 µM) and monitored for the abundance of BBC3 (PUMA) transcript for the indicated times.
Data is representative of two independent experiments, mean ± SD.
Supplementary Figure S7, related to Figure 7. Normal p53 stability and localization in 53BP1∆ and
USP28∆ cells.
(A) Steady-state p53 half-life in WT, 53BP1∆ and USP28∆ cells. p53 half-life analysis was performed in
time-course experiments following cyclohexamide addition to halt de novo protein synthesis. Cell lysates
prepared at indicated time-points following cycloheximide addition were immunoblotted with indicated
antibodies. (B) p53 half-life in N3-treated WT, 53BP1∆ and USP28∆ cells. Similar to B, except
cycloheximide was added 2 h following p53-activation by N3-treatment. (C) Normal p53 nuclear
localization in WT, 53BP1∆ and USP28∆ cells. Cells were treated with 4 µM N3 for 2 h or left untreated,
Cuella-Martin et al. 2016 3
were fixed and immunostained with the monoclonal p53 DO-7 antibody. Cyclin A-counterstaining
enabled discrimination of G1 (Cyclin A negative) and S/G2 (Cyclin A positive) cell populations, and
provided no evidence for cell-cycle-dependent defects in p53 localization.
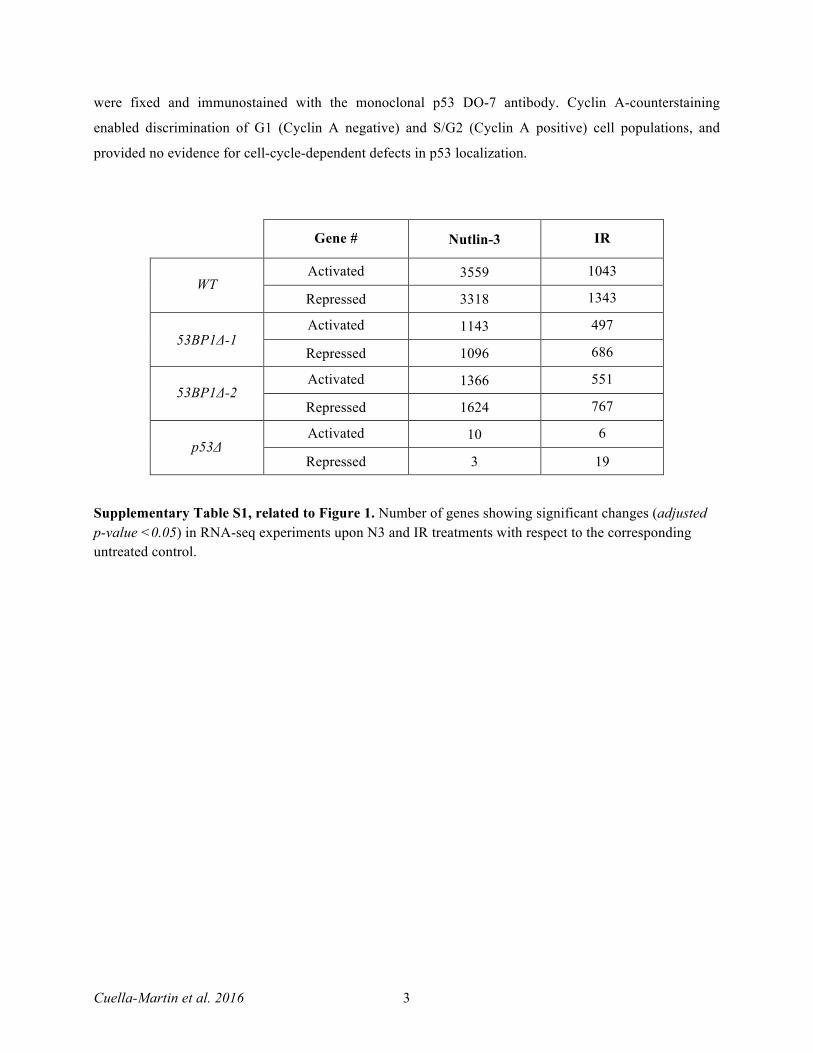
Gene # Nutlin-3 IR
WT Activated 3559 1043
Repressed 3318 1343
53BP1Δ-1 Activated 1143 497
Repressed 1096 686
53BP1Δ-2 Activated 1366 551
Repressed 1624 767
p53Δ Activated 10 6
Repressed 3 19
Supplementary Table S1, related to Figure 1. Number of genes showing significant changes (adjusted p-value <0.05) in RNA-seq experiments upon N3 and IR treatments with respect to the corresponding untreated control.

Cuella-Martin et al. 2016 4
EXTENDED EXPERIMENTAL PROCEDURES
Protein analysis: SDS/PAGE-Western Blot
Whole cell protein extracts were isolated using Benzonase buffer [25 mM Tris (pH 8.0), 40 mM NaCl,
0.05% SDS, 2 mM MgCl2, 10 U/ml Benzonase (Sigma-Aldrich), 0.05% (v/v) phosphatase inhibitor
cocktail 3 (P5726; Sigma-Aldrich) and protease inhibitors (Complete, Roche)], diluted in 3X Laemmli
buffer and boiled. SDS-PAGE was performed using NuPAGE® Novex® (Life Technologies) or
Criterion® (Bio-Rad) gradient acrylamide gels before transfer onto 0.45 µM nitrocellulose membranes
(Life Technologies). Primary antibodies used in this study are listed below. Proteins were detected using
HRP-conjugated secondary antibodies and enhanced chemiluminescence (Clarity, Bio-Rad). Signals were
acquired digitally on a Gel Doc™ XR system (Bio-Rad).
Immunofluorescence assays
Cells were seeded in coverslips in 6-well plates at a cell density of 4x10⁵ cells/well. After treatments, cells
were fixed in a 2% p-formaldehyde solution and permeabilized with 0.2% (v/v) Triton-X100 in PBS.
Coverslips were blocked in 3% (w/v) BSA/0.1% (v/v) Triton-X100 in PBS prior to sequential incubations
with primary (listed below) and secondary antibodies (Alexa Fluor 488, 594 and 648; Molecular Probes).
Images were captured in a confocal scanning microscope (LSM 510 Meta, Zeiss).
Clonogenic IR survival assay
The sensitivity of cells plated on 10 cm dishes in triplicate and exposed to indicated X-ray doses (CellRad,
Faxitron), was assessed relative to non-irradiated control plates. Fourteen days after treatment, plates were
stained using crystal violet dye and colonies counted.
Real time quantitative PCR (RT-qPCR)
Gene expression was determined by RT-qPCR. Trizol/chloroform-extracted total RNA was further
purified with the RNeasy Mini Kit (Qiagen) incorporating a DNaseI step (Qiagen) to remove DNA
contamination. cDNA was generated from 1 µg of total RNA using the iScript® cDNA Synthesis Kit
(Bio-Rad). qPCR was carried out using QuantiFast SYBR Green Master Mix (Qiagen) and transcript-
specific primer pairs (sequences listed below). PCR reactions were analysed on a CFX96® Real Time
analyzer (Bio-Rad) with the following conditions: enzyme activation-5 min 95 oC; 40 cycles denaturation-
10 s 95 oC annealing/extension-30 s 60 oC; final melting curve-15s 65 oC, 15 s 95 oC. Cycle threshold
values (CT) were used to perform quantification and analysis using CFX Manager software (Bio-Rad).
Cuella-Martin et al. 2016 5
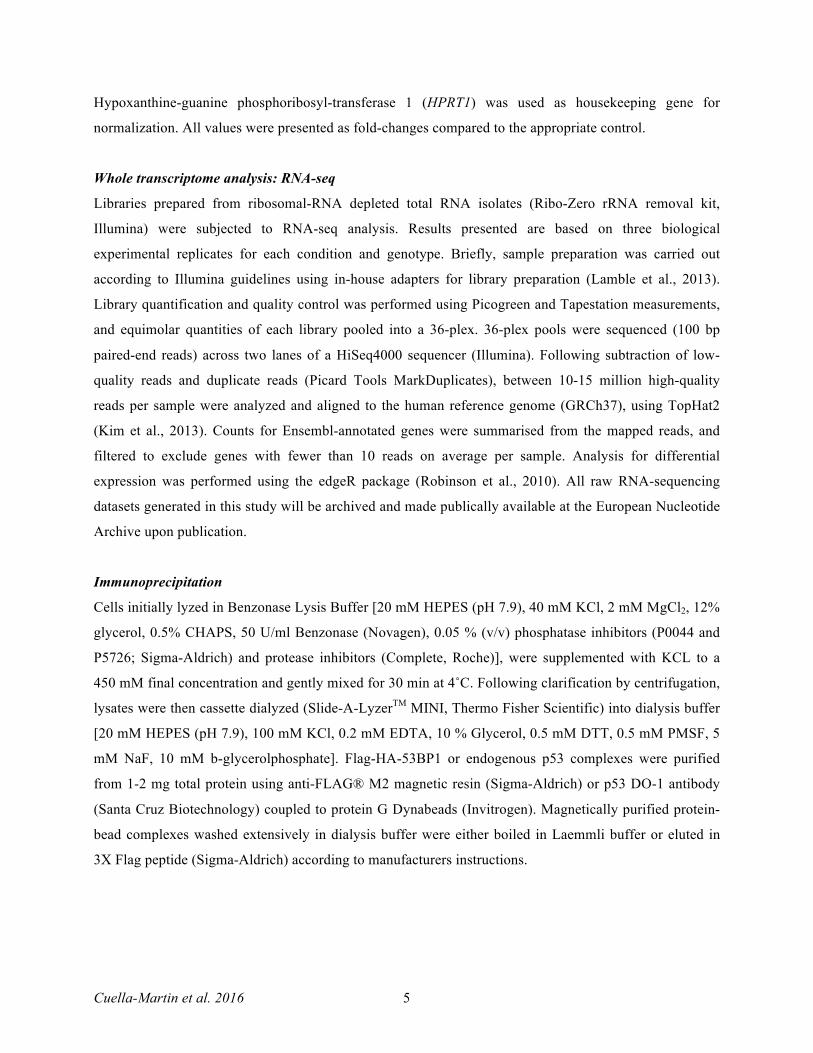
Hypoxanthine-guanine phosphoribosyl-transferase 1 (HPRT1) was used as housekeeping gene for
normalization. All values were presented as fold-changes compared to the appropriate control.
Whole transcriptome analysis: RNA-seq
Libraries prepared from ribosomal-RNA depleted total RNA isolates (Ribo-Zero rRNA removal kit,
Illumina) were subjected to RNA-seq analysis. Results presented are based on three biological
experimental replicates for each condition and genotype. Briefly, sample preparation was carried out
according to Illumina guidelines using in-house adapters for library preparation (Lamble et al., 2013).
Library quantification and quality control was performed using Picogreen and Tapestation measurements,
and equimolar quantities of each library pooled into a 36-plex. 36-plex pools were sequenced (100 bp
paired-end reads) across two lanes of a HiSeq4000 sequencer (Illumina). Following subtraction of low-
quality reads and duplicate reads (Picard Tools MarkDuplicates), between 10-15 million high-quality
reads per sample were analyzed and aligned to the human reference genome (GRCh37), using TopHat2
(Kim et al., 2013). Counts for Ensembl-annotated genes were summarised from the mapped reads, and
filtered to exclude genes with fewer than 10 reads on average per sample. Analysis for differential
expression was performed using the edgeR package (Robinson et al., 2010). All raw RNA-sequencing
datasets generated in this study will be archived and made publically available at the European Nucleotide
Archive upon publication.
Immunoprecipitation
Cells initially lyzed in Benzonase Lysis Buffer [20 mM HEPES (pH 7.9), 40 mM KCl, 2 mM MgCl2, 12%
glycerol, 0.5% CHAPS, 50 U/ml Benzonase (Novagen), 0.05 % (v/v) phosphatase inhibitors (P0044 and
P5726; Sigma-Aldrich) and protease inhibitors (Complete, Roche)], were supplemented with KCL to a
450 mM final concentration and gently mixed for 30 min at 4˚C. Following clarification by centrifugation,
lysates were then cassette dialyzed (Slide-A-LyzerTM MINI, Thermo Fisher Scientific) into dialysis buffer
[20 mM HEPES (pH 7.9), 100 mM KCl, 0.2 mM EDTA, 10 % Glycerol, 0.5 mM DTT, 0.5 mM PMSF, 5
mM NaF, 10 mM b-glycerolphosphate]. Flag-HA-53BP1 or endogenous p53 complexes were purified
from 1-2 mg total protein using anti-FLAG® M2 magnetic resin (Sigma-Aldrich) or p53 DO-1 antibody
(Santa Cruz Biotechnology) coupled to protein G Dynabeads (Invitrogen). Magnetically purified protein-
bead complexes washed extensively in dialysis buffer were either boiled in Laemmli buffer or eluted in
3X Flag peptide (Sigma-Aldrich) according to manufacturers instructions.

Cuella-Martin et al. 2016 6
G1/S checkpoint analysis
The G1/S checkpoint was assessed by BrdU incorporation. Briefly, cells were synchronised in G0 by
serum starvation for 24 h and further released in medium containing 0.25 µg/ml nocodazole to prevent
G2/M-phase cells recycling. 4 h post-release, G1-phase cells were treated with mock- or 4 Gy irradiation.
Twelve and 18 h later, cells were then pulsed for 30 min with 10 µM BrdU, collected and fixed overnight
in ice-cold 70% ethanol. DNA denaturation was performed using a solution of 0.2 mg/ml of pepsin
(Sigma-Aldrich) in 2 M HCl. BrdU was detected using an anti-BrdU-FITC conjugated antibody (AbD
Serotec) and a solution of PI/RNaseA (10 µg/ml and 0.1 mg/ml respectively) was used for total DNA
staining. Cells were analysed in an Attune NxT flow cytometer (Life Technologies) and data processed
using FlowJo software (Three Star Inc).
Statistical methods
Prism 6 software (GraphPad Software Inc.) was typically used for statistical analysis of datasets, with the
exception of the RNAseq analyses that were performed using R (www.r-project.org).
CRISPR-Cas9 guide-RNAs (gRNAs) used to generate knockout and 53BP1ΔBRCT cell lines.
Target gene/Name Sequence (5’-3’) Description TP53 gtgcagctgtgggttgattc Targeted to exon 5, antisense. 53BP1 1 gaatccaactgacttccagt Targeted to exon 2, antisense
2 gctgagaatcttcaattatc Targeted to exon 2, antisense 3 gaacgaggagacggtaatagt Targeted to exon 3, sense.
USP28 1 tgtagcaacagtgtcttgac Targeted to exon 3, antisense. 2 tgccattgctttgagtctac Targeted to exon 4, sense.
53BP1 BRCT Nt 1 ctgtgagagtggagacaaca Targeted to BRCT 1 N-term, antisense. BRCT Nt 2 tttgtgagcccctgtgagag Targeted to BRCT 1 N-term, sense. BRCT Ct ctcattgttggggagagaat Targeted to BRCT 2 C-term, sense.
Cuella-Martin et al. 2016 7
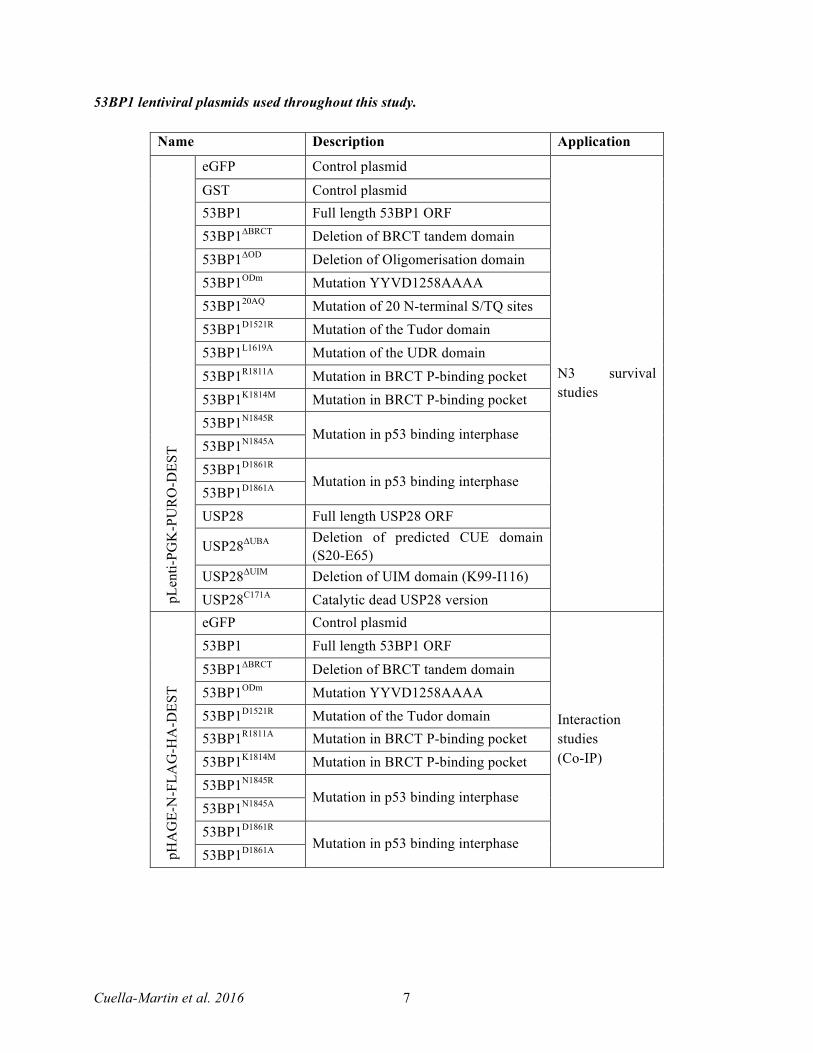
53BP1 lentiviral plasmids used throughout this study.
Name Description Application
pLen
ti-PG
K-P
UR
O-D
EST
eGFP Control plasmid
N3 survival studies
GST Control plasmid 53BP1 Full length 53BP1 ORF 53BP1ΔBRCT Deletion of BRCT tandem domain 53BP1ΔOD Deletion of Oligomerisation domain 53BP1ODm Mutation YYVD1258AAAA 53BP120AQ Mutation of 20 N-terminal S/TQ sites 53BP1D1521R Mutation of the Tudor domain 53BP1L1619A Mutation of the UDR domain
53BP1R1811A Mutation in BRCT P-binding pocket 53BP1K1814M Mutation in BRCT P-binding pocket 53BP1N1845R
Mutation in p53 binding interphase 53BP1N1845A 53BP1D1861R
Mutation in p53 binding interphase 53BP1D1861A USP28 Full length USP28 ORF
USP28ΔUBA Deletion of predicted CUE domain (S20-E65)
USP28ΔUIM Deletion of UIM domain (K99-I116) USP28C171A Catalytic dead USP28 version
pHA
GE-
N-F
LAG
-HA
-DES
T
eGFP Control plasmid
Interaction studies (Co-IP)
53BP1 Full length 53BP1 ORF
53BP1ΔBRCT Deletion of BRCT tandem domain 53BP1ODm Mutation YYVD1258AAAA 53BP1D1521R Mutation of the Tudor domain 53BP1R1811A Mutation in BRCT P-binding pocket 53BP1K1814M Mutation in BRCT P-binding pocket 53BP1N1845R
Mutation in p53 binding interphase 53BP1N1845A 53BP1D1861R
Mutation in p53 binding interphase 53BP1D1861A

Cuella-Martin et al. 2016 8
Sequences of primer pairs used throughout this study. Target gene / locus Sequence (5’-3’) Application
CDKN1A (p21) Fwd CCTCATCCCGTGTTCTCCTTT
Transcript-specific
qRT-PCR primers
Rev GTACCACCCAGCGGACAAGT
BAX Fwd CCTTTTCTACTTTGCCAGCAAAC
Rev GAGGCCGTCCCAACCAC
BBC3 (PUMA) Fwd CCTGGAGGGTCCTGTACAATCT
Rev GCACCTAATTGGGCTCCATCT
TP53I3 Fwd AGGGTGAAGTCCTCCTGAAGGT
Rev GTGGGTCATACTGGCCTTGTCT
MDM2 Fwd GGCCTGCTTTACATGTGCAA
Rev GCACAATCATTTGAATTGGTTGTC
CDKN1A (p21) -2965
Fwd CCGGCCAGTATATATTTTTAATTGAGA
Locus-specific ChIP
primers
Rev AGTGGTTAGTAATTTTCAGTTTGCTCAT
CDKN1A (p21) -2283
Fwd AGCAGGCTGTGGCTCTGATT
Rev CAAAATAGCCACCAGCCTCTTCT
CDKN1A (p21) -1391
Fwd CTGTCCTCCCCGAGGTCA
Rev ACATCTCAGGCTGCTCAGAGTCT
CDKN1A (p21) -20
Fwd TATATCAGGGCCGCGCTG
Rev GGCTCCACAAGGAACTGACTTC
CDKN1A (p21) +507
Fwd CCAGGAAGGGCGAGGAAA
Rev GGGACCGATCCTAGACGAACTT
CDKN1A (p21) +4001
Fwd AGTCACTCAGCCCTGGAGTCAA
Rev GGAGAGTGAGTTTGCCCATGA
CDKN1A (p21) +8566
Fwd CCTCCCACAATGCTGAATATACAG
Rev AGTCACTAAGAATCATTTATTGAGCACC
CDKN1A (p21) +11443
Fwd TCTGTCTCGGCAGCTGACAT
Rev ACCACAAAAGATCAAGGTGAGTGA
MDM2 5ʹ Fwd GGGCTATTTAAACCATGCATTTTC
Rev GTCCGTGCCCACAGGTCTA
MDM2 3ʹ Fwd CTTTCTCGAGGAGGCAGGTTT
Rev GCTCAACCCTAGGCGCTATTC
GADD45A p53-RE
Fwd GCCTTTGTCCGACTAGAGTGT
Rev GGATCTCTTCCGCTGCTG
FAS p53-RE Fwd GCACCGAAGCAGTGGTTAAG
Rev GCCTCCAGAAGCTCATTCAG

Cuella-Martin et al. 2016 9
Antibodies used in this study.
Target Manufacturer Application
53BP1 Novus Biological (NB100-304) WB, Immunofluorescence Novus Biological (NB100-305) WB Millipore (clone B13) WB, Immunofluorescence
MDM2 Santa Cruz Biotechnology (clone SMP14) WB
p53 Dako (clone DO-7) WB, Immunofluorescence Santa Cruz Biotechnology (clone DO-1) Immunoprecipitation, ChIP
p21 BD Transduction Laboratories WB CHK2 Millipore (clone 7) WB pCHK2T68 Cell signalling (clone C13C1) WB USP28 Abcam (EPR4249) WB HA-11 Covance Research (Clone 16B12) WB β-actin Sigma-Aldrich WB α-tubulin Sigma-Aldrich (Tat-1) WB RIF1 Bethyl Laboratories (A300-569A) Immunofluorescence ɣ-H2AX Millipore Immunofluorescence
Cyclin A Clone E23.1, a gift from Julian Gannon, The Francis Crick Institute Immunofluorescence
Supplementary References
Kim, D., Pertea, G., Trapnell, C., Pimentel, H., Kelley, R., Salzberg, S.L. (2013). TopHat2: accurate
alignment of transcriptomes in the presence of insertions, deletions and gene fusions. Genome Biol 14,
R36.
Lamble, S., Batty, E., Attar, M., Buck, D., Bowden, R., Lunter, G., Crook, D., El-Fahmawi, B., Piazza, P.
(2013). Improved workflows for high throughput library preparation using the transposome-based nextera
system. BMC Biotech 13, 104.
Lottersberger, F., Bothmer, A., Robbiani, D.F., Nussenzweig, M.C., and De Lange, T. (2013). Role of
53BP1 oligomerization in regulating double-strand break repair. Proc. Natl. Acad. Sci. U.S.A. 110, 2146–
2151.
Robinson, M.D., McCarthy, D.J., Smyth, G.K. (2010). edgeR: a Bioconductor package for differential
expression analysis of digital gene expression data. Bioinformatics 26, 139-140.
Recommended