3rd Quarter
2005

1950 1960 1970 1980 1990 2000
Source: International Iron and Steel Institute - IISI - 2005
Years World Prod.
1950 2001955 2701960 3501965 4501970 5951975 6441980 7161985 7191990 7701995 7521996 7501997 7991998 7771999 7882000 8482001 8502002 9022003 9652004 1,033
Years World1970-75 1.61975-80 2.21980-85 0.11985-90 1.41990-95 -0.51995-00 2.42000-02 3.2
2002-03 6.62003-04 7.0
Average Growth Rates
% per annum
100
400
200
300
500
600
700
800
900
1,000
1,100
World Steel Production (million t.)
Substantial growth in the past few years ...
1

112.798.5
64.347.5 46.4 38.7 32.9 32.6 28.4
269.3
Source: International Iron and Steel Institute - IISI - 2005
2004(million t.)
China Japan USA Russia Korea Germany Ukraine Brazil India Italy
Steel Production
... mainly coming from China
2

-24.7
-13.2
-9.2
-6.1
-6.0
-5.0
4.2
7.2
8.4
11.0
28.2
28.2
30.5
-30 -25 -20 -15 -10 -5 0 5 10 15 20 25 30 35
Turkey
Germany
Belgium / Luxembourg
Brazil
Russia
Ukraine
Japan
Source: International Iron and Steel Institute - IISI - 2005
Top net Exporters Top net importersTop net importers
World Steel Trade
million t.million t.
Trade ~ 200 million tons per year
Trend may continue through 2005
Vietnam
Italy
Hong Kong
Thailand
China
USA
3

Gerdau22.1%CSN
16.8%
Others6.4%
Acesita2.5%
USIMINAS SYSTEM27.2%
Arcelor25.0%
17,6
17,9
19,0
20,8
21,4
30,2
31,6
32,4
42,8
46,9
8,923 - USIMINAS
10 - Thyssen Krupp
9 - Nucor
8 - Corus
7 - US Steel
6 - Baosteel
5 - Posco
4 - J FE
3 - Nippon Steel
2 - Mittal Steel
1 - Arcelor
Source: IISI - 2005
Source: IBS - 2005
million t.
Usiminas System is the 23rd largest producer in the world and 1st flat steel producer in Latin America
Top Brazilian Steel Producers - 2004
Usiminas
Leading Producer
Major Steel Plants 2004 (crude steel
production) million t.
4

Steel in Brazil
High quality iron ore
Well located plants and modern technology
Competitive Costs
Product quality and environmental management
Qualified labor and management
Its competitive conditions make the country a global leader
5

Source: WSD - August 2005
Cost CompetitivenessCost Competitiveness
Production Cost – (US$/t)Slabs (Jun 2005)
Brazil has the lowest production cost in the world
6
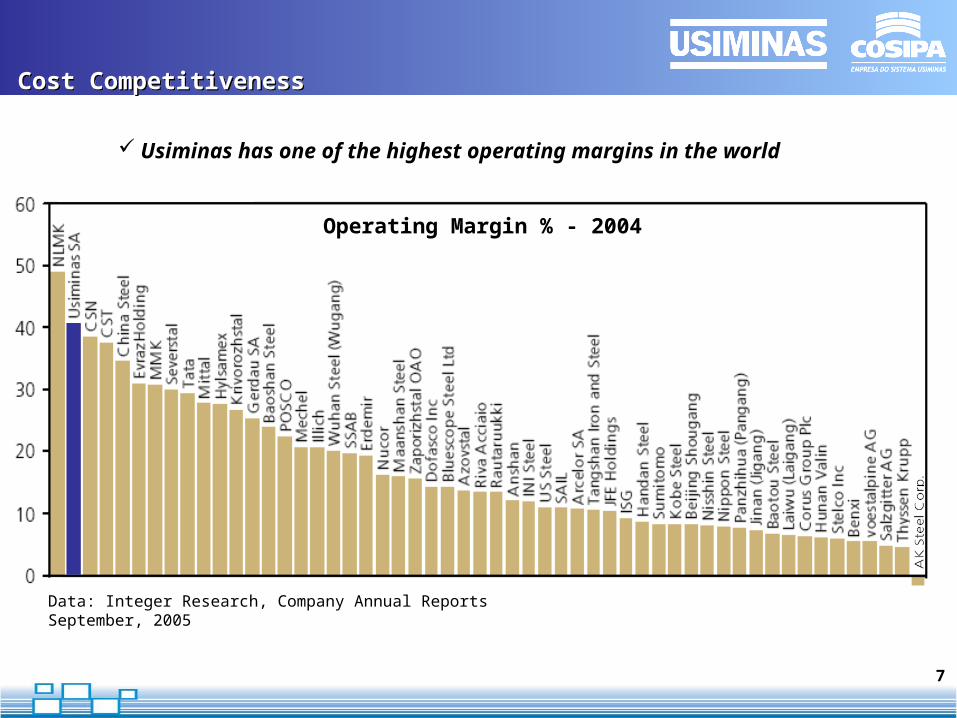
Operating Margin % - 2004
Cost CompetitivenessCost Competitiveness
Usiminas has one of the highest operating margins in the world
Data: Integer Research, Company Annual ReportsSeptember, 2005
7

RAILROAD
HIGHWAY
CVRD
ES
PÍR
ITO
SA
NTO
SÃO PAULO
BAHIA
MINAS GERAIS
ATLANTIC OCEAN
Itabira
Vitória
Port of Praia Mole
Santos
RIO DE
JANEIRO
Ipatinga
Usimina
sBelo HorizonteUsiminas
Headquarters
Sepetiba Port
Rio de JaneiroSão Paulo
Cosipa
Cubatão
Usiminas
Location: Ipatinga, State of
Minas Gerais
Cosipa
Cubatão, State of
São Paulo
Usiminas is strategically located
Close to main markets
2 ports
Railroad (MRS)8

Products
Complete product lines: from slabs to coated products
Major consumers
Heavy plate 1,000,000 1,000,000
Hot coil 3,550,000 2,100,000
Cold coil 2,500,000 1,200,000
-
-
Capacity (tonnage/year)
360,000
400,000
Slab 5,000,000 4,500,000
Electrogalvanized coil
Hot dip galvanized coil
Un
coate
dC
oate
d
Pipelines, pressure vessels, shipbuilding, general structures.
Agricultural machinery, pipe and tube, chassis, gas cylinders, containers, generalstructures.
Auto industry, household appliances, packaging.
Auto industry, household appliances.
Auto industry, household appliances,civil construction.
Rolling mills.
Capacity: 4.5 million t.Capacity: 5.0 million t.
9

Sales (thousand t.)
Domestic market is a priority
Usiminas + Cosipa
As of September, 2005
72%
82% 70% 69% 72%
28%
18%
30% 31% 28%
2001 2002 2003 2004 9M05
Domestic Market Foreign Market
6,602
7,722 7,7108,062
5,367
10

Civil Construction
7%
Auto Industry
13%
Autoparts15%
Distributors 23%
Others16%
Small Diam. Tubes
7%
Pipelines9%
Packaging2%
Household Appliances
2%
Shipbuilding1%
Elect. Equipment
5%
Domestic Sales - 9M05
Usiminas + CosipaVolume: 3.88 million t.
Fasal, Rio Negro and Dufer 7%
{
Combination of market leadership and diversified customer base reduces market risk
11
As of September, 2005

15%
6%
31%
25%
51%
28%
77%
12%
52%
51%
32%
30%
7%
14%
75%
14%
6%
17%
42%
7%
7%
21%
55%
87%
55%
35%
66%
46%
47%
42%
41%
6%
0% 20% 40% 60% 80% 100%
Distributors
Packaging
Civil Construction
Shipbuilding
Elect. Equipment
Household Appliances
Pipelines
Small Diam. Tubes
Autoparts
Auto Industry
TOTAL
Usiminas Cosipa Others
Usiminas + Cosipa = 53%
Domestic Market Share (%) 9M05
Combination of market leadership and diversified customer base reduces market risk
12
As of September, 2005

Domestic Market Outlook
2,4002,210
1,8281,7931,8171,682
2000 2001 2002 2003 2004 2005E
9,20010,109
8,9088,5768,6508,368
2000 2001 2002 2003 2004 2005E
Source: Anfavea / UsiminasSource: IBS / Usiminas
Flat Steel Demand (1,000 t.) Vehicle Production (1,000 vehicles)
Sector 2003 2004 04/ 03 (% )Auto 817 1,142 39.8Autoparts 928 1,188 28.0Shipbuilding 32 84 162.5Agricultural/Road Mach. 213 247 16.0Industrial Machinery 173 178 2.9Household Appliances 287 343 19.5Civil Construction 800 868 8.5Small Diam. Tubes 757 743 -1.8Distributors 2,794 3,097 10.8Pipelines 310 344 11.0Others 1,797 1,875 4.3
TOTAL 8,908 10,109 13.5 Source: Usiminas
-9.0%
8.6%
13
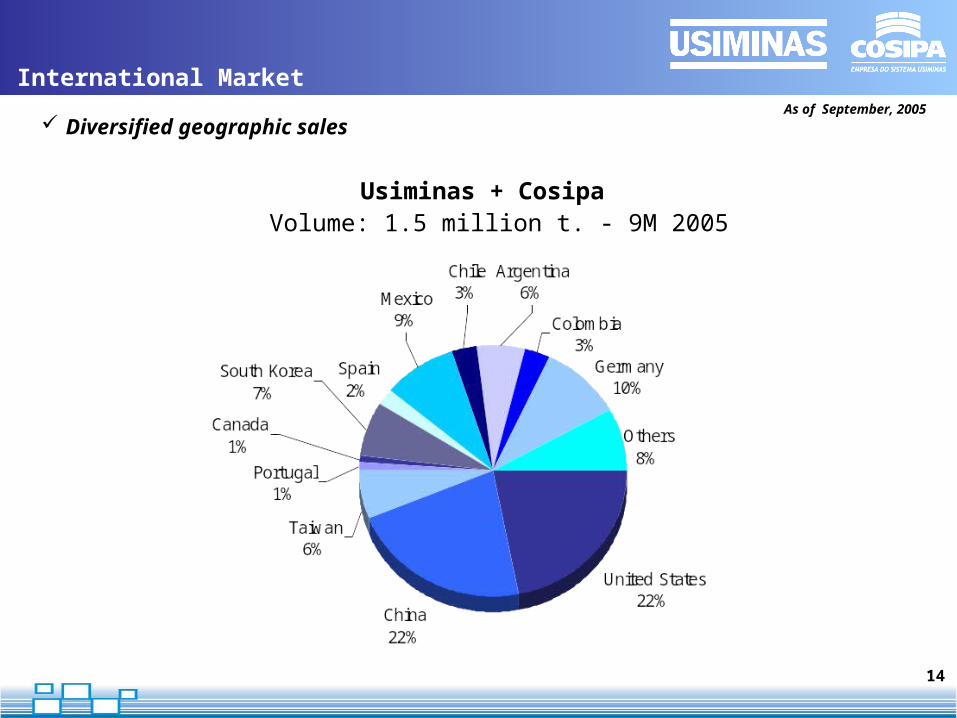
Usiminas + CosipaVolume: 1.5 million t. - 9M 2005
International Market
Diversified geographic sales
14
As of September, 2005

Investments & Technology(US$ million)
Commitment to the best technology
• More than US$ 3 billion invested in the last decade
• Partnership with Nippon Steel assures access to state-of-the-art technology in steel production, including high value-added products
• 6th Technology Transfer Agreement with Nippon Steel, valid until 2009
• 407 registered patents, of which 23 are international
• 150 researchers
• In the last 3 years, for each US$ 1 spent in technology Usiminas sells US$ 3
15

Investments & Technology(US$ million)
Commitment to the best technology
525578
469
136 94 83 65 130255
212162
156
452
79
70
135
8032
6052
31
36
1997 1998 1999 2000 2001 2002 2003 2004 9M05 2005E 2006E
New Investments
737 740
500
292
546
111 119 117
200
390
Usiminas
Cosipa
140
16

Commitment to the best technology
Investments & Technology(US$ million)
Next 2 years: Maintenance - approximately US$ 120 million per year
Projects approved by the Board• Increase of self-generated energy from 16% to 33% Power Plant 60 MW - Usiminas BF Top blowing turbine 12 MW - Cosipa
• Self-sufficiency in coke production by 2007 550.000 tons/year Coke plant - Usiminas
• Productivity Revamping of Continuos Casting Machine - Cosipa
Projects under study • Production Capacity Increase (on-going studies)
1.0 ~ 2.0 million tons
17

Creation of Ternium
Consolidate control of Hylsamex, Sidor and Siderar
Ternium will have ~ 11.5 million t. capacity
Present Situation Proposed Situation
UsiminasTechint G.
SiderarSidor Hylsamex
Ternium
Amazônia
Usiminas
SiderarSidor
16.6%
5.3%
59.7%
Control
59.7%
Control
Control
16.3% 83.7% Initial
C. Amazônia
18
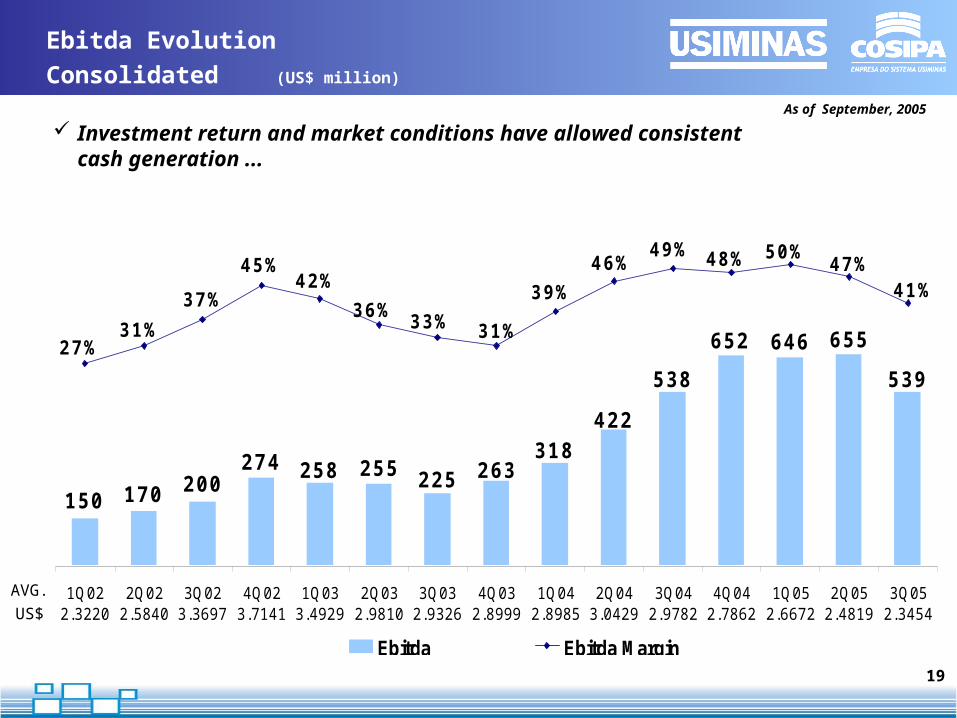
Ebitda Evolution Consolidated (US$ million)
AVG.
US$
Investment return and market conditions have allowed consistent cash generation ...
539
655646652
538
422318
263225255258274200170150
49%46%
39%
31%33%36%
42%45%
37%
31%27%
48% 50%47%
41%
1Q022.3220
2Q022.5840
3Q023.3697
4Q023.7141
1Q033.4929
2Q032.9810
3Q032.9326
4Q032.8999
1Q042.8985
2Q043.0429
3Q042.9782
4Q042.7862
1Q052.6672
2Q052.4819
3Q052.3454
Ebitda Ebitda Margin
19
As of September, 2005

Ebitda Evolution Consolidated (US$ million)
AVG.
US$
Investment return and market conditions have allowed consistent cash generation ...
1,8401,930
1,001794
671742530
46%46%
35%35%32%35%
31%
19991.8133
20001.8300
20012.3539
20022.9236
20033.0746
20042.9262
9M052.4981
Ebitda Ebitda Margin
20
As of September, 2005

1,8171,8121,8472,0332,2042,3162,5982,6262,7052,764
2,5932,6992,8113,111
3,387 0.7
5.2 5.04.2
3.4 2.9 2.8 2.7 2.6 2.4 1.9 1.4 1.1 0.8 0.7
500
1,500
2,500
3,500
4,500
1Q022.3236
2Q022.8444
3Q023.8949
4Q023.5333
1Q033.3531
2Q032.8720
3Q032.9234
4Q032.8892
1Q042.9086
2Q043.1075
3Q042.8586
4Q042.6544
1Q052.6662
2Q052.3504
3Q0522,222
Total Debt Total Debt / Ebitda
R$ /US$
Total Debt Evolution
Consolidated (US$ million)
... and have made it possible to considerably reduce debt
21
As of September, 2005
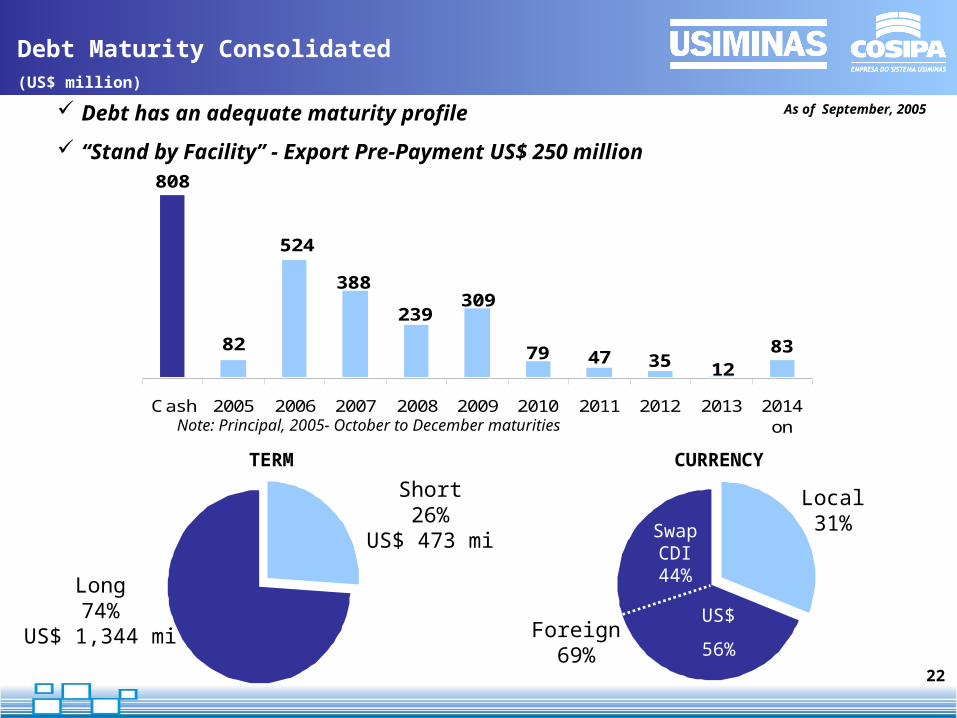
123583
4779
808
82
524
388
239309
Cash 2005 2006 2007 2008 2009 2010 2011 2012 2013 2014on
SwapCDI44%
US$
56%
Debt Maturity Consolidated(US$ million)
Long74%
US$ 1,344 mi
Short26%
US$ 473 mi
Foreign69%
Local31%
TERM CURRENCY
Note: Principal, 2005- October to December maturities
Debt has an adequate maturity profile
“Stand by Facility” - Export Pre-Payment US$ 250 million
22
As of September, 2005

Control Group: 53%
UsiminasVoting Capital
Shareholder Structure
Excellence of the main shareholders
• Board of Directors from solid Brazilian and foreign groups
• Long-term relationships with steel business and Usiminas
• Committed to add excellence and experience to business management
CVRD23.0%
Others (Distributors)
2.3%
Others8.8%
Sudameris (ABN Amro)
1,9%
Bradesco2.6%
Caixa dos Empregados da
Usiminas13.4%
Nippon Usiminas18.4%
Camargo Corrêa7.3%
Votorantim7.3%
Previ14.9%
23
As of September, 2005

24
Potential value creation for shareholders
5750
72
107
78
46
0
20
40
60
80
100
120
Annual shareholder return (2003 - Jul 2005)
BelgoGerdau
CST
UsiminasCSN
% p.a.
Source: Economática, Banco Itaú (Oct./05)
Creation of Value for Usiminas and thesteel industry has been considerable
over the last few years ...
... and Usiminas still has strong potential for additional value creation
Acesita
Ibovespa = 28%
EV / Ebitda
P / E
2005e 2005e
Arcelor 3.6 5.0
Posco 2.5 5.2
China Steel 3.9 5.8
International Avg. 3.3 5.4Usiminas 2.2 3.7
CSN 3.2 7.2
Gerdau 3.2 5.5
Arcelor Brasil 3.8 7.5
Brazil Avg. 3.1 6.0
Multiples

Positive stock market reactionPositive stock market reaction
(*) Theoretical Ibovespa portfolio Sept/Dec 20052001
2002
2003
2004# of trades 232
Shares (000) 567
Vol. (R$ 000) 3,924
Ibov. Portf. 1.25%
Position 26th
# of trades 265
Shares (000) 628
Vol. (R$ 000) 4,067
Ibov. Portf. 1.49%
Position 21st
# of trades 457
Shares (000) 800
Vol. (R$ 000) 12,745
Ibov. Portf. 2.67%
Position 11th
# of trades 1,060
Shares (000) 1,040
Vol. (R$ 000) 40,005
Ibov. Portf. 4.05%
Position 5th
Steel Sector Bovespa 2004
Ibovespa Portfolio
5.72%
4th2005 (*)
New Ibov. Portfolio
... & ADR I e Latibex... & ADR I e Latibex
Usiminas PNA31%
Sid Nacional ON 29%
Gerdau PN 21%
Sid Tubarao PN 9%
Others10%
25

Sept 30/05 Dec 31/04 Dec 31/03 Dec 31/02
Crude Steel Production (thsd t) 6,517 8,951 8,621 8,447
Sales (thsd t) 5,367 8,062 7,710 7,722
Net sales (US$ million) 4,035 4,197 2,845 2,250
EBITDA (US$ million) 1,840 1,930 1,002 794
Net Profit (US$ million) 1,167 1,032 426 (152)
Gross Debt (US$ million) 1,817 2,033 2,626 2,699
Gross Debt / EBITDA 0.7 1.1 2.5 3.9
EBITDA / Interest Expenses 16.9 11.3 4.3 3.7
Other Highlights
Consolidated Figures - USIMINAS
26

www.usiminas.com.br
Investor Relations:
Bruno Seno Fusaro Luciana Valadares dos Santos Matheus Perdigão Rosa [email protected] [email protected]@usiminas.com.br Tel.: + 55-31-3499-8772 Tel.: + 55-31-3499-8619
Tel.: + 55-31-3499-8056 Fax: + 55-31-3499-9357
Gilson Rodrigues Bentes - COSIPA (São Paulo Office)[email protected].: + 55 11 5070-8980
Declarations relative to business perspectives of the Company, operating and financial results and projections, and references to the growth of the Company, constitute mere forecasts and were based on Management’s expectations in relation to future performance. These expectations are highly dependent on market behavior, of Brazil’s economic situation, on the industry and on international markets, and are therefore subject to change.
27
Recommended