2011 Half Year ResultMedia Briefing23 March 2011
Page 2
Result highlights
• On track for one of the best ever payouts to farmer shareholders
– Forecast Payout range $7.90-$8.00 (before retentions), $7.75-$7.80(cash), made up of:
• Forecast Milk Price $7.50 per kgMS
• Forecast Profit $550-$690 million (40-50 cents per share)
• Target Dividend 25-30 cents per share (interim dividend 8 cents)
• After-tax profit for six months to 31 Jan 2011 of $293 million
– 21 cents per share1
– First time reporting half year profit
• 1H revenue up 21% to $9.4 bn on back of higher dairy prices
• Gearing ratio 48.5%, improved from 54.3% at 31 Jan 10
1. Attributable to Co-operative shareholders after taking into account non-controlling interests.
Page 3
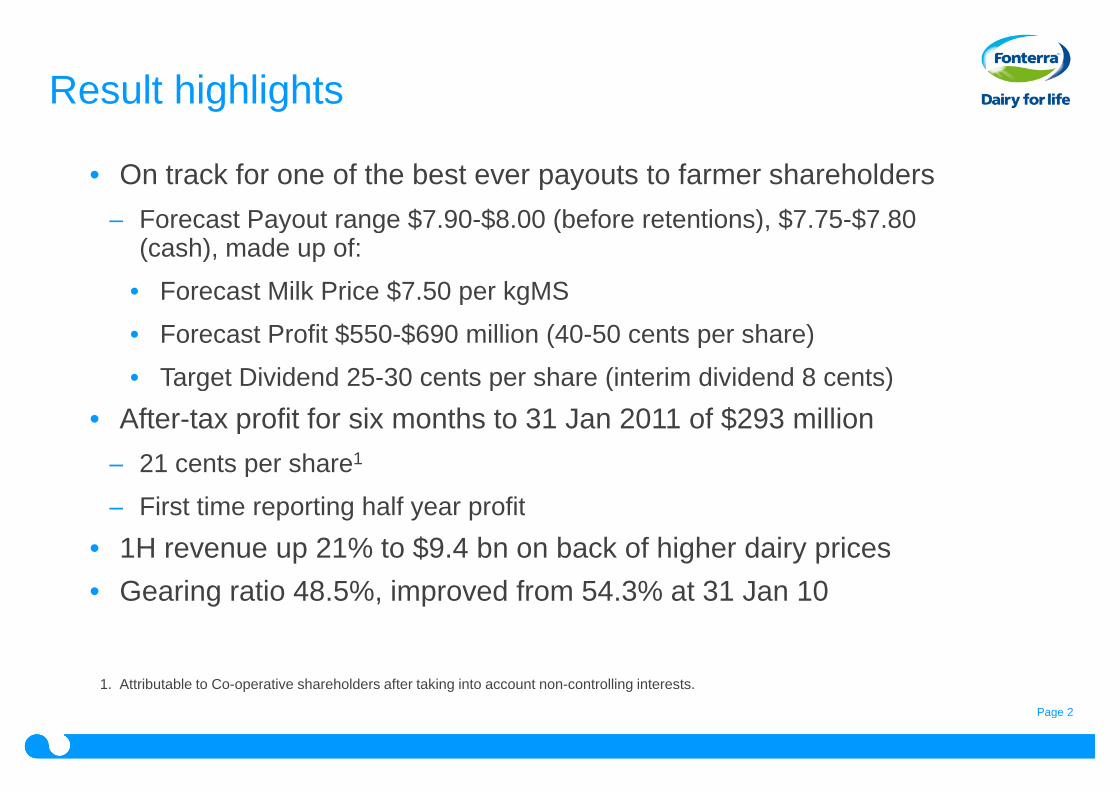
Generating strong returns
1. Since FY2010, Distributable Profit is recognised on a $ per share basis. Prior to FY2010, Distributable Profit wasrecognised on a $ per kgMS basis.
2. Milk Price is $ per kgMS.
4.104.46
7.90
6.70
7.90-8.00
Page 4
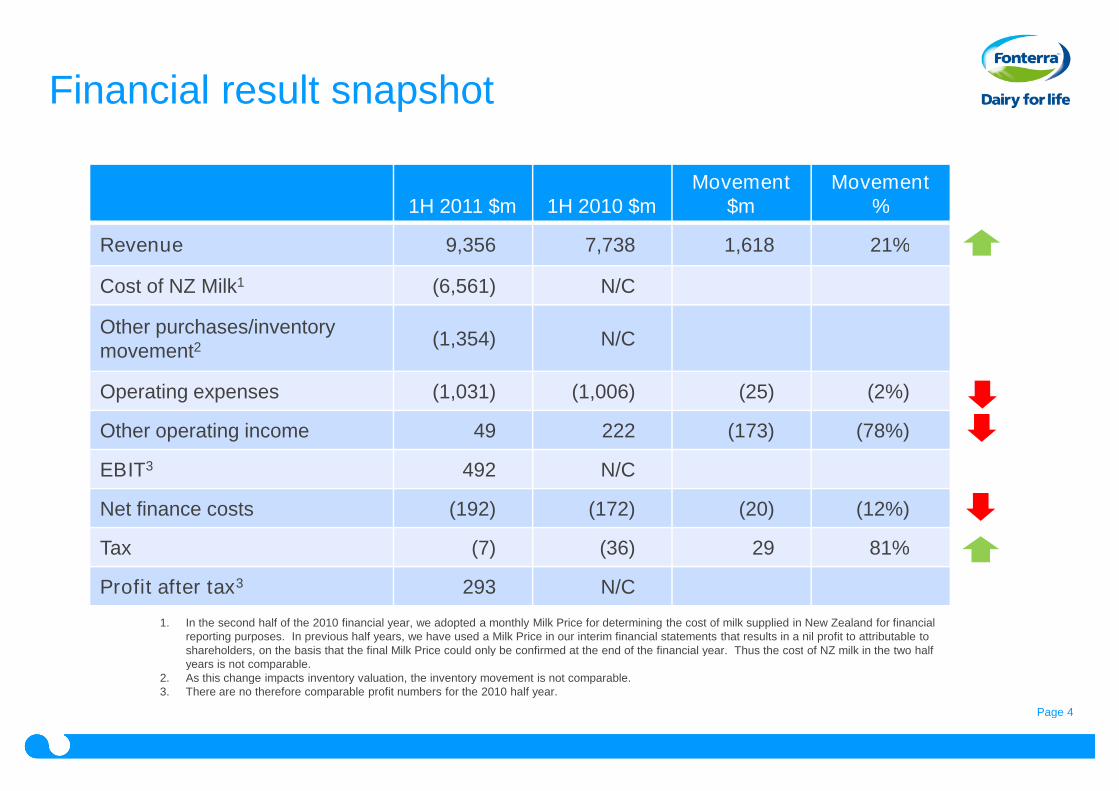
Financial result snapshot
1H 2011 $m 1H 2010 $mMovement
$mMovement
%
Revenue 9,356 7,738 1,618 21%
Cost of NZ Milk1 (6,561) N/C
Other purchases/inventorymovement2
(1,354) N/C
Operating expenses (1,031) (1,006) (25) (2%)
Other operating income 49 222 (173) (78%)
EBIT3 492 N/C
Net finance costs (192) (172) (20) (12%)
Tax (7) (36) 29 81%
Profit after tax3 293 N/C
1. In the second half of the 2010 financial year, we adopted a monthly Milk Price for determining the cost of milk supplied in New Zealand for financialreporting purposes. In previous half years, we have used a Milk Price in our interim financial statements that results in a nil profit to attributable toshareholders, on the basis that the final Milk Price could only be confirmed at the end of the financial year. Thus the cost of NZ milk in the two halfyears is not comparable.
2. As this change impacts inventory valuation, the inventory movement is not comparable.3. There are no therefore comparable profit numbers for the 2010 half year.
Page 5
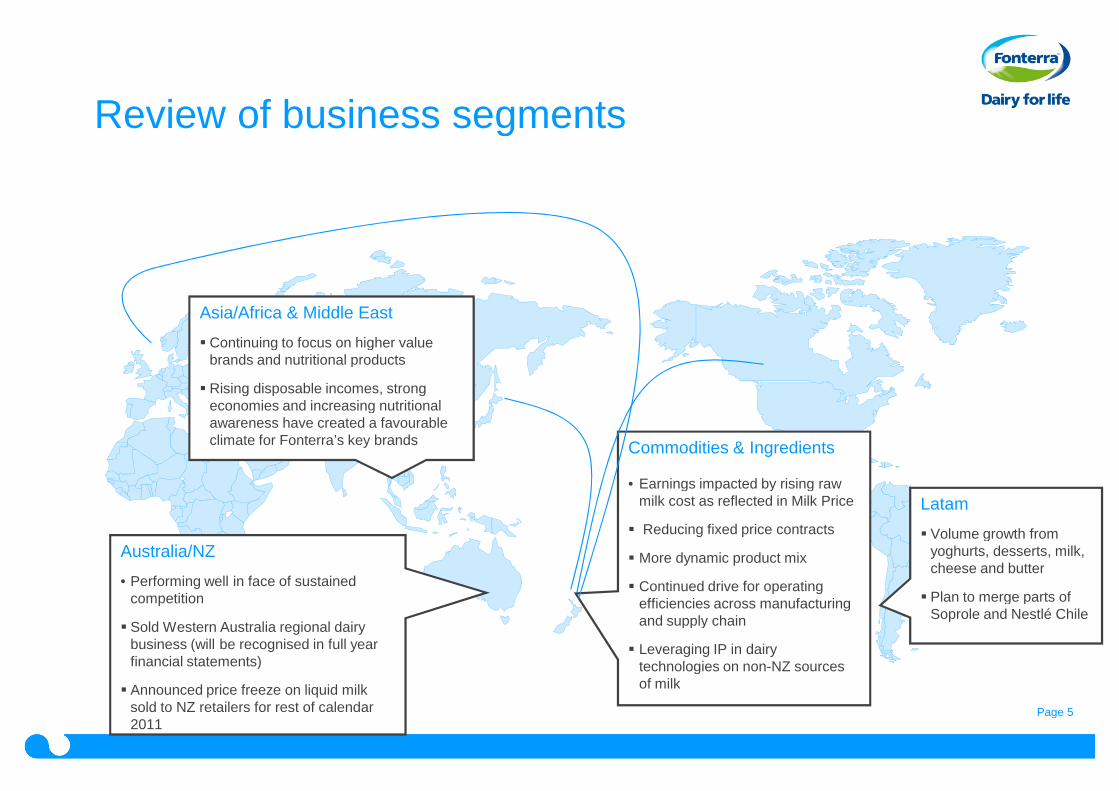
Review of business segments
Commodities & Ingredients
• Earnings impacted by rising rawmilk cost as reflected in Milk Price
Reducing fixed price contracts
More dynamic product mix
Continued drive for operatingefficiencies across manufacturingand supply chain
Leveraging IP in dairytechnologies on non-NZ sourcesof milk
Australia/NZ
• Performing well in face of sustainedcompetition
Sold Western Australia regional dairybusiness (will be recognised in full yearfinancial statements)
Announced price freeze on liquid milksold to NZ retailers for rest of calendar2011
Asia/Africa & Middle East
Continuing to focus on higher valuebrands and nutritional products
Rising disposable incomes, strongeconomies and increasing nutritionalawareness have created a favourableclimate for Fonterra’s key brands
Latam
Volume growth fromyoghurts, desserts, milk,cheese and butter
Plan to merge parts ofSoprole and Nestlé Chile
Page 6
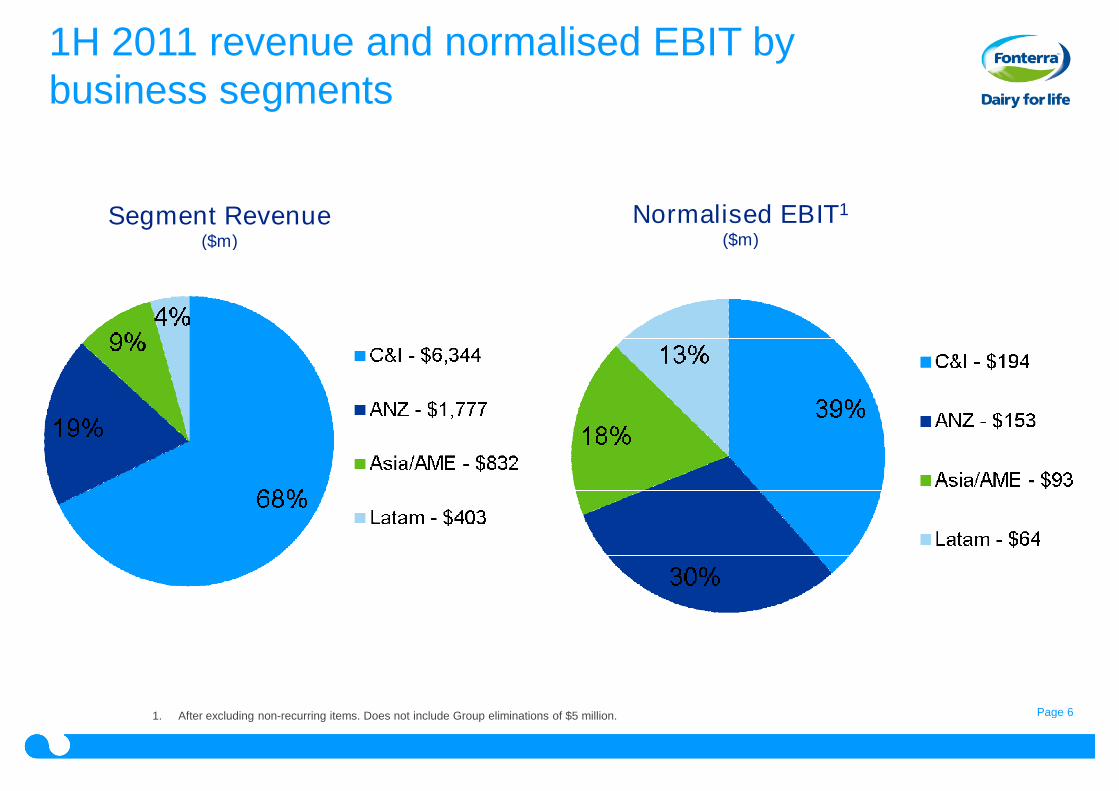
1H 2011 revenue and normalised EBIT bybusiness segments
Segment Revenue($m)
Normalised EBIT1
($m)
1. After excluding non-recurring items. Does not include Group eliminations of $5 million.
Page 7
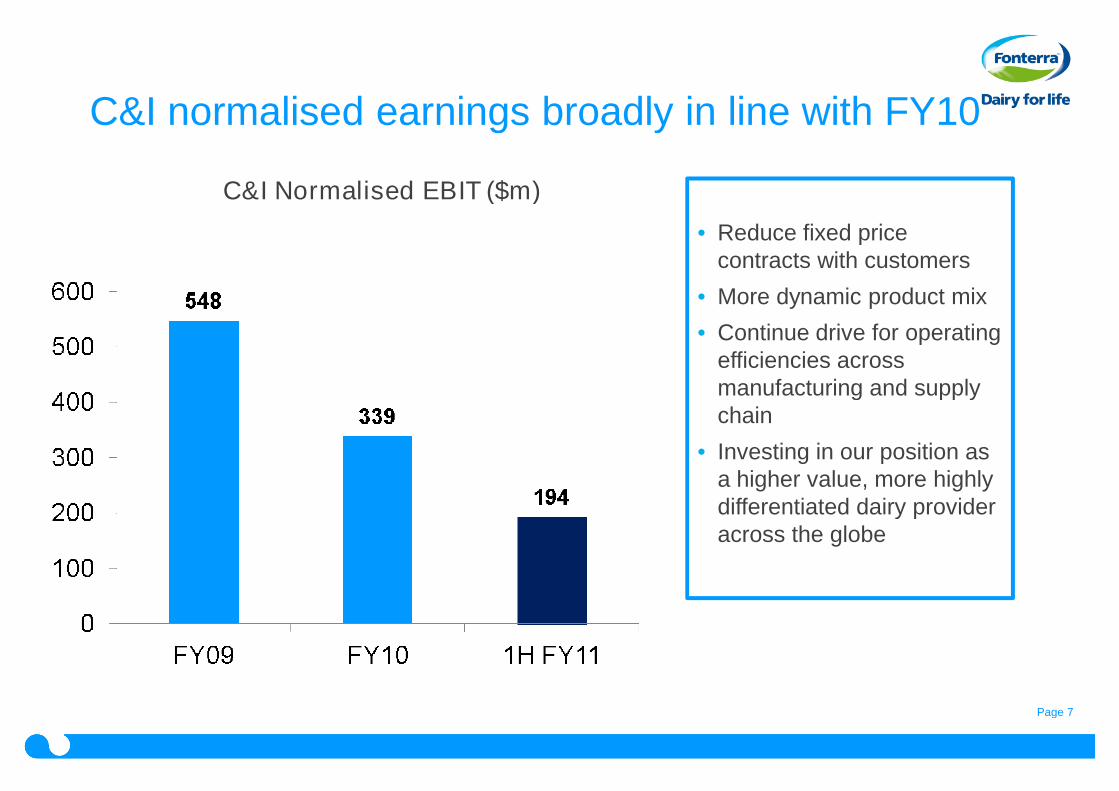
C&I normalised earnings broadly in line with FY10
C&I Normalised EBIT ($m)
• Reduce fixed pricecontracts with customers
• More dynamic product mix
• Continue drive for operatingefficiencies acrossmanufacturing and supplychain
• Investing in our position asa higher value, more highlydifferentiated dairy provideracross the globe
Page 8
The Milk Price methodology
• Price paid to NZ farmers based on the Milk Price Manual, whichassumes:
–All of Fonterra’s NZ milk is processed into a basket of mostlypowder commodity products and sold at market prices
–Costs of processing are based on a notional efficient competitor
• Aggregate Milk Price is recorded in Cost of Goods Sold inFonterra’s financial statements
Page 9
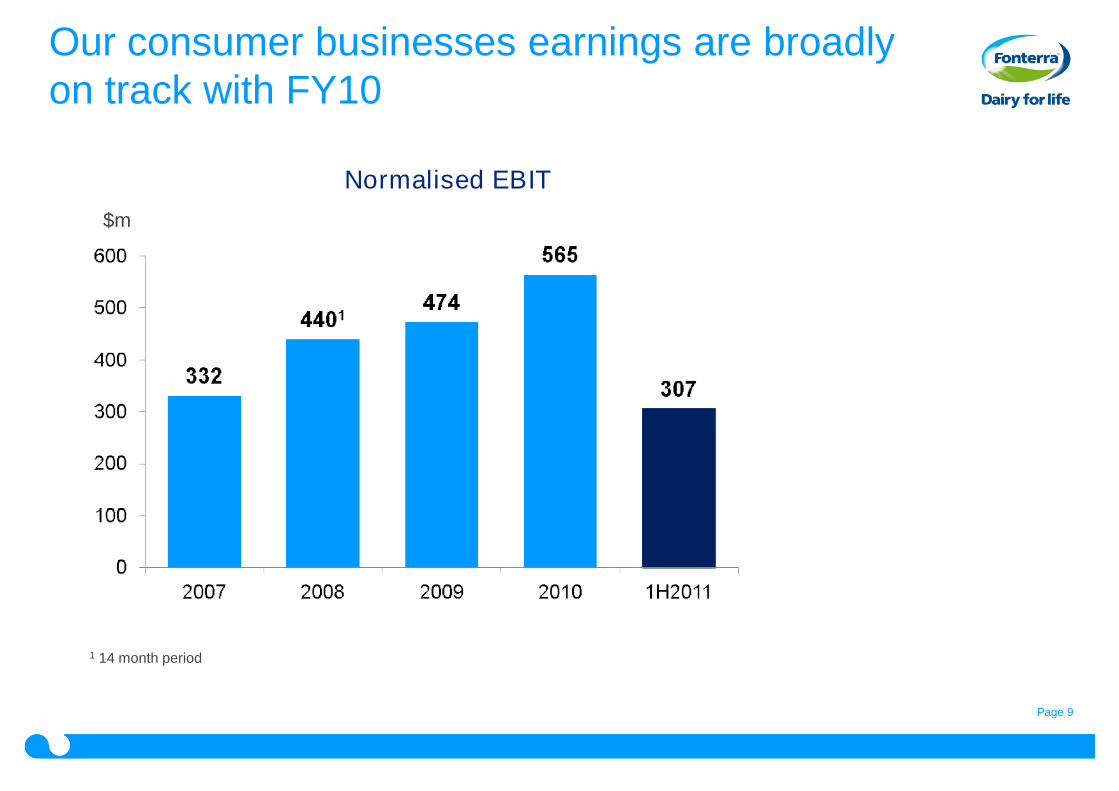
Our consumer businesses earnings are broadlyon track with FY10
$m
Normalised EBIT
1 14 month period
Page 10
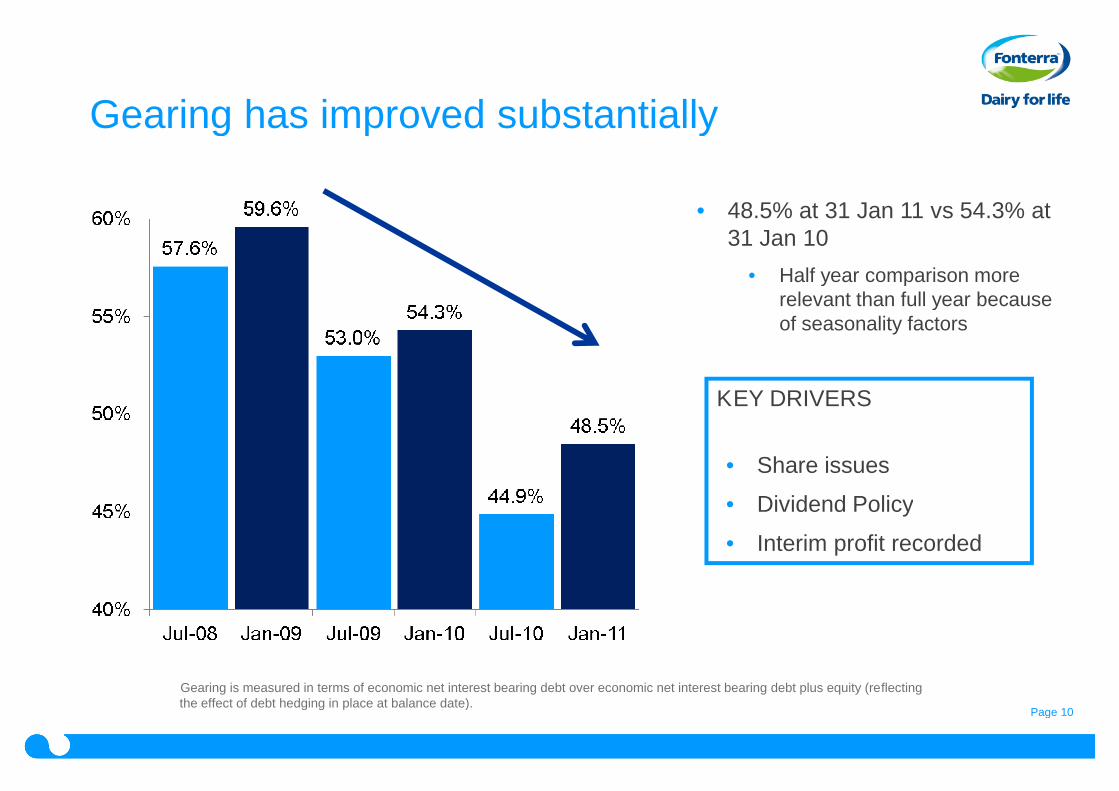
• 48.5% at 31 Jan 11 vs 54.3% at31 Jan 10
• Half year comparison morerelevant than full year becauseof seasonality factors
Gearing has improved substantially
Gearing is measured in terms of economic net interest bearing debt over economic net interest bearing debt plus equity (reflectingthe effect of debt hedging in place at balance date).
KEY DRIVERS
• Share issues
• Dividend Policy
• Interim profit recorded
Page 11
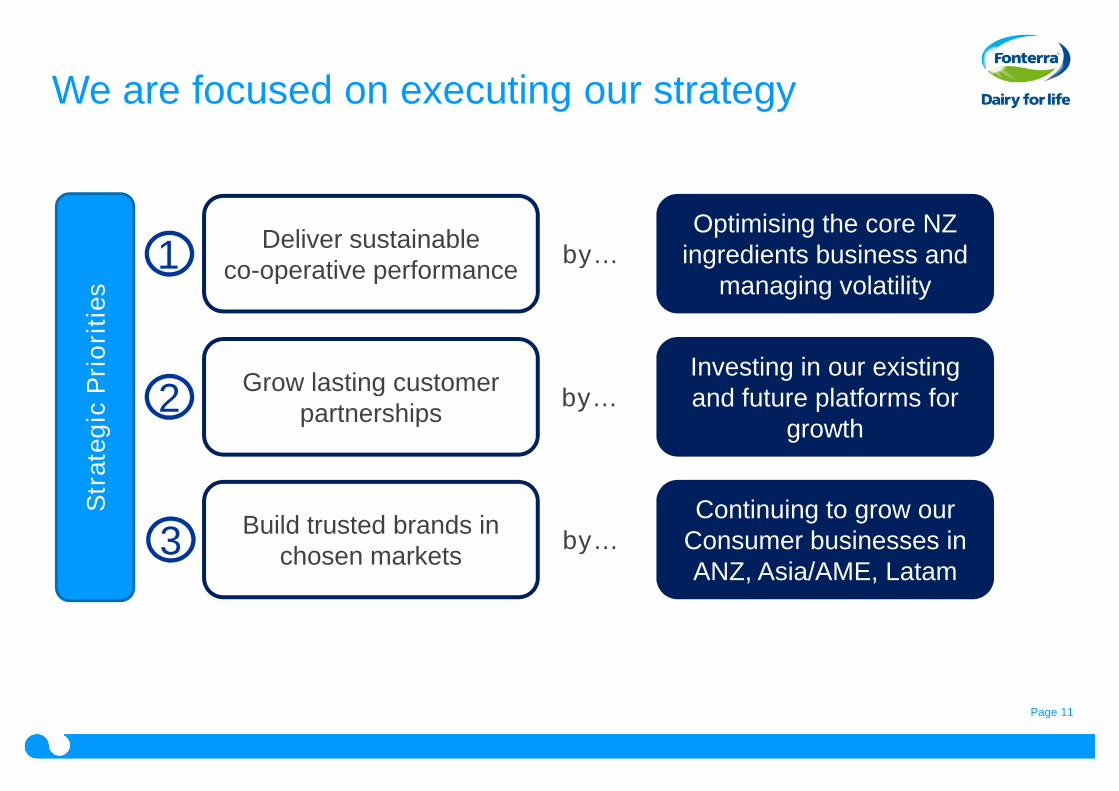
We are focused on executing our strategy
by…
by…
by…
1
2
3
Deliver sustainableco-operative performance
Grow lasting customerpartnerships
Build trusted brands inchosen markets
Str
ate
gic
Pri
ori
ties
Optimising the core NZingredients business and
managing volatility
Investing in our existingand future platforms for
growth
Continuing to grow ourConsumer businesses inANZ, Asia/AME, Latam
Page 12
Priorities for second half FY11
• Drive further earnings improvement from existing resources andplatforms
– Continue initiatives to simplify core NZ milk processing business
– Address portfolio mix and contract terms to reduce earnings impacteven when prices are rising
– Seek improved margins on premium ingredients
• Keep consumer businesses performing in a likely tough environment ofhigh commodity prices
• Continue to tightly manage costs across our business
Page 13
Outlook for Full Year
• Forecast Distributable Profit (=NPAT) of $550m-$690m compared with$685m NPAT in FY10
– Normalised earnings expected to be broadly in line with last year
– Some one-off profit benefits to be confirmed during 2H
• Aggregate expected to be lower than indicated in February reforecastprimarily due to possible losses associated with Christchurch andJapan earthquakes
• Board is targeting a dividend for FY11 of 25-30 cents per share, comparedwith 27 cents for FY10
Recommended