El Paso Central Appraisal District
MASS APPRAISAL REPORT SEPTEMBER, 2016
- 2 -
TableofContents1.0 INTRODUCTION ............................................................................................................................. - 5 -
1.1 Scope of Responsibility ................................................................................................................. - 5 - 1.2 Personnel Resources ...................................................................................................................... - 6 - 1.3 Data ................................................................................................................................................ - 8 - 1.4 Information Systems ...................................................................................................................... - 8 -
2.0 INDEPENDENT PERFORMANCE TEST ..................................................................................... - 10 - 3.0 APPRAISAL ACTIVITIES ............................................................................................................. - 11 -
3.1 Introduction .................................................................................................................................. - 11 - 3.1.1 Appraisal Responsibilities ..................................................................................................... - 11 - 3.1.2 Appraisal Resources .............................................................................................................. - 11 -
3.2 Preliminary Analysis .................................................................................................................... - 11 - 3.2.1 Data Collection/Validation ................................................................................................... - 11 - 3.2.2 Sources of Data ..................................................................................................................... - 12 - 3.2.3 Data Collection Procedures ................................................................................................... - 13 - 3.2.4 Data Maintenance ................................................................................................................. - 13 -
4.0 INDIVIDUAL VALUE REVIEW PROCEDURES ........................................................................ - 14 - 4.1 Field Review ................................................................................................................................ - 14 - 4.2 Office Review .............................................................................................................................. - 14 - 4.3 Performance Test ......................................................................................................................... - 14 -
5.0 RESIDENTIAL VALUATION PROCESS ..................................................................................... - 15 - 5.1 Introduction .................................................................................................................................. - 15 -
5.1.1 Scope of Responsibility ........................................................................................................ - 15 - 5.1.2 Appraisal Resources .............................................................................................................. - 15 -
5.2 Valuation Approach (Model Specification) ................................................................................. - 15 - 5.2.1 Area Analysis ........................................................................................................................ - 15 - 5.2.2 Neighborhood and Market Analysis ..................................................................................... - 15 - 5.2.3 Highest and Best Use Analysis ............................................................................................. - 17 -
5.3 Valuation and Statistical Analysis (Model Calibration) .............................................................. - 17 - 5.3.1 Value Schedules .................................................................................................................... - 17 - 5.3.2 Sales Information .................................................................................................................. - 18 - 5.3.3 Land Analysis ....................................................................................................................... - 18 - 5.3.4 Statistical Analysis ................................................................................................................ - 19 - 5.3.5 Market Adjustment or Trending Factors ............................................................................... - 20 -
5.4 Treatment of Residence Homesteads ........................................................................................... - 21 - 5.5 Individual Value Review Procedures ........................................................................................... - 22 -
5.5.1 Field Review ......................................................................................................................... - 22 - 5.5.2 Office Review ....................................................................................................................... - 23 -
5.6 Performance Tests ........................................................................................................................ - 23 - 5.6.1 Sales Ratio Studies ................................................................................................................ - 23 - 5.6.2 Management Review Process ............................................................................................... - 24 -
6.0 COMMERCIAL VALUATION PROCESS .................................................................................... - 27 - 6.1 Introduction .................................................................................................................................. - 27 -
6.1.1 Appraisal Responsibility ....................................................................................................... - 27 - 6.1.2 Appraisal Resources .............................................................................................................. - 27 -
6.2 Preliminary Analysis .................................................................................................................... - 28 - 6.2.1 Pilot Study ............................................................................................................................. - 28 -
6.3 Valuation Approach (Model Specification) ................................................................................. - 28 - 6.3.1 Area Analysis ........................................................................................................................ - 28 - 6.3.2 Neighborhood Analysis......................................................................................................... - 28 - 6.3.3 Highest and Best Use Analysis ............................................................................................. - 29 - 6.3.4 Market Analysis .................................................................................................................... - 29 -
6.4 Data Collection / Validation ........................................................................................................ - 29 - 6.4.1 Data Collection Manuals ....................................................................................................... - 29 -
- 3 -
6.4.2 Sources of Data ..................................................................................................................... - 30 - 6.5 Valuation Analysis (Model Calibration) ...................................................................................... - 30 -
6.5.1 Cost Schedules ...................................................................................................................... - 31 - 6.5.2 Income Models ...................................................................................................................... - 31 - 6.5.3 Sales Comparison (Market) Approach .................................................................................. - 32 - 6.5.4 Final Valuation Schedules .................................................................................................... - 33 - 6.5.5 Statistical Analysis ................................................................................................................ - 33 -
6.6 Individual Value Review Procedures ........................................................................................... - 33 - 6.6.1 Field Review ......................................................................................................................... - 33 - 6.6.2 Office Review ....................................................................................................................... - 34 -
6.7 Performance Tests ........................................................................................................................ - 35 - 6.7.1 Comparative Appraisal Analysis .......................................................................................... - 35 -
7.0 INDUSTRIAL VALUATION PROCESS ....................................................................................... - 36 - 7.1 Introduction .................................................................................................................................. - 36 -
7.1.1 Appraisal Responsibility ....................................................................................................... - 36 - 7.2 Valuation Approach (Model Specification) ................................................................................. - 36 -
7.2.1 Area Analysis ........................................................................................................................ - 36 - 7.2.2 Neighborhood Analysis......................................................................................................... - 37 - 7.2.3 Highest and Best Use Analysis ............................................................................................. - 37 - 7.2.4 Market Analysis .................................................................................................................... - 37 -
7.3 Data Collection/Validation .......................................................................................................... - 38 - 7.3.1 Data Collection Manuals ....................................................................................................... - 38 - 7.3.2 Sources of Data ..................................................................................................................... - 38 - 7.3.3 Data Collection Procedures ................................................................................................... - 38 -
7.4 Valuation Analysis (Model Calibration) ...................................................................................... - 39 - 7.4.1 Final Valuation Schedules .................................................................................................... - 39 -
7.5 Individual Value Review Procedures ........................................................................................... - 39 - 7.5.1 Field Review ......................................................................................................................... - 39 - 7.5.2 Office Review ....................................................................................................................... - 39 -
7.6 Performance Tests ........................................................................................................................ - 40 - 7.6.1 Sales Ratio Studies ................................................................................................................ - 40 - 7.6.2 Comparative Appraisal Analysis .......................................................................................... - 40 -
8.0 BUSINESS PERSONAL PROPERTY ............................................................................................ - 41 - 8.1 Introduction .................................................................................................................................. - 41 -
8.1.1 Appraisal Responsibility ....................................................................................................... - 41 - 8.1.2 Appraisal Resources .............................................................................................................. - 41 -
8.2 Valuation Approach (Model Specification) ................................................................................. - 41 - 8.2.1 SIC Code Analysis ................................................................................................................ - 41 - 8.2.2 Highest and Best Use Analysis ............................................................................................. - 42 -
8.3 Data Collection/Validation .......................................................................................................... - 42 - 8.3.1 Data Collection Procedures ................................................................................................... - 42 - 8.3.2 Sources of Data ..................................................................................................................... - 42 -
8.4 Valuation and Statistical Analysis (Model Calibration) .............................................................. - 43 - 8.4.1 Cost Schedules ...................................................................................................................... - 43 - 8.4.2 Statistical Analysis ................................................................................................................ - 43 - 8.4.3 Depreciation Schedule and Trending Factors: ...................................................................... - 43 - 8.4.4 Comptroller’s Field Appraiser’s Guide ................................................................................. - 44 - 8.4.5 Vehicles ................................................................................................................................. - 44 - 8.4.6 Leased and Multi-Location Assets ........................................................................................ - 44 -
8.5 Individual Value Review Procedures ........................................................................................... - 44 - 8.5.1 Office Review ....................................................................................................................... - 44 -
8.6 Performance Tests ........................................................................................................................ - 45 - 8.6.1 Ratio Studies ......................................................................................................................... - 45 - 8.6.2 Internal Testing ..................................................................................................................... - 45 -
9.0 LIMITING CONDITIONS .............................................................................................................. - 46 -
- 4 -
10.0 CERTIFICATION STATEMENT ................................................................................................ - 47 - Attachments
A. Appraisal and Administrative Staff
B. Ratio Studies
C. Wardlaw Staff and Reports
- 5 -
1.0 INTRODUCTION 1.1 Scope of Responsibility
The El Paso Central Appraisal District (CAD) has prepared and published this report to provide
our citizens and taxpayers with a better understanding of the CAD's responsibilities and
activities.
The CAD is a political subdivision of the State of Texas created effective January 1, 1980. The
provisions of the Texas Tax Code govern the legal, statutory, and administrative requirements
of the CAD. A nine-member board of directors, appointed by the taxing units with voting
entitlement within the boundaries of El Paso County, constitutes the CAD’s governing body.
The Executive Director/Chief Appraiser, appointed by the board of directors, is the chief
administrator and chief executive officer of the CAD.
The CAD is responsible for local property tax appraisal and exemption administration for thirty-
eight (38) jurisdictions or taxing units in the county. Each taxing unit, such as the county, city,
school district, municipal utility district, etc., sets its own tax rate to generate revenue to pay for
such things as police and fire protection, public schools, road and street maintenance, courts,
water and sewer systems, and other public services. CAD appraisals allocate the year's tax
burden on the basis of each taxable property's January 1st market value. We also determine
eligibility for various types of property tax exemptions such as those for homeowners, the
elderly, disabled veterans, and exempt organizations.
The CAD appraises all taxable property at its “market value” as of January 1st except as
otherwise provided by the Tax Code. Under Tax Code Section 1.04, “market value” means the
price at which a property would transfer for cash or its equivalent under prevailing market
conditions if:
exposed for sale in the open market with a reasonable time for the seller to find a
purchaser;
both the seller and the buyer know of all the uses and purposes to which the property is
adapted and for which it is capable of being used and of the enforceable restrictions on
its use, and;
both the seller and buyer seek to maximize their gains and neither is in a position to take
advantage of the exigencies of the other.
- 6 -
The Tax Code defines special appraisal provisions for the valuation of residential homestead
property (Sec. 23.23), agricultural productivity value (Sec. 23.41), real property inventory (Sec.
23.12), dealer inventory (Sec. 23.121, 23.124, 23.1241 and 23.127), nominal (Sec. 23.18) or
restricted use properties (Sec. 23.83) and allocation of interstate property (Sec. 21.03). The
owner of real property inventory may elect to have the inventory appraised at its market value
as of September 1st of the year proceeding the tax year to which the appraisal applies by filing
an application with the chief appraiser requesting that the inventory be appraised as of
September 1st.
The Texas Tax Code, under Sec. 25.18, requires each appraisal board to adopt a written plan
each even-numbered year for the periodic reappraisal of all property within the boundaries of
the appraisal district. The written plan must provide for the update of appraised values for all
real property and personal property in the appraisal district at least once every three years. The
CAD’s current policy is to conduct a general reappraisal every three years. However, appraised
values are reviewed annually and are subject to change for purposes of equalization.
CAD uses specific information about each property to calculate the appraised value of real
estate. We compare that information with the data for similar properties, and with recent market
data using computer-assisted appraisal programs, and recognized appraisal methods and
techniques. The CAD follows the standards of the International Association of Assessing
Officers (IAAO) regarding its mass appraisal practices and procedures, and subscribes to the
standards promulgated by the Appraisal Foundation known as the Uniform Standards of
Professional Appraisal Practice (USPAP) to the extent they are applicable. In cases where the
CAD contracts for professional valuation services, the contract that is entered into by the
appraisal firm requires adherence to similar professional standards.
1.2 Personnel Resources
The Office of the Chief Appraiser is responsible for overall planning, organizing, staffing,
coordinating, and controlling of CAD operations. The Administration Department’s function is to
plan, organize, direct and control the business support functions related to human resources,
budget, finance, records management, purchasing, fixed assets, facilities and postal services.
The appraisal departments are responsible for the valuation of all real and business personal
property accounts. The appraised property types include commercial, residential, business
personal, and industrial.
- 7 -
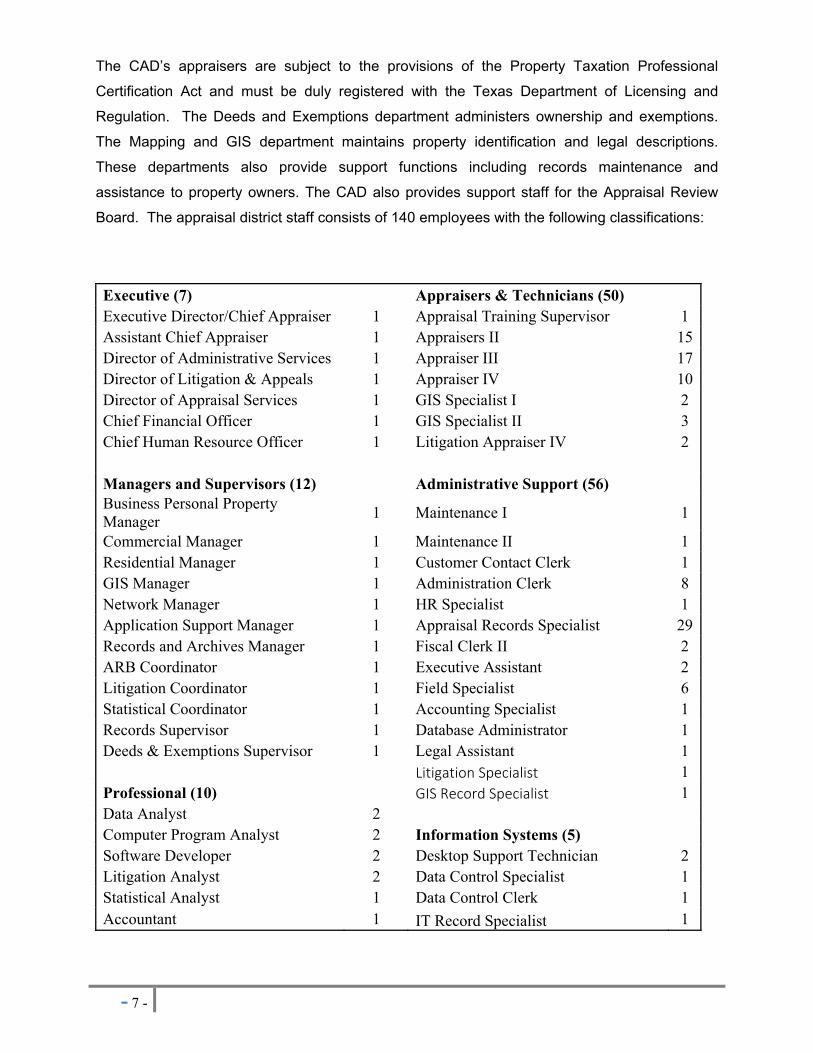
The CAD’s appraisers are subject to the provisions of the Property Taxation Professional
Certification Act and must be duly registered with the Texas Department of Licensing and
Regulation. The Deeds and Exemptions department administers ownership and exemptions.
The Mapping and GIS department maintains property identification and legal descriptions.
These departments also provide support functions including records maintenance and
assistance to property owners. The CAD also provides support staff for the Appraisal Review
Board. The appraisal district staff consists of 140 employees with the following classifications:
Executive (7) Appraisers & Technicians (50) Executive Director/Chief Appraiser 1 Appraisal Training Supervisor 1 Assistant Chief Appraiser 1 Appraisers II 15Director of Administrative Services 1 Appraiser III 17Director of Litigation & Appeals 1 Appraiser IV 10Director of Appraisal Services 1 GIS Specialist I 2 Chief Financial Officer 1 GIS Specialist II 3 Chief Human Resource Officer 1 Litigation Appraiser IV 2 Managers and Supervisors (12) Administrative Support (56) Business Personal Property Manager
1 Maintenance I 1
Commercial Manager 1 Maintenance II 1 Residential Manager 1 Customer Contact Clerk 1 GIS Manager 1 Administration Clerk 8 Network Manager 1 HR Specialist 1 Application Support Manager 1 Appraisal Records Specialist 29Records and Archives Manager 1 Fiscal Clerk II 2 ARB Coordinator 1 Executive Assistant 2 Litigation Coordinator 1 Field Specialist 6 Statistical Coordinator 1 Accounting Specialist 1 Records Supervisor 1 Database Administrator 1 Deeds & Exemptions Supervisor 1 Legal Assistant 1 Litigation Specialist 1 Professional (10) GIS Record Specialist 1 Data Analyst 2 Computer Program Analyst 2 Information Systems (5) Software Developer 2 Desktop Support Technician 2 Litigation Analyst 2 Data Control Specialist 1 Statistical Analyst 1 Data Control Clerk 1 Accountant 1 IT Record Specialist 1

- 8 -
1.3 Data
The CAD is responsible for establishing and maintaining approximately 417,830 real and
business personal accounts covering 1054 square miles within El Paso County. This data
includes property characteristics, ownership and exemption information. Appraisers update
property characteristic data on new construction through an annual field effort. Field review
priorities depend on existing property data of the last field inspection date. CAD staff routinely
validates sales during a separate field effort. However, numerous sales are validated as part of
the new construction and data review field activities. CAD acquires general trends in
employment, interest rates, new construction trends, and cost and market data through various
sources, including internally generated questionnaires to buyers and sellers, university research
centers, and market data centers and vendors.
The CAD has a geographic information system (GIS) that maintains cadastral maps and various
layers of data, including zip code, facet and aerial photography. The CAD’s website makes a
broad range of information available for public access, including but not limited to detailed
information on the appraisal process, property characteristics data, certified values, protests and
appeal procedures, property maps, and a tax calendar. Downloadable fields of related tax
information and appraisal district forms, including exemption applications and business personal
property rendition forms are also available.
1.4 Information Systems
The department designs, builds, operates and maintains its information systems including but
not limited to:
Data processing,
Software applications,
Public website,
Geographical information systems (GIS),
Custom applications.
CAD’s CAMA system is a high-availability client/server environment. CAD’s productivity suite is
Microsoft Office365 available for all computer systems. We use Microsoft SQL2008R2/
SQL2012R2 Enterprise edition for databases. All professional personnel have access to 300
Mbps high-speed internet and all employees have access to the district intranet.
CAD uses Cisco, Websense and Fluke equipment/software to control network access. Proximity
cards and video surveillance controls physical access. The Windows active directory controls

- 9 -
computer and application access. In addition, each individual application has a proprietary
access control. For example, the CAMA system has an internal access control feature to
manage proper user access.
CAD uses NetFort LanGuard for SQL to maintain data security outside the CAMA solution. On
the same token, the CAMA software maintains a controlled and adequate set of tools that allows
for the granting and denial of user rights to system modules and updating, viewing, and running
features, and utilities within the modules. It also maintains a change log of inserts, updates, and
deletions in appraisal records. The system records each transaction with a unique change ID,
the name of the machine used to implement the transaction, the logged-on user, date time
stamp, affected roll year, transaction type, field, and before and after values.
The CAMA software is True Automation’s PACS release 8.1.27.0013 The GIS systems software
is ESRI’s ArcGIS Server 10.4 with ArcDesktop 10.4.
- 10 -
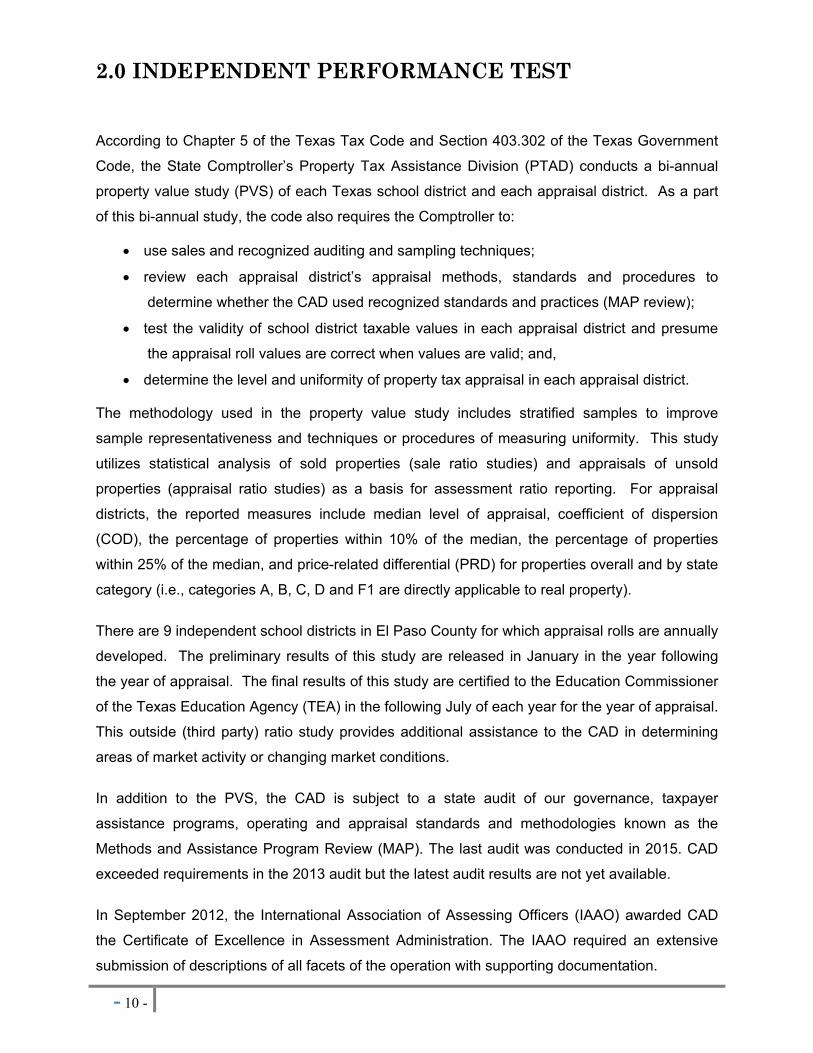
2.0 INDEPENDENT PERFORMANCE TEST
According to Chapter 5 of the Texas Tax Code and Section 403.302 of the Texas Government
Code, the State Comptroller’s Property Tax Assistance Division (PTAD) conducts a bi-annual
property value study (PVS) of each Texas school district and each appraisal district. As a part
of this bi-annual study, the code also requires the Comptroller to:
use sales and recognized auditing and sampling techniques;
review each appraisal district’s appraisal methods, standards and procedures to
determine whether the CAD used recognized standards and practices (MAP review);
test the validity of school district taxable values in each appraisal district and presume
the appraisal roll values are correct when values are valid; and,
determine the level and uniformity of property tax appraisal in each appraisal district.
The methodology used in the property value study includes stratified samples to improve
sample representativeness and techniques or procedures of measuring uniformity. This study
utilizes statistical analysis of sold properties (sale ratio studies) and appraisals of unsold
properties (appraisal ratio studies) as a basis for assessment ratio reporting. For appraisal
districts, the reported measures include median level of appraisal, coefficient of dispersion
(COD), the percentage of properties within 10% of the median, the percentage of properties
within 25% of the median, and price-related differential (PRD) for properties overall and by state
category (i.e., categories A, B, C, D and F1 are directly applicable to real property).
There are 9 independent school districts in El Paso County for which appraisal rolls are annually
developed. The preliminary results of this study are released in January in the year following
the year of appraisal. The final results of this study are certified to the Education Commissioner
of the Texas Education Agency (TEA) in the following July of each year for the year of appraisal.
This outside (third party) ratio study provides additional assistance to the CAD in determining
areas of market activity or changing market conditions.
In addition to the PVS, the CAD is subject to a state audit of our governance, taxpayer
assistance programs, operating and appraisal standards and methodologies known as the
Methods and Assistance Program Review (MAP). The last audit was conducted in 2015. CAD
exceeded requirements in the 2013 audit but the latest audit results are not yet available.
In September 2012, the International Association of Assessing Officers (IAAO) awarded CAD
the Certificate of Excellence in Assessment Administration. The IAAO required an extensive
submission of descriptions of all facets of the operation with supporting documentation.
- 11 -
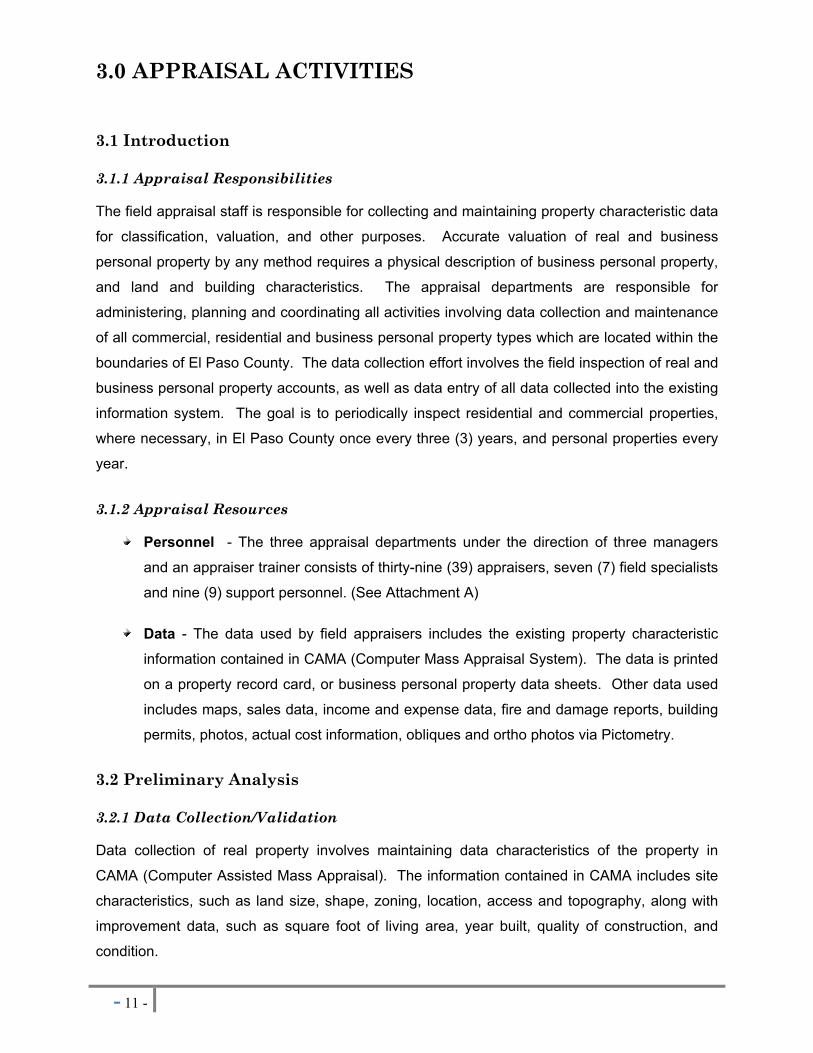
3.0 APPRAISAL ACTIVITIES
3.1 Introduction
3.1.1 Appraisal Responsibilities
The field appraisal staff is responsible for collecting and maintaining property characteristic data
for classification, valuation, and other purposes. Accurate valuation of real and business
personal property by any method requires a physical description of business personal property,
and land and building characteristics. The appraisal departments are responsible for
administering, planning and coordinating all activities involving data collection and maintenance
of all commercial, residential and business personal property types which are located within the
boundaries of El Paso County. The data collection effort involves the field inspection of real and
business personal property accounts, as well as data entry of all data collected into the existing
information system. The goal is to periodically inspect residential and commercial properties,
where necessary, in El Paso County once every three (3) years, and personal properties every
year.
3.1.2 Appraisal Resources
Personnel - The three appraisal departments under the direction of three managers
and an appraiser trainer consists of thirty-nine (39) appraisers, seven (7) field specialists
and nine (9) support personnel. (See Attachment A)
Data - The data used by field appraisers includes the existing property characteristic
information contained in CAMA (Computer Mass Appraisal System). The data is printed
on a property record card, or business personal property data sheets. Other data used
includes maps, sales data, income and expense data, fire and damage reports, building
permits, photos, actual cost information, obliques and ortho photos via Pictometry.
3.2 Preliminary Analysis
3.2.1 Data Collection/Validation
Data collection of real property involves maintaining data characteristics of the property in
CAMA (Computer Assisted Mass Appraisal). The information contained in CAMA includes site
characteristics, such as land size, shape, zoning, location, access and topography, along with
improvement data, such as square foot of living area, year built, quality of construction, and
condition.
- 12 -
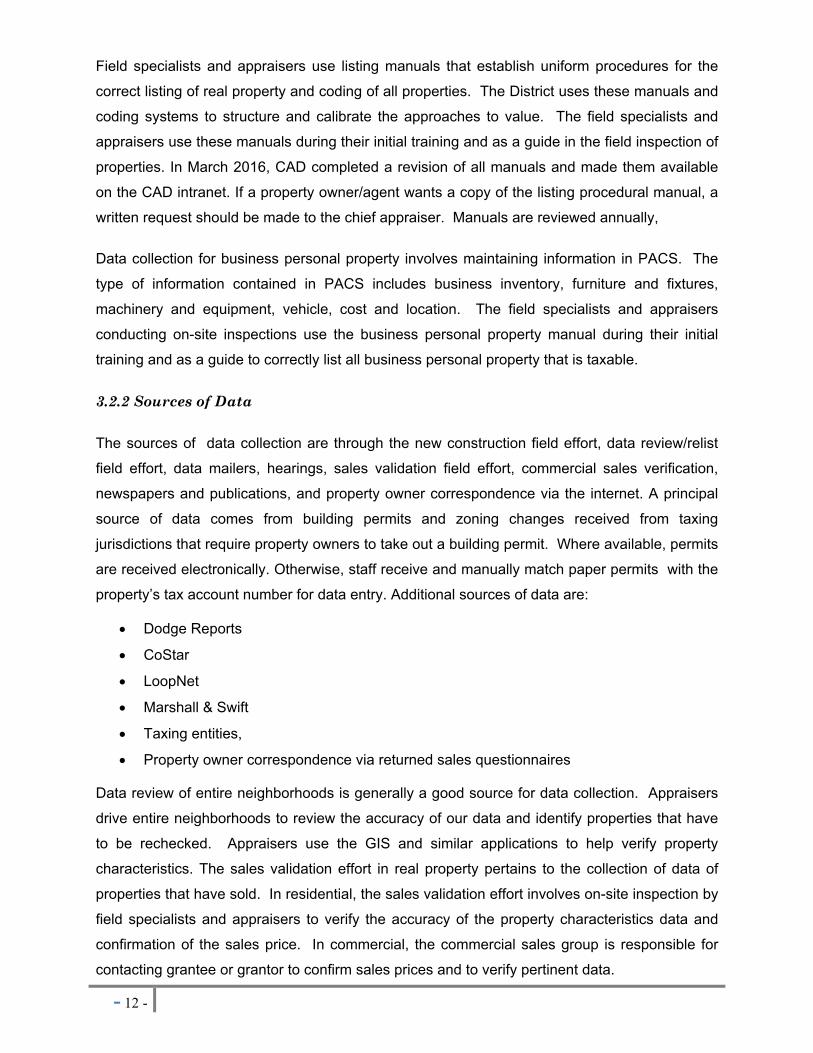
Field specialists and appraisers use listing manuals that establish uniform procedures for the
correct listing of real property and coding of all properties. The District uses these manuals and
coding systems to structure and calibrate the approaches to value. The field specialists and
appraisers use these manuals during their initial training and as a guide in the field inspection of
properties. In March 2016, CAD completed a revision of all manuals and made them available
on the CAD intranet. If a property owner/agent wants a copy of the listing procedural manual, a
written request should be made to the chief appraiser. Manuals are reviewed annually,
Data collection for business personal property involves maintaining information in PACS. The
type of information contained in PACS includes business inventory, furniture and fixtures,
machinery and equipment, vehicle, cost and location. The field specialists and appraisers
conducting on-site inspections use the business personal property manual during their initial
training and as a guide to correctly list all business personal property that is taxable.
3.2.2 Sources of Data
The sources of data collection are through the new construction field effort, data review/relist
field effort, data mailers, hearings, sales validation field effort, commercial sales verification,
newspapers and publications, and property owner correspondence via the internet. A principal
source of data comes from building permits and zoning changes received from taxing
jurisdictions that require property owners to take out a building permit. Where available, permits
are received electronically. Otherwise, staff receive and manually match paper permits with the
property’s tax account number for data entry. Additional sources of data are:
Dodge Reports
CoStar
LoopNet
Marshall & Swift
Taxing entities,
Property owner correspondence via returned sales questionnaires
Data review of entire neighborhoods is generally a good source for data collection. Appraisers
drive entire neighborhoods to review the accuracy of our data and identify properties that have
to be rechecked. Appraisers use the GIS and similar applications to help verify property
characteristics. The sales validation effort in real property pertains to the collection of data of
properties that have sold. In residential, the sales validation effort involves on-site inspection by
field specialists and appraisers to verify the accuracy of the property characteristics data and
confirmation of the sales price. In commercial, the commercial sales group is responsible for
contacting grantee or grantor to confirm sales prices and to verify pertinent data.
- 13 -
Property owners are one of the best sources for identifying incorrect data that generates a field
check. Frequently, the property owner provides sufficient data to allow correction of records
without having to send an appraiser on-site. As the CAD increases the amount of information
available on the internet, property owner’s requests to correct data inconsistencies will also
increase. For the property owner without access to the internet, letters are often submitted
notifying the CAD of inaccurate data. Properties identified in this manner are added to a work
file and inspected at our earliest opportunity.
3.2.3 Data Collection Procedures
Field data collection requires organization, planning and supervision of the field effort. Data
collection procedures have been established for residential, commercial, and business personal
property. The appraisers are assigned throughout El Paso County to conduct field inspections
and record information either on a property record card or a business personal property data
sheet.
The quality of the data used is extremely important in establishing accurate values of taxable
property. While production standards are established and upheld for the various field activities,
quality of data is emphasized as the goal and responsibility of each appraiser. New appraisers
are trained in the specifics of data collection set forth in the listing manual as “rules” to follow.
Experienced appraisers are routinely re-trained in listing procedures prior to major field projects
such as new construction, sales validation or data review. A quality assurance process exists
through supervisory review of the work being performed by the field appraisers. Quality
assurance supervision is charged with the responsibility of ensuring that appraisers follow listing
procedures, identify training issues and provide uniform training throughout the field appraisal
staff.
3.2.4 Data Maintenance
The field specialists and the field appraisers are responsible for the verification of data entry of
his/her fieldwork. This responsibility includes not only verification of data entry, but also quality
assurance.
- 14 -
4.0 INDIVIDUAL VALUE REVIEW PROCEDURES 4.1 Field Review
The date of last inspection, extent of that inspection, and the CAD appraiser responsible are
listed on the CAMA record. The data in CAMA may be altered based on the evidence provided
during a hearing. In addition, CAD uses the change finder, sketch finder components of
Pictionary to identify possible changes to properties. Typically, a field inspection is requested to
verify this evidence for the current year’s valuation or for the next year’s valuation. Every year a
field review of certain areas or neighborhoods and certain property categories in the jurisdiction
are done during the data review/re-list field effort. A concerted effort to inspect all business
personal property is conducted annually.
4.2 Office Review
Office reviews are completed on properties where information has been received from the
owner of the property. At the request of the property owner, a property card is mailed and they
frequently verify the property characteristics or current condition of the property. Appraisers
review the properties using aerial photography to compare property data with the property
records and makes appropriate corrections. When the property data is verified in this manner,
field inspections are not required. In addition, CAD uses the “Change Finder” features of
Pictometry. In addition, any property protested that has had an informal hearing or a hearing
before the ARB, is considered having been reviewed because of the nature of such hearings
and the evidence reviewed during the process.
4.3 Performance Test
The appraiser analysts are responsible for conducting ratio studies and comparative analysis.
Each departments performance testing is described in the applicable department’s chapter.
In many cases, field appraisers may conduct field inspections to insure the ratios produced are
accurate and the appraised values utilized are based on accurate property data characteristics.
- 15 -
5.0 RESIDENTIAL VALUATION PROCESS 5.1 Introduction
5.1.1 Scope of Responsibility
The Residential Valuation appraisers are responsible for developing equal and uniform market
values for residential improved, mobile home and residential vacant property accounts. There
are approximately 361,951 such accounts in El Paso County.
5.1.2 Appraisal Resources
Personnel - The Residential Valuation appraisal staff consists of eighteen (18)
appraisers, one (1) appraiser trainer, five (5) field specialists and six (6) support
staff.
Data - A common set of data characteristics for each residential dwelling in El
Paso County is collected in the field and data entered to the computer.
5.2 Valuation Approach (Model Specification)
5.2.1 Area Analysis
Data on regional economic forces such as demographic patterns, regional location factors,
employment and income patterns, general trends in real property prices and rents, interest rate
trends, availability of vacant land, water access, and construction trends and costs are collected
from private vendors and public sources and provide the CAD with a current economic outlook
on the real estate market. Information is gleaned from real estate publications and sources
such as continuing education from the International Association of Assessing Officers (IAAO),
Texas Association of Assessing Officers (TAAO), Texas Association of Appraisal Districts
(TAAD), Property Tax Education Coalition (PTEC) and the Texas A & M University – Real
Estate Center.
5.2.2 Neighborhood and Market Analysis
The CAD uses neighborhood analysis to examine how physical, economic, governmental and
social forces and other influences affect property values. The effects of these forces are also
used to identify, classify, and stratify comparable properties into smaller, manageable subsets of
the universe of properties known as neighborhoods. Residential valuation and neighborhood
analysis is conducted on each of the political entities known as Independent School Districts
(ISD).
- 16 -
The first step in neighborhood analysis is the identification of a group of properties that share
certain common traits. A "neighborhood" for analysis purposes is defined as the largest
geographic grouping of properties where the property’s physical, economic, governmental and
social forces are generally similar and uniform. Geographic stratification accommodates the
local supply and demand factors that vary across a jurisdiction. Once a neighborhood has been
identified, the next step is to define its boundaries. This process is known as "delineation".
Some factors used in neighborhood delineation include location, sales price range, lot size, age
of dwelling, quality of construction and condition of dwellings, square footage of living area, and
story height. Delineation can involve the physical drawing of neighborhood boundary lines on a
map, but it can also involve statistical separation or stratification based on attribute analysis.
Part of neighborhood analysis is the consideration of discernible patterns of growth that
influence a neighborhood’s individual market.
Few neighborhoods are fixed in character. Each neighborhood may be characterized as being
in a stage of growth, stability, decline or revitalization. The growth period is a time of
development and construction. As new neighborhoods in a community are developed, they
compete with existing neighborhoods. An added supply of new homes tends to induce
population shifts from older homes to newer homes. In the period of stability, or equilibrium, the
forces of supply and demand are about equal. Generally, in the stage of equilibrium, older
neighborhoods can be more desirable due to their stability of residential character and proximity
to the workplace and other community facilities. The period of decline reflects diminishing
demand or desirability. During decline, general property use may change from residential to a
mix of residential and commercial uses. Declining neighborhoods may also experience
renewal, reorganization, rebuilding, or restoration, which promotes increased demand and
economic desirability.
Neighborhood identification and delineation are the cornerstones of the residential valuation
system at the CAD. All the residential analysis work done in association with the residential
valuation process is neighborhood specific. Neighborhoods are field-inspected and delineated
based on observable aspects of homogeneity. Neighborhood delineation is periodically
reviewed to determine if further neighborhood delineation is warranted. Whereas
neighborhoods involve similar properties in the same location, a neighborhood group is simply
defined as similar neighborhoods in similar locations. Each residential neighborhood is
assigned to a neighborhood group based on observable aspects of homogeneity between
neighborhoods. Neighborhood grouping is highly beneficial in cost-derived areas of limited or
no sales, or use in direct sales comparison analysis. Neighborhood groups, or clustered
neighborhoods, increase the available market data by linking comparable properties outside a
- 17 -
given neighborhood. Sales ratio analysis, discussed below, is performed on a neighborhood
basis, and in soft sale areas on a neighborhood group basis.
5.2.3 Highest and Best Use Analysis
In 2009, the Tax Code Section 23.01(c) was changed and states that “The market value of a
residence homestead shall be determined solely on the basis of the property’s value as a
residence homestead, regardless of whether the residential use of the property by the owner is
considered to be the highest and best use of the property”.
The highest and best use of property is the reasonable and probable use that supports the
highest value as of the date of the appraisal. The highest and best use must be physically
possible, legally permissible, financially feasible, and derives maximum production. The highest
and best use of residential property is normally its current use. This is due in part to the fact
that residential development, in many areas, through use of deed restrictions and zoning,
precludes other land uses.
Residential valuation undertakes reassessment of highest and best use in transition areas and
areas of mixed residential and commercial use. In transition areas with ongoing gentrification,
the appraiser reviews the existing residential property use and makes a determination regarding
highest and best use. Once the conclusion is made that the highest and best use remains
residential, further highest and best use analysis is done to decide the type of residential use on
a neighborhood basis. As an example, it may be determined in a transition area that older, non-
remodeled homes are economic mis-improvements, and the highest and best use of such
property is the construction of new dwellings. In areas of mixed residential and commercial use,
the appraiser reviews properties in these areas on a periodic basis to determine if changes in
the real estate market require reassessment of the highest and best use of a select population
of properties.
5.3 Valuation and Statistical Analysis (Model Calibration)
5.3.1 Value Schedules
All residential parcels in the CAD are valued from construction cost guidelines using a
comparative unit method. The CAD’s residential value schedules, originally adopted from a
private mass appraisal firm, have been customized to fit El Paso County’s local residential
building and labor market. The value schedules are reviewed regularly as a result of recent
state legislation requiring that the CAD value schedules be within a range of plus or minus 5%
from market value.
- 18 -
The CAD performed a county-wide review of the residential value schedules for the 2015 tax
year. As part of this process, approximately 425 newly constructed sold properties at various
levels of quality of construction in El Paso County were reviewed. The property data
characteristics of these properties were verified and photographs were taken of the samples. Of
these properties, 696 samples were selected for use in the CAD value schedule review.
The CAD dwelling values were compared against Marshall & Swift, a nationally recognized cost
estimator. This process included correlation of quality of construction factors from CAD and
Marshall & Swift. The results of this comparison were analyzed using statistical measures,
including stratification by quality and reviewing estimated building costs plus land to sales
prices. As a result of this analysis, we determined that we did not need to make adjustments to
existing models. The CAD also determined no need for a new regional multiplier in development
of our cost process. In addition to the value schedules, applications have been created to
address unique appraisal situations, such as different levels of remodeling and atypical housing
features not normally accounted for in the mainframe benchmark value system.
5.3.2 Sales Information
A sales file is maintained for the storage of “snapshot” sales data at the time of sale.
Residential vacant land sales, along with commercial improved and vacant land sales are
maintained in a separate sales information system. Residential improved and vacant sales are
collected from a variety of sources, including: CAD questionnaires sent to buyer and seller, field
discovery, protest hearings, various sale vendors, builders, and realtors. A system of type,
source, validity and verification codes exists to define salient facts related to a property’s
purchase or transfer. School district or neighborhood sales reports are generated as an
analysis tool for the appraiser in the development of value estimates.
5.3.3 Land Analysis
Residential land analysis is conducted by each of the residential land appraisers. The
appraisers develop a base lot, primary rate, and assign each unique neighborhood to one of
thirty-seven square foot land tables. The square foot land table is designed to systematically
value the primary and residual land based on a specified percentage of the primary rate. A
computerized land table file stores the land information required to consistently value individual
parcels within neighborhoods. Specific land influences are used, where necessary, to adjust
parcels outside the neighborhood norm for such factors as view, shape, size, and topography,
among others. The appraisers use abstraction and allocation methods to insure that the land
- 19 -
values created best reflect the contributory market value of the land to the overall property
value.
5.3.4 Statistical Analysis
The statistical analyst performs statistical analysis annually to evaluate whether values are
equitable and consistent with the market. EPCAD has divided the county into twelve market
areas designated in CAMA as regions and shown in Figure 5.1. They are:
Figure 5.1 Market Areas
A West Area
B Upper Valley Area
C Northeast Area
D Central Area
E East Area
F Lower Valley
G Anthony ISD
J Clint ISD
L San Elizario ISD
N City of Socorro
P Socorro ISD Outside El Paso City Limits
R City of Horizon
EPCAD further delineates properties by neighborhoods. The letter in front of each market area
will be the first character in the GEO identification number.
Ratio studies are conducted on each of the residential valuation neighborhoods and school
districts in El Paso County to judge the two primary aspects of mass appraisal accuracy--level
and uniformity of value. The central tendency and dispersion generated from sales ratios are
available for each stratified neighborhood within an ISD and summarized by year. These
summary statistics including, but not limited to, the weighted mean, median, standard deviation,
coefficient of variation, and coefficient of dispersion provide the appraisers a tool by which to
determine both the level and uniformity of appraised value on a stratified neighborhood basis.
The level of appraised values is determined by the weighted mean for individual properties
within a neighborhood, and a comparison of neighborhood weighted means reflect the general
level of appraised value between comparable neighborhoods. Review of the standard
deviation, coefficient of variation, and coefficient of dispersion discerns appraisal uniformity
within and between stratified neighborhoods.
Every neighborhood is reviewed annually by the appraiser through the sales ratio analysis
process. The first phase involves neighborhood ratio studies that compare the recent sales
prices of neighborhood properties to the appraised values of these sold properties. This set of
- 20 -
ratio studies affords the appraiser an excellent means of judging the present level of appraised
value and uniformity of the sales. The appraiser, based on the sales ratio statistics and
designated parameters for valuation update, makes a preliminary decision as to whether the
value level in a neighborhood needs to be updated in an upcoming reappraisal, or whether the
level of market value in a neighborhood is at an acceptable level. (See Attachment B for
Appraisal Ratios Sales High and Low, Ratio Studies Summary, Appraisal Ratios by Market
Area, Appraisal Ratios by Neighborhoods)
5.3.5 Market Adjustment or Trending Factors
Neighborhood, or market adjustment, factors are developed from appraisal statistics provided
from ratio studies and are used to ensure that estimated values are consistent with the market.
The CAD’s primary approach to the valuation of residential properties uses a hybrid cost-sales
comparison approach. This type of approach accounts for neighborhood market influences not
specified in the cost model.
The following equation denotes the hybrid model used:
MV = MA [LV + (RCN – D)]
Whereas, the market value (MV) equals the market adjustment factor (MA) times the land value
(LV) plus the replacement cost new (RCN) of any improvements minus normal depreciation (D).
As the cost approach separately estimates both land and building values and uses depreciated
replacement costs, which reflect only the supply side of the market, it is expected that
adjustments to the cost values are needed to bring the level of appraisal to an acceptable
standard. Market or location adjustments are applied uniformly within neighborhoods to account
for locational variances between market areas or across a jurisdiction.
If a neighborhood is to be updated, the appraiser uses a cost ratio study that compares recent
sales prices of properties appropriately adjusted for the effects of time within a delineated
neighborhood with the properties’ actual cost value. The calculated ratio derived from the sum
of the sold properties’ cost value divided by the sum of the sales prices indicates the
neighborhood level of value based on the unadjusted cost value for the sold properties. This
cost-to-sale ratio is compared to the appraisal-to-sale ratio to determine the market adjustment
factor for each neighborhood. This market adjustment factor is needed to trend the values
obtained through the cost approach closer to the actual market evidenced by recent sales prices
within a given neighborhood. The sales used to determine the market adjustment factor will
reflect the market influences and conditions only for the specified neighborhood, thus producing
- 21 -
more representative and supportable values. The market adjustment factor calculated for each
updated neighborhood is applied uniformly to all properties within a neighborhood.
Monthly time adjustments were developed using the matched sales analysis method. For each
school district, sales-to-appraisal ratios based on unadjusted cost values were stratified on a
quarterly basis. Statistics produced from the quarterly market data include measures of central
tendency (mean and median) that represent the level of appraised values, and measures of
uniformity (coefficient of dispersion and coefficient of variation) that represent the consistency of
appraised values within and between strata. The resulting quarterly medians were graphically
plotted for examination and analysis. A yearly time adjustment for each market area sample
was produced. Analysis was then performed on each school district sample to determine the
appropriate yearly time adjustment to be employed, or if a time adjustment was even warranted.
Once the market areas yearly time adjustment was determined, a monthly time adjustment was
calculated. For this year, no time adjustment was warranted.
Once the market-trend factors are applied, a second set of ratio studies is generated that
compares recent sale prices with the proposed appraised values for these sold properties.
From this set of ratio studies, the appraiser judges the appraisal level and uniformity in both
updated and non-updated neighborhoods, and finally, for the school district as a whole.
5.4 Treatment of Residence Homesteads
Beginning in 1998, the State of Texas implemented a constitutional classification scheme
concerning the appraisal of residential property that receives a residence homestead
exemption. Under the new law, beginning in the second year a property receives a homestead
exemption; increases in the value of that property are "capped." The value for tax purposes of a
qualified residence homestead will be the LESSER of:
the market value; or
the preceding year's appraised value;
PLUS 10 percent;
PLUS the value of any improvements added since the last re-appraisal.
Values of capped properties must be recomputed annually. If a capped property sells, the cap
automatically expires as of January 1st of the following year. In that following year, that home is
reappraised at its market value to bring its appraisal into uniformity with other properties. An
analogous provision applies to new homes. While a developer owns them, unoccupied
residences are appraised as part of an inventory using the CAD’s land value and the
- 22 -
developer’s construction costs as of the valuation date. However, in the year following sale,
they are reappraised at market value.
In 2009, the Tax Code was changed to address valuation of residential homestead properties.
Section 23.01(c) states that: “Notwithstanding section 1.04(7)(c), in determining the market
value of a residence homestead, the chief appraiser may not exclude from consideration the
value of other residential property that is in the same neighborhood as the residence homestead
being appraised and would otherwise be considered in appraising the residence homestead
because the other residential property:
(1) was sold at a foreclosure sale conducted in any of the three years preceding
the tax year in which the residence homestead is being appraised and was comparable at the
time of sale based on relevant characteristics with other residence homesteads in the same
neighborhood; or
(2) has a market value that has declined because of a declining economy.
The market value of a residence homestead shall be determined solely on the basis of the
property’s value as a residence homestead, regardless of whether the residential use of the
property by the owner is considered to be the highest and best use of the property”.
5.5 Individual Value Review Procedures
5.5.1 Field Review
The appraiser identifies individual properties in critical need of field review through sales ratio
analysis. Sold properties with a high variance in sales ratios are field reviewed on a regular
basis to check for accuracy of data characteristics.
As the CAD's parcel count has increased through new home construction, and the homes
constructed in years of the late 70's and early 80's experience remodeling, the appraisers are
required to perform the field activity associated with transitioning and high demand
neighborhoods. Increased sales activity has also resulted in a more substantial field effort on
the part of the appraisers to review and resolve sales outliers. Additionally, the appraiser
frequently field reviews subjective data items such as quality of construction, condition, and
physical, functional and economic obsolescence, factors significantly affecting the market value
of the property. After preliminary estimates of value have been determined in targeted areas,
the appraiser takes valuation documents to the field to test the computer-assisted values
against his own appraisal judgment. During this review, the appraiser is able to physically
inspect both sold properties and unsold properties for comparability and consistency of values.

- 23 -
5.5.2 Office Review
Given the ample resources and time required to conduct a routine field review of all properties,
homogeneous properties consisting of tract housing with a low variance in sales ratios and other
properties having a recent field inspection date are value reviewed in the office. Valuation
reports comparing previous values against proposed and final values are generated for all
residential improved and vacant properties. The dollar amount and percentage of value
difference are noted for each property within a delineated neighborhood allowing the appraiser
to identify, research and resolve value anomalies before final appraised values are released.
Previous values resulting from a protest hearing are individually reviewed to determine if the
value remains appropriate for the current year.
Using Pictometry (aerial photography software) allows the staff to view properties and compare
them with the appraisal records. If there is no significant change between the record and the
aerial view, then staff will indicate that the property was reviewed and not changed. If there is a
significant change between the record and the aerial view, then staff will either make the
changes in office and indicate that the property was changed in-house or the staff will indicate
that a field check is required. This depends upon the circumstances of each account and is on a
case by case basis.
Once the appraiser is satisfied with the level and uniformity of value for each neighborhood
within their area of responsibility, the estimates of value are released for Notices of Appraised
Value.
5.6 Performance Tests
5.6.1 Sales Ratio Studies
The primary analytical tool used by the appraisers to measure and improve performance is the
ratio study. The CAD ensures that the appraised values that it produces meet the standards of
accuracy in several ways. Overall sales ratios are generated for each ISD by quarter to allow
the appraiser to review general market trends within their area of responsibility, and provide an
indication of market appreciation over a specified period of time. The neighborhood descriptive
statistic, along with frequency distributions and scatter diagrams are reviewed for each
neighborhood being updated for the current tax year. In addition to the mainframe sales ratios
by school district and neighborhood, quarterly sales ratios are generated from a PC-based
statistical application in PACS. Reported in the sales ratio statistics for each school district is a
level of appraisal value and uniformity profile by land use, sales trends by quarter and 12 month
time frame, and appraisal value ranges. The PC-based ratio studies are designed to emulate
- 24 -
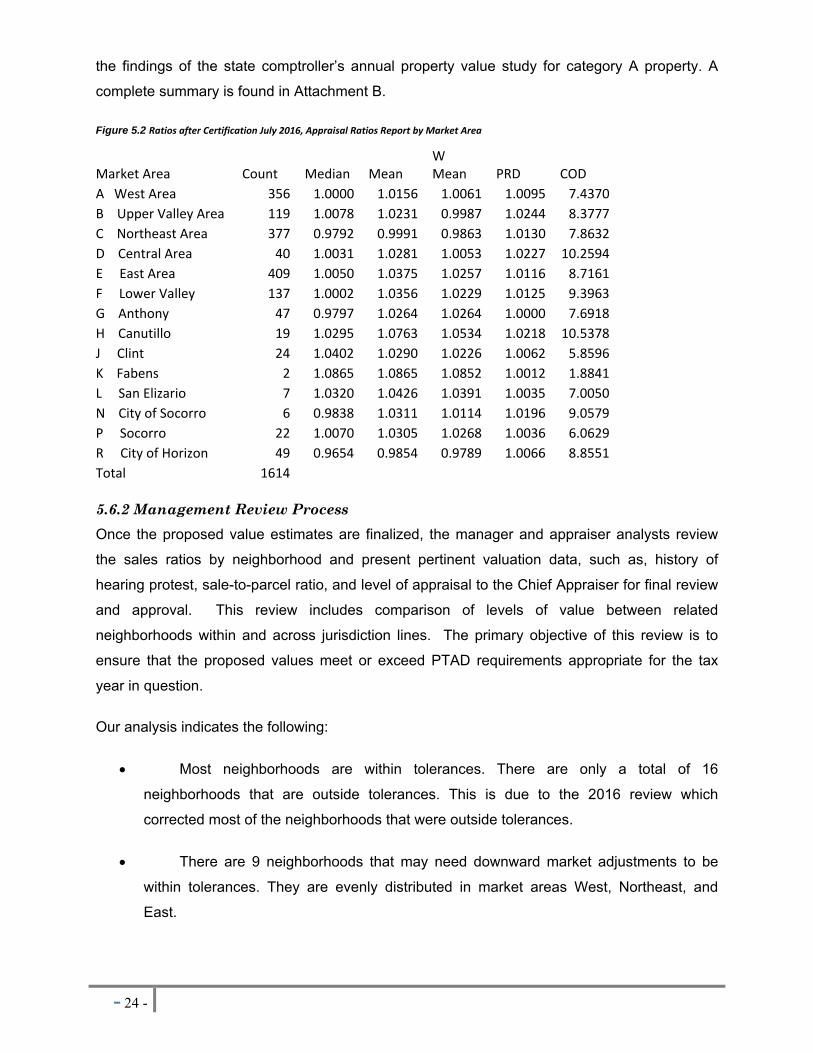
the findings of the state comptroller’s annual property value study for category A property. A
complete summary is found in Attachment B.
Figure 5.2 Ratios after Certification July 2016, Appraisal Ratios Report by Market Area
Market Area Count Median Mean W Mean PRD COD
A West Area 356 1.0000 1.0156 1.0061 1.0095 7.4370
B Upper Valley Area 119 1.0078 1.0231 0.9987 1.0244 8.3777
C Northeast Area 377 0.9792 0.9991 0.9863 1.0130 7.8632
D Central Area 40 1.0031 1.0281 1.0053 1.0227 10.2594
E East Area 409 1.0050 1.0375 1.0257 1.0116 8.7161
F Lower Valley 137 1.0002 1.0356 1.0229 1.0125 9.3963
G Anthony 47 0.9797 1.0264 1.0264 1.0000 7.6918
H Canutillo 19 1.0295 1.0763 1.0534 1.0218 10.5378
J Clint 24 1.0402 1.0290 1.0226 1.0062 5.8596
K Fabens 2 1.0865 1.0865 1.0852 1.0012 1.8841
L San Elizario 7 1.0320 1.0426 1.0391 1.0035 7.0050
N City of Socorro 6 0.9838 1.0311 1.0114 1.0196 9.0579
P Socorro 22 1.0070 1.0305 1.0268 1.0036 6.0629
R City of Horizon 49 0.9654 0.9854 0.9789 1.0066 8.8551
Total 1614
5.6.2 Management Review Process
Once the proposed value estimates are finalized, the manager and appraiser analysts review
the sales ratios by neighborhood and present pertinent valuation data, such as, history of
hearing protest, sale-to-parcel ratio, and level of appraisal to the Chief Appraiser for final review
and approval. This review includes comparison of levels of value between related
neighborhoods within and across jurisdiction lines. The primary objective of this review is to
ensure that the proposed values meet or exceed PTAD requirements appropriate for the tax
year in question.
Our analysis indicates the following:
Most neighborhoods are within tolerances. There are only a total of 16
neighborhoods that are outside tolerances. This is due to the 2016 review which
corrected most of the neighborhoods that were outside tolerances.
There are 9 neighborhoods that may need downward market adjustments to be
within tolerances. They are evenly distributed in market areas West, Northeast, and
East.
- 25 -
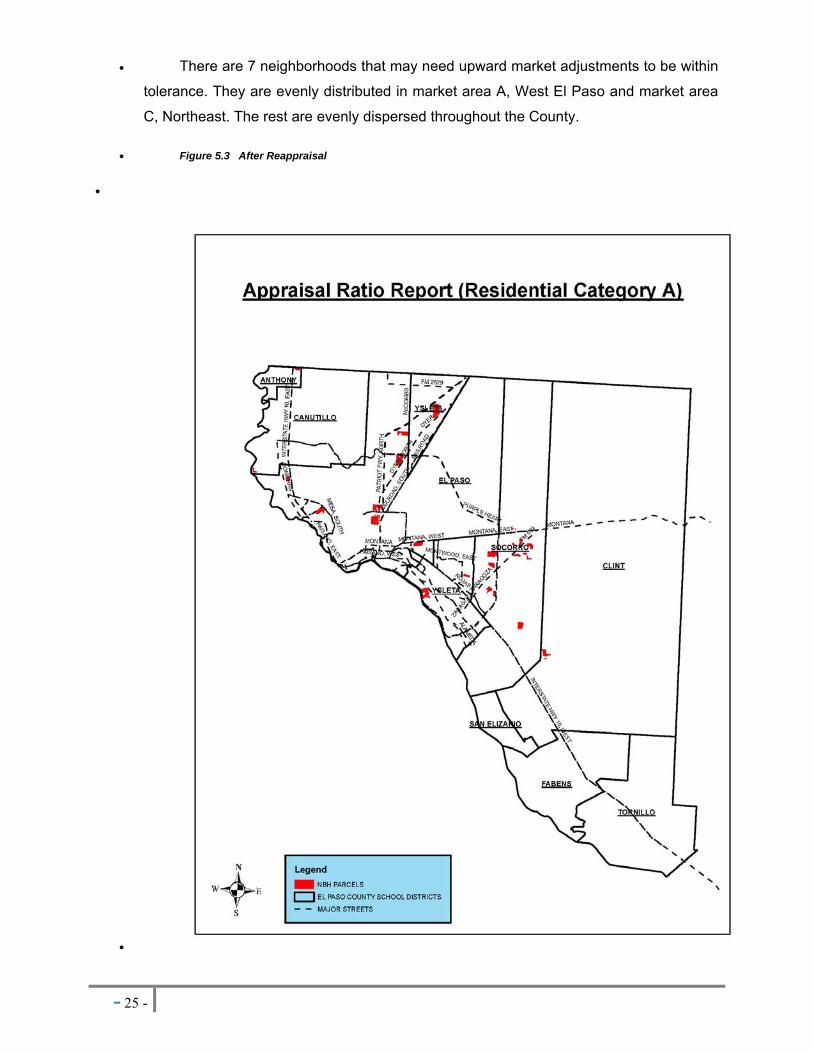
There are 7 neighborhoods that may need upward market adjustments to be within
tolerance. They are evenly distributed in market area A, West El Paso and market area
C, Northeast. The rest are evenly dispersed throughout the County.
Figure 5.3 After Reappraisal
- 26 -
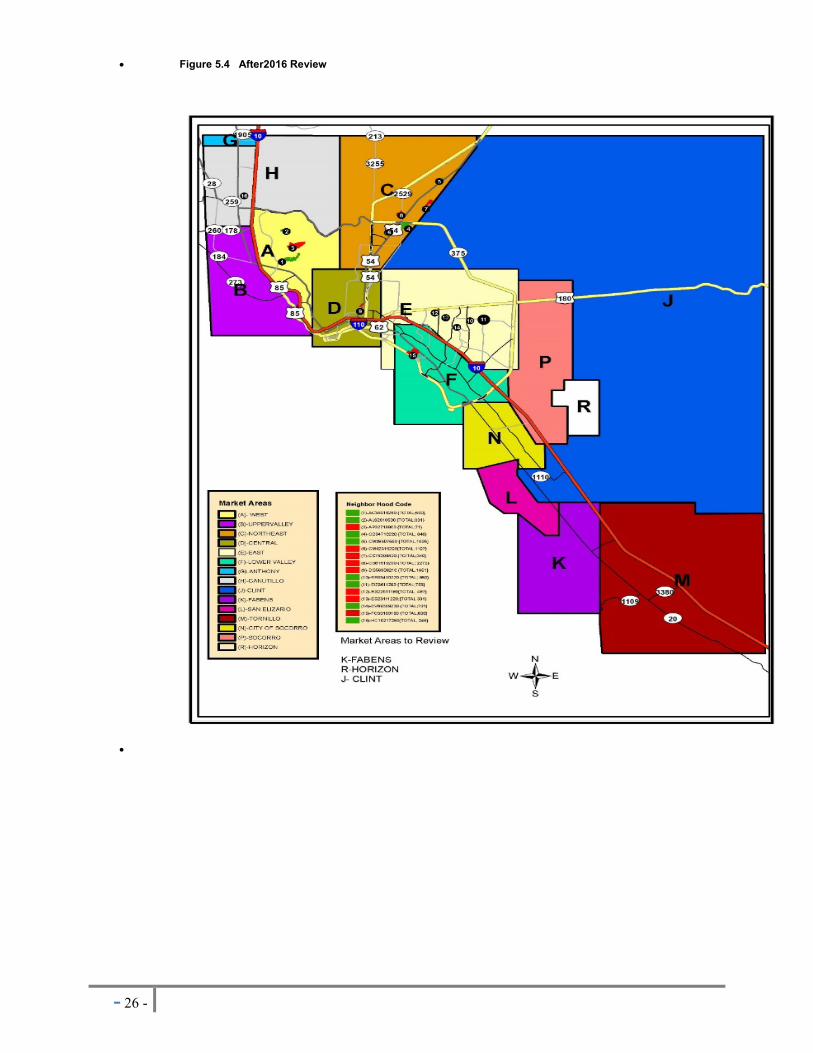
Figure 5.4 After2016 Review
- 27 -
6.0 COMMERCIAL VALUATION PROCESS 6.1 Introduction
6.1.1 Appraisal Responsibility
This mass appraisal assignment includes all of the commercially classed real property which
falls within the responsibility of the commercial valuation appraisers of the El Paso Central
Appraisal District and located within the boundaries of this taxing jurisdiction. The Commercial
appraisers are responsible for developing equal and uniform market values for commercial real
and vacant property accounts. There are approximately 28,596 such accounts in El Paso
County.
The CAD’s appraisal roll displays and identifies each parcel of real property individually.
Commercial appraisers appraise the fee simple interest of properties according to statute.
However, the effect of easements, restrictions, encumbrances, leases, contracts or special
assessments are considered on an individual basis, as is the appraisal of any non-exempt
taxable fractional interests in real property (i.e. certain multi-family housing projects). Fractional
interests or partial holdings of real property are appraised as fee simple for the whole property
and divided programmatically, whenever possible, based on their prorated interests. Otherwise,
separate accounts are created with values reflecting the fractional interest.
6.1.2 Appraisal Resources
Personnel - The Commercial appraisal staff consists of thirteen (13) appraisers.
Data - A common set of data characteristics for each commercial property in El
Paso County is collected in the field and data entered to the computer.
The improved real property appraisal responsibilities are categorized according to major
property types of multi-family or apartment, office, retail, warehouse, light industrial and special
use (i.e. hotels, hospitals and, nursing homes). The commercial appraisal staff is multi-task
oriented as certain appraisers have multiple responsibilities. Eleven appraisers are assigned to
improved commercial property types. One appraiser is assigned to the land valuation
responsibilities. Model building and testing is the responsibility of the statistical analyst.
However, staff appraisers are responsible for analyzing apartment complexes. Statistical
analysts are supervised by the Director of Appraisal Services.
Data - The data used by the commercial appraiser includes verified sales of vacant land and
improved properties and the pertinent data obtained from each (sales price levels, capitalization
rates, income multipliers, equity dividend rates, marketing period, etc.). Other data used by the
- 28 -
appraiser includes actual income and expense data (typically obtained through the appeals
process), actual contract rental data, leasing information (commissions, tenant finish, length of
terms, etc.), and actual construction cost data. In addition to the actual data obtained from
specific properties, market data publications are also reviewed to provide additional support for
market trends. Pictometry has become an important data collection tool that allows the
commercial appraiser to verify measurements and identify physical characteristics of individual
parcels.
6.2 Preliminary Analysis
6.2.1 Pilot Study
Pilot studies are used to test new or existing procedures or valuation modifications in a limited
area (a sample of properties) of the CAD and are also considered whenever substantial
changes are made. These studies, which could include ratio studies where there is sufficient
data, reveal whether the system is producing accurate and reliable values or whether
procedural modifications are required. The statistical analyst uses this methodology when
developing both the cost approach and income approach models.
Survey of Similar Jurisdictions: El Paso CAD coordinates its discovery and valuation activities
with similar appraisal districts. Numerous field trips, interviews and data exchanges with similar
appraisal districts have been conducted to ensure compliance with state statues. In addition,
the CAD administration and personnel interact with other assessment officials through
professional trade organizations including the IAAO, TAAD and its subchapter Texas
Metropolitan Association of Appraisal Districts and TAAO.
6.3 Valuation Approach (Model Specification)
6.3.1 Area Analysis
Data on regional economic forces such as demographic patterns, regional locational factors,
employment and income patterns, general trends in real property prices and rents, interest rate
trends, availability of vacant land, and construction trends and costs are collected from private
vendors and public sources and continuing education in the form of courses.
6.3.2 Neighborhood Analysis
A neighborhood is a geographical area which is defined by physical, economic, political and
social boundaries. Analysis of neighborhoods involves identifying properties that are similarly
- 29 -
affected by these factors. Along with proper classification of properties, this process furthers the
goal of appraisal uniformity and equity in mass appraisal models.
Neighborhood analysis involves the examination of how physical, economic, governmental and
social forces and other influences affect property values. The effects of these forces are also
used to identify, classify, and organize comparable properties into smaller, manageable subsets
of the universe of properties known as neighborhoods.
6.3.3 Highest and Best Use Analysis
The highest and best use if the most reasonable and probable use that generates the highest
value of the real estate as of the date of valuation. The highest and best use of any given
property must be physically possible, legally permissible, financially feasible, and derives
maximum production. For improved properties, highest and best use is evaluated as improved
and as if the site were still vacant. This assists in determining if the existing improvements have
a transitional use, interim use, nonconforming use, multiple uses, speculative use, excess land,
or a different optimum use if the site were vacant. All land unless specified by the code is as if
vacant. For vacant tracts of land within this jurisdiction, the highest and best use is considered
speculative based on the surrounding land uses. Improved properties reflect a wide variety of
highest and best uses which include, but are not limited to: office, retail, multifamily, industrial,
special purpose or interim use. In many instances, the property's current use is the same as its
highest and best use. This analysis ensures that an accurate estimate of market value is
derived.
6.3.4 Market Analysis
A market analysis relates directly to market forces affecting supply and demand. This study
involves the relationships between social, economic, environmental, governmental, and site
conditions. Current market activity including sales of commercial properties, new construction,
new leases, lease rates, absorption rates, vacancies, allowable expenses (inclusive of
replacement reserves), expense ratio trends, and capitalization rate studies are analyzed.
6.4 Data Collection / Validation
6.4.1 Data Collection Manuals
The primary manual pertinent to data collection and documentation is the Commercial
Department Appraisal Manual. This manual is continually updated, providing a uniform system
of itemizing the multitude of components comprising improved properties. All properties located
in the CAD’s inventory are coded according to this manual and the approaches to value are
- 30 -
structured and calibrated based on this coding system. The listing manual is reviewed annually.
Data validation is done annually, prior to the equity phase and after the sales have been
researched, verified, keyed into the database, and quality control has been completed. The
confirmed sales reports are digital files that categorize the sales by property and use type, and
sort the data by location and chronological order. Income data is also stored in digital files.
These files are available to the public for use during hearings, and are also used by the CAD
appraisers during the hearings process. Data is available to the public as a paper copy upon
request.
6.4.2 Sources of Data
In terms of commercial sales data, the CAD receives a copy of the deeds recorded in El Paso
County that convey commercially classed properties. The deeds involving a change in
commercial ownership are entered into the sales information system and researched in an
attempt to obtain the pertinent sale information. Other sources of sale data include the hearings
process and local, regional and national real estate and financial publications.
For those properties involved in a transfer of commercial ownership, a sale file is produced
which begins the research and verification process. The initial step in sales verification involves
a computer-generated questionnaire, which is mailed to both parties in the transaction (Grantor
and Grantee). If a questionnaire is not returned within thirty days a second questionnaire is
mailed. If a questionnaire is answered and returned, the documented responses are recorded
into the computerized sales database system. If no information is provided, verification is then
attempted via phone calls to both parties. If the sales information is still not obtained, other
sources are contacted such as the brokers involved in the sale, property managers or
commercial vendors. In other instances sales verification is obtained from local appraisers or
others that may have the desired information. Finally, closing statements are often provided
during the hearings process. The actual closing statement is the most reliable and preferred
method of sales verification.
6.5 Valuation Analysis (Model Calibration)
Model calibration involves the process of periodically adjusting the mass appraisal formulas,
tables and schedules to reflect current local market conditions. Once the models have
undergone the specification process, adjustments can be made to reflect new construction
procedures, materials and/or costs, which can vary from year to year. The basic structure of a
mass appraisal model can be valid over an extended period of time, with trending factors
utilized for updating the data to the current market conditions. However, at some point, if the
- 31 -
adjustment process becomes too involved, the model calibration technique can mandate new
model specifications or a revised model structure.
6.5.1 Cost Schedules
The cost approach to value is applied to all improved real property utilizing the comparative unit
method. This methodology involves the utilization of national cost data reporting services as
well as actual cost information on comparable properties whenever possible. Cost models are
typically developed based on the Marshall Swift Valuation Service. Cost models include the
derivation of replacement cost new (RCN) of all improvements. These include comparative
base rates, per unit adjustments and lump sum adjustments. This approach also employs the
sales comparison approach in the valuation of the underlying land value. Time and location
modifiers are necessary to adjust cost data to reflect conditions in a specific market and
changes in costs over a period of time. Because a national cost service is used as a basis for
the cost models, locational modifiers are necessary to adjust these base costs specifically for El
Paso County. The national cost service provides these modifiers.
Depreciation schedules are developed based on what is typical for each property type at that
specific age. Depreciation schedules have been implemented for what is typical of each major
class of commercial property by economic life categories. Schedules have been developed for
improvements with 20, 25, 30, 35, 40, 45, 50, 55, 60, 65, and 70 year expected life. These
schedules are then tested to ensure they are reflective of current market conditions. The actual
and effective ages of improvements are noted in CAMA. Effective age estimates are based on
the utility of the improvements relative to where the improvement lies on the scale of its total
economic life and its competitive position in the marketplace. Effective age estimates are based
on quality of construction, types of amenities, and quality of maintenance.
Market adjustment factors such as external and/or functional obsolescence can be applied if
warranted. A depreciation calculation override can be used if the condition or effective age of a
property varies from the norm by appropriately noting the physical condition and functional utility
ratings on the property data characteristics. These adjustments are typically applied to a
specific property type or location and can be developed via ratio studies or other market
analyses. Accuracy in the development of the cost schedules, condition ratings and
depreciation schedules will usually minimize the necessity of this type of an adjustment factor.
6.5.2 Income Models
The income approach to value is applied to those real properties typically considered by market
participants as income-producing and for which the income approach is considered the leading
- 32 -
value indicator. Typically, commercial properties will be analyzed under 6.3.2 and 6.3.3 prior to
application of income models.
The income approach requires analysis of income data from property owners and market
comparables to arrive at an appropriate rent, vacancy, and expense ratio for use in the following
formula:
Net Operating Income = (Potential Gross Rent - Vacancy Allowance) X (1-Expense Ratio)
The NOI is then applied in the formula:
Value = NOI / Cap Rate
There are several methods for deriving cap rates and each involves in-depth analysis of the
market and its participants. The CAD contracted an MAI appraiser to conduct analysis of
pertinent commercial cap rates for tax year 2016. The cap rates applied to the income models
were within the limits of the analysis.
6.5.3 Sales Comparison (Market) Approach
Although all three of the approaches to value are based on market data, the sales comparison
approach is most frequently referred to as the market approach. This approach is utilized not
only for estimating land value but also in comparing sales of similarly improved properties to
each parcel on the appraisal roll. As previously discussed in the data collection/validation
section of this report, pertinent data from actual sales of properties, both vacant and improved,
is pursued throughout the year in order to obtain relevant information which can be used in all
aspects of valuation. Sales of similarly improved properties can provide a basis for the
depreciation schedules in the cost approach, rates and multipliers used in the income approach,
and as a direct comparison in the sales comparison approach. Improved sales are also used in
ratio studies, which afford the appraiser an excellent means of judging the present level and
uniformity of the appraised values.
For improved commercial properties, the most common approaches used are the income
approach and the cost approach due to a limited pool of sales data. However, the commercial
land tables are built from sales. Neighborhood, zoning, size, frontage, and influence are some
delineating factors. Paired sales analysis is used in deriving any time adjustments.
- 33 -
6.5.4 Final Valuation Schedules
Based on the market data analysis and review discussed previously in the cost, income and
sales approaches, the cost and income models are calibrated and finalized. The calibration
results are keyed to the schedules and models on the mainframe CAMA system for utilization
on all commercial properties in the CAD. The schedules and models are summarized in the
Commercial Department Appraisal Manual. This manual is provided to appraisers and is made
available to the public in an easy to understand format.
6.5.5 Statistical Analysis
Statistical analysis of final values is an essential component of quality control. This
methodology represents a comparison of the final value against the standard and provides a
concise measurement of the appraisal performance. Statistical comparisons of many different
standards are used including sales of similar properties, where available, the previous year’s
appraised value, audit trails, value change analysis and sales ratio analysis.
Appraisal statistics of central tendency and dispersion generated from sales ratios are available
for most property types. The summary statistics provide the appraisers or statistical analyst a
tool by which to determine both the level and uniformity of appraised value of a particular
property type. The level of appraised values can be determined by the median/weighted mean
for individual properties within a specific type, and a comparison of median/ weighted means
can reflect the general level of appraised value. Review of the standard deviation and the
coefficient of variation can discern appraisal uniformity within a specific property type.
Potential gross rent estimates, occupancy levels, secondary income, allowable expenses
(inclusive of non-recoverable expenses and replacement reserves), net operating income and
capitalization rate and multipliers are continuously reviewed utilizing frequency distribution
methods or other statistical procedures or measures. Income model conclusions are compared
to actual information obtained on individual commercial properties during the hearings process
as well as information from published sources and area vendors.
6.6 Individual Value Review Procedures
6.6.1 Field Review
The date of last inspection, extent of that inspection, and the commercial CAD appraiser
responsible are listed in the CAMA system. A field review may include a review using
- 34 -
Pictometry. If a property owner disputes the CAD's records concerning this data in a protest
hearing, CAMA may be altered based on the credibility of the evidence provided. Typically, a
new field check is then requested to verify this evidence for the current year's valuation or for
the next year's valuation. In addition, if a building permit is filed for a particular property
indicating a change in characteristics, that property is added to a work file. Finally, even though
every property cannot be inspected each year, each appraiser typically designates certain
segments of their area of responsibility to conduct field checks.
Commercial appraisers are somewhat limited in the time available to field review all commercial
properties of a specific use type. A major effort is made by appraisers to field review as many
properties as possible or economic areas experiencing large numbers of remodels, renovations,
or retrofits, changes in occupancy levels or rental rates, new leasing activity, new construction,
or wide variations in sale prices. Additionally, the appraisers frequently field review subjective
data items such as quality of construction and physical, functional and economic obsolescence
factors contributing significantly to the market value of the property. In some cases field reviews
are warranted when sharp changes in occupancy or rental rate levels occur between building
classes or between economic areas. With preliminary estimates of value in these targeted
areas, the appraisers test computer assisted values against their own appraisal judgment.
While in the field, the appraisers physically inspect sold and unsold properties for comparability
and consistency of values. Oblique and ortho photos via Pictometry are also used when
available.
6.6.2 Office Review
Office reviews are completed on properties not subject to field inspections and are performed in
compliance with the guidelines contained in the Commercial Department Appraisal Manual.
The Commercial Manual is updated annually.
Office reviews are typically limited by the data presented in final value reports. These reports
summarize the pertinent data of each property as well as comparing the previous values (two
year value history) to the proposed value conclusions of the various approaches to value.
These reports show proposed percentage value changes, income model attributes or overrides,
economic factor (cost overrides) and special factors affecting the property valuation such as
new construction status, prior year litigation and a three years sales history (USPAP property
history requirement for non-residential property).
The appraiser may review methodology for appropriateness to ascertain that it was completed
in accordance with USPAP or more stringent statutory and CAD policies. Previous values
- 35 -
resulting from protest hearings are individually reviewed to determine if the value remains
appropriate for the current year based on market conditions. Each appraiser's review is limited
to properties in their area of responsibility by property type (improved) or geographic area
(commercial vacant land).
Once the appraiser is satisfied with the level and uniformity of value for each commercial
property within their area of responsibility, the estimates of value go to noticing. Each parcel is
subjected to the value parameters appropriate for its use type. If one of the parcel’s component
values, land value, improvement value or total value exceeds the permissible change in value
range it fails the value edits. In this case, the parcel does not shift to noticing, but it is placed on
a rework list. Therefore, although the value estimates are determined in a computerized mass
appraisal environment, value edits and rework lists enable an individual parcel review of value
anomalies before the estimate of value is released for noticing.
6.7 Performance Tests
The appraisers utilize desktop applications such as MS ACCESS and EXCEL programs to
evaluate subsets of data by economic area or a specific and unique data item. On the desktop,
this may be customized and performed by building class and age basis.
6.7.1 Comparative Appraisal Analysis
The commercial appraiser performs an average unit value comparison. These studies are
performed on commercially classed properties by property use type (such as apartment, office,
retail and warehouse usage or special use). The objective to this evaluation is to determine
appraisal performance of sold and unsold properties. Appraisers average the unit sales
amounts and unit appraised values for the same parcels creating a comparison of average
value changes of sold and unsold properties, when available. These studies are conducted on
substrata such as building class and on properties located within various economic areas. In
this way overall appraisal performance is evaluated geographically by specific property type to
discern whether sold parcels have been selectively appraised. When sold parcels and unsold
parcels are appraised equally, the average unit values are similar. These horizontal equity
studies are performed prior to annual noticing.
- 36 -
7.0 INDUSTRIAL VALUATION PROCESS 7.1 Introduction
7.1.1 Appraisal Responsibility
The industrial appraisers and/or contract appraisers of the El Paso Central Appraisal District are
responsible for developing fair, uniform market values for industrial properties. The industrial
contract appraiser is also responsible for the valuation of all tangible general industrial business
personal property in El Paso County. There are approximately 249 parcels of industrial real
property and business personal property accounts in El Paso County of which approximately
280 are personal property.
Wardlaw Appraisal Group appraises approximately 660 parcels of industrial real and personal
properties and utilities. The Wardlaw Appraisal Group Mass Appraisal Report is included in
Attachment C.
7.1.2 Appraisal Resources
Personnel – The El Paso CAD contracts with the Wardlaw Appraisal Group. Appraisal
firm to value properties for which the CAD does not have the available personnel or
resources. See attached Mass Appraisal summary submitted by Wardlaw Appraisal
Group
Data – The contract appraisal staff inspects their assigned properties to obtain
information about buildings, site improvements, process and shop equipment, and
various items of business personal property. The individual characteristics of the
property being appraised are the primary factors that drive the appraised value.
7.2 Valuation Approach (Model Specification)
7.2.1 Area Analysis
See Attached Mass Appraisal Summary submitted by Wardlaw Appraisal Group. The scope
of market forces affecting industrial products and the capital goods used in the production
process tends to extend beyond regional considerations. The effects of information and
transportation technology are such that most industrial market forces are measured globally.
One exception to this general concept is the market for industrial land. The pricing of land tends
to be closely tied to possible alternative uses in the area. For this reason, appraisers assigned
to land valuation analyze market forces for specific areas and adjust land value schedules
appropriately.
- 37 -
7.2.2 Neighborhood Analysis
Neighborhood analysis of the type of properties valued by the industrial appraiser is not
meaningful. Industrial properties do not have the type of generic “sameness” that is appropriate
for neighborhood models.
7.2.3 Highest and Best Use Analysis
The highest and best use of real or business personal property is the most reasonable and
probable use of the property on the date of appraisal that is physically possible, financially
feasible, legally permissible, and that derives maximum production from the property. Usually,
the current use of the property is the highest and best use of that property. Industrial facilities
are most commonly located in areas that support industrial use. In areas where mixed use
does occur, the highest and best use of the property is examined by the appraiser to estimate
the effect of this factor.
7.2.4 Market Analysis
Market analysis is the basis for finalizing value estimates on properties for which the industrial
appraiser has responsibility. Even though many industrial properties are unique in nature, the
market for this type property is analyzed to see how the values of similar or similar as possible
properties are affected by market forces. Industrial properties, such as machine shops, have
many similar facilities that can be compared to the subject property in terms of type and size of
equipment, type of property fabricated or serviced at the subject facility, and other factors.
Those similarities help the appraiser estimate the value of the subject property. However, some
facilities, such as specialty chemical plants, are so unique in nature that the appraiser must use
the closest available plant in terms of output quantity, type of product manufactured, and other
factors to estimate the value of the subject property. Many industrial properties use the same
type of building and, depending on the type of business, may use the same type of
manufacturing or service equipment. However, the manner in which the entire business
operation is put together makes that particular facility unique. The CAD uses information from
similar businesses to examine the real and business personal property values at a particular
business, but the individual characteristics of the business being reviewed determine the value
estimation. Many of the buildings encountered at industrial facilities are generic in construction,
such as pre-engineered metal buildings. The cost per square foot to construct these type
structures can be used to estimate values at facilities that have similarly constructed buildings.
The building as constructed will have differences that must be taken into account when
estimating the final value of the property being reviewed.
- 38 -
A similar analysis is used for business personal property. Many items of business personal
property, such as furniture and fixtures, computers, and even machinery and equipment are
generic in construction, but individual characteristics that affect value, such as usage,
environment where used, and level of care will have an effect on the final value estimation.
When cost data for this type property is available and considered reliable, it is used for value
estimation purposes at other plant facilities. On-site inspection and information provided by the
property owner will affect the final value.
7.3 Data Collection/Validation
7.3.1 Data Collection Manuals
An extended range of variations may exist within the same class of industrial property, and there
are a multitude of property types within the industrial category. For this reason, effective data
collection procedures would be very difficult to organize in a single comprehensive manual.
Industrial business personal property also consists of many different classes of assets with a
wide range of variation within each class.
7.3.2 Sources of Data
The original real and business personal property data used by El Paso CAD was supplied to the
contract appraisers. Since that time, the contract appraisal personnel have updated that
information based on field review. As new facilities are built, the contract appraisal personnel
collect all the real and business personal property data necessary to value the property initially
and thereafter update the information when the property is again visited. The CAD receives
building permit information from the cities and from the county when a facility is being built
outside an incorporated city.
7.3.3 Data Collection Procedures
The contract appraisal personnel annually or periodically visit assigned plants. The frequency
of the visit is determined by the nature of the business conducted at each facility. For example,
refineries and chemical plants are continually changing or adding to processes to extract greater
efficiencies or make new products, but machine shops may not add or remove equipment over
a period two or more years.
The appraisers take with them the historical data on the buildings and site improvements and
the previous listing of business personal property at the facility being visited. Changes to the
existing structures and business personal property are noted and that information is used for
value estimation purposes. If cost information for the real or business personal property is
- 39 -
supplied later, the field data can be compared to that information to judge the accuracy of the
information.
7.4 Valuation Analysis (Model Calibration)
7.4.1 Final Valuation Schedules
See Mass Appraisal Summary submitted by Capitol Appraisal Group, Inc.
7.5 Individual Value Review Procedures
7.5.1 Field Review
The CAD’s personnel periodically review their assigned real and business personal property
accounts where there is evidence of change at a particular facility and when there is not, these
accounts are revisited on a two to three-year cycle. Certain properties are reviewed annually
because past experience shows that changes are occurring continually in the real or business
personal property at that facility. Properties assigned to contract appraisal firms are reviewed
annually because changes also occur regularly at these facilities.
The results of prior year hearings and indications of building permits being issued are another
source of required field visits. Many times during hearings, issues are presented that cause a
value adjustment. Those issues must be field checked to see if these influences will be on
going and warrant permanent value adjustment or are transitory and permanent adjustment is
not warranted. This information needs to be recorded so the appraiser will be better able to
estimate the property value. Building permits must be field checked to see what affect these
have on existing structures. Any new construction is noted and the information necessary to
value the structure is recorded. Additionally, any structure demolition is noted so the
improvement value can be adjusted accordingly.
Part of the field review includes noting any land characteristics that would affect the land value.
The CAD values all land for the properties within its jurisdiction, including those properties
assigned to contract appraisal firms. The contract appraisal firms must advise the CAD of any
characteristics that would affect the value of the land associated with that assigned facility.
7.5.2 Office Review
All properties not subjected to field review are reviewed in the office by the CAD appraiser
assigned to particular real or personal properties. The office review relies on historical
- 40 -
information in the real or business personal property file as the basis for deciding on the
estimated value to be placed on the property for the current tax year.
When valuing real property, the characteristics of the property being reviewed are the driving
force in value estimation. Experience in valuing other real property, such as comparable
properties at different locations, helps the appraiser decide the estimated value to be placed on
the subject improvements.
When valuing business personal property, the type of furniture, equipment, computers, etc., will
be used along with any cost data provided by the property owner to estimate the value.
Experience in valuing similar property at other facilities will help the appraiser estimate the value
of the subject facility. Individual characteristics of the property, such as usage and maintenance
will have a bearing on the value calculated by use of CAD schedules.
7.6 Performance Tests
7.6.1 Sales Ratio Studies
Ratio studies are an important tool to examine how close appraised values are to market
values. The ratio study may use available sales data or may use independent, expert
appraisals. Typically, there are not enough sales of industrial properties to show
representativeness of that class of property in a ratio study. Ratio studies of industrial
properties usually have to rely on independent appraisals as an indicator of market values.
7.6.2 Comparative Appraisal Analysis
This type of analysis is usually not done on industrial properties due to the unique nature of the
property and also because of time and budget constraints regarding available appraisal staff.
Only in an instance where a jurisdiction would file a jurisdiction challenge with the Appraisal
Review Board would the CAD perform such an analysis.
If a jurisdiction challenge is received by El Paso CAD on an industrial category of properties, the
contract appraisers assigned to those accounts will research the appraisal roll to see what other
similar properties exist. The real property values can be compared on an average value per
square foot of structure basis, but the differences from one facility to another must be carefully
compared because it is unlikely that two different facilities are going to build like improvements
and use them in similar ways. In like manner, the business personal property values can be
compared per category, such as furniture and fixtures, machinery and equipment, etc., but the
same comparison of the type of and use of the property must be examined to ensure proper
comparison.
- 41 -
8.0 BUSINESS PERSONAL PROPERTY
8.1 Introduction
8.1.1 Appraisal Responsibility
There are four different business personal property types appraised by the CAD’s
business personal property section: Business personal property accounts; Leased
Assets; Vehicles; and Multi-Location Assets. There are approximately 21,094 business
personal property accounts in El Paso County. The CAD has contracted with Wardlaw
Appraisal Group to appraise industrial L2 accounts (reported under Section 7) and the
CAD appraises the remaining accounts. In addition, CAD processes approximately 525
valuations on special inventories such as motor vehicle dealers’ inventory, heavy
equipment inventory, manufactured home dealer inventory and trailer and vessel dealer
inventory under category S and 46 tangible non-business vehicles.
8.1.2 Appraisal Resources
Personnel - The business personal property appraisal staff consists of eight (8)
appraisers, two (2) field specialists, three (3) support staff.
Data - A common set of data characteristics for each business personal property
account in El Paso County is collected in the field and data entered to the CAD’s
computer. The property characteristic data drives the computer-assisted business
personal property appraisal (CAPPA) system. The business personal property
appraisers collect the field data.
8.2 Valuation Approach (Model Specification)
8.2.1 SIC Code Analysis
Four digit numeric codes, called Standard Industrial Classification (SIC) codes that were
developed by the federal government are used by CAD as a way to classify business personal
property by business type uses.
SIC code identification and delineation is the cornerstone of the business personal property
valuation system at the CAD. All of the business personal property analysis work done in
association with the business personal property valuation process is SIC code specific. SIC
codes are delineated based on observable aspects of homogeneity. SIC code delineation is
periodically reviewed to determine if further SIC code delineation is warranted.
- 42 -
8.2.2 Highest and Best Use Analysis
The highest and best use of property is the reasonable and probable use that supports the
highest present value as of the date of the appraisal. The highest and best use must be is
physically possible, financially feasible, legally permissible, and that derives maximum
production from the property. The highest and best use of business personal property is
normally its current use.
8.3 Data Collection/Validation
8.3.1 Data Collection Procedures
Business personal property data collection procedures are published and distributed to all
appraisers involved in the appraisal and valuation of business personal property. The appraisal
procedures are reviewed and revised to meet the changing requirements of field data collection.
The business personal property data collection procedures are reviewed annually.
8.3.2 Sources of Data
8.3.2.1 Business personal property
The CAD’s property characteristic data is collected through a massive field data collection effort
coordinated by the CAD each year. When revaluation activities permit, CAD appraisers collect
new data via the annual field drive-out. This project results in the discovery of new businesses
not revealed through other sources. Various discovery publications such as The El Paso, Inc.
and city permits are also used to discover business personal property. Tax assessors, city and
local newspapers, and the public often provide the CAD information regarding new business
personal property and other useful facts related to property valuation.
8.3.2.2 Vehicles
The CAD obtains a listing of vehicles from the Texas Department of Transportation (TXDOT)
Title and Registration Division records. Other sources of data include property owner renditions
and field inspections.
8.3.2.3 Leased and Multi-Location Assets
The primary source of leased and multi-location assets is property owner renditions of property.
Other sources of data include field inspections.
- 43 -
8.4 Valuation and Statistical Analysis (Model Calibration)
8.4.1 Cost Schedules
Cost schedules are developed by SIC code by CAD business personal property valuation
appraisers. Cost schedules are developed by analyzing cost data from property owner
renditions, hearings, state schedules, and published cost guides. The cost schedules are
reviewed as necessary to conform to changing market conditions. The schedules are typically
in a price per square foot format, but some exception SIC codes are in an alternate price per
unit format, such as per room for hotels.
8.4.2 Statistical Analysis
Summary statistics including, but not limited to, the median, weighted mean, and standard
deviation provide the appraisers with an analytical tool by which to determine both the level and
uniformity of appraised value by SIC code. Review of the standard deviation can discern
appraisal uniformity within SIC codes.
8.4.3 Depreciation Schedule and Trending Factors:
8.4.3.1 Business personal property
El Paso CAD’s primary approach to the valuation of business personal property is the cost
approach. The replacement cost new (RCN) is either developed from property owner reported
historical cost or from CAD developed valuation models. The trending factors used by the CAD
to develop RCN are based on published valuation guides. The percent good depreciation
factors used by the CAD are also based on published valuation guides and in conjunction with
other appraisal districts. The index factors and percent good depreciation factors are used to
develop present value factors (PVF), by year of acquisition, as follows:
PVF = INDEX FACTOR x PERCENT GOOD FACTOR
The PVF is used as an “express” calculation in the cost approach. The PVF is applied to
reported historical cost as follows:
MARKET VALUE ESTIMATE = PVF x HISTORICAL COST
This mass appraisal PVF schedule is used to ensure that estimated values are uniform and
consistent within the market.
- 44 -
8.4.4 Comptroller’s Field Appraiser’s Guide
This guide was developed by the Property Tax Division of the State Comptroller’s Office. It
consists of quality/density schedules and depreciation tables for specific SIC properties. These
schedules are adjusted to local conditions by the appraisal staff.
The Guide is used in the general business personal property valuation program to estimate the
value of new accounts for which no information has been provided at the time of field inspection
or when valuing a national chain business or a business not given as a comparable.
8.4.5 Vehicles
Value estimates for vehicles are based on NADA published book values or using PVF
schedules or published guides.
8.4.6 Leased and Multi-Location Assets
Leased and multi-location assets are valued using the PVF schedules mentioned above. If the
asset to be valued in this category is a vehicle, then NADA or Blue Book published book values
may be used in lieu of the PVF schedule. An appraiser using PVF schedules or published
guides values assets where cost is not listed by the vendor.
8.5 Individual Value Review Procedures
8.5.1 Office Review
8.5.1.1 Business Personal Property
A CAD valuation computer program exists in a mainframe environment that identifies accounts
in need of review based on a variety of conditions. Property owner renditions, accounts with
field or other data changes, accounts with prior hearings, new accounts, and SIC cost table
changes are all considered. The accounts are processed by the valuation program and pass or
fail preset tolerance parameters by comparing appraised values to prior year and model values.
The appraisers review accounts that fail the tolerance parameters.
8.5.1.2 Vehicles
A vehicle master file is received on tape from an outside vendor (TXDOT) and vehicles in the
CAD’s system are matched to current TXDOT records. The vehicles are sorted by owner name,
business name or location address and then matched to CAD business personal property
records. An appraiser uses PVF schedules or published guides to value vehicles that are not
listed on the TXDOT records.
- 45 -
8.5.1.3 Leased and Multi-Location Assets
Leasing and multi-location accounts that have a high volume of vehicles or other assets may be
loaded programmatically if reported by the property owner electronically, Electronic renditions,
often require reformatting before they can be loaded to the account. Accounts that render by
hard copy are entered by CAD staff.
8.6 Performance Tests
8.6.1 Ratio Studies
Every other year the Property Tax Assistance Division of the state comptroller’s office conducts
a property value study (PVS). The PVS is a ratio study used to gauge appraisal CAD
performance. Results from the PVS play a part in school funding. Rather than a sales ratio
study, the business personal property PVS is a ratio study using state cost and depreciation
schedules to develop comparative business personal property values. These values are then
compared to El Paso CAD’s business personal property values and ratios are formed.
8.6.2 Internal Testing
CAD can test new or revised cost and depreciation schedules by running the valuation program
in test mode prior to the valuation cycle. This can give appraisers a chance to make additional
refinements to the schedules if necessary.
- 46 -
9.0 LIMITING CONDITIONS The appraised value estimates provided by the CAD are subject to the following conditions:
1. The appraisals were prepared exclusively for ad valorem tax purposes.
2. The property characteristic data upon which the appraisals are based is assumed to be
correct. Exterior inspections of the property appraised were performed as staff resources
and time allowed.
3. Validation of sales transactions was attempted through questionnaires to buyer and seller,
telephone survey and field review. In the absence of such confirmation, residential and
commercial sales data obtained from vendors was considered reliable.
4. Attached is a list of staff providing significant mass appraisal assistance to the person
signing this certification.
5. Attached are the CAD’s latest ratio study results.
- 47 -
10.0 CERTIFICATION STATEMENT
"I, Dinah L. Kilgore, Chief Appraiser for the El Paso Central Appraisal District, solemnly swear
that I have made or caused to be made a diligent inquiry to ascertain all property in the CAD
subject to appraisal by me, and that I have included in the records all property that I am aware
of at an appraised value which, to the best of my knowledge and belief, was determined as
required by law.”
Dinah L. Kilgore, R.P.A.
Executive Director/Chief Appraiser
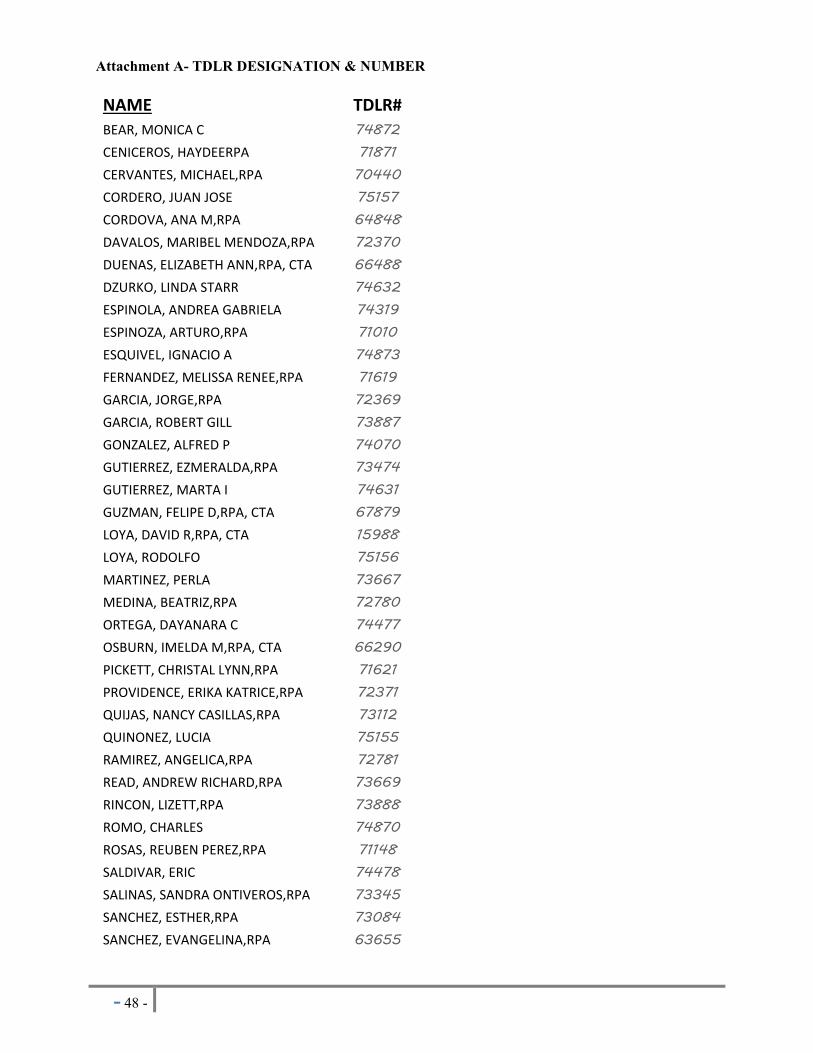
- 48 -
Attachment A- TDLR DESIGNATION & NUMBER
NAME TDLR#
BEAR, MONICA C 74872 CENICEROS, HAYDEERPA 71871 CERVANTES, MICHAEL,RPA 70440 CORDERO, JUAN JOSE 75157 CORDOVA, ANA M,RPA 64848 DAVALOS, MARIBEL MENDOZA,RPA 72370 DUENAS, ELIZABETH ANN,RPA, CTA 66488 DZURKO, LINDA STARR 74632 ESPINOLA, ANDREA GABRIELA 74319 ESPINOZA, ARTURO,RPA 71010 ESQUIVEL, IGNACIO A 74873 FERNANDEZ, MELISSA RENEE,RPA 71619 GARCIA, JORGE,RPA 72369 GARCIA, ROBERT GILL 73887 GONZALEZ, ALFRED P 74070 GUTIERREZ, EZMERALDA,RPA 73474 GUTIERREZ, MARTA I 74631 GUZMAN, FELIPE D,RPA, CTA 67879 LOYA, DAVID R,RPA, CTA 15988 LOYA, RODOLFO 75156 MARTINEZ, PERLA 73667 MEDINA, BEATRIZ,RPA 72780 ORTEGA, DAYANARA C 74477 OSBURN, IMELDA M,RPA, CTA 66290 PICKETT, CHRISTAL LYNN,RPA 71621 PROVIDENCE, ERIKA KATRICE,RPA 72371 QUIJAS, NANCY CASILLAS,RPA 73112 QUINONEZ, LUCIA 75155 RAMIREZ, ANGELICA,RPA 72781 READ, ANDREW RICHARD,RPA 73669 RINCON, LIZETT,RPA 73888 ROMO, CHARLES 74870 ROSAS, REUBEN PEREZ,RPA 71148 SALDIVAR, ERIC 74478 SALINAS, SANDRA ONTIVEROS,RPA 73345 SANCHEZ, ESTHER,RPA 73084 SANCHEZ, EVANGELINA,RPA 63655
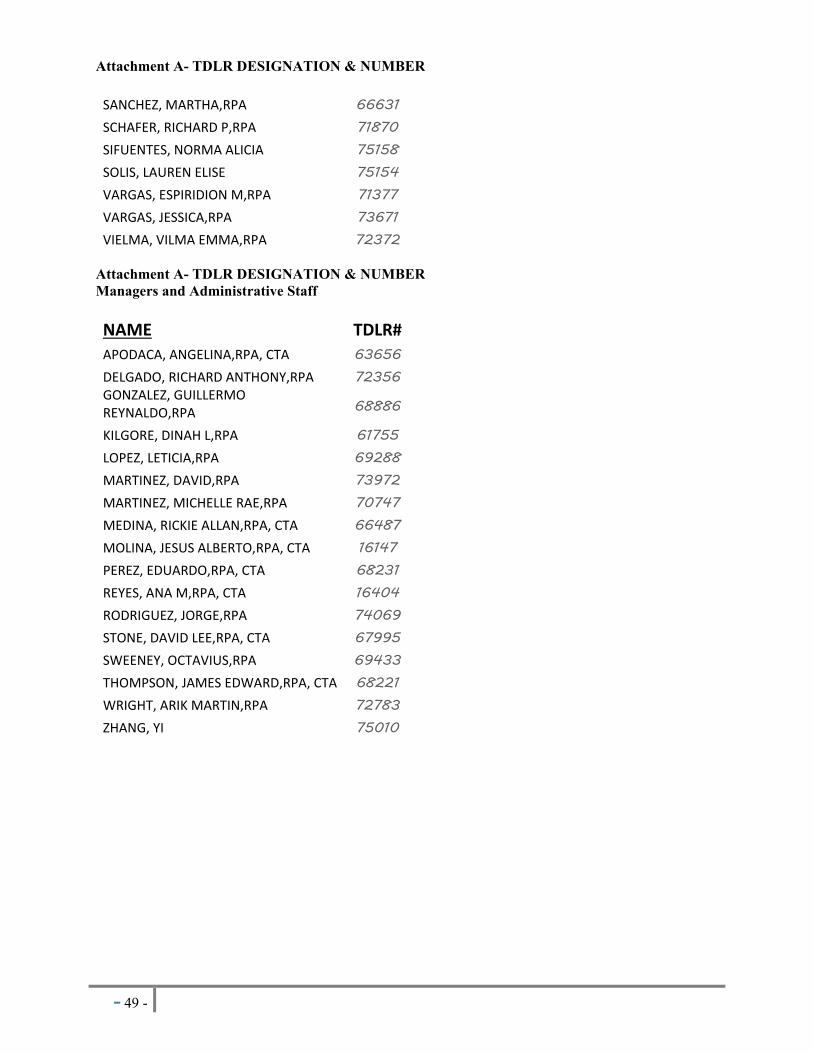
- 49 -
Attachment A- TDLR DESIGNATION & NUMBER
SANCHEZ, MARTHA,RPA 66631 SCHAFER, RICHARD P,RPA 71870 SIFUENTES, NORMA ALICIA 75158 SOLIS, LAUREN ELISE 75154 VARGAS, ESPIRIDION M,RPA 71377 VARGAS, JESSICA,RPA 73671 VIELMA, VILMA EMMA,RPA 72372
Attachment A- TDLR DESIGNATION & NUMBER Managers and Administrative Staff
NAME TDLR#
APODACA, ANGELINA,RPA, CTA 63656 DELGADO, RICHARD ANTHONY,RPA 72356 GONZALEZ, GUILLERMO REYNALDO,RPA 68886
KILGORE, DINAH L,RPA 61755 LOPEZ, LETICIA,RPA 69288 MARTINEZ, DAVID,RPA 73972 MARTINEZ, MICHELLE RAE,RPA 70747 MEDINA, RICKIE ALLAN,RPA, CTA 66487 MOLINA, JESUS ALBERTO,RPA, CTA 16147 PEREZ, EDUARDO,RPA, CTA 68231 REYES, ANA M,RPA, CTA 16404 RODRIGUEZ, JORGE,RPA 74069 STONE, DAVID LEE,RPA, CTA 67995 SWEENEY, OCTAVIUS,RPA 69433 THOMPSON, JAMES EDWARD,RPA, CTA 68221 WRIGHT, ARIK MARTIN,RPA 72783 ZHANG, YI 75010
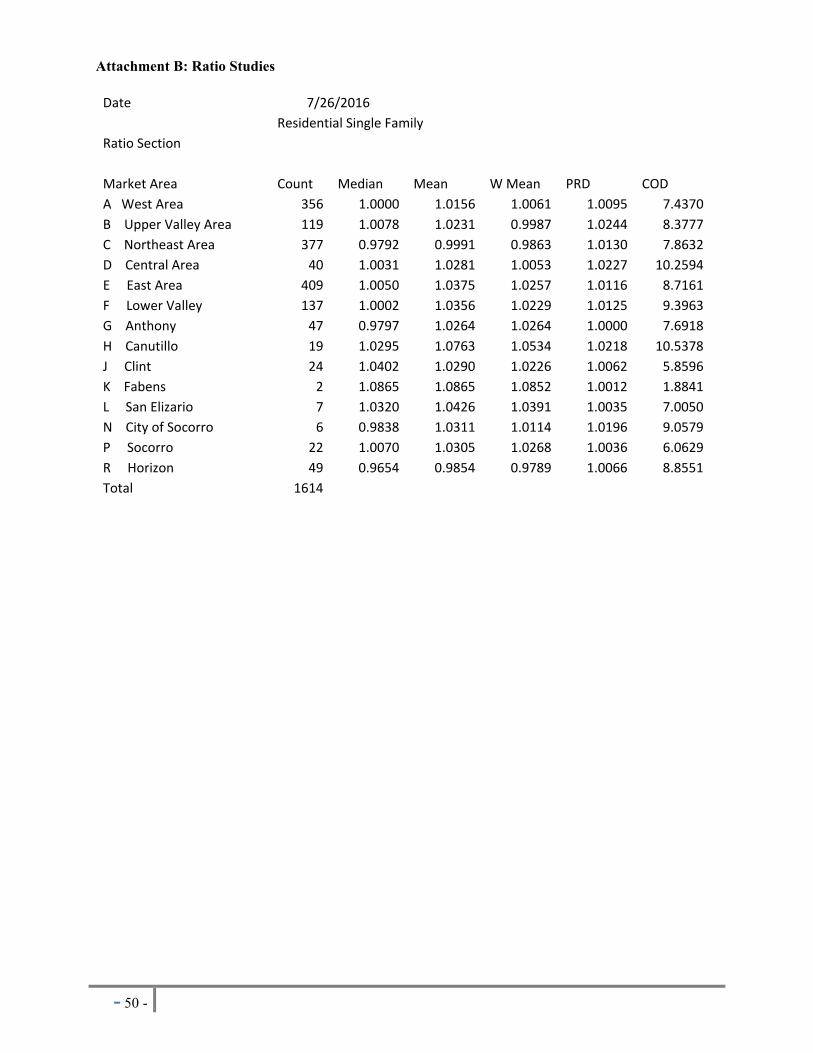
- 50 -
Attachment B: Ratio Studies Date 7/26/2016
Residential Single Family
Ratio Section
Market Area Count Median Mean W Mean PRD COD
A West Area 356 1.0000 1.0156 1.0061 1.0095 7.4370
B Upper Valley Area 119 1.0078 1.0231 0.9987 1.0244 8.3777
C Northeast Area 377 0.9792 0.9991 0.9863 1.0130 7.8632
D Central Area 40 1.0031 1.0281 1.0053 1.0227 10.2594
E East Area 409 1.0050 1.0375 1.0257 1.0116 8.7161
F Lower Valley 137 1.0002 1.0356 1.0229 1.0125 9.3963
G Anthony 47 0.9797 1.0264 1.0264 1.0000 7.6918
H Canutillo 19 1.0295 1.0763 1.0534 1.0218 10.5378
J Clint 24 1.0402 1.0290 1.0226 1.0062 5.8596
K Fabens 2 1.0865 1.0865 1.0852 1.0012 1.8841
L San Elizario 7 1.0320 1.0426 1.0391 1.0035 7.0050
N City of Socorro 6 0.9838 1.0311 1.0114 1.0196 9.0579
P Socorro 22 1.0070 1.0305 1.0268 1.0036 6.0629
R Horizon 49 0.9654 0.9854 0.9789 1.0066 8.8551
Total 1614
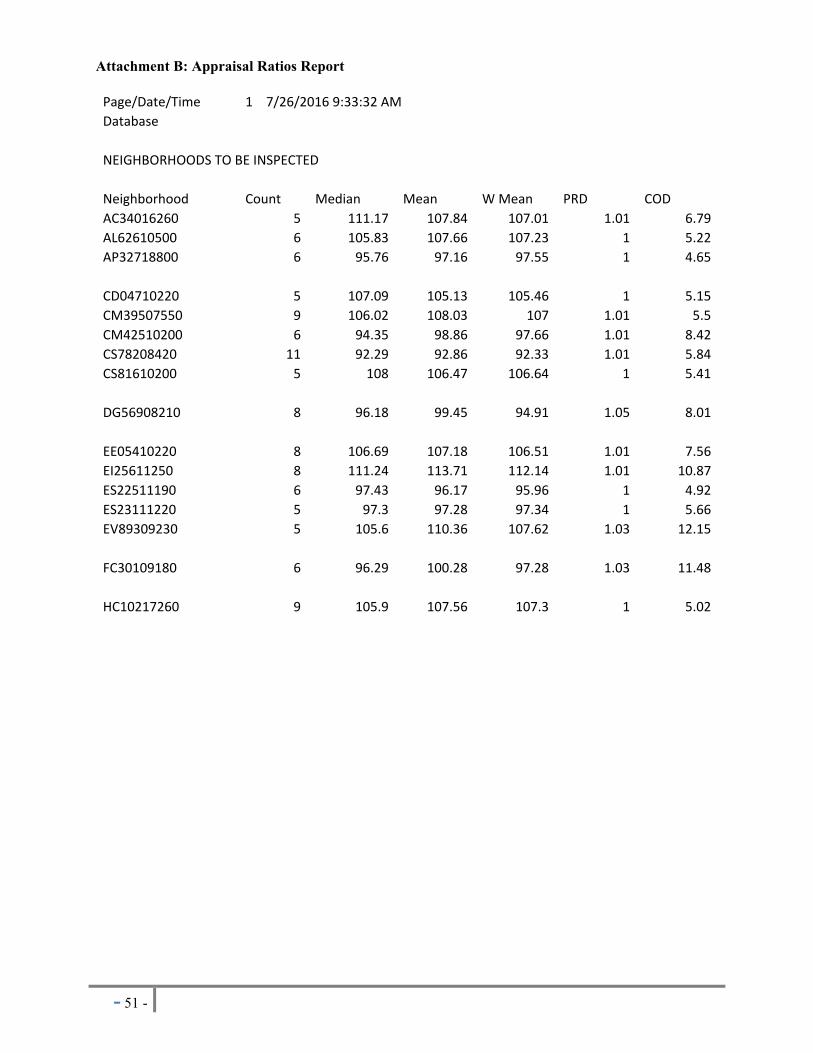
- 51 -
Attachment B: Appraisal Ratios Report Page/Date/Time 1 7/26/2016 9:33:32 AM
Database
NEIGHBORHOODS TO BE INSPECTED
Neighborhood Count Median Mean W Mean PRD COD
AC34016260 5 111.17 107.84 107.01 1.01 6.79
AL62610500 6 105.83 107.66 107.23 1 5.22
AP32718800 6 95.76 97.16 97.55 1 4.65
CD04710220 5 107.09 105.13 105.46 1 5.15
CM39507550 9 106.02 108.03 107 1.01 5.5
CM42510200 6 94.35 98.86 97.66 1.01 8.42
CS78208420 11 92.29 92.86 92.33 1.01 5.84
CS81610200 5 108 106.47 106.64 1 5.41
DG56908210 8 96.18 99.45 94.91 1.05 8.01
EE05410220 8 106.69 107.18 106.51 1.01 7.56
EI25611250 8 111.24 113.71 112.14 1.01 10.87
ES22511190 6 97.43 96.17 95.96 1 4.92
ES23111220 5 97.3 97.28 97.34 1 5.66
EV89309230 5 105.6 110.36 107.62 1.03 12.15
FC30109180 6 96.29 100.28 97.28 1.03 11.48
HC10217260 9 105.9 107.56 107.3 1 5.02

- 52 -
Attachment B: Ratio Studies Summaries SINGLE FAMILY IMPROVED PROPERTIES SALES DATES 01/01/2015 to 07/26/2016
COUNT MEDIAN AVG MEAN
WT MEAN PRD COD
ALL ISDs 1614 1.0000 1.0205 1.0076 1.0128 8.2770
ANTHONY ISD
ALL CLASSES 16 0.9788 1.0179 1.0230 0.9950 7.0187
CANUTILLO ISD
ALL 223 1.0119 1.0366 1.0250 1.0114 7.9175
CLINT ISD
ALL 70 0.9944 0.9930 0.9904 1.0026 7.8863
EL PASO ISD
ALL CLASSES 452 1.0000 1.0153 0.9987 1.0166 7.8720
FABENS ISD
ALL CLASSES 2 1.0865 1.0865 1.0852 1.0012 1.8841
SAN ELIZARIO ISD
ALL CLASSES 7 1.0320 1.0426 1.0391 1.0035 7.0050
SOCORRO ISD
ALL 253 1.0000 1.0245 1.0189 1.0055 7.2890
YSLETA ISD
ALL 591 0.9913 1.0196 1.0039 1.0156 9.1954
NOTE: INSUFFICIENT SALES OR NO SALES TORNILLO ISD
- 53 -
Attachment C
Wardlaw Appraisal Group, L.C.
Mineral, Utility, Industrial, & Personal Property
2016 Mass Appraisal Report
INTRODUCTION
Appraisal Responsibility Wardlaw Appraisal Group, L.C. (WAG) is a contract mass appraisal firm responsible for developing fair and uniform market values on certain complex properties for the El Paso Central Appraisal District in Texas. The complex properties we appraise include utility, industrial, and personal properties. The El Paso Central Appraisal District uses these property appraisals as part of the appraisal roll for each of the taxing jurisdictions The contract between WAG and El Paso Central Appraisal District specifies our appraisal responsibilities in support of that district. Generally, those responsibilities include discovering, inspecting, appraising, and maintaining ownership records of the specific properties that are the subject of the contract. The properties covered under our contract fall under the Texas Property Tax Code Categories J (utility),F1 (commercial real), F2 (industrial real), L1 (commercial personal) and L2 (industrial personal). El Paso Central Appraisal District contracts with WAG to provide these services because the district does not have the personnel or resources to perform the appraisal internally. Appraisal Resources
Personnel – WAG maintains a professional employee and consulting staff that are skilled and experienced in property tax appraisal, engineering, information technology, administration, and division order maintenance. The staff consists of eight (7) registered appraisers, three (3) of whom are Registered Professional Appraisers (RPA) and three (2) Registered Professional Engineers.(See Attachment)
Data – The appraisers inspect their assigned properties, if appropriate, to obtain
information about buildings, site improvements, process and shop equipment, and various items of personal property. In addition, appraisal personnel use information provided by property owners concerning the cost to purchase, install, and construct items of real and personal property.
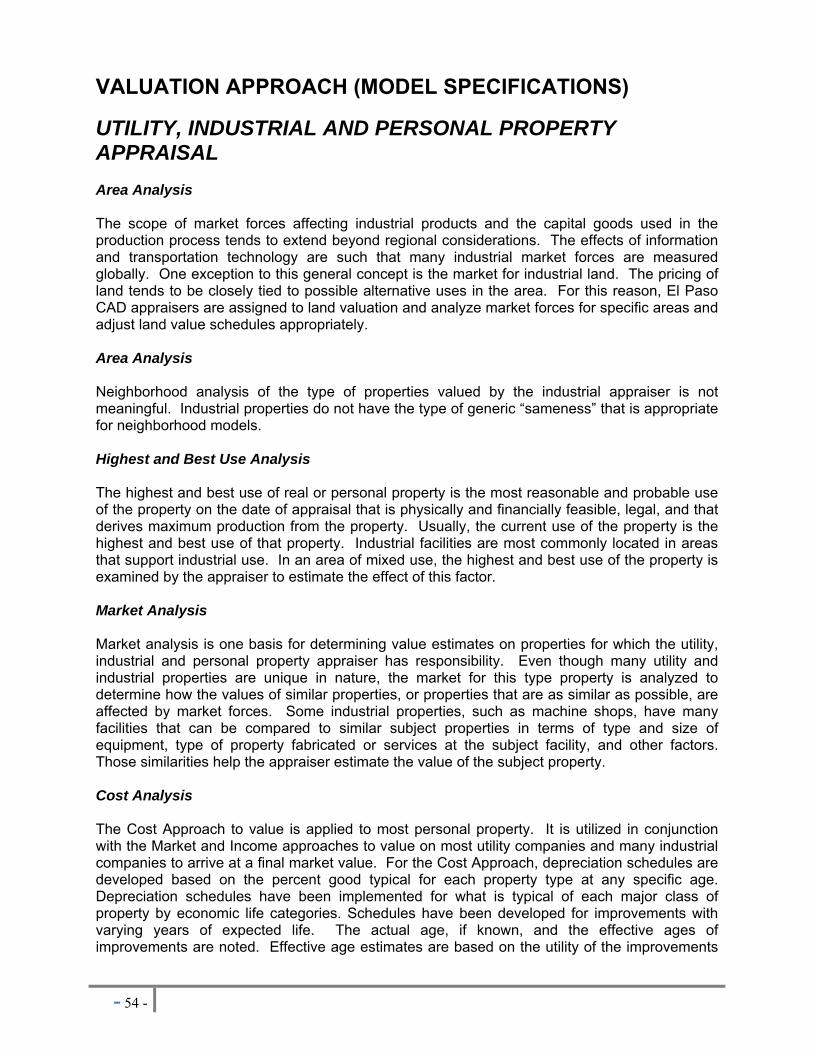
- 54 -
VALUATION APPROACH (MODEL SPECIFICATIONS)
UTILITY, INDUSTRIAL AND PERSONAL PROPERTY APPRAISAL Area Analysis The scope of market forces affecting industrial products and the capital goods used in the production process tends to extend beyond regional considerations. The effects of information and transportation technology are such that many industrial market forces are measured globally. One exception to this general concept is the market for industrial land. The pricing of land tends to be closely tied to possible alternative uses in the area. For this reason, El Paso CAD appraisers are assigned to land valuation and analyze market forces for specific areas and adjust land value schedules appropriately. Area Analysis Neighborhood analysis of the type of properties valued by the industrial appraiser is not meaningful. Industrial properties do not have the type of generic “sameness” that is appropriate for neighborhood models. Highest and Best Use Analysis The highest and best use of real or personal property is the most reasonable and probable use of the property on the date of appraisal that is physically and financially feasible, legal, and that derives maximum production from the property. Usually, the current use of the property is the highest and best use of that property. Industrial facilities are most commonly located in areas that support industrial use. In an area of mixed use, the highest and best use of the property is examined by the appraiser to estimate the effect of this factor. Market Analysis Market analysis is one basis for determining value estimates on properties for which the utility, industrial and personal property appraiser has responsibility. Even though many utility and industrial properties are unique in nature, the market for this type property is analyzed to determine how the values of similar properties, or properties that are as similar as possible, are affected by market forces. Some industrial properties, such as machine shops, have many facilities that can be compared to similar subject properties in terms of type and size of equipment, type of property fabricated or services at the subject facility, and other factors. Those similarities help the appraiser estimate the value of the subject property. Cost Analysis The Cost Approach to value is applied to most personal property. It is utilized in conjunction with the Market and Income approaches to value on most utility companies and many industrial companies to arrive at a final market value. For the Cost Approach, depreciation schedules are developed based on the percent good typical for each property type at any specific age. Depreciation schedules have been implemented for what is typical of each major class of property by economic life categories. Schedules have been developed for improvements with varying years of expected life. The actual age, if known, and the effective ages of improvements are noted. Effective age estimates are based on the utility of the improvements
- 55 -
relative to where the improvement lies on the scale of its total economic life and its competitive position in the marketplace. Market adjustment factors such as external and/or functional obsolescence can be applied when warranted. A depreciation calculation override can be used if the condition or effective age of a property varies from the norm by appropriately noting the physical condition and functional utility ratings on the property data characteristics. These adjustments are typically applied to a specific property type or location and can be developed via ratio studies or other market analyses. Many utility, industrial and personal properties use the same types of buildings and, depending on the type of business, may use the same types of manufacturing or service equipment. Many of the buildings encountered at industrial facilities are generic in construction, such as pre-engineered metal buildings. The cost per square foot to construct these type structures can be used to estimate values at facilities that have similarly constructed buildings. However, the building as constructed will have differences that must be taken into account when estimating the final value of the property being reviewed. The majority of these typical type buildings are appraised by CAD personnel. However, some industrial properties, such as specialty chemical plants, are so unique in nature that the appraiser must use additional information such as output quantity, type of product manufactured, and other factors to estimate the value of the subject property. However, the manner in which the entire business operation is put together may make a particular facility unique. The district uses information from similar businesses to examine the real property values at a particular business, but the individual characteristics of the business being reviewed determine the value estimation. Some industrial buildings are use specific and therefore have no comparable properties. A similar analysis is used for personal property. Many items of personal property, such as furniture and fixtures, computers, and even machinery and equipment are generic in construction, but individual characteristics that affect value, such as usage, environment where used, and level of care will have an effect on the final value estimations. When cost data for this type of property is available and considered reliable, it is used for value estimation purposes at other plant facilities. However, on-site inspection and information provided by the property owner will affect the final value.
Income Analysis Capitalization analysis is used in the income approach models. This methodology involves the capitalization of net operating income as an indication of market value for a specific property. Capitalization rates, both overall cap rates for the direct capitalization method and terminal cap rates for discounted cash flow analyses, can be derived from the market. Sales of improved properties from which actual income and expense data are obtained provide a very good indication of what a specific market participant is requiring from an investment at a specific point in time. In addition, overall capitalization rates can be derived from the built-up method (band-of-investment). This method relates to satisfying the market return requirements of both the debt and equity positions of a type of company. Many utility companies are appraised on a Unit Appraisal Model, which utilizes both the income and cost approaches to value. Information from publically available sources such as FERC and RRC reports are utilized to arrive at the input parameters for these types of properties.
- 56 -
DATA COLLECTION/VALIDATION
Data Collection An extended range of variations may exist within the same class of utility, industrial or personal property, and there are a multitude of property types within the industrial category. For this reason, effective data collection procedures would be very difficult to organize in a single comprehensive manual. WAG uses many different publications available to the industry, such as the Oilfield Appraiser and the Equipment Newsletter, Marshall and Swift, Oil and Gas Journal, and other companion data acquisition forms to standardize data collection for building schedules that are later assigned to the industrial appraisal staff. The data generated by these forms enables the appraiser to use the software to value industrial properties. Industrial personal property also consists of many different classes of assets with a wide range of variation within each class. The district has adopted the convention of listing assets and estimating effective age of assets in the field. The field listing is then compared with information furnished by the property owners during the final valuation review.
Sources of Data The original real and personal property data used by WAG on behalf of the CADs have been maintained on the CAD computer system. The district and contract appraisal personnel have updated that information based on field review, renditions, newspaper articles, publicly available news releases and government reports. For Commercial vehicles, an outside vendor, Just Texas, provides the appraisers with a listing of vehicles registered commercially in El Paso County. The vendor develops this listing from the Texas Department of Transportation Title and Registration Division records. As new facilities are built, the appraisal personnel collect all the real and personal property data necessary to value the property initially and thereafter update the information when the property is again visited. Other sources of data include publications such as the Texas Register regarding waste control permits, various refining and chemical industry magazine articles, and Texas Industrial Expansion articles on new construction.
Data Collection Procedures The district and contract appraisal personnel annually or periodically visit assigned plants and facilities. The frequency of the visit is determined by the nature of the business conducted at each facility. For example, refineries and chemical plants are continually changing or adding to processes to extract greater efficiencies or make new products, but machine shops may not add or remove equipment over a period of two or more years. The appraisers take with them the past data on the building and site improvements and the prior listing of personal property at the facility being visited. Changes to the existing structures and personal property are noted and that information is used for value estimation purposes. In addition, if possible, pictures are taken at the time of inspection to validate information provided on the rendition or to utilize for the appraisal if no rendition is submitted. If cost information for the real or personal property is supplied later, the field data can be compared to that information to judge the accuracy of the information. The WAG appraisal staff members are not assigned any one geographical area of the county. The category of property, the nature of the business, and whether or not the district has the staff resources available can each be a determining factor in identifying which properties are
- 57 -
appraised by the contract firms and which properties are appraised by the district’s appraisal staff. WAG appraisers are trained by accompanying appraisers who have performed field visit and appraisal functions for a number of years. In addition, each WAG appraiser is registered with the Texas Board of Tax Professional Examiners and is either a RPA or is working towards the RPA designation. Each WAG appraiser is responsible for the completeness and correctness of their valuation work, but a new appraiser is encouraged to seek the advice of and review by experienced appraisal staff .
VALUATION ANALYSIS (MODEL CALIBRATION)
Final Valuation Schedules WAG develops schedules based on indexed Marshall & Swift depreciation factors, as well as the schedules prepared by other appraisal districts, state appraisers and other cost estimates for use in the valuation of all business and industrial personal property. In addition, appraisal personnel, utilize actual cost data developed from both publicly available sources as well as proprietary information received from other companies without identifying information, to update these schedules annually. INDIVIDUAL VALUE REVIEW PROCEDURES
Field Review WAG personnel annually review contracted real and personal property accounts. These accounts are physically inspected on a one to two-year cycle. Certain properties are reviewed annually because past experience shows that changes are occurring continually in the real or personal property at that facility. The results of prior year hearings, renditions, and indications of new activity are another source that initiates required field visits. Many times during hearings, issues are presented that cause a value adjustment. Those issues must be field checked to see if these influences will be on-going and warrant permanent value adjustments or are transitory. This information will be recorded so the appraiser will be better able to estimate the property value. Any new construction or business activity is noted and the information necessary to value the property is recorded. Part of the field review includes noting any land characteristics that would affect the land value. The district values all land for the properties over which it has responsibility, including those properties assigned to WAG. WAG advises the district of any characteristics that would affect the value of the land associated with an assigned facility. Office Review All properties are reviewed in the office by the WAG appraiser assigned to each particular utility, industrial, or personal properties. The office review relies on historical information in the utility, industrial, or personal property file as the basis for deciding on the estimated value to be placed on the property for the current tax year. The date of last inspection, extent of that inspection, and the appraiser responsible are listed in the WAG system. If a property owner disputes the district's records concerning this data in a protest hearing, the property record may be altered based on the credibility of the evidence provided.
- 58 -
When valuing utility, industrial or personal property, the type of furniture, equipment, computers, etc., will be used along with any cost data provided by the property owner to estimate the value. Experience in valuing similar property at other facilities will help the appraiser estimate the value of the subject facility. Individual characteristics of the property, such as usage and maintenance will have a bearing on the value calculated by use of the WAG schedules.
PERFORMANCE TESTS Sales Ratio Studies Ratio studies are an important tool to examine comparability of appraised values to market values. The ratio study may use available sales data or independent, expert appraisals. Typically, there are not enough sales of utility and industrial properties to show representativeness of that class of property in a ratio study. Ratio studies of utility and industrial properties normally rely on independent appraisals as an indicator of market values. Comparative Appraisal Analysis This type of analysis is not normally performed on industrial properties due to the unique nature of the property. Time and budget constraints regarding available appraisal staff also plays a role in the type of analysis that occurs. Only in an instance where a jurisdiction would file a jurisdiction challenge with the Appraisal Review Board would the district perform such an analysis. If a CAD receives a jurisdiction challenge on an utility or industrial category of properties, the appraisers assigned to those accounts will research the appraisal roll to see what other similar properties exist. The real property values can be compared on an average value per square foot of structure basis, but the differences from one facility to another must be carefully compared because it is unlikely that two different facilities are going to build like improvements and use them in similar ways. In like manner, the personal property values can be compared per category, such as furniture and fixtures, machinery and equipment, etc., but the same comparison of the type of and use of the property must be examined to ensure property comparison.
Attachment A Wardlaw Appraisal Group Personnel
PROPERTY TAX APPRAISER CERTIFICATION
TDLR # NAME TYPE
74200 CRAIN, MALLORY M APPRAISER
73759 GRALL, ALFRED J APPRAISER
73616 MCFARLANE, KATHLEEN M APPRAISER
74717 SHERWIN, PROCTOR APPRAISER
66026 WARDLAW, MARGARET A APPRAISER
70182 WILLIAMS, CHARLES R APPRAISER
71700 WILLIAMS, HAZIEL M APPRAISER
73526 ZARDER, MATTHEW T APPRAISER
- 59 -
PROFESSIONAL ENGINEERING CERTIFICATION
PE# NAME BRANCH
76914 WARDLAW, PEGGY ANNE PETROLEUM
77254 WILLAMS, CHARLES RAY JR PETROLEUM
PROFESSIONAL ENGINEERING FIRM CERTIFICATION
FIRM # FIRM NAME
5194 WARDLAW APPRAISAL GROUP LC
Recommended