
Investor Relations
results Q4 2017 and update on capital
14 March 2018roadshow booklet
2
Q4 results presentation 3
Additional slides 20
− Profile 21
− Financials 40
− Risk management 44
− Capital, funding & liquidity 49
Important notice 57
Table of contents
3
Highlights Q4 2017 are vs. Q4 2016
Highlights at Q4, a solid quarter
Net profit up at EUR 542m, reflecting good growth in operating result and impairment releases
On track to achieve financial targets: NII remains resilient and cost saving programmes are delivering
Dividend EUR 1.45 per share (full year) benefits from increased pay-out (50%) on sharply improved reported profit
Strong CET1 capital of 17.7%
Capital update
− Basel IV impact of around 35% RWA increase
− CET1 target for 2018 of 17.5-18.5% under Basel III
− Dividend pay-out 50% of sustainable profit, additional distributions will be considered. Combined at least 50%
4
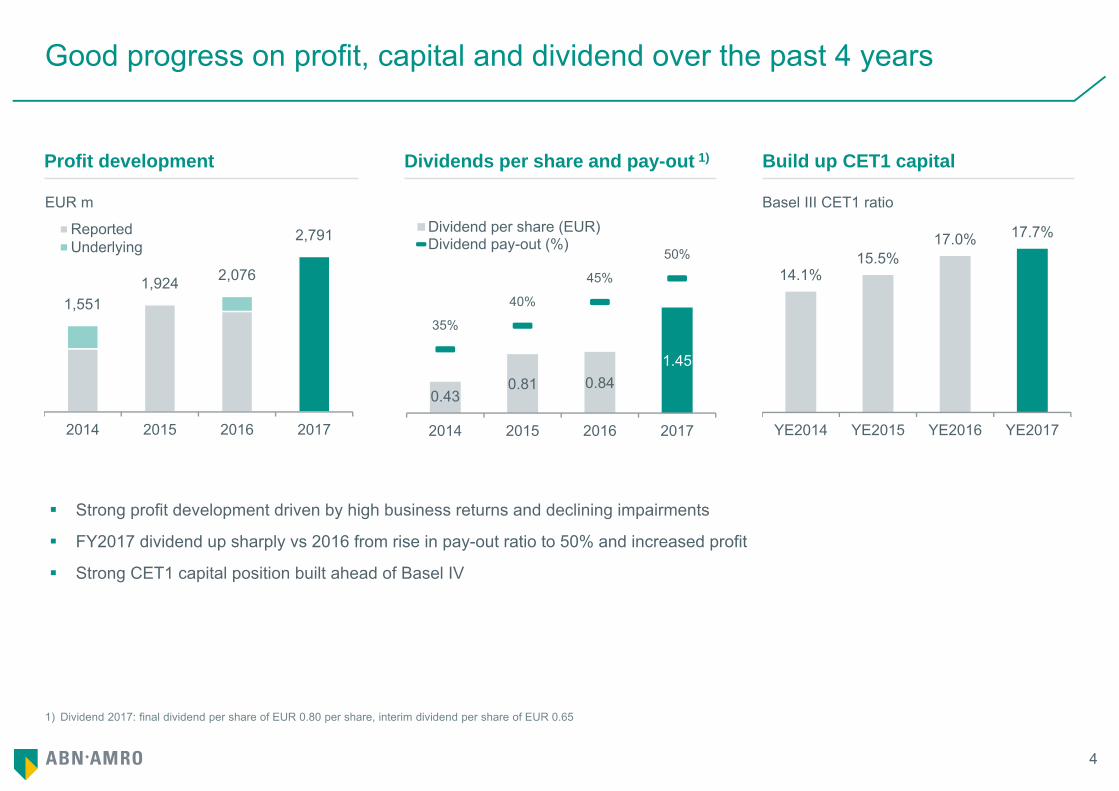
1) Dividend 2017: final dividend per share of EUR 0.80 per share, interim dividend per share of EUR 0.65
Good progress on profit, capital and dividend over the past 4 years
Profit development Dividends per share and pay-out 1)
Strong profit development driven by high business returns and declining impairments
FY2017 dividend up sharply vs 2016 from rise in pay-out ratio to 50% and increased profit
Strong CET1 capital position built ahead of Basel IV
Build up CET1 capital
Basel III CET1 ratio EUR m
1,5511,924 2,076
2,791
2014 2015 2016 2017
ReportedUnderlying
14.1%15.5%
17.0% 17.7%
YE2014 YE2015 YE2016 YE2017
0.430.81 0.84
1.45
35%
40%
45%
50%
2014 2015 2016 2017
Dividend per share (EUR)Dividend pay-out (%)
5
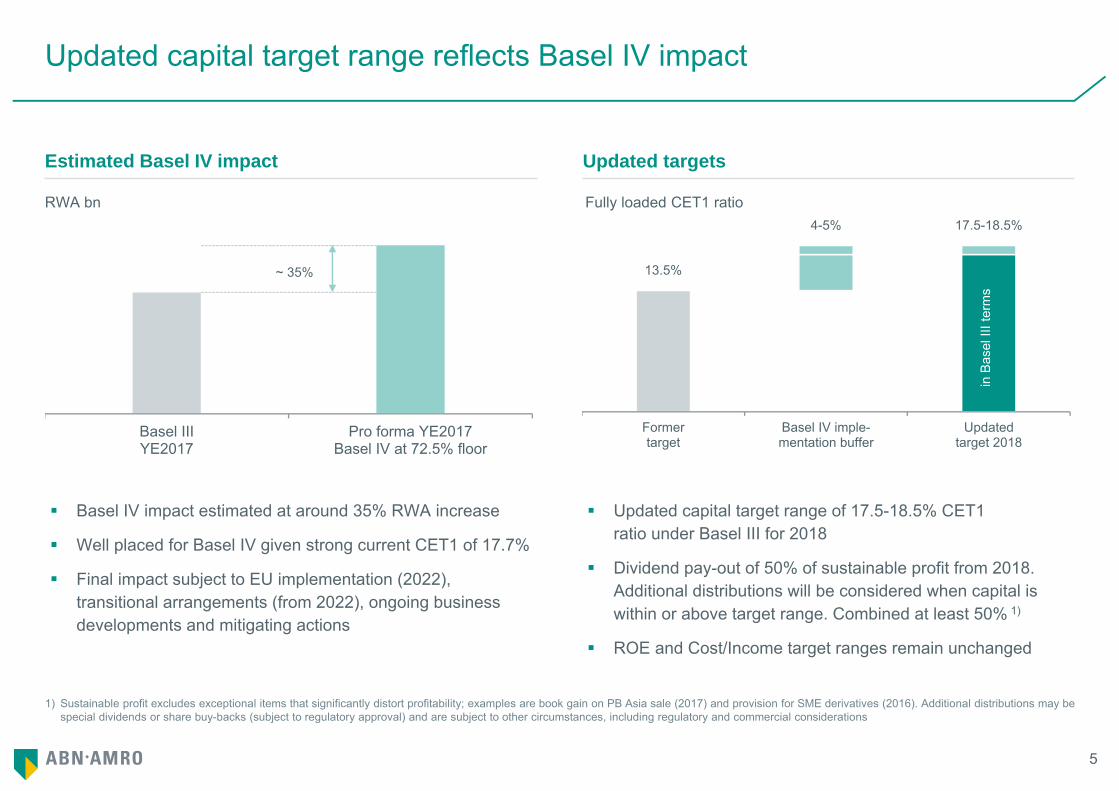
1) Sustainable profit excludes exceptional items that significantly distort profitability; examples are book gain on PB Asia sale (2017) and provision for SME derivatives (2016). Additional distributions may be special dividends or share buy-backs (subject to regulatory approval) and are subject to other circumstances, including regulatory and commercial considerations
Updated capital target range reflects Basel IV impact
Estimated Basel IV impact Updated targets
Basel IV impact estimated at around 35% RWA increase
Well placed for Basel IV given strong current CET1 of 17.7%
Final impact subject to EU implementation (2022), transitional arrangements (from 2022), ongoing business developments and mitigating actions
Updated capital target range of 17.5-18.5% CET1 ratio under Basel III for 2018
Dividend pay-out of 50% of sustainable profit from 2018.Additional distributions will be considered when capital is within or above target range. Combined at least 50% 1)
ROE and Cost/Income target ranges remain unchanged
13.5%
4-5% 17.5-18.5%
Formertarget
Basel IV imple-mentation buffer
Updatedtarget 2018
in B
asel
III t
erm
s
Fully loaded CET1 ratio RWA bn
~ 35%
Basel IIIYE2017
Pro forma YE2017Basel IV at 72.5% floor
6
Senior management simplification
Head office cost reductions
IT simplification, standardisation and agile
Digitalisation in Retail Banking
Private Banking disposal, simplification and digitalisation
Sector approach in Commercial Banking
Digital initiatives launched
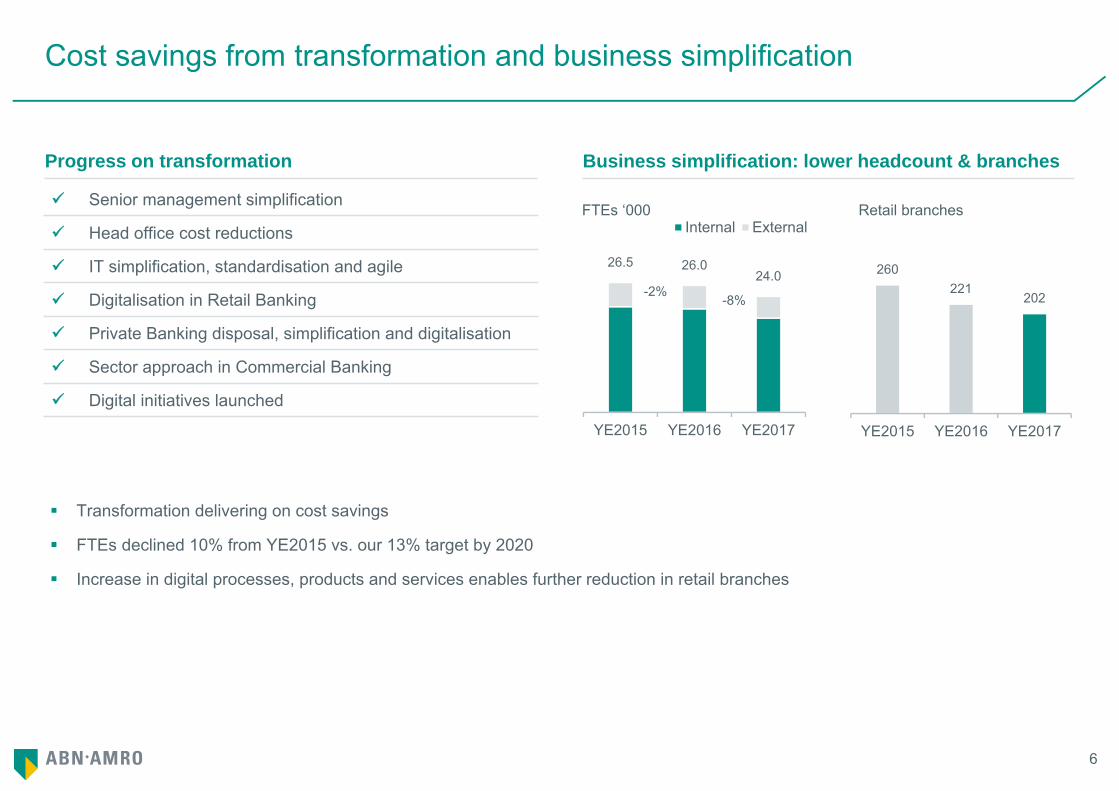
Cost savings from transformation and business simplification
Progress on transformation Business simplification: lower headcount & branches
Transformation delivering on cost savings
FTEs declined 10% from YE2015 vs. our 13% target by 2020
Increase in digital processes, products and services enables further reduction in retail branches
FTEs ‘000
26.5 26.024.0
YE2015 YE2016 YE2017
Internal External
260221
202
YE2015 YE2016 YE2017
Retail branches
-2%-8%
7
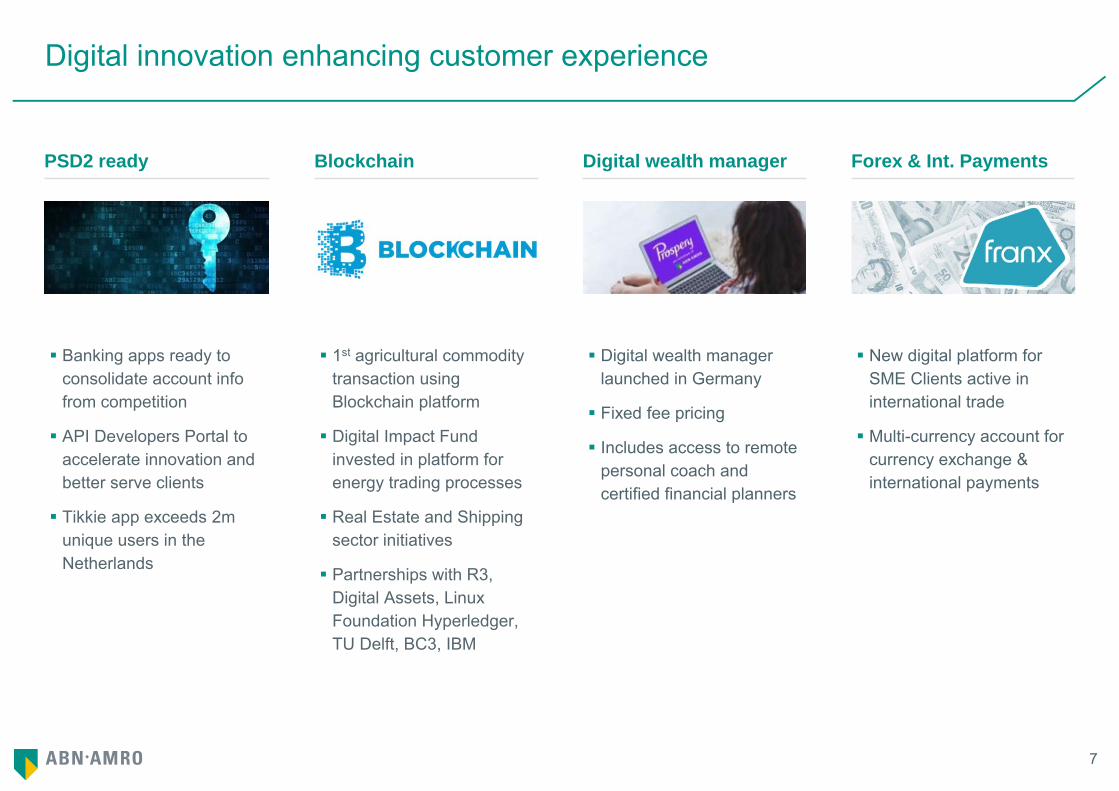
Digital innovation enhancing customer experience
PSD2 ready Blockchain
Banking apps ready to consolidate account info from competition
API Developers Portal to accelerate innovation and better serve clients
Tikkie app exceeds 2m unique users in the Netherlands
Digital wealth manager
1st agricultural commodity transaction using Blockchain platform
Digital Impact Fund invested in platform for energy trading processes
Real Estate and Shipping sector initiatives
Partnerships with R3, Digital Assets, Linux Foundation Hyperledger, TU Delft, BC3, IBM
Digital wealth manager launched in Germany
Fixed fee pricing
Includes access to remote personal coach and certified financial planners
Forex & Int. Payments
New digital platform for SME Clients active in international trade
Multi-currency account for currency exchange & international payments
8
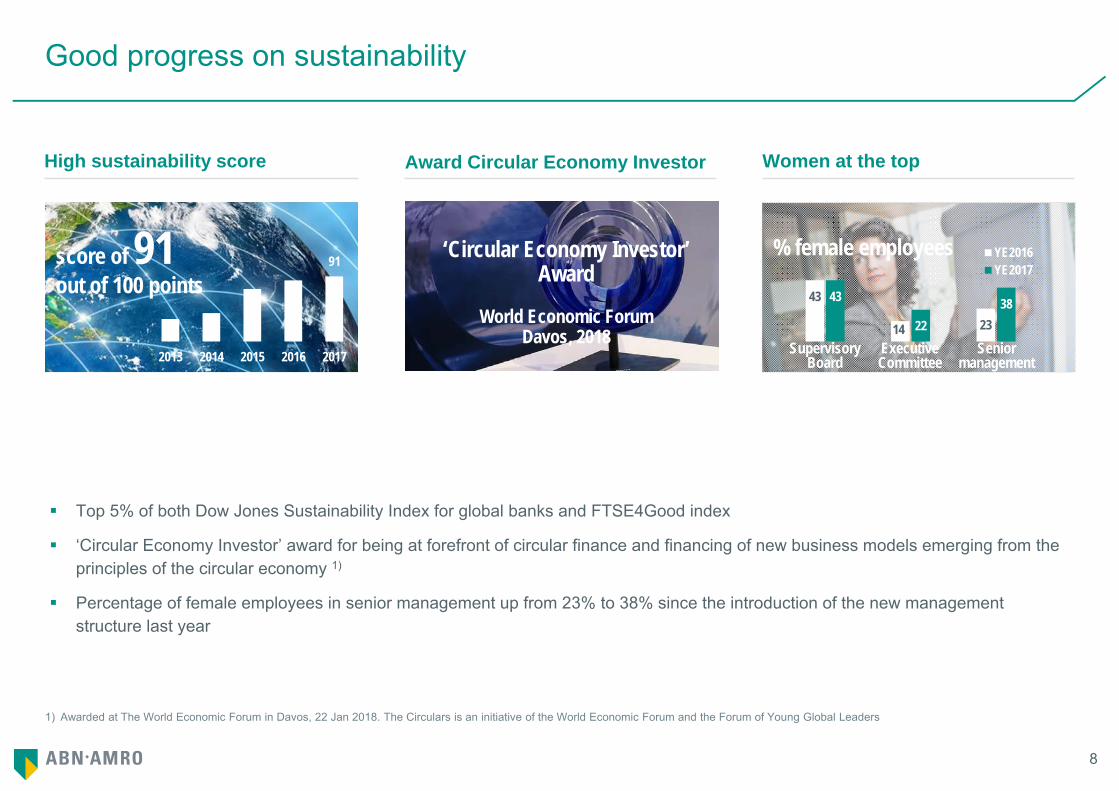
1) Awarded at The World Economic Forum in Davos, 22 Jan 2018. The Circulars is an initiative of the World Economic Forum and the Forum of Young Global Leaders
Good progress on sustainability
High sustainability score Award Circular Economy Investor
Top 5% of both Dow Jones Sustainability Index for global banks and FTSE4Good index
‘Circular Economy Investor’ award for being at forefront of circular finance and financing of new business models emerging from the principles of the circular economy 1)
Percentage of female employees in senior management up from 23% to 38% since the introduction of the new management structure last year
Women at the top
43
14 23
43
2238
YE2016YE2017
SupervisoryBoard
ExecutiveCommittee
Senior management
% female employees91
2013 2014 2015 2016 2017
score of 91out of 100 points
‘Circular Economy Investor’Award
World Economic ForumDavos, 2018
9
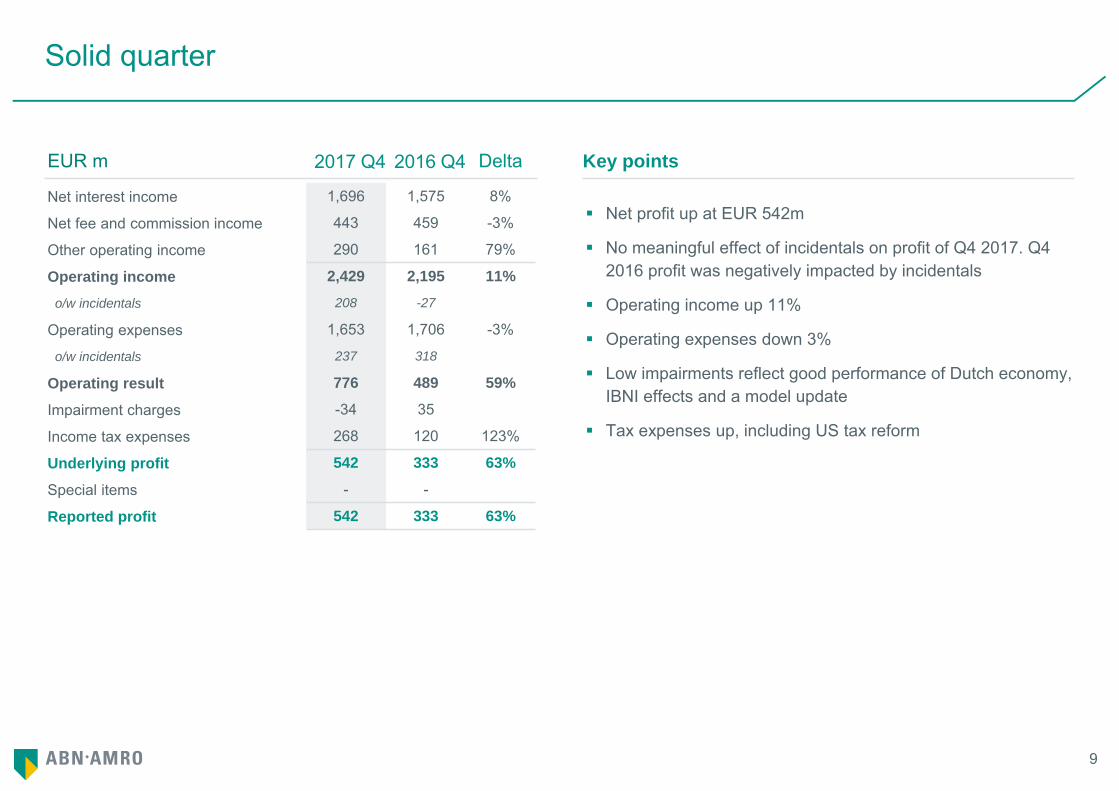
Solid quarter
Net profit up at EUR 542m
No meaningful effect of incidentals on profit of Q4 2017. Q4 2016 profit was negatively impacted by incidentals
Operating income up 11%
Operating expenses down 3%
Low impairments reflect good performance of Dutch economy, IBNI effects and a model update
Tax expenses up, including US tax reform
Key pointsEUR m 2017 Q4 2016 Q4 Delta
Net interest income 1,696 1,575 8%
Net fee and commission income 443 459 -3%
Other operating income 290 161 79%
Operating income 2,429 2,195 11%
o/w incidentals 208 -27
Operating expenses 1,653 1,706 -3%
o/w incidentals 237 318
Operating result 776 489 59%
Impairment charges -34 35
Income tax expenses 268 120 123%
Underlying profit 542 333 63%
Special items - -
Reported profit 542 333 63%
10
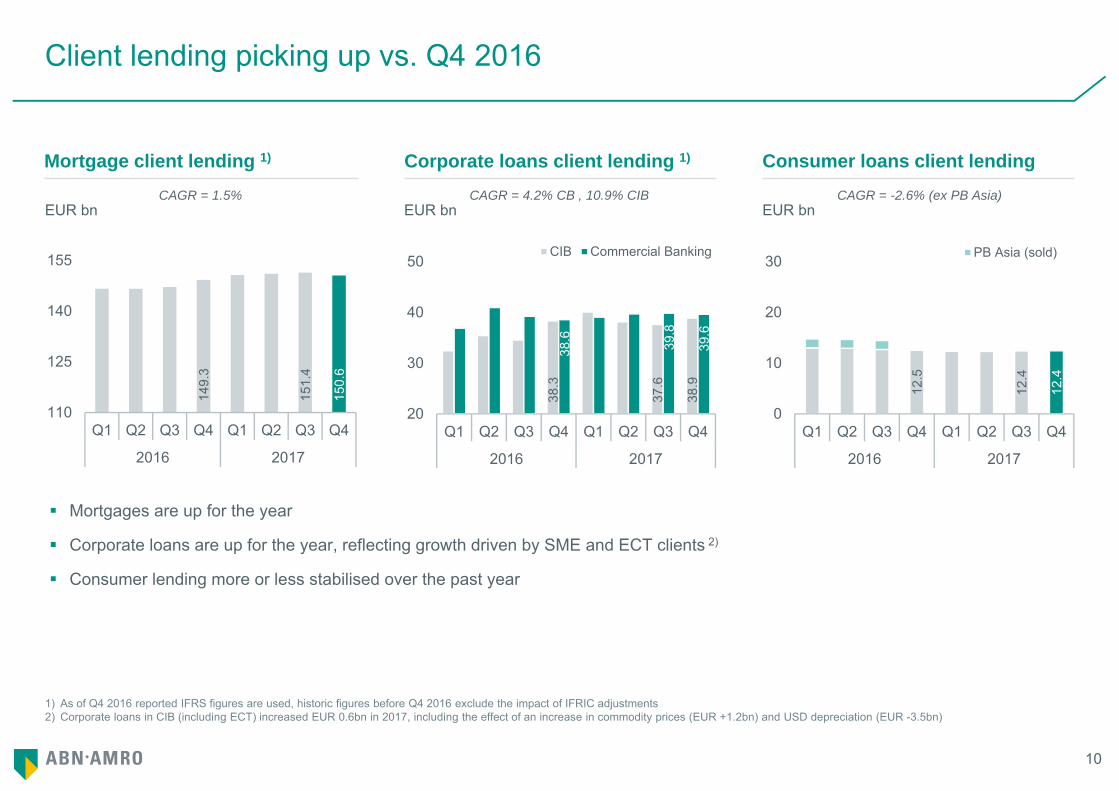
1) As of Q4 2016 reported IFRS figures are used, historic figures before Q4 2016 exclude the impact of IFRIC adjustments2) Corporate loans in CIB (including ECT) increased EUR 0.6bn in 2017, including the effect of an increase in commodity prices (EUR +1.2bn) and USD depreciation (EUR -3.5bn)
Client lending picking up vs. Q4 2016
Mortgage client lending 1) Corporate loans client lending 1)
Mortgages are up for the year
Corporate loans are up for the year, reflecting growth driven by SME and ECT clients 2)
Consumer lending more or less stabilised over the past year
Consumer loans client lending
EUR bn EUR bn EUR bnCAGR = 1.5% CAGR = 4.2% CB , 10.9% CIB CAGR = -2.6% (ex PB Asia)
149.
3
151.
4
150.
6
110
125
140
155
Q1 Q2 Q3 Q4 Q1 Q2 Q3 Q4
2016 2017
38.3
37.6
38.9
38.6 39.8
39.6
20
30
40
50
Q1 Q2 Q3 Q4 Q1 Q2 Q3 Q4
2016 2017
CIB Commercial Banking
12.5
12.4
12.4
0
10
20
30
Q1 Q2 Q3 Q4 Q1 Q2 Q3 Q4
2016 2017
PB Asia (sold)
11
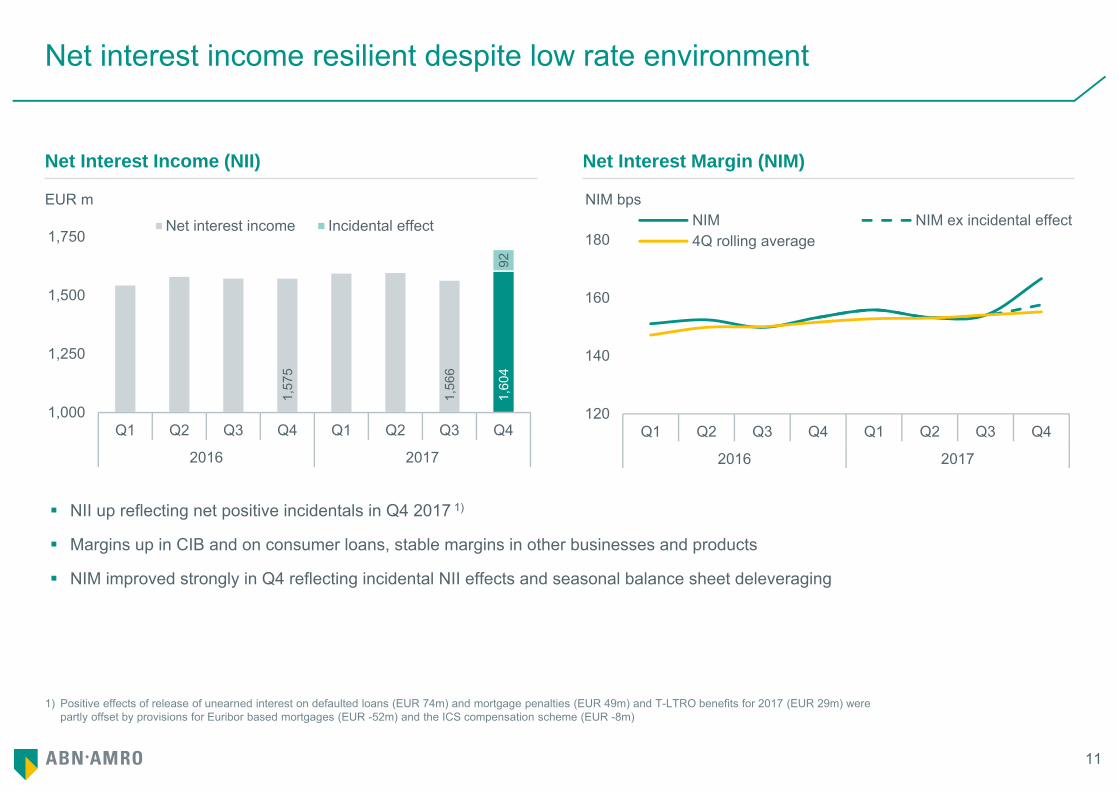
1) Positive effects of release of unearned interest on defaulted loans (EUR 74m) and mortgage penalties (EUR 49m) and T-LTRO benefits for 2017 (EUR 29m) were partly offset by provisions for Euribor based mortgages (EUR -52m) and the ICS compensation scheme (EUR -8m)
Net interest income resilient despite low rate environment
Net Interest Income (NII) Net Interest Margin (NIM)
NII up reflecting net positive incidentals in Q4 2017 1)
Margins up in CIB and on consumer loans, stable margins in other businesses and products
NIM improved strongly in Q4 reflecting incidental NII effects and seasonal balance sheet deleveraging
EUR m NIM bps
1,57
5
1,56
6
1,60
492
1,000
1,250
1,500
1,750
Q1 Q2 Q3 Q4 Q1 Q2 Q3 Q4
2016 2017
Net interest income Incidental effect
120
140
160
180
Q1 Q2 Q3 Q4 Q1 Q2 Q3 Q4
2016 2017
NIM NIM ex incidental effect4Q rolling average
12
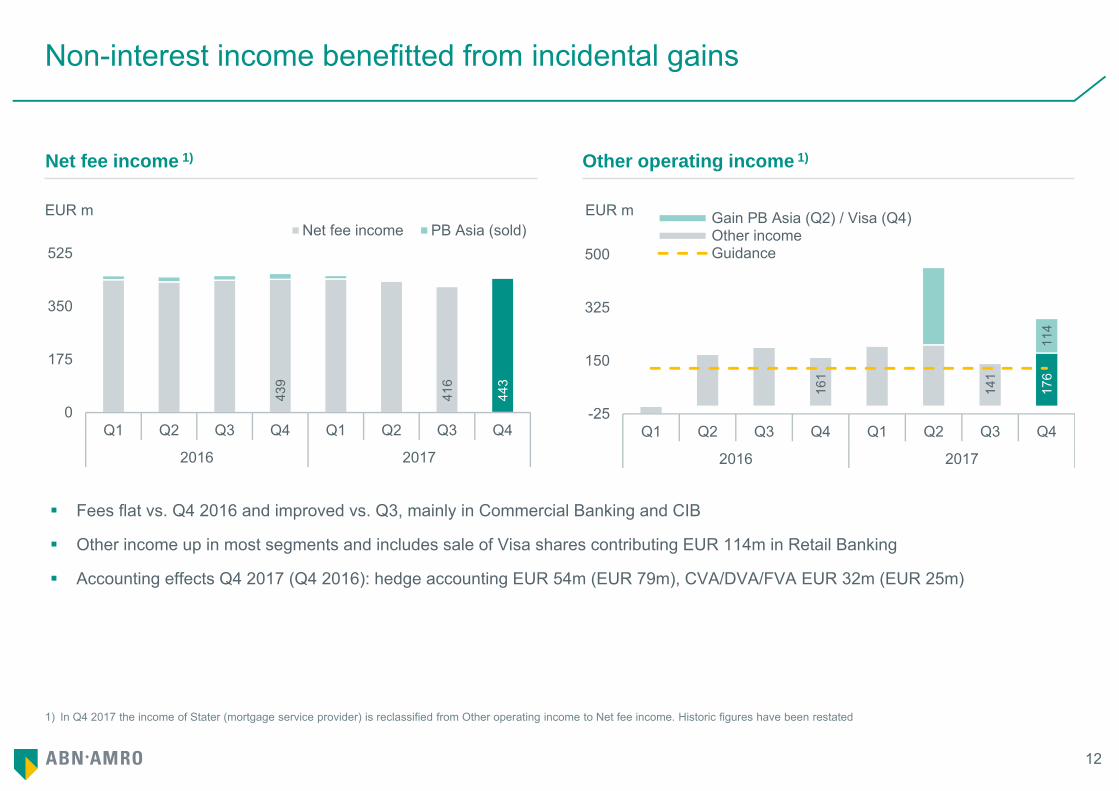
1) In Q4 2017 the income of Stater (mortgage service provider) is reclassified from Other operating income to Net fee income. Historic figures have been restated
Non-interest income benefitted from incidental gains
Net fee income 1)
Fees flat vs. Q4 2016 and improved vs. Q3, mainly in Commercial Banking and CIB
Other income up in most segments and includes sale of Visa shares contributing EUR 114m in Retail Banking
Accounting effects Q4 2017 (Q4 2016): hedge accounting EUR 54m (EUR 79m), CVA/DVA/FVA EUR 32m (EUR 25m)
EUR m EUR m
Other operating income 1)
161
141
176
114
-25
150
325
500
Q1 Q2 Q3 Q4 Q1 Q2 Q3 Q4
2016 2017
Gain PB Asia (Q2) / Visa (Q4)Other incomeGuidance
439
416
443
0
175
350
525
Q1 Q2 Q3 Q4 Q1 Q2 Q3 Q4
2016 2017
Net fee income PB Asia (sold)
13
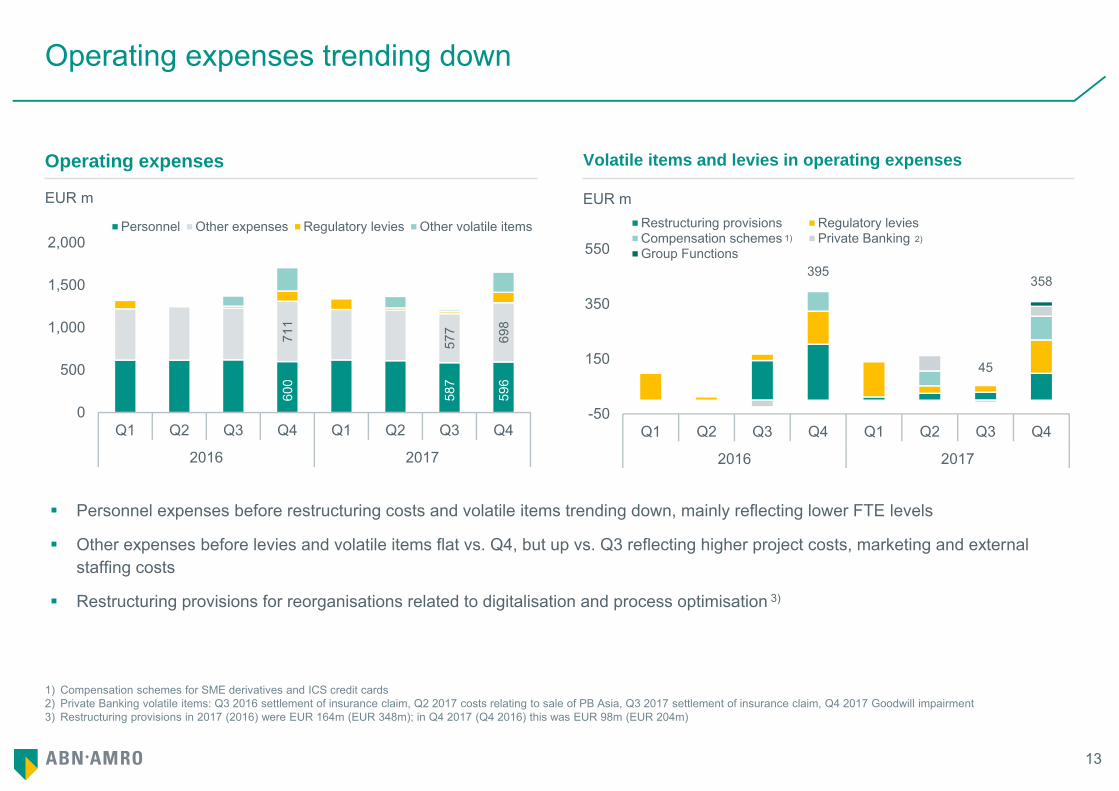
Operating expenses trending down
Operating expenses Volatile items and levies in operating expenses
EUR m EUR m
Personnel expenses before restructuring costs and volatile items trending down, mainly reflecting lower FTE levels
Other expenses before levies and volatile items flat vs. Q4, but up vs. Q3 reflecting higher project costs, marketing and external staffing costs
Restructuring provisions for reorganisations related to digitalisation and process optimisation 3)
1) Compensation schemes for SME derivatives and ICS credit cards2) Private Banking volatile items: Q3 2016 settlement of insurance claim, Q2 2017 costs relating to sale of PB Asia, Q3 2017 settlement of insurance claim, Q4 2017 Goodwill impairment3) Restructuring provisions in 2017 (2016) were EUR 164m (EUR 348m); in Q4 2017 (Q4 2016) this was EUR 98m (EUR 204m)
600
587
596
711
577
698
0
500
1,000
1,500
2,000
Q1 Q2 Q3 Q4 Q1 Q2 Q3 Q4
2016 2017
Personnel Other expenses Regulatory levies Other volatile items
395
45
358
-50
150
350
550
Q1 Q2 Q3 Q4 Q1 Q2 Q3 Q4
2016 2017
Restructuring provisions Regulatory leviesCompensation schemes Private Banking 1)Group Functions
2)1)
14
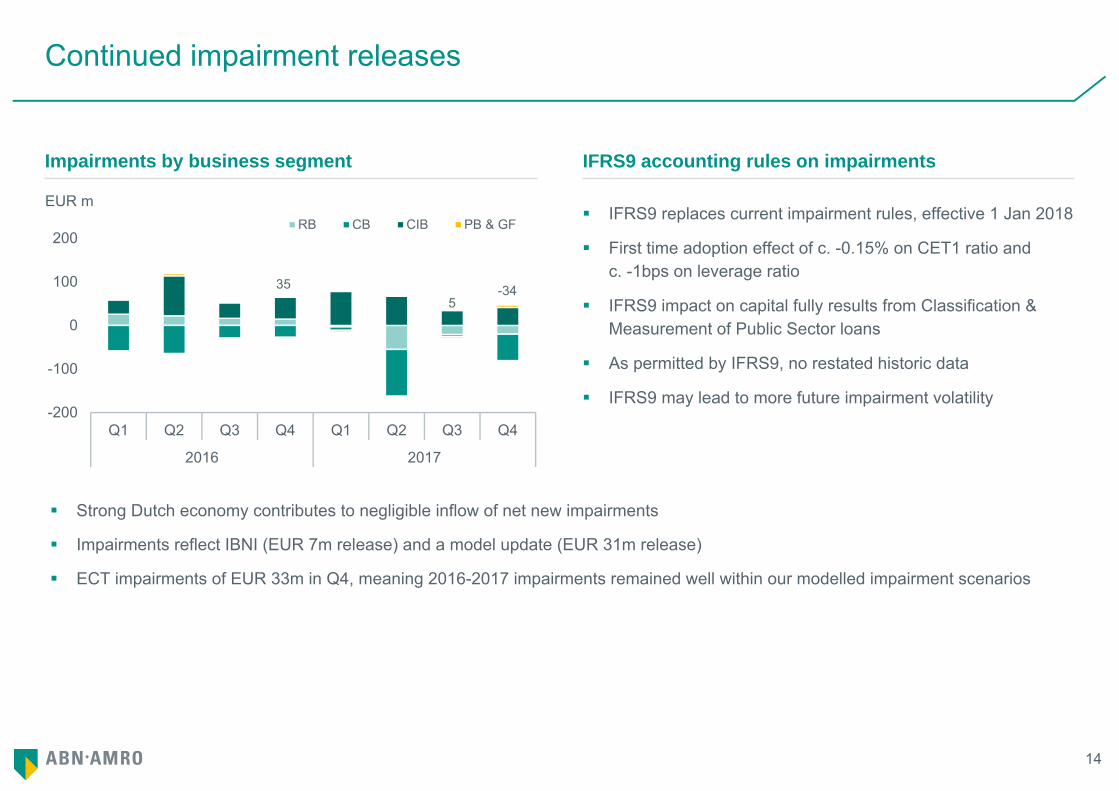
Continued impairment releases
IFRS9 replaces current impairment rules, effective 1 Jan 2018
First time adoption effect of c. -0.15% on CET1 ratio and c. -1bps on leverage ratio
IFRS9 impact on capital fully results from Classification & Measurement of Public Sector loans
As permitted by IFRS9, no restated historic data
IFRS9 may lead to more future impairment volatility
Impairments by business segment IFRS9 accounting rules on impairments
Strong Dutch economy contributes to negligible inflow of net new impairments
Impairments reflect IBNI (EUR 7m release) and a model update (EUR 31m release)
ECT impairments of EUR 33m in Q4, meaning 2016-2017 impairments remained well within our modelled impairment scenarios
EUR m
355
-34
-200
-100
0
100
200
Q1 Q2 Q3 Q4 Q1 Q2 Q3 Q4
2016 2017
RB CB CIB PB & GF
15
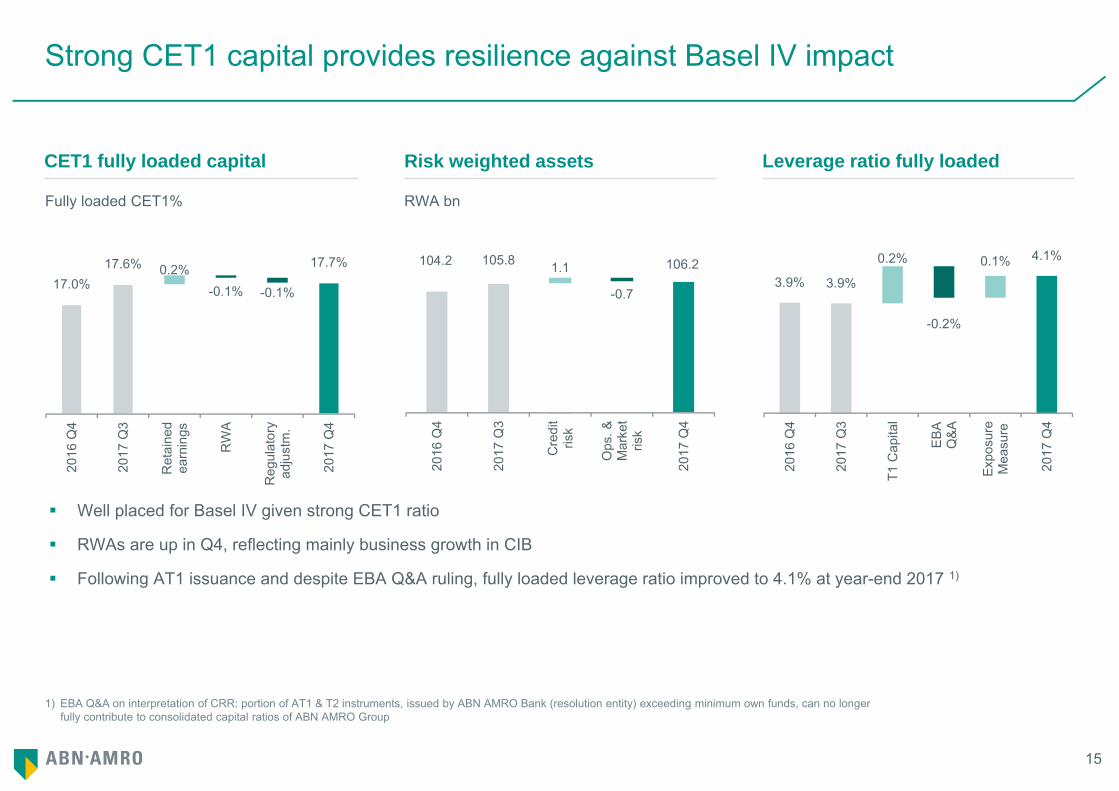
1) EBA Q&A on interpretation of CRR: portion of AT1 & T2 instruments, issued by ABN AMRO Bank (resolution entity) exceeding minimum own funds, can no longer fully contribute to consolidated capital ratios of ABN AMRO Group
Strong CET1 capital provides resilience against Basel IV impact
CET1 fully loaded capital Risk weighted assets
Well placed for Basel IV given strong CET1 ratio
RWAs are up in Q4, reflecting mainly business growth in CIB
Following AT1 issuance and despite EBA Q&A ruling, fully loaded leverage ratio improved to 4.1% at year-end 2017 1)
Leverage ratio fully loaded
Fully loaded CET1% RWA bn
0.2%-0.1% -0.1%17.0%
17.6% 17.7%
2016
Q4
2017
Q3
Ret
aine
dea
rnin
gs
RW
A
Reg
ulat
ory
adju
stm
.
2017
Q4
104.2 105.8 106.21.1
-0.7
2016
Q4
2017
Q3
Cre
dit
risk
Ops
. &M
arke
tris
k
2017
Q4
0.2% 0.1%
-0.2%
3.9% 3.9%
4.1%
2016
Q4
2017
Q3
T1 C
apita
l
EB
AQ
&A
Exp
osur
eM
easu
re
2017
Q4
16
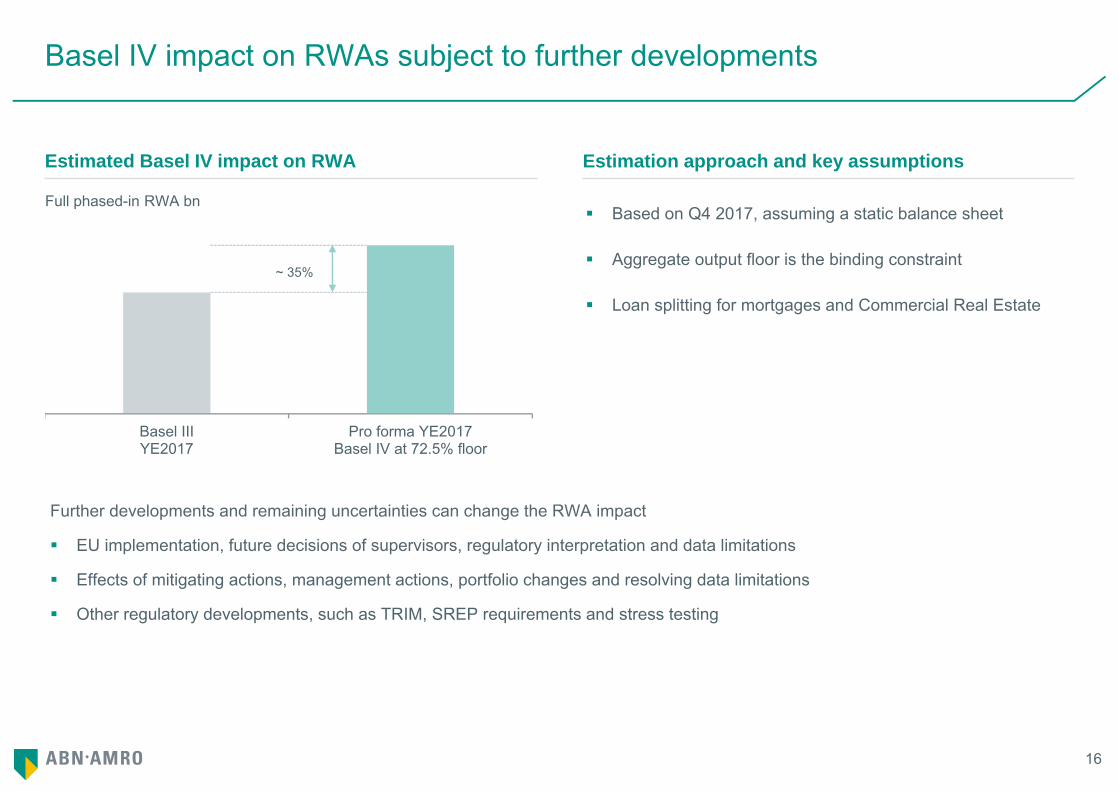
Basel IV impact on RWAs subject to further developments
Based on Q4 2017, assuming a static balance sheet
Aggregate output floor is the binding constraint
Loan splitting for mortgages and Commercial Real Estate
Estimated Basel IV impact on RWA Estimation approach and key assumptions
Further developments and remaining uncertainties can change the RWA impact
EU implementation, future decisions of supervisors, regulatory interpretation and data limitations
Effects of mitigating actions, management actions, portfolio changes and resolving data limitations
Other regulatory developments, such as TRIM, SREP requirements and stress testing
Full phased-in RWA bn
~ 35%
Basel IIIYE2017
Pro forma YE2017Basel IV at 72.5% floor
17
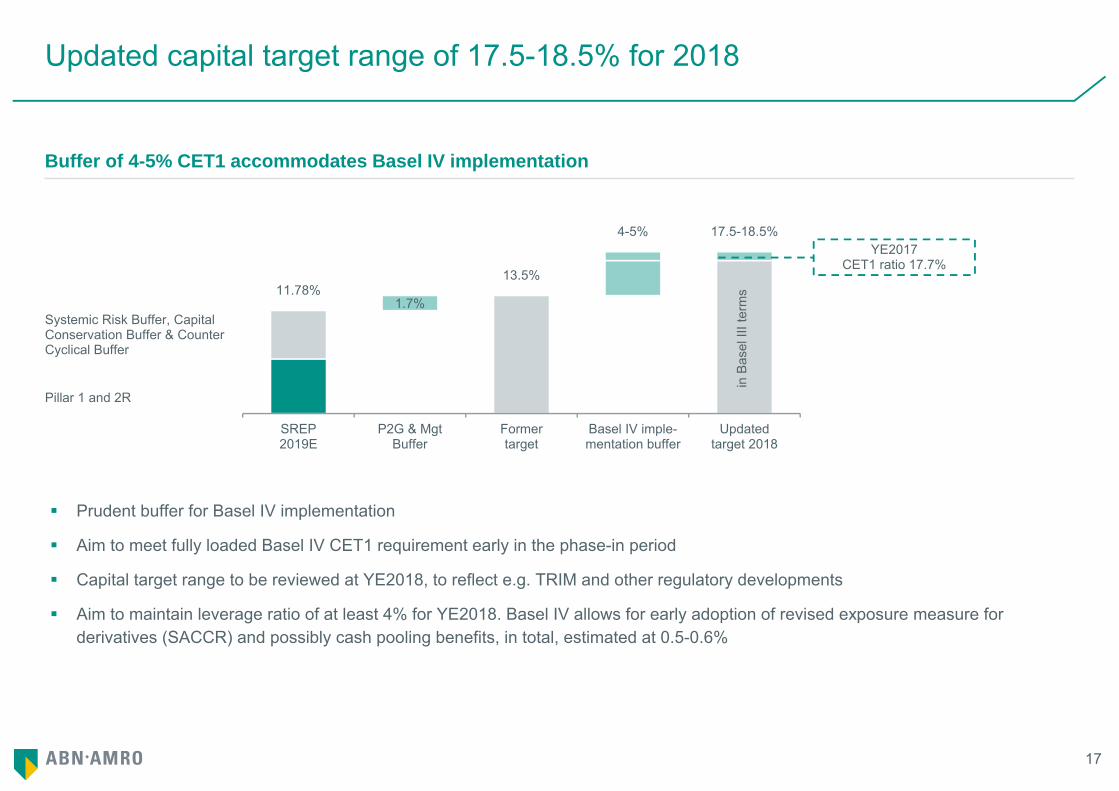
Updated capital target range of 17.5-18.5% for 2018
Buffer of 4-5% CET1 accommodates Basel IV implementation
Prudent buffer for Basel IV implementation
Aim to meet fully loaded Basel IV CET1 requirement early in the phase-in period
Capital target range to be reviewed at YE2018, to reflect e.g. TRIM and other regulatory developments
Aim to maintain leverage ratio of at least 4% for YE2018. Basel IV allows for early adoption of revised exposure measure for derivatives (SACCR) and possibly cash pooling benefits, in total, estimated at 0.5-0.6%
1.7%11.78%
13.5%
4-5% 17.5-18.5%
SREP2019E
P2G & MgtBuffer
Formertarget
Basel IV imple-mentation buffer
Updatedtarget 2018
in B
asel
III t
erm
s
YE2017CET1 ratio 17.7%
Pillar 1 and 2R
Systemic Risk Buffer, Capital Conservation Buffer & Counter Cyclical Buffer
18
1) Sustainable profit excludes exceptional items that significantly distort profitability; examples are book gain on PB Asia sale (2017) and provision for SME derivatives (2016)2) Additional distributions can be special dividends or share buy-backs (subject to regulatory approval)
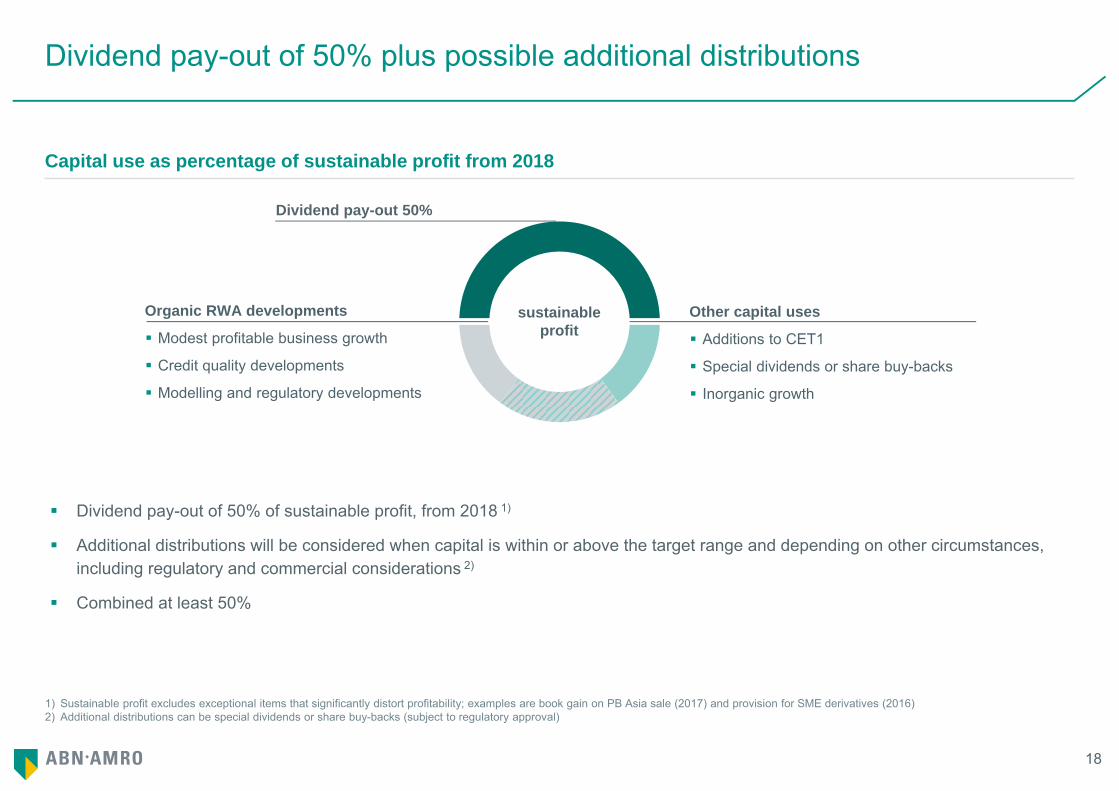
Dividend pay-out of 50% plus possible additional distributions
Capital use as percentage of sustainable profit from 2018
Dividend pay-out of 50% of sustainable profit, from 2018 1)
Additional distributions will be considered when capital is within or above the target range and depending on other circumstances, including regulatory and commercial considerations 2)
Combined at least 50%
sustainable profit
Organic RWA developments
Modest profitable business growth
Credit quality developments
Modelling and regulatory developments
Dividend pay-out 50%
Other capital uses
Additions to CET1
Special dividends or share buy-backs
Inorganic growth
19
1) Excluding the gain on PB Asia sale the ROE was 13.4% and C/I was 61.2%2) Capital target range to be reviewed at YE2018, to reflect e.g. TRIM and other regulatory developments3) Sustainable profit excludes exceptional items that significantly distort profitability; examples are book gain on PB Asia sale (2017) and provision for SME derivatives (2016). Additional distributions,
special dividends or share buy-backs (subject to regulatory approval), will be considered when capital is within or above the target range, are subject to other circumstances, including regulatory and commercial considerations
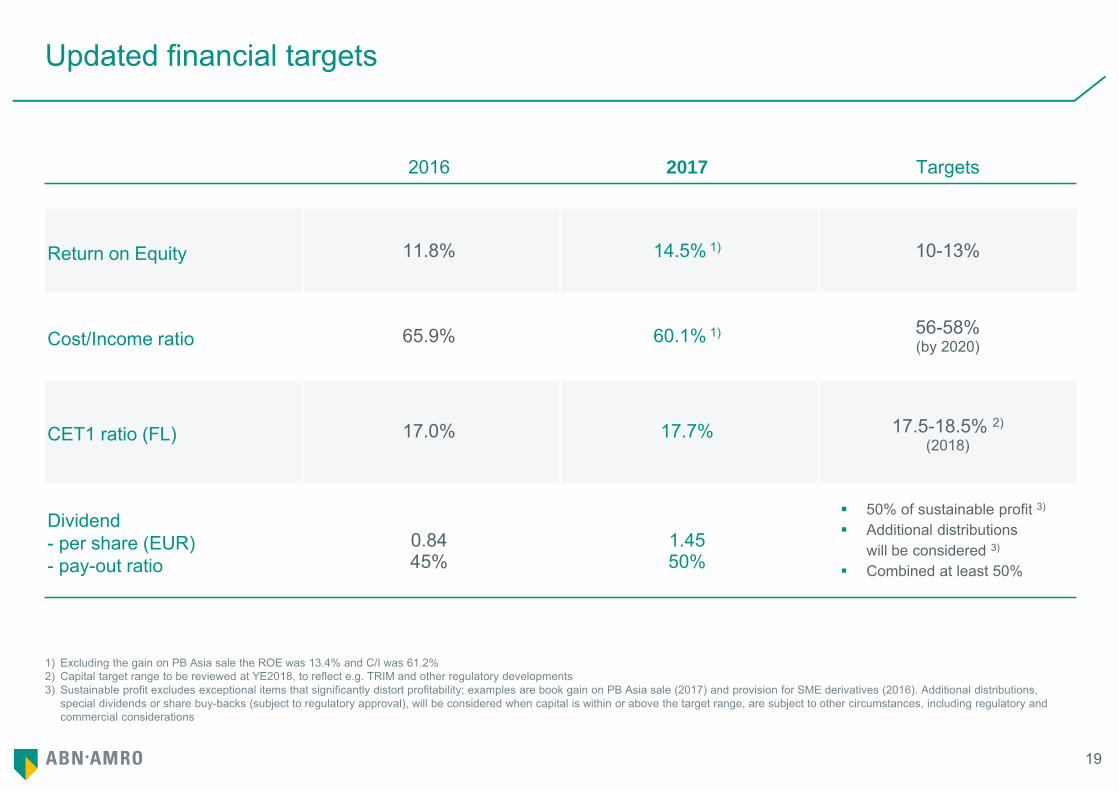
Updated financial targets
2016 2017 Targets
Return on Equity 11.8% 14.5% 1) 10-13%
Cost/Income ratio 65.9% 60.1% 1) 56-58%(by 2020)
CET1 ratio (FL) 17.0% 17.7% 17.5-18.5% 2)
(2018)
Dividend - per share (EUR)- pay-out ratio
0.8445%
1.4550%
50% of sustainable profit 3)
Additional distributionswill be considered 3)
Combined at least 50%

Additional slides

Profile
22
1) Source: ABN AMRO Group Economics, CBS Statline
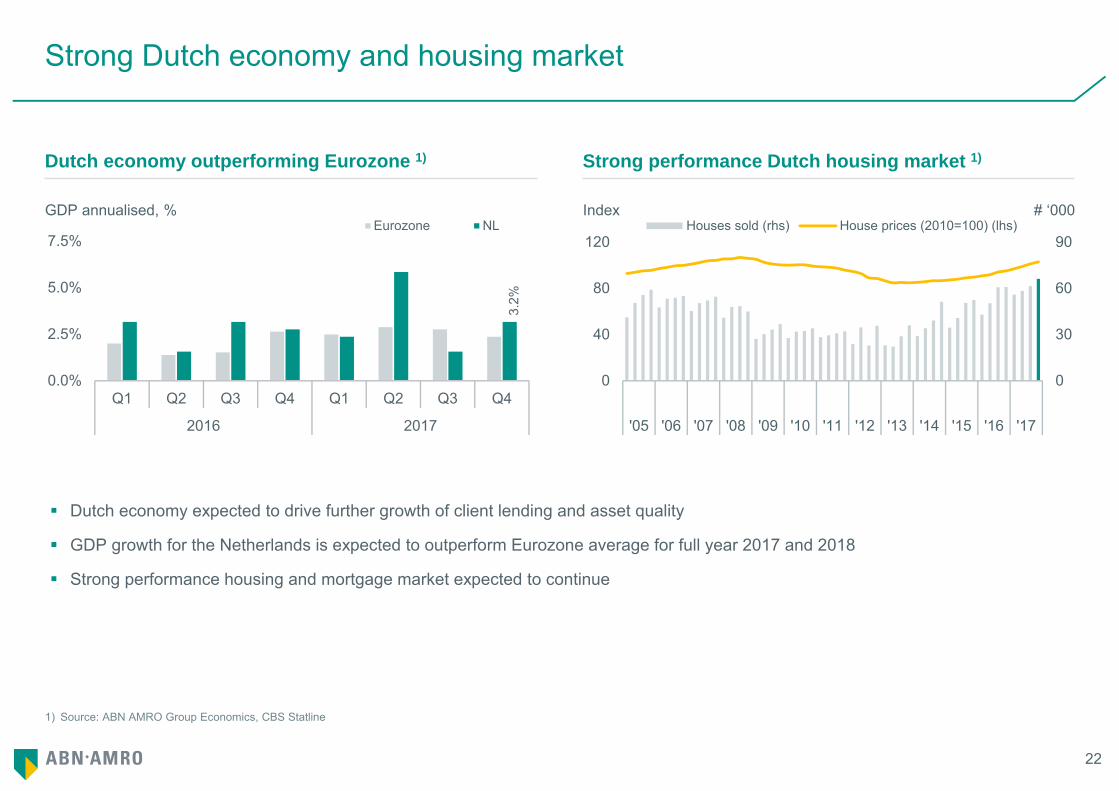
Strong Dutch economy and housing market
3.2%
0.0%
2.5%
5.0%
7.5%
Q1 Q2 Q3 Q4 Q1 Q2 Q3 Q4
2016 2017
Eurozone NL
0
30
60
90
0
40
80
120
'05 '06 '07 '08 '09 '10 '11 '12 '13 '14 '15 '16 '17
Houses sold (rhs) House prices (2010=100) (lhs)
Dutch economy outperforming Eurozone 1) Strong performance Dutch housing market 1)
Dutch economy expected to drive further growth of client lending and asset quality
GDP growth for the Netherlands is expected to outperform Eurozone average for full year 2017 and 2018
Strong performance housing and mortgage market expected to continue
GDP annualised, % Index # ‘000
23
Source: ABN AMRO Group Economics, 9 February 2018
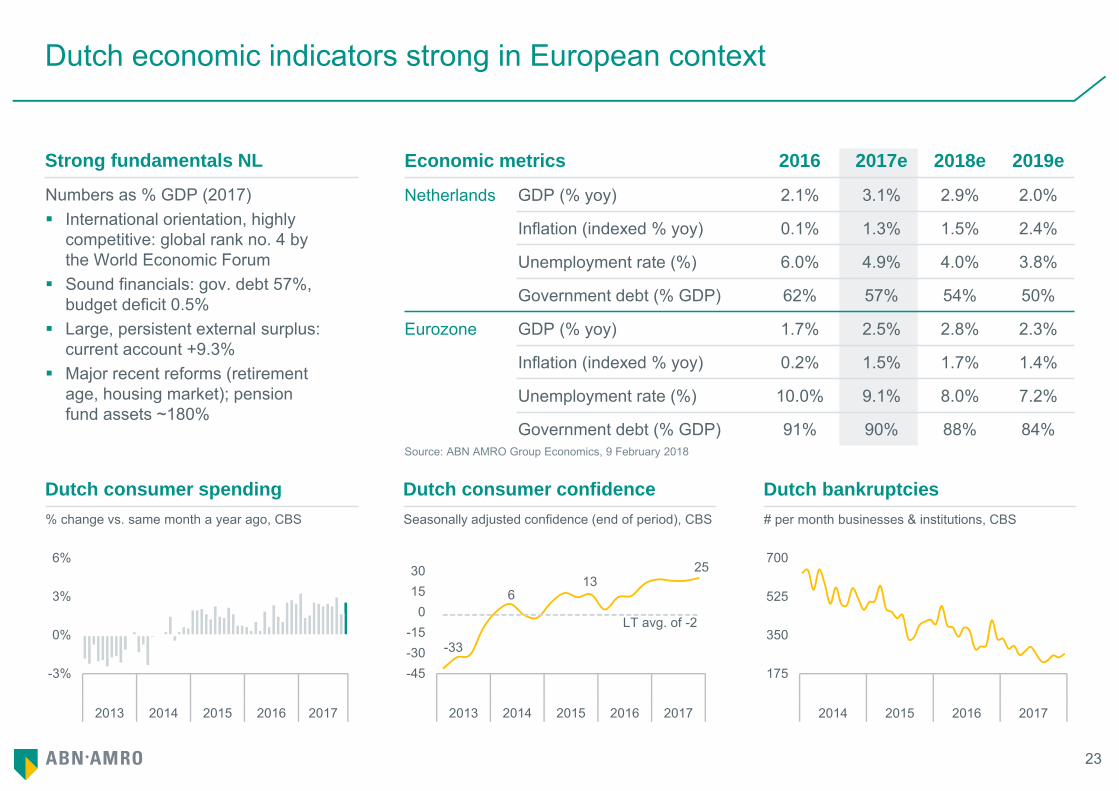
Dutch economic indicators strong in European context
Numbers as % GDP (2017) International orientation, highly
competitive: global rank no. 4 by the World Economic Forum
Sound financials: gov. debt 57%, budget deficit 0.5%
Large, persistent external surplus: current account +9.3%
Major recent reforms (retirement age, housing market); pension fund assets ~180%
Strong fundamentals NL Economic metrics 2016 2017e 2018e 2019e
Netherlands GDP (% yoy) 2.1% 3.1% 2.9% 2.0%
Inflation (indexed % yoy) 0.1% 1.3% 1.5% 2.4%
Unemployment rate (%) 6.0% 4.9% 4.0% 3.8%
Government debt (% GDP) 62% 57% 54% 50%
Eurozone GDP (% yoy) 1.7% 2.5% 2.8% 2.3%
Inflation (indexed % yoy) 0.2% 1.5% 1.7% 1.4%
Unemployment rate (%) 10.0% 9.1% 8.0% 7.2%
Government debt (% GDP) 91% 90% 88% 84%
Dutch consumer spending Dutch consumer confidence% change vs. same month a year ago, CBS Seasonally adjusted confidence (end of period), CBS
-3%
0%
3%
6%
2013 2014 2015 2016 2017
-33
613
25
-45-30-15
01530
2013 2014 2015 2016 2017
LT avg. of -2
Dutch bankruptcies# per month businesses & institutions, CBS
175
350
525
700
2014 2015 2016 2017
24
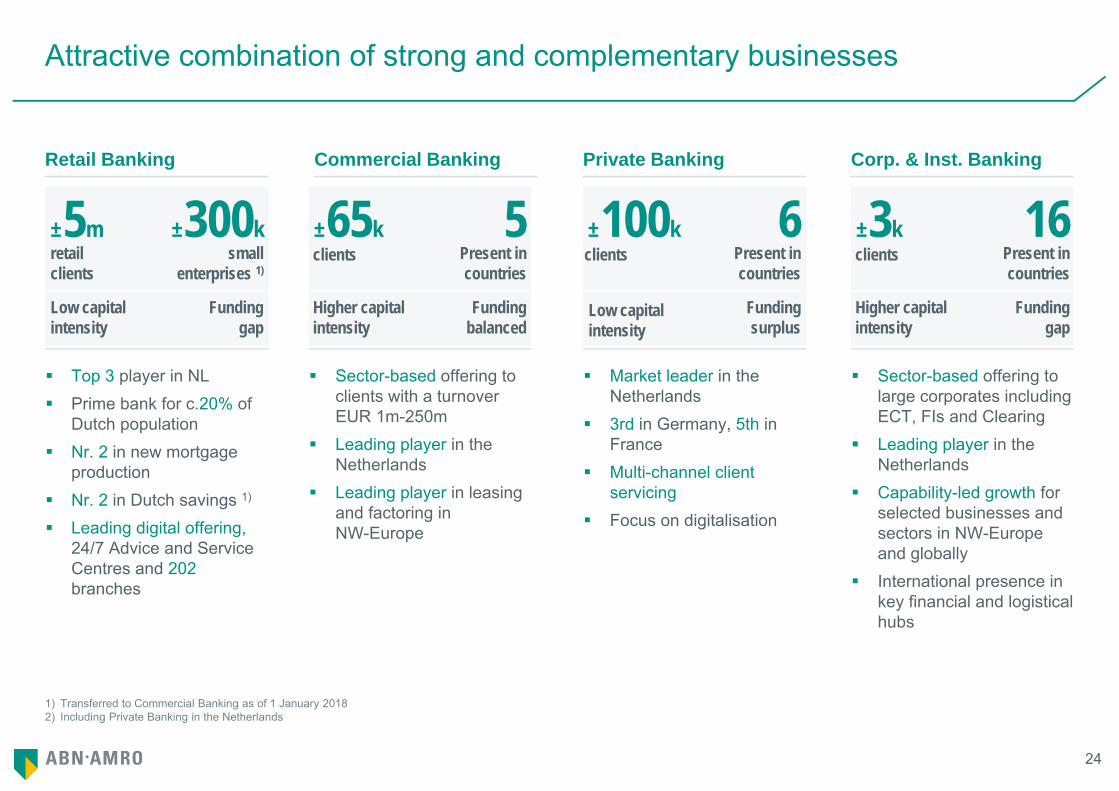
1) Transferred to Commercial Banking as of 1 January 20182) Including Private Banking in the Netherlands
Attractive combination of strong and complementary businesses
Retail Banking Commercial Banking Private Banking
Top 3 player in NL Prime bank for c.20% of
Dutch population Nr. 2 in new mortgage
production Nr. 2 in Dutch savings 1)
Leading digital offering, 24/7 Advice and Service Centres and 202 branches
Market leader in the Netherlands
3rd in Germany, 5th in France
Multi-channel client servicing
Focus on digitalisation
Sector-based offering to clients with a turnover EUR 1m-250m
Leading player in the Netherlands
Leading player in leasing and factoring in NW-Europe
±5m ±300k
Low capital intensity
Funding gap
retail clients
small enterprises 1)
±100k 6Funding surplus
Low capitalintensity
clients Present incountries
±65k 5Higher capital intensity
Funding balanced
clients Present incountries
Corp. & Inst. Banking
Sector-based offering to large corporates including ECT, FIs and Clearing
Leading player in the Netherlands
Capability-led growth for selected businesses and sectors in NW-Europe and globally
International presence in key financial and logistical hubs
±3k 16Higher capital intensity
Funding gap
clients Present incountries
25
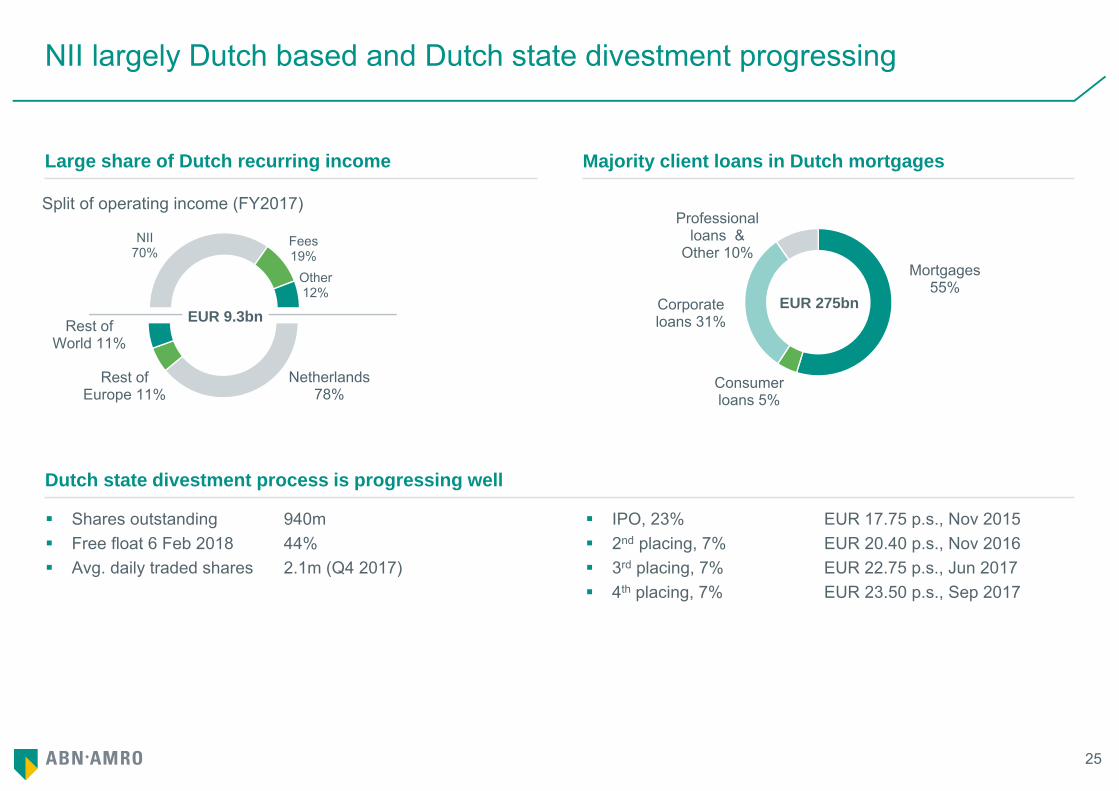
Netherlands 78%
Rest of Europe 11%
Rest of World 11%
NII 70%
Fees 19%
Other 12%
EUR 9.3bn
Split of operating income (FY2017)
NII largely Dutch based and Dutch state divestment progressing
Large share of Dutch recurring income Majority client loans in Dutch mortgages
Shares outstanding 940m Free float 6 Feb 2018 44% Avg. daily traded shares 2.1m (Q4 2017)
Dutch state divestment process is progressing well
IPO, 23% EUR 17.75 p.s., Nov 2015 2nd placing, 7% EUR 20.40 p.s., Nov 2016 3rd placing, 7% EUR 22.75 p.s., Jun 2017 4th placing, 7% EUR 23.50 p.s., Sep 2017
Mortgages 55%
Consumer loans 5%
Corporate loans 31%
Professional loans &
Other 10%
EUR 275bn
26
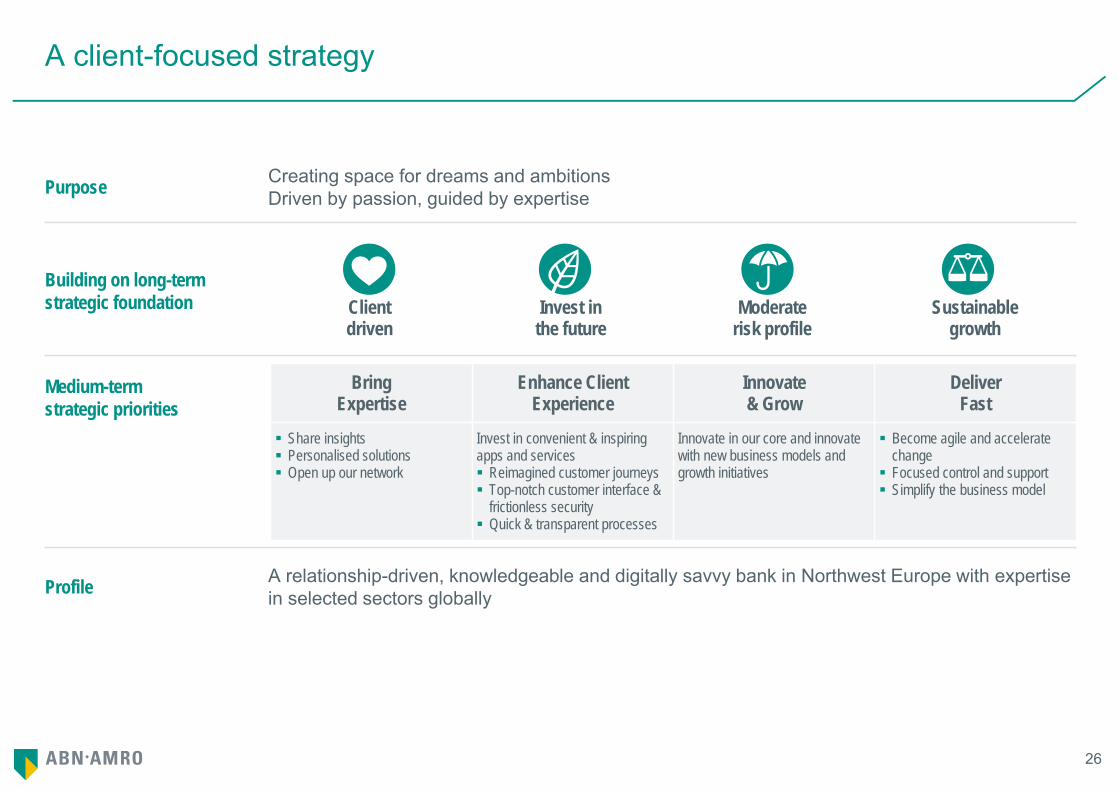
A client-focused strategy
Purpose Creating space for dreams and ambitionsDriven by passion, guided by expertise
Building on long-term strategic foundation Client
drivenInvest in
the futureModerate
risk profileSustainable
growth
Medium-term strategic priorities
Profile A relationship-driven, knowledgeable and digitally savvy bank in Northwest Europe with expertise in selected sectors globally
BringExpertise
Enhance ClientExperience
Innovate & Grow
DeliverFast
Share insights Personalised solutions Open up our network
Invest in convenient & inspiring apps and services Reimagined customer journeys Top-notch customer interface &
frictionless security Quick & transparent processes
Innovate in our core and innovate with new business models and growth initiatives
Become agile and accelerate change Focused control and support Simplify the business model
27
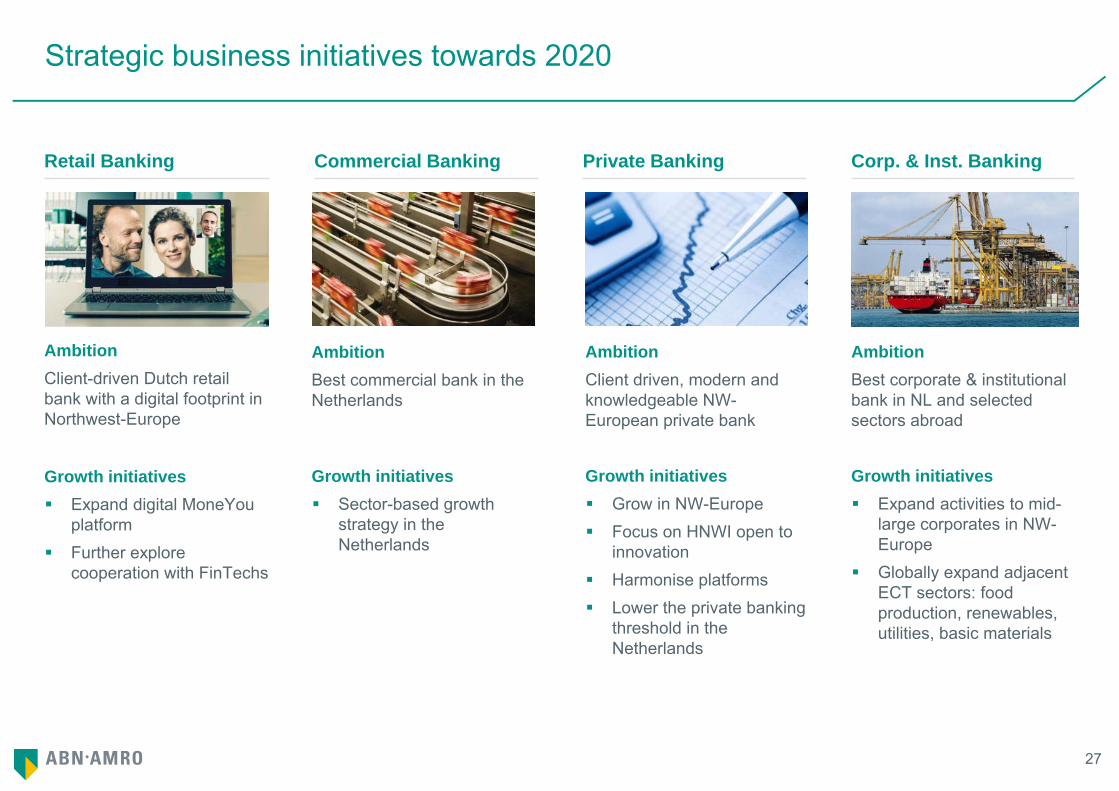
Strategic business initiatives towards 2020
AmbitionClient-driven Dutch retail bank with a digital footprint in Northwest-Europe
Growth initiatives Expand digital MoneYou
platform Further explore
cooperation with FinTechs
AmbitionClient driven, modern and knowledgeable NW-European private bank
Growth initiatives Grow in NW-Europe Focus on HNWI open to
innovation Harmonise platforms Lower the private banking
threshold in the Netherlands
Retail Banking Commercial Banking
AmbitionBest commercial bank in the Netherlands
Growth initiatives Sector-based growth
strategy in the Netherlands
Private Banking Corp. & Inst. Banking
AmbitionBest corporate & institutional bank in NL and selected sectors abroad
Growth initiatives Expand activities to mid-
large corporates in NW-Europe
Globally expand adjacent ECT sectors: food production, renewables, utilities, basic materials
28
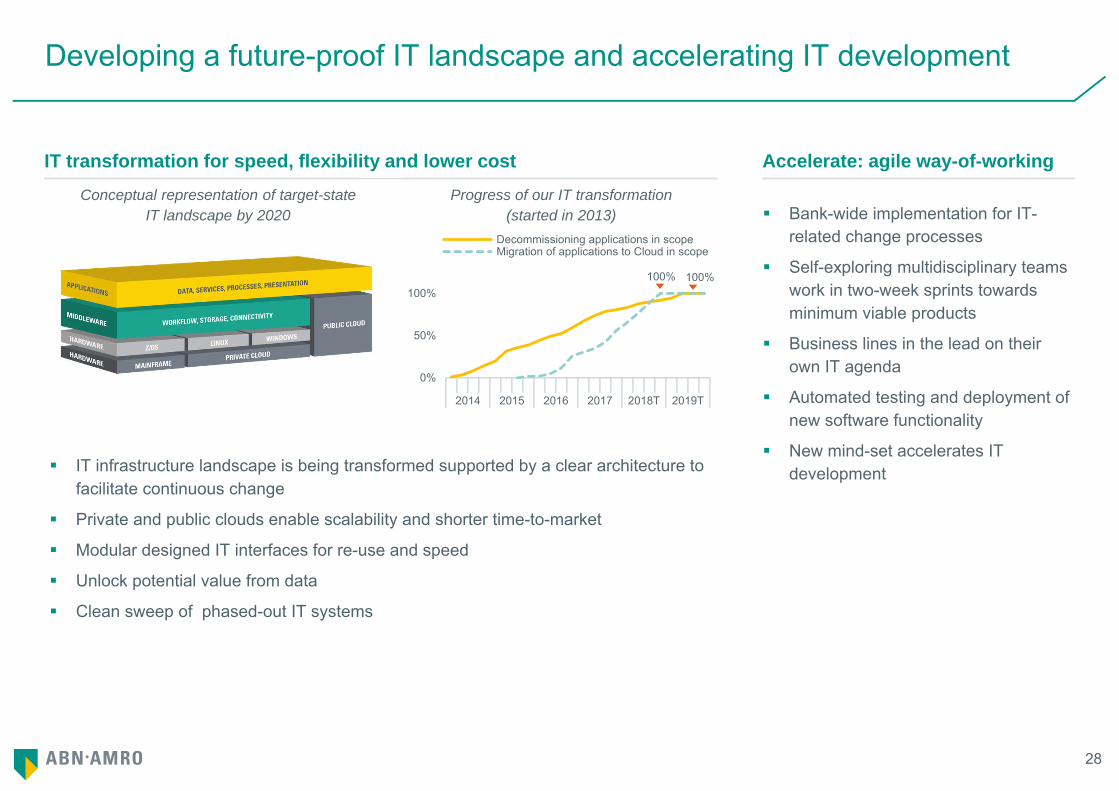
Developing a future-proof IT landscape and accelerating IT development
IT transformation for speed, flexibility and lower cost
IT infrastructure landscape is being transformed supported by a clear architecture to facilitate continuous change
Private and public clouds enable scalability and shorter time-to-market
Modular designed IT interfaces for re-use and speed
Unlock potential value from data
Clean sweep of phased-out IT systems
Bank-wide implementation for IT-related change processes
Self-exploring multidisciplinary teams work in two-week sprints towards minimum viable products
Business lines in the lead on their own IT agenda
Automated testing and deployment of new software functionality
New mind-set accelerates IT development
Accelerate: agile way-of-working
0%
50%
100%
2014 2015 2016 2017 2018T 2019T
Decommissioning applications in scopeMigration of applications to Cloud in scope
Conceptual representation of target-state IT landscape by 2020
Progress of our IT transformation (started in 2013)
100% 100%
29
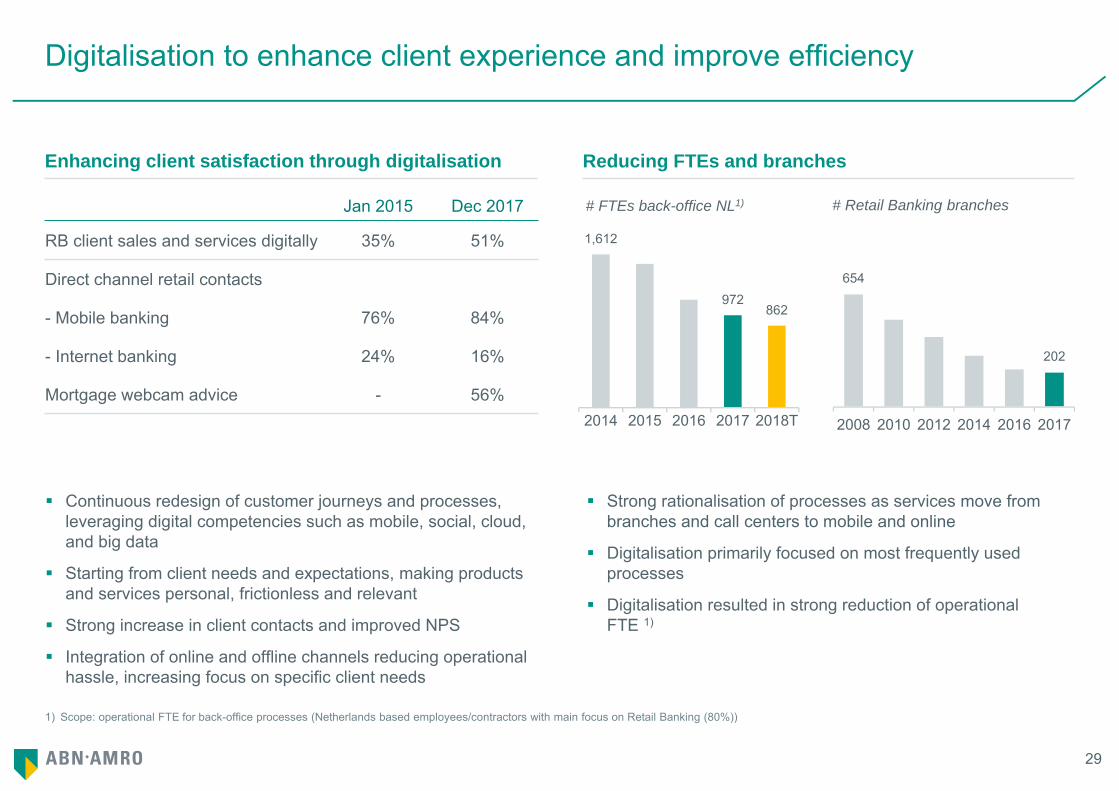
Digitalisation to enhance client experience and improve efficiency
Continuous redesign of customer journeys and processes, leveraging digital competencies such as mobile, social, cloud, and big data
Starting from client needs and expectations, making products and services personal, frictionless and relevant
Strong increase in client contacts and improved NPS
Integration of online and offline channels reducing operational hassle, increasing focus on specific client needs
Enhancing client satisfaction through digitalisation Reducing FTEs and branches
Strong rationalisation of processes as services move from branches and call centers to mobile and online
Digitalisation primarily focused on most frequently used processes
Digitalisation resulted in strong reduction of operational FTE 1)
1,612
972862
2014 2015 2016 2017 2018T
1) Scope: operational FTE for back-office processes (Netherlands based employees/contractors with main focus on Retail Banking (80%))
Jan 2015 Dec 2017
RB client sales and services digitally 35% 51%
Direct channel retail contacts
- Mobile banking 76% 84%
- Internet banking 24% 16%
Mortgage webcam advice - 56%
654
202
2008 2010 2012 2014 2016 2017
# FTEs back-office NL1) # Retail Banking branches
30
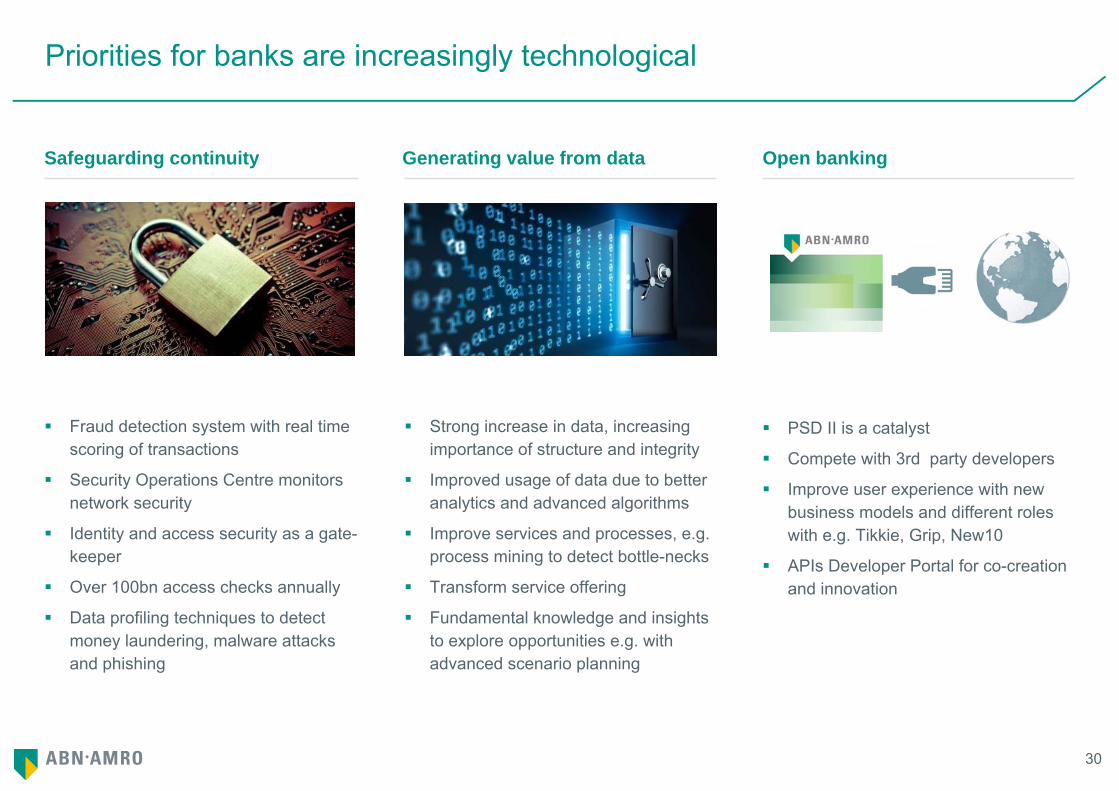
Priorities for banks are increasingly technological
Safeguarding continuity
Fraud detection system with real time scoring of transactions
Security Operations Centre monitors network security
Identity and access security as a gate-keeper
Over 100bn access checks annually
Data profiling techniques to detect money laundering, malware attacks and phishing
Strong increase in data, increasing importance of structure and integrity
Improved usage of data due to better analytics and advanced algorithms
Improve services and processes, e.g. process mining to detect bottle-necks
Transform service offering
Fundamental knowledge and insights to explore opportunities e.g. with advanced scenario planning
PSD II is a catalyst
Compete with 3rd party developers
Improve user experience with new business models and different roles with e.g. Tikkie, Grip, New10
APIs Developer Portal for co-creation and innovation
Generating value from data Open banking
31
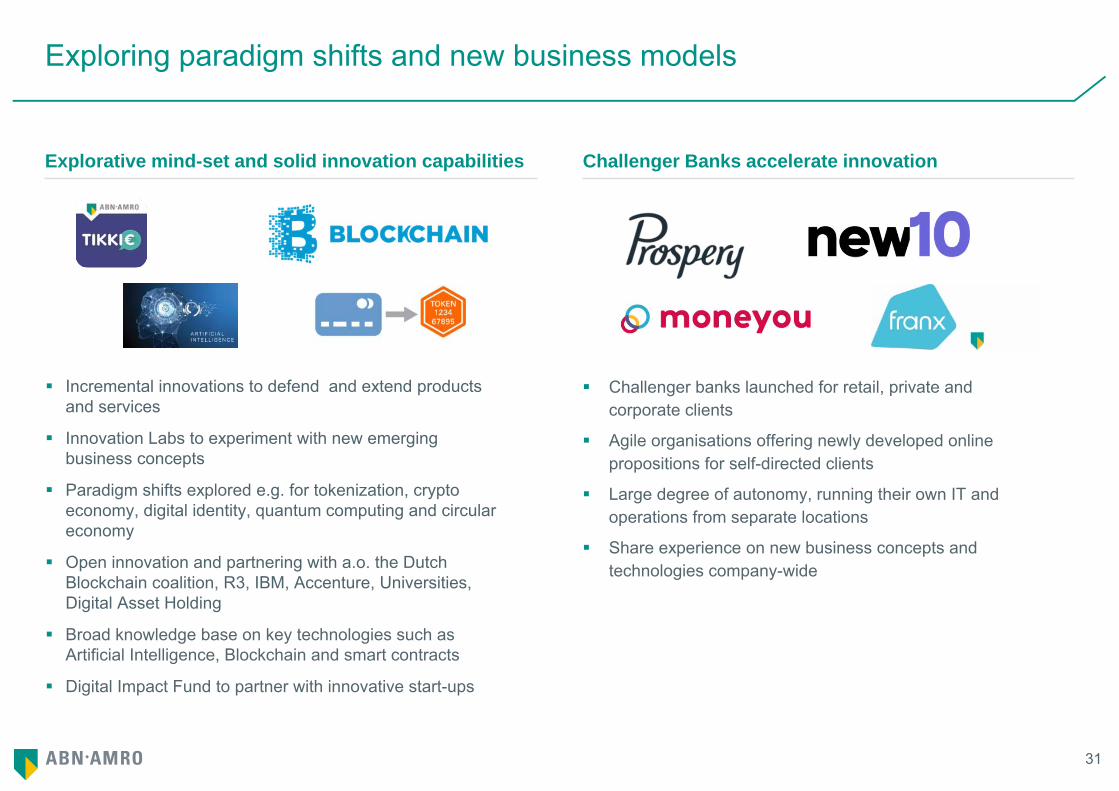
Exploring paradigm shifts and new business models
Incremental innovations to defend and extend products and services
Innovation Labs to experiment with new emerging business concepts
Paradigm shifts explored e.g. for tokenization, crypto economy, digital identity, quantum computing and circular economy
Open innovation and partnering with a.o. the Dutch Blockchain coalition, R3, IBM, Accenture, Universities, Digital Asset Holding
Broad knowledge base on key technologies such as Artificial Intelligence, Blockchain and smart contracts
Digital Impact Fund to partner with innovative start-ups
Challenger banks launched for retail, private and corporate clients
Agile organisations offering newly developed online propositions for self-directed clients
Large degree of autonomy, running their own IT and operations from separate locations
Share experience on new business concepts and technologies company-wide
Explorative mind-set and solid innovation capabilities Challenger Banks accelerate innovation
32
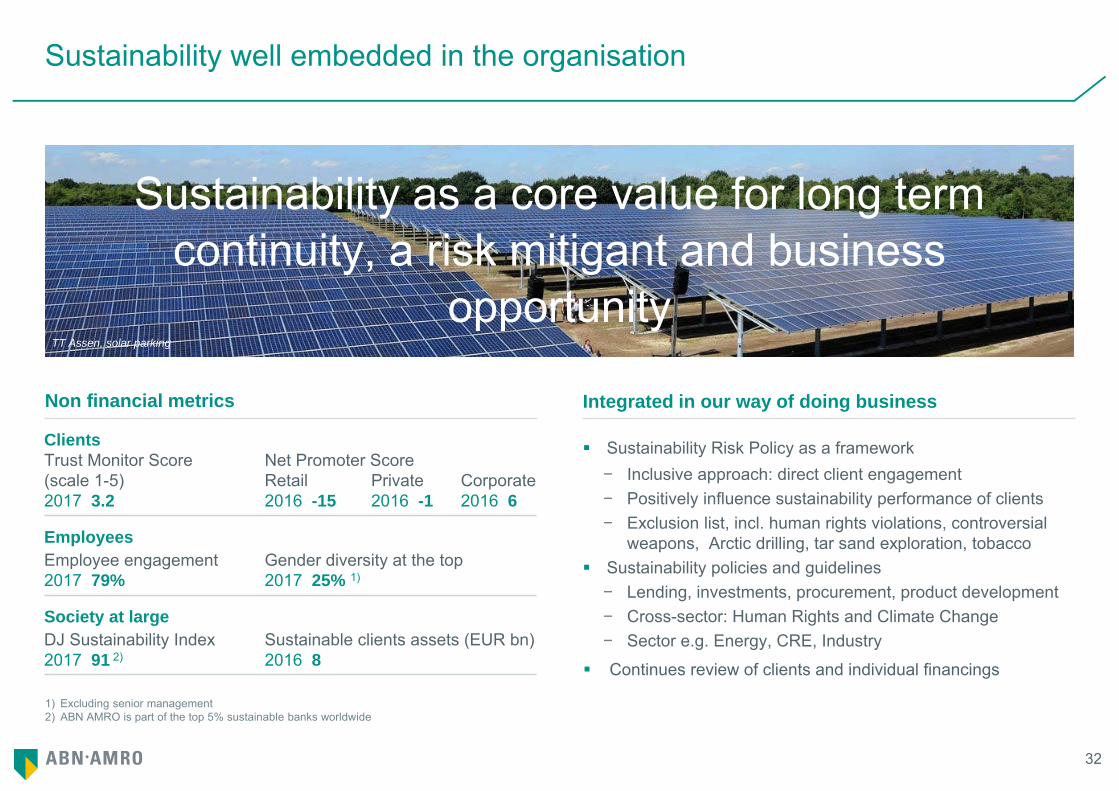
Sustainability as a core value for long term continuity, a risk mitigant and business
opportunity
1) Excluding senior management2) ABN AMRO is part of the top 5% sustainable banks worldwide
Sustainability well embedded in the organisation
Sustainability Risk Policy as a framework − Inclusive approach: direct client engagement − Positively influence sustainability performance of clients − Exclusion list, incl. human rights violations, controversial
weapons, Arctic drilling, tar sand exploration, tobacco Sustainability policies and guidelines
− Lending, investments, procurement, product development − Cross-sector: Human Rights and Climate Change− Sector e.g. Energy, CRE, Industry
Continues review of clients and individual financings
Integrated in our way of doing business Non financial metrics
ClientsTrust Monitor Score Net Promoter Score(scale 1-5) Retail Private Corporate2017 3.2 2016 -15 2016 -1 2016 6
EmployeesEmployee engagement Gender diversity at the top 2017 79% 2017 25% 1)
Society at largeDJ Sustainability Index Sustainable clients assets (EUR bn)2017 91 2) 2016 8
TT Assen, solar parking
33
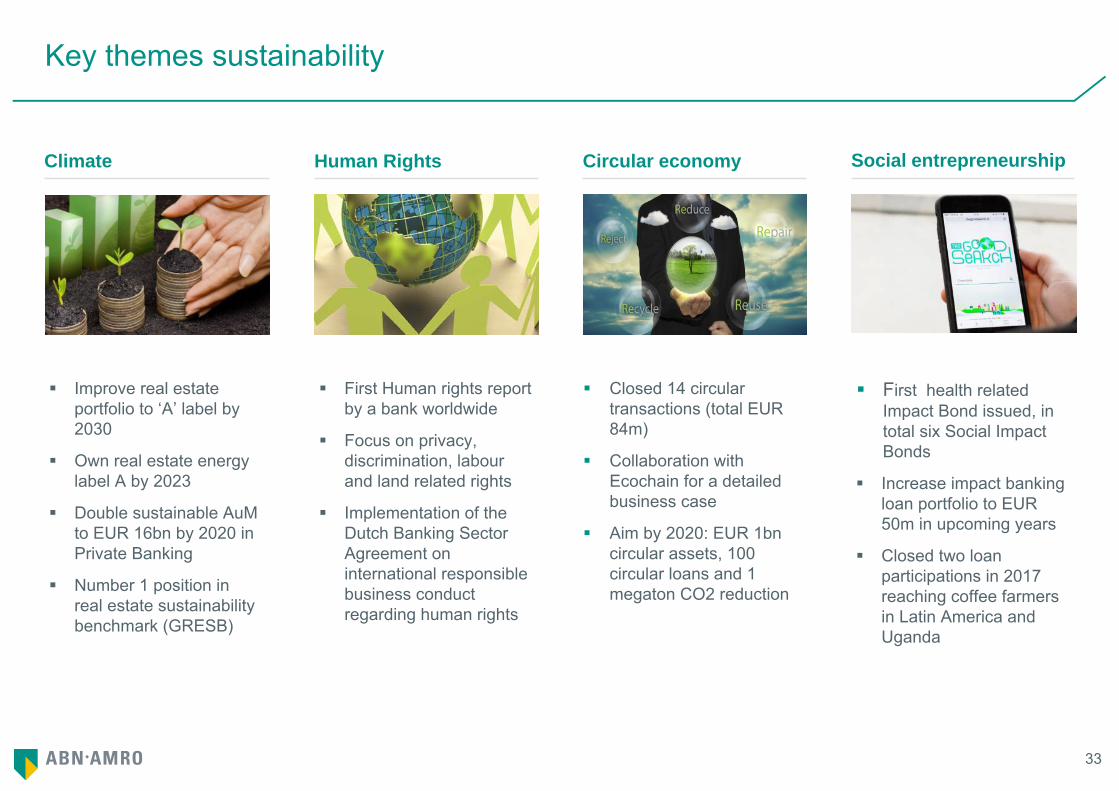
Key themes sustainability
Climate Human Rights
Improve real estate portfolio to ‘A’ label by 2030
Own real estate energy label A by 2023
Double sustainable AuMto EUR 16bn by 2020 in Private Banking
Number 1 position in real estate sustainability benchmark (GRESB)
Circular economy Social entrepreneurship
First Human rights report by a bank worldwide
Focus on privacy, discrimination, labour and land related rights
Implementation of the Dutch Banking Sector Agreement on international responsible business conduct regarding human rights
Closed 14 circular transactions (total EUR 84m)
Collaboration with Ecochain for a detailed business case
Aim by 2020: EUR 1bn circular assets, 100 circular loans and 1 megaton CO2 reduction
First health related Impact Bond issued, in total six Social Impact Bonds
Increase impact banking loan portfolio to EUR 50m in upcoming years
Closed two loan participations in 2017 reaching coffee farmers in Latin America and Uganda
34
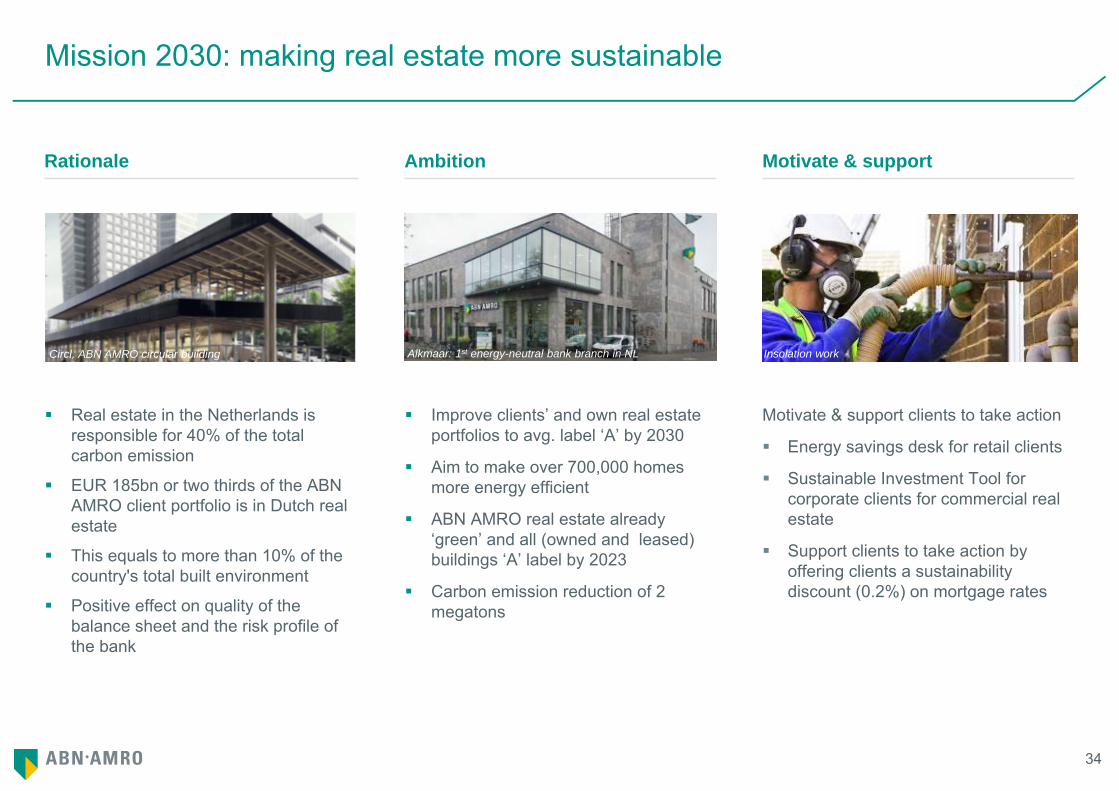
Mission 2030: making real estate more sustainable
Rationale Ambition
Real estate in the Netherlands is responsible for 40% of the total carbon emission
EUR 185bn or two thirds of the ABN AMRO client portfolio is in Dutch real estate
This equals to more than 10% of the country's total built environment
Positive effect on quality of the balance sheet and the risk profile of the bank
Motivate & support
Improve clients’ and own real estate portfolios to avg. label ‘A’ by 2030
Aim to make over 700,000 homes more energy efficient
ABN AMRO real estate already ‘green’ and all (owned and leased) buildings ‘A’ label by 2023
Carbon emission reduction of 2 megatons
Motivate & support clients to take action
Energy savings desk for retail clients
Sustainable Investment Tool for corporate clients for commercial real estate
Support clients to take action by offering clients a sustainability discount (0.2%) on mortgage rates
Alkmaar: 1st energy-neutral bank branch in NLCircl, ABN AMRO circular building Insolation work
35
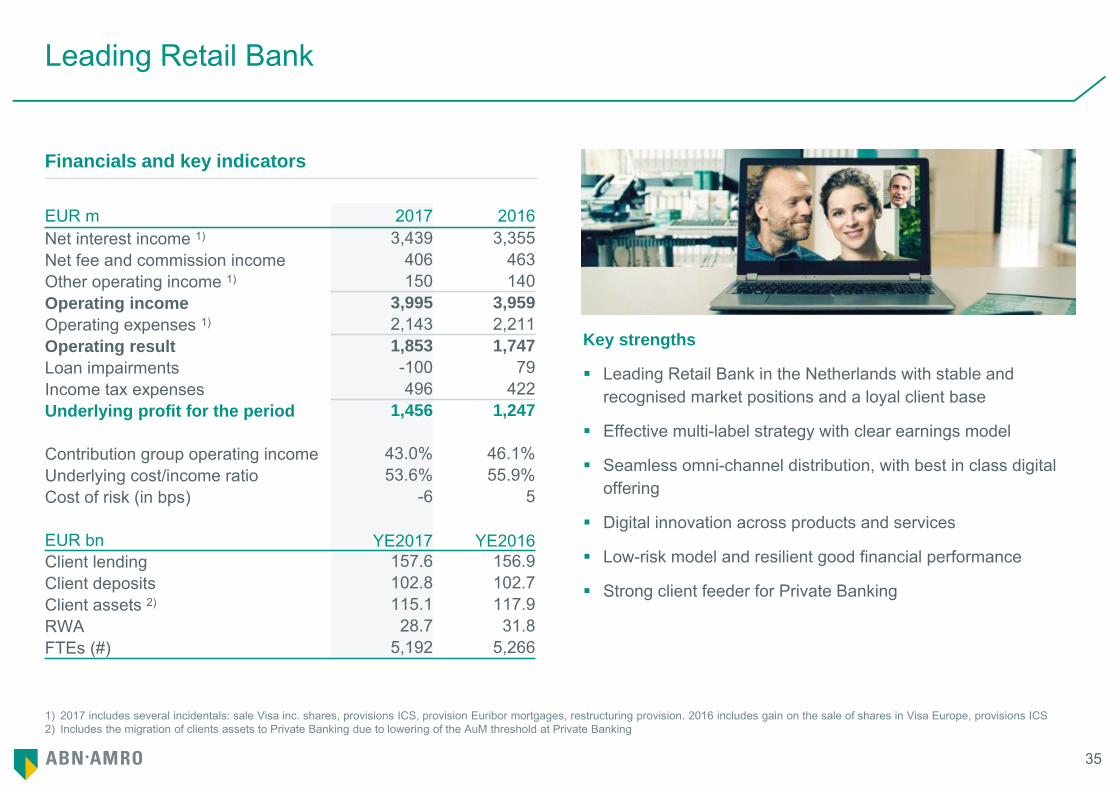
Leading Retail Bank
Key strengths
Leading Retail Bank in the Netherlands with stable and recognised market positions and a loyal client base
Effective multi-label strategy with clear earnings model
Seamless omni-channel distribution, with best in class digital offering
Digital innovation across products and services
Low-risk model and resilient good financial performance
Strong client feeder for Private Banking
Financials and key indicators Financials and key indicators
EUR m 2017 2016Net interest income 1) 3,439 3,355Net fee and commission income 406 463Other operating income 1) 150 140Operating income 3,995 3,959Operating expenses 1) 2,143 2,211Operating result 1,853 1,747Loan impairments -100 79Income tax expenses 496 422Underlying profit for the period 1,456 1,247
Contribution group operating income 43.0% 46.1%Underlying cost/income ratio 53.6% 55.9%Cost of risk (in bps) -6 5
EUR bn YE2017 YE2016Client lending 157.6 156.9Client deposits 102.8 102.7Client assets 2) 115.1 117.9RWA 28.7 31.8FTEs (#) 5,192 5,266
1) 2017 includes several incidentals: sale Visa inc. shares, provisions ICS, provision Euribor mortgages, restructuring provision. 2016 includes gain on the sale of shares in Visa Europe, provisions ICS2) Includes the migration of clients assets to Private Banking due to lowering of the AuM threshold at Private Banking
36
1) 2017 includes several incidentals: favorable unearned interest releases, T-LTRO benefit, restructuring provision.
Sector oriented Commercial Banking
Key strengths
Leading market positions and strong brand name
Sector oriented client portfolio and dedicated sector approach
Relationship-driven business model
Product expertise and capabilities
Risk reward steering and hurdle discipline
Strict credit risk management and monitoring
Growth focus leasing and factoring in NW-Europe
Financials and key indicators Financials and key indicators
EUR m 2017 2016Net interest income 1) 1,421 1,349Net fee and commission income 202 202Other operating income 63 57Operating income 1,687 1,608Operating expenses 1) 888 860Operating result 798 748Loan impairments -180 -179Income tax expenses 245 233Underlying profit for the period 733 694
Contribution group operating income 18.2% 18.7%Underlying cost/income ratio 52.7% 53.5%Cost of risk (in bps) -45 -46
EUR bn YE2017 YE2016Client lending 39.6 38.6Client deposits 35.7 34.9RWA 23.8 20.6FTEs (#) 2,773 2,751
37
1) 2017 includes several incidentals: sale of PB Asia, provision Euribor mortgages, goodwill impairments PBI, a favourable insurance claim settlement, restructuring provision. 2016 includes a provision release related to Swiss Private Banking activities in 2011, an insurance claim settlement
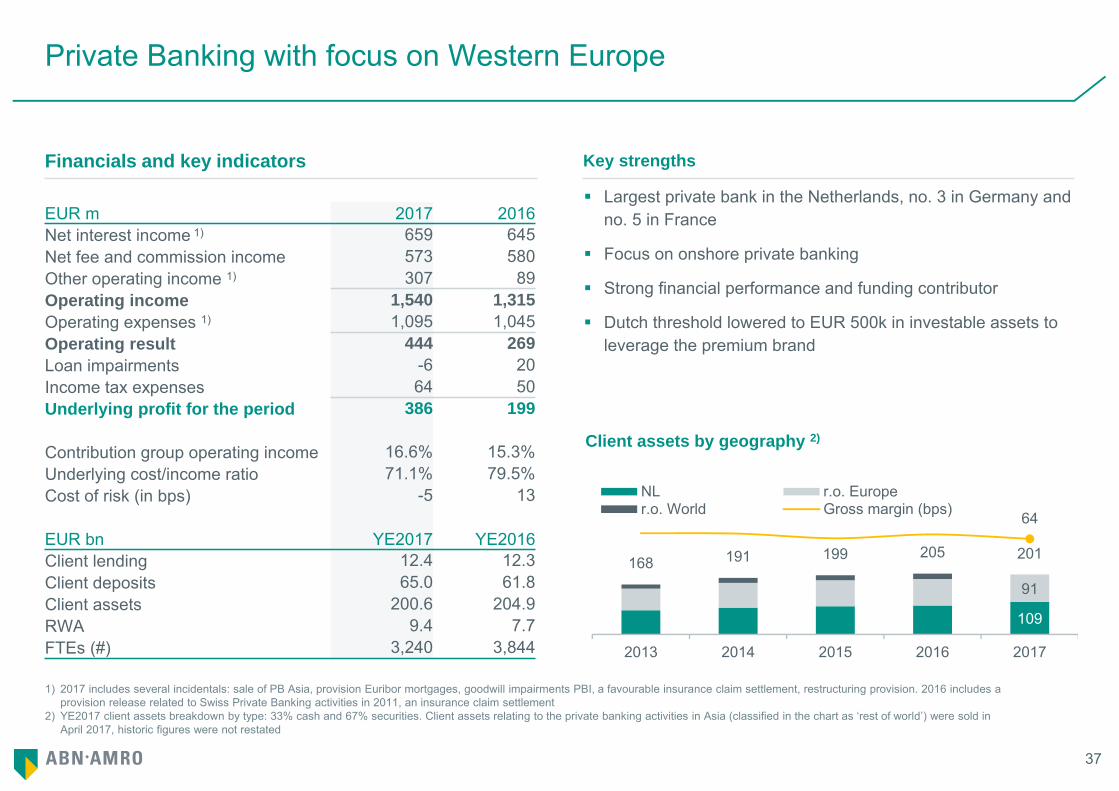
2) YE2017 client assets breakdown by type: 33% cash and 67% securities. Client assets relating to the private banking activities in Asia (classified in the chart as ‘rest of world’) were sold in April 2017, historic figures were not restated
Private Banking with focus on Western Europe
Largest private bank in the Netherlands, no. 3 in Germany and no. 5 in France
Focus on onshore private banking
Strong financial performance and funding contributor
Dutch threshold lowered to EUR 500k in investable assets to leverage the premium brand
Financials and key indicators Key strengths
EUR m 2017 2016Net interest income 1) 659 645Net fee and commission income 573 580Other operating income 1) 307 89Operating income 1,540 1,315Operating expenses 1) 1,095 1,045Operating result 444 269Loan impairments -6 20Income tax expenses 64 50Underlying profit for the period 386 199
Contribution group operating income 16.6% 15.3%Underlying cost/income ratio 71.1% 79.5%Cost of risk (in bps) -5 13
EUR bn YE2017 YE2016Client lending 12.4 12.3Client deposits 65.0 61.8Client assets 200.6 204.9RWA 9.4 7.7FTEs (#) 3,240 3,844
Client assets by geography 2)
109
91
168 191 199 205 201
64
2013 2014 2015 2016 2017
NL r.o. Europer.o. World Gross margin (bps)
38
Corporate & Institutional Banking with selective international presence
Key strengths
Sector oriented client portfolio and dedicated sector approach
Leading market positions and strong brand name
Relationship-driven business model
Product expertise and capabilities
Risk reward steering and hurdle discipline
Strict credit risk management and monitoring
Selective strategic growth areas
Financials and key indicators Financials and key indicators
EUR m 2017 2016Net interest income 1) 975 931Net fee and commission income 538 549Other operating income 1) 317 118Operating income 1,830 1,598Operating expenses 1) 1,269 1,135Operating result 561 463Loan impairments 219 210Income tax expenses 1) 121 71Underlying profit for the period 221 182
Contribution group operating income 19.7% 18.6%Underlying cost/income ratio 69.3% 71.0%Cost of risk (in bps) 38 41
EUR bn YE2017 YE2016Client lending 38.9 38.3Client deposits 18.0 15.7Professional lending 21.3 16.5Professional deposits 12.3 11.7RWA 37.7 34.3FTEs (#) 2,542 2,387
1) 2017 includes several incidentals: provisions and project costs for SME derivatives, favorable unearned interest releases, T-LTRO benefit, a restructuring provision and DTA impact US tax reform. 2016 includes: provisions and project costs for SME derivatives
39
Group Functions for central support functions
Group Functions supports and controls the businesses
Through various disciplines: Strategy & Sustainability, Technology & Innovation, Finance incl. ALM & Treasury, Risk Management, Legal & Compliance, Group Audit, Communication and Human Resources
Financials and key indicators
EUR m 2017 2016Net interest income 1) -38 -2Net fee and commission income 28 15Other operating income 1) 248 96Operating income 238 108Operating expenses 1) 187 405Operating result 51 -297Loan impairments 4 -15Income tax expenses 52 -36Underlying profit for the period -4 -245
EUR bn YE2017 YE2016Loans & Receivables Customers 6.6 7.8Due to Customers 2.9 1.8RWA 6.5 9.8FTEs (#) 6,206 7,416
1) 2017 includes several incidentals: release mortgage penalty interest, restructuring provisions, impairment on the ATM network and a discontinued SecFin provision release. 2016 includes restructuring provisions, a positive revaluation related to Equens and a gain on the sale of shares in Visa Europe

Financials
41
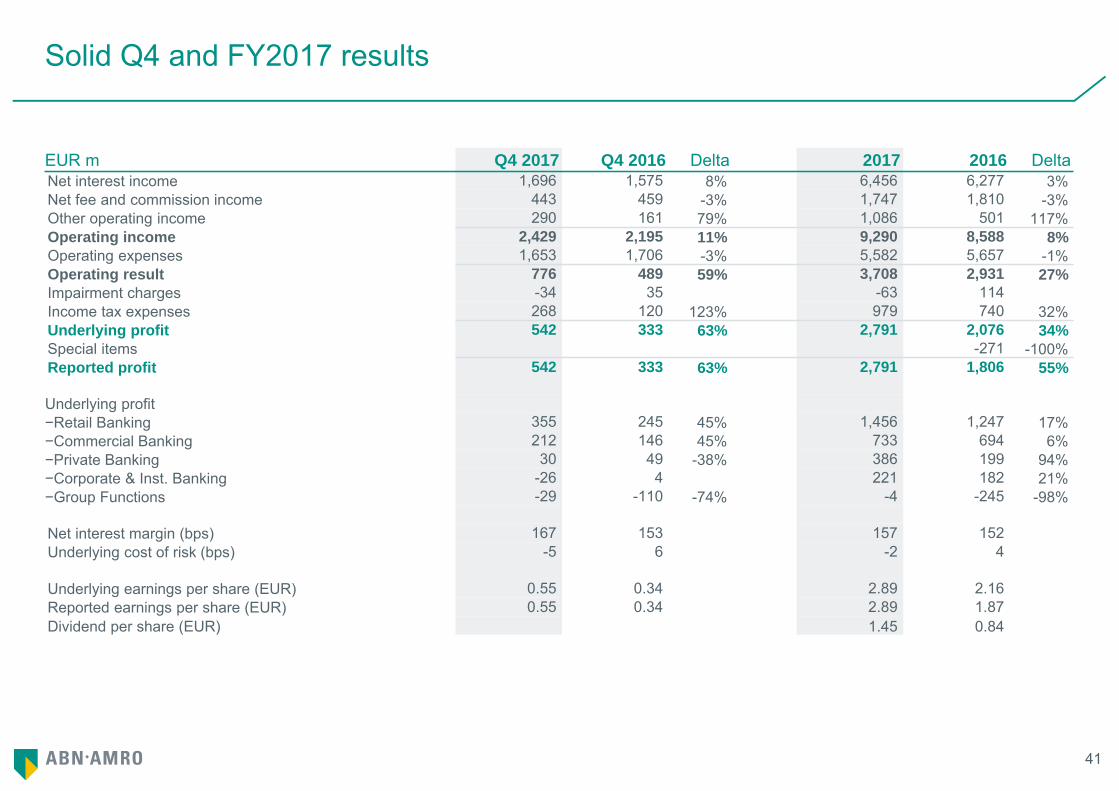
Solid Q4 and FY2017 results
EUR m Q4 2017 Q4 2016 Delta 2017 2016 DeltaNet interest income 1,696 1,575 8% 6,456 6,277 3%Net fee and commission income 443 459 -3% 1,747 1,810 -3%Other operating income 290 161 79% 1,086 501 117%Operating income 2,429 2,195 11% 9,290 8,588 8%Operating expenses 1,653 1,706 -3% 5,582 5,657 -1%Operating result 776 489 59% 3,708 2,931 27%Impairment charges -34 35 -63 114Income tax expenses 268 120 123% 979 740 32%Underlying profit 542 333 63% 2,791 2,076 34%Special items -271 -100%Reported profit 542 333 63% 2,791 1,806 55%
Underlying profit−Retail Banking 355 245 45% 1,456 1,247 17%−Commercial Banking 212 146 45% 733 694 6%−Private Banking 30 49 -38% 386 199 94%−Corporate & Inst. Banking -26 4 221 182 21%−Group Functions -29 -110 -74% -4 -245 -98%
Net interest margin (bps) 167 153 157 152Underlying cost of risk (bps) -5 6 -2 4
Underlying earnings per share (EUR) 0.55 0.34 2.89 2.16Reported earnings per share (EUR) 0.55 0.34 2.89 1.87Dividend per share (EUR) 1.45 0.84
42
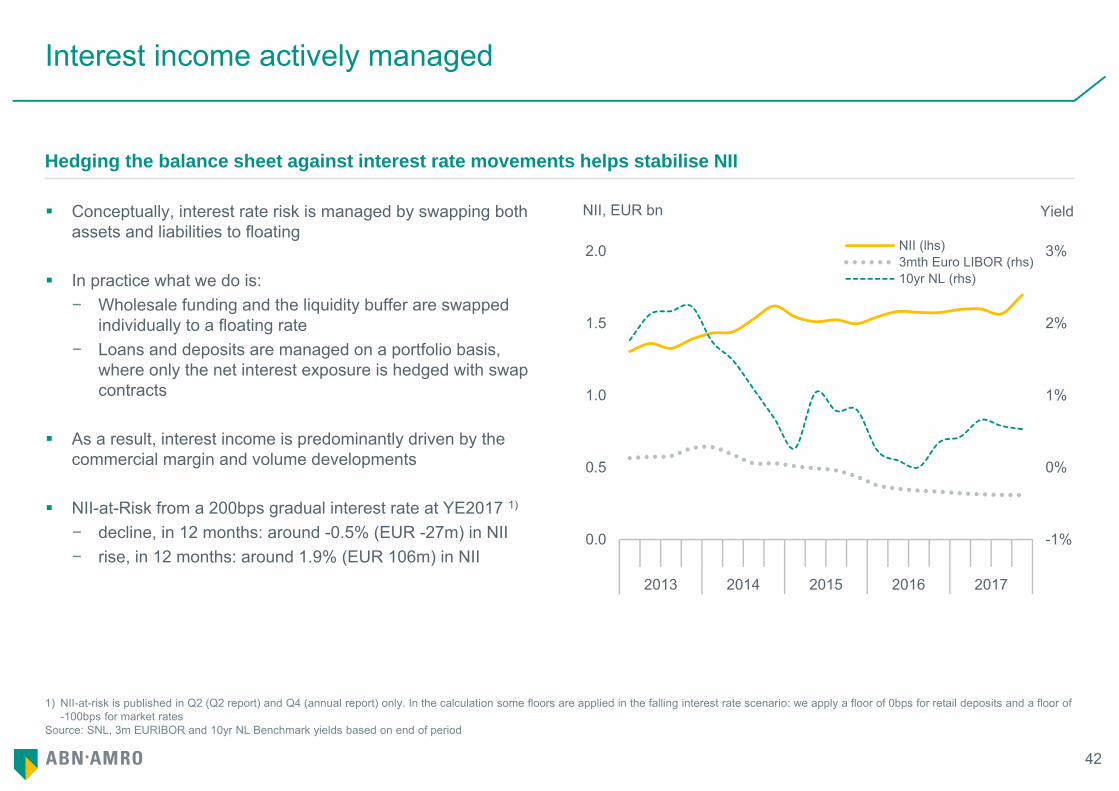
1) NII-at-risk is published in Q2 (Q2 report) and Q4 (annual report) only. In the calculation some floors are applied in the falling interest rate scenario: we apply a floor of 0bps for retail deposits and a floor of -100bps for market rates
Source: SNL, 3m EURIBOR and 10yr NL Benchmark yields based on end of period
Interest income actively managed
Hedging the balance sheet against interest rate movements helps stabilise NII
NII, EUR bn Yield
-1%
0%
1%
2%
3%
0.0
0.5
1.0
1.5
2.0
2013 2014 2015 2016 2017
NII (lhs)3mth Euro LIBOR (rhs)10yr NL (rhs)
Conceptually, interest rate risk is managed by swapping both assets and liabilities to floating
In practice what we do is:− Wholesale funding and the liquidity buffer are swapped
individually to a floating rate− Loans and deposits are managed on a portfolio basis,
where only the net interest exposure is hedged with swap contracts
As a result, interest income is predominantly driven by the commercial margin and volume developments
NII-at-Risk from a 200bps gradual interest rate at YE2017 1)
− decline, in 12 months: around -0.5% (EUR -27m) in NII− rise, in 12 months: around 1.9% (EUR 106m) in NII
43
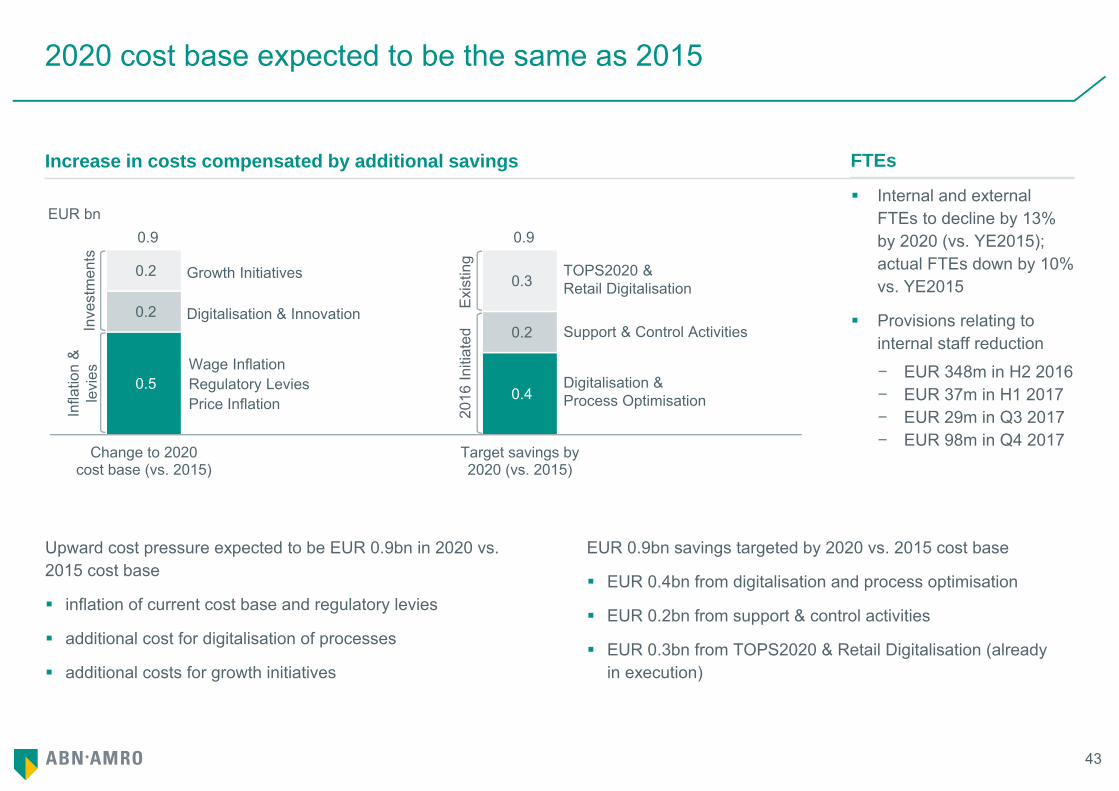
2020 cost base expected to be the same as 2015
0.5
0.2
0.2
0.4
0.2
0.3
0.9 0.9
Change to 2020cost base (vs. 2015)
Target savings by2020 (vs. 2015)
EUR bn
Inve
stm
ents
Infla
tion
&
levi
es
Exi
stin
g20
16 In
itiat
ed Support & Control Activities
TOPS2020 & Retail Digitalisation
Digitalisation & Process Optimisation
Wage InflationRegulatory LeviesPrice Inflation
Growth Initiatives
Digitalisation & Innovation
Upward cost pressure expected to be EUR 0.9bn in 2020 vs. 2015 cost base
inflation of current cost base and regulatory levies
additional cost for digitalisation of processes
additional costs for growth initiatives
Increase in costs compensated by additional savings
EUR 0.9bn savings targeted by 2020 vs. 2015 cost base
EUR 0.4bn from digitalisation and process optimisation
EUR 0.2bn from support & control activities
EUR 0.3bn from TOPS2020 & Retail Digitalisation (already in execution)
FTEs
Internal and external FTEs to decline by 13% by 2020 (vs. YE2015); actual FTEs down by 10% vs. YE2015
Provisions relating to internal staff reduction
− EUR 348m in H2 2016− EUR 37m in H1 2017− EUR 29m in Q3 2017− EUR 98m in Q4 2017

Risk management
45
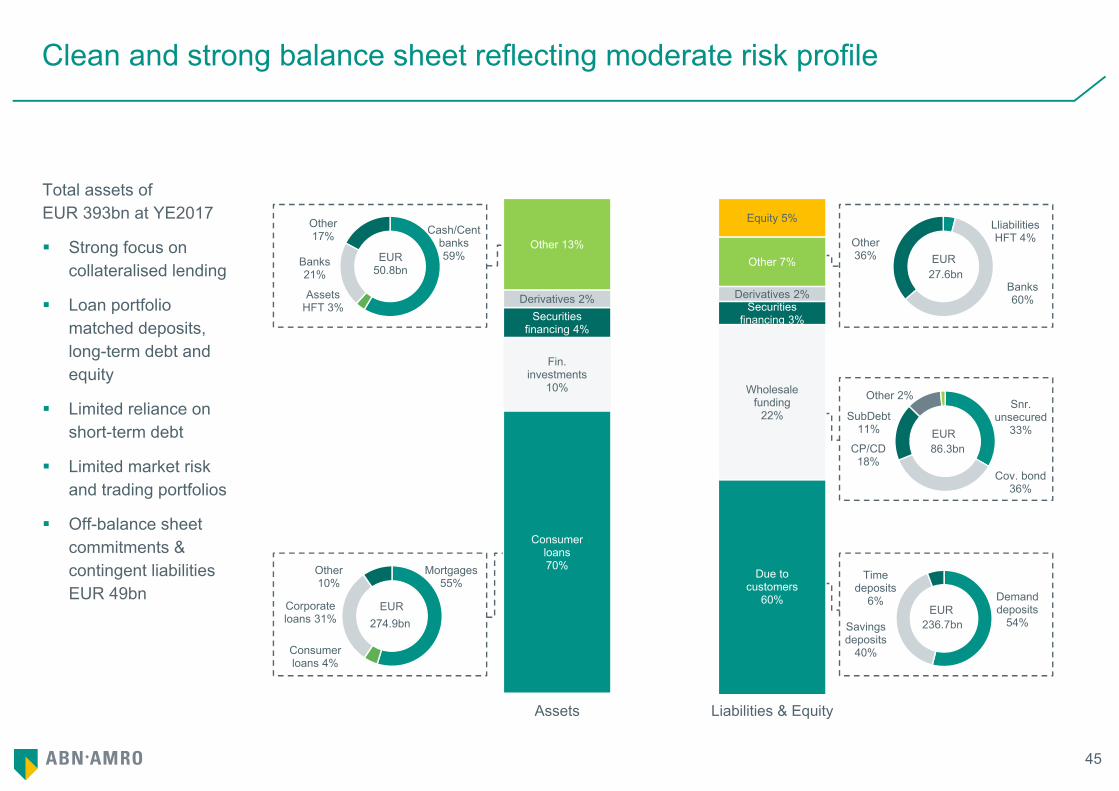
Clean and strong balance sheet reflecting moderate risk profile
Total assets of EUR 393bn at YE2017
Strong focus on collateralised lending
Loan portfolio matched deposits, long-term debt and equity
Limited reliance on short-term debt
Limited market risk and trading portfolios
Off-balance sheet commitments & contingent liabilities EUR 49bn
Mortgages 55%
Consumer loans 4%
Corporate loans 31%
Other 10%
274.9bnEUR
Cash/Cent banks 59%
Assets HFT 3%
Banks 21%
Other 17%
50.8bnEUR
Snr. unsecured
33%
Cov. bond 36%
CP/CD 18%
SubDebt 11%
Other 2%
86.3bnEUR
Lliabilities HFT 4%
Banks 60%
Other 36%
27.6bnEUR
Consumer loans70%
Fin. investments
10%
Securities financing 4%
Derivatives 2%
Other 13%
Due to customers
60%
Wholesale funding
22%
Securities financing 3%
Derivatives 2%
Other 7%
Equity 5%
Assets Liabilities & Equity
Demand deposits
54%Savings deposits
40%
Time deposits
6%
236.7bnEUR
46
Impaired Impaired ImpairedCoverage Coverage Coverage
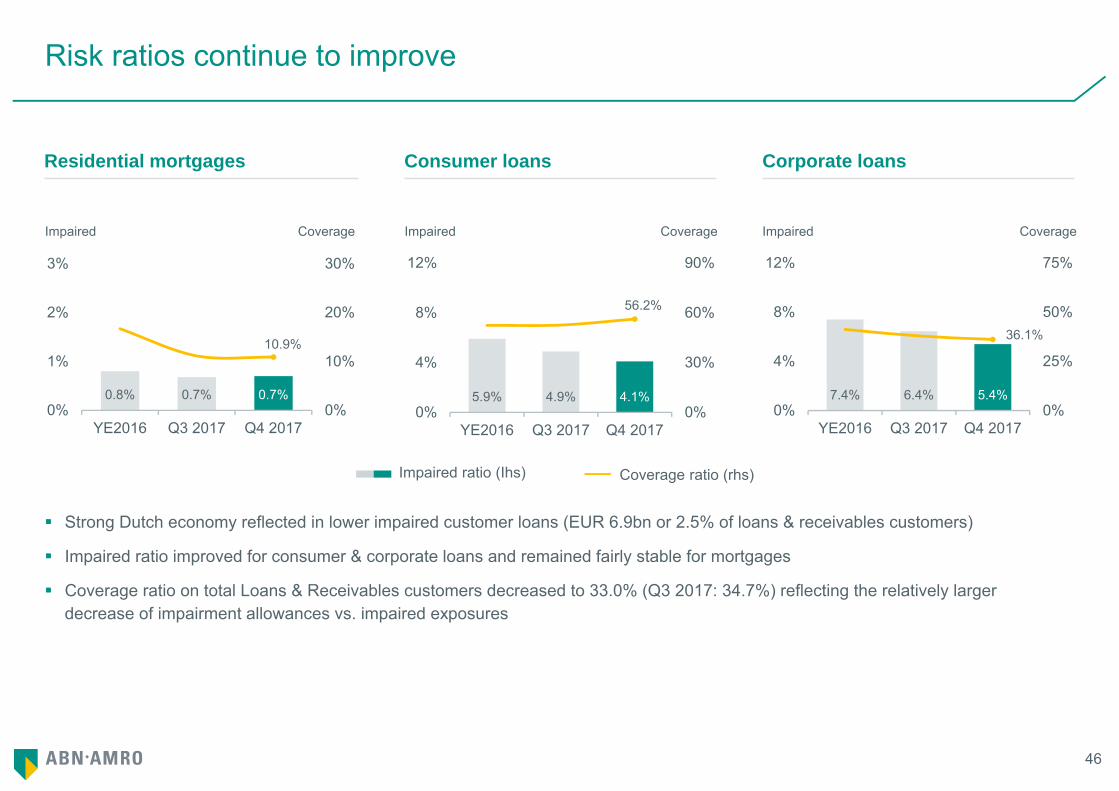
Risk ratios continue to improve
Residential mortgages Consumer loans
Strong Dutch economy reflected in lower impaired customer loans (EUR 6.9bn or 2.5% of loans & receivables customers)
Impaired ratio improved for consumer & corporate loans and remained fairly stable for mortgages
Coverage ratio on total Loans & Receivables customers decreased to 33.0% (Q3 2017: 34.7%) reflecting the relatively larger decrease of impairment allowances vs. impaired exposures
Corporate loans
Impaired ratio (Ihs) Coverage ratio (rhs)
0.8% 0.7% 0.7%
10.9%
0%
10%
20%
30%
0%
1%
2%
3%
YE2016 Q3 2017 Q4 2017
5.9% 4.9% 4.1%
56.2%
0%
30%
60%
90%
0%
4%
8%
12%
YE2016 Q3 2017 Q4 2017
7.4% 6.4% 5.4%
36.1%
0%
25%
50%
75%
0%
4%
8%
12%
YE2016 Q3 2017 Q4 2017
47
3
-15
0
15
30
2014 2015 2016 2017
Lower endCost of risk4Q Rolling cost of risk
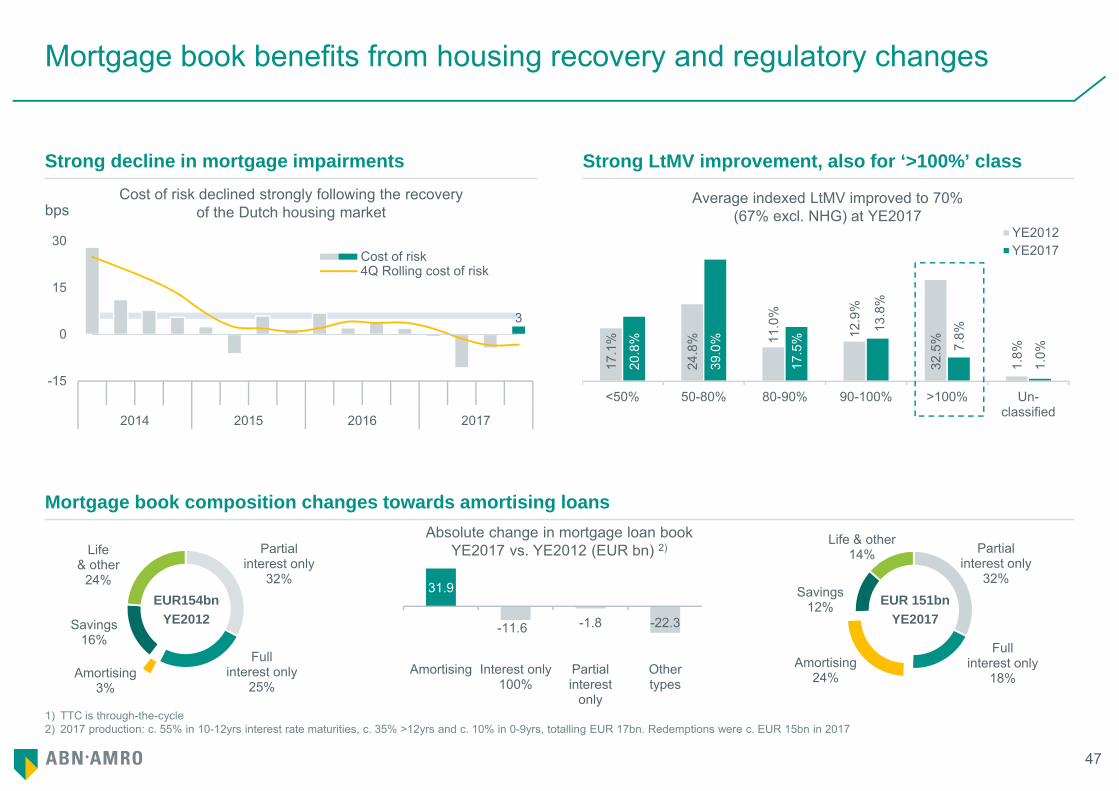
Absolute change in mortgage loan book YE2017 vs. YE2012 (EUR bn) 2)
31.9
-11.6 -1.8 -22.3
Amortising Interest only100%
Partialinterest
only
Othertypes
Partial interest only
32%
Fullinterest only
25%Amortising
3%
Savings16%
Life& other
24%
Partial interest only
32%
Full interest only
18%Amortising
24%
Savings12%
Life & other14%
1) TTC is through-the-cycle2) 2017 production: c. 55% in 10-12yrs interest rate maturities, c. 35% >12yrs and c. 10% in 0-9yrs, totalling EUR 17bn. Redemptions were c. EUR 15bn in 2017
Mortgage book benefits from housing recovery and regulatory changes
Strong decline in mortgage impairments Strong LtMV improvement, also for ‘>100%’ class
bpsCost of risk declined strongly following the recovery
of the Dutch housing market
Mortgage book composition changes towards amortising loans
17.1
%
24.8
% 11.0
%
12.9
%
32.5
%
1.8%
20.8
%
39.0
%
17.5
%
13.8
%
7.8%
1.0%
<50% 50-80% 80-90% 90-100% >100% Un-classified
YE2012YE2017
Average indexed LtMV improved to 70% (67% excl. NHG) at YE2017
EUR154bnYE2012
EUR 151bnYE2017
48
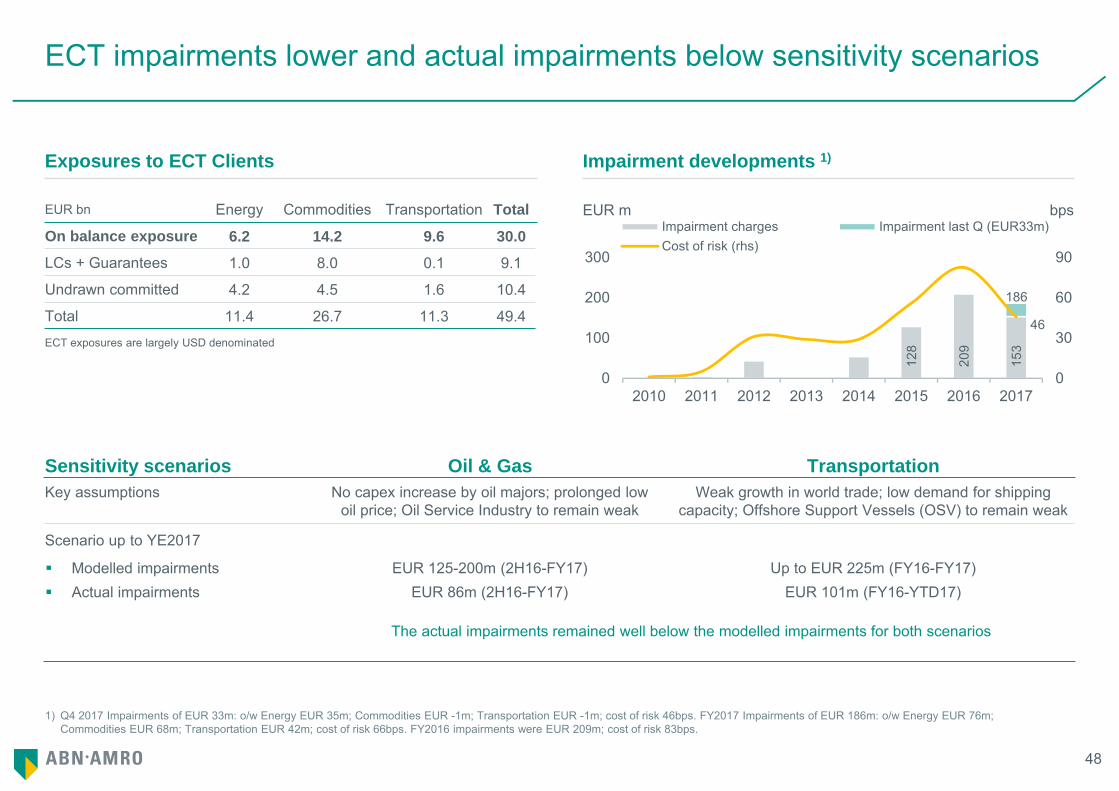
128
209
153
186
46
0
30
60
90
0
100
200
300
2010 2011 2012 2013 2014 2015 2016 2017
Impairment charges Impairment last Q (EUR33m)Cost of risk (rhs)
1) Q4 2017 Impairments of EUR 33m: o/w Energy EUR 35m; Commodities EUR -1m; Transportation EUR -1m; cost of risk 46bps. FY2017 Impairments of EUR 186m: o/w Energy EUR 76m;Commodities EUR 68m; Transportation EUR 42m; cost of risk 66bps. FY2016 impairments were EUR 209m; cost of risk 83bps.
ECT impairments lower and actual impairments below sensitivity scenarios
Exposures to ECT Clients Impairment developments 1)
EUR bn Energy Commodities Transportation Total
On balance exposure 6.2 14.2 9.6 30.0
LCs + Guarantees 1.0 8.0 0.1 9.1
Undrawn committed 4.2 4.5 1.6 10.4
Total 11.4 26.7 11.3 49.4ECT exposures are largely USD denominated
EUR m bps
Sensitivity scenarios Oil & Gas Transportation Key assumptions No capex increase by oil majors; prolonged low
oil price; Oil Service Industry to remain weakWeak growth in world trade; low demand for shipping
capacity; Offshore Support Vessels (OSV) to remain weak
Scenario up to YE2017
Modelled impairments EUR 125-200m (2H16-FY17) Up to EUR 225m (FY16-FY17) Actual impairments EUR 86m (2H16-FY17) EUR 101m (FY16-YTD17)
The actual impairments remained well below the modelled impairments for both scenarios
Capital, Liquidity & Funding
50
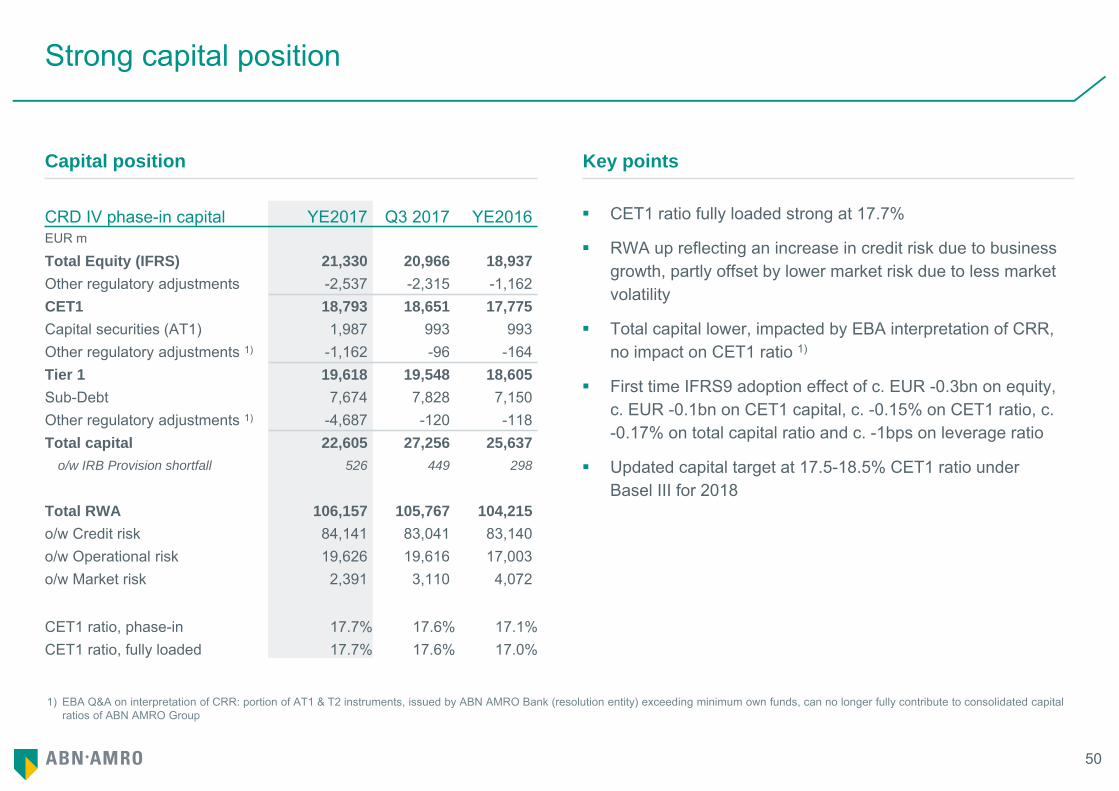
Strong capital position
Capital position Key points
CET1 ratio fully loaded strong at 17.7%
RWA up reflecting an increase in credit risk due to business growth, partly offset by lower market risk due to less market volatility
Total capital lower, impacted by EBA interpretation of CRR, no impact on CET1 ratio 1)
First time IFRS9 adoption effect of c. EUR -0.3bn on equity, c. EUR -0.1bn on CET1 capital, c. -0.15% on CET1 ratio, c. -0.17% on total capital ratio and c. -1bps on leverage ratio
Updated capital target at 17.5-18.5% CET1 ratio under Basel III for 2018
CRD IV phase-in capital YE2017 Q3 2017 YE2016EUR m
Total Equity (IFRS) 21,330 20,966 18,937Other regulatory adjustments -2,537 -2,315 -1,162CET1 18,793 18,651 17,775Capital securities (AT1) 1,987 993 993Other regulatory adjustments 1) -1,162 -96 -164Tier 1 19,618 19,548 18,605Sub-Debt 7,674 7,828 7,150Other regulatory adjustments 1) -4,687 -120 -118Total capital 22,605 27,256 25,637
o/w IRB Provision shortfall 526 449 298
Total RWA 106,157 105,767 104,215o/w Credit risk 84,141 83,041 83,140o/w Operational risk 19,626 19,616 17,003o/w Market risk 2,391 3,110 4,072
CET1 ratio, phase-in 17.7% 17.6% 17.1%CET1 ratio, fully loaded 17.7% 17.6% 17.0%
1) EBA Q&A on interpretation of CRR: portion of AT1 & T2 instruments, issued by ABN AMRO Bank (resolution entity) exceeding minimum own funds, can no longer fully contribute to consolidated capital ratios of ABN AMRO Group
51
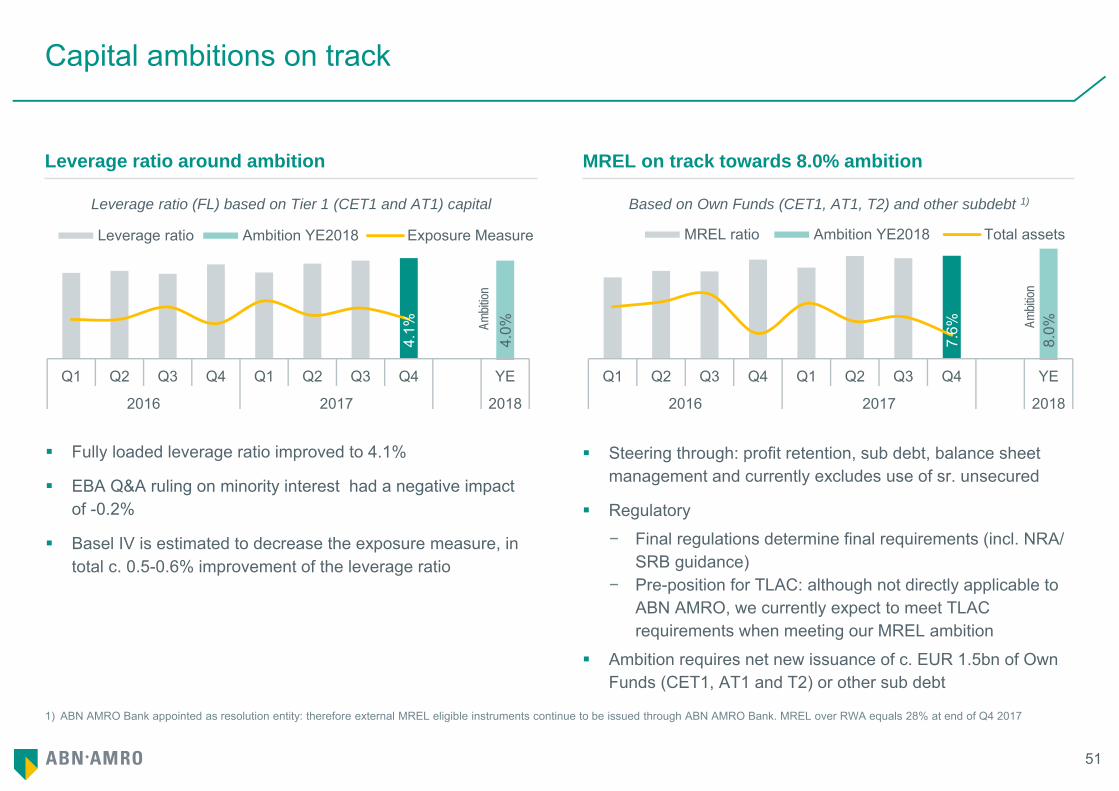
Steering through: profit retention, sub debt, balance sheet management and currently excludes use of sr. unsecured
Regulatory
− Final regulations determine final requirements (incl. NRA/ SRB guidance)
− Pre-position for TLAC: although not directly applicable to ABN AMRO, we currently expect to meet TLAC requirements when meeting our MREL ambition
Ambition requires net new issuance of c. EUR 1.5bn of Own Funds (CET1, AT1 and T2) or other sub debt
1) ABN AMRO Bank appointed as resolution entity: therefore external MREL eligible instruments continue to be issued through ABN AMRO Bank. MREL over RWA equals 28% at end of Q4 2017
Capital ambitions on track
Fully loaded leverage ratio improved to 4.1%
EBA Q&A ruling on minority interest had a negative impact of -0.2%
Basel IV is estimated to decrease the exposure measure, in total c. 0.5-0.6% improvement of the leverage ratio
Leverage ratio around ambition MREL on track towards 8.0% ambition
Based on Own Funds (CET1, AT1, T2) and other subdebt 1)Leverage ratio (FL) based on Tier 1 (CET1 and AT1) capital
Ambit
ion
Ambit
ion
4.1%
4.0%
Q1 Q2 Q3 Q4 Q1 Q2 Q3 Q4 YE
2016 2017 2018
Leverage ratio Ambition YE2018 Exposure Measure
7.6%
8.0%
Q1 Q2 Q3 Q4 Q1 Q2 Q3 Q4 YE
2016 2017 2018
MREL ratio Ambition YE2018 Total assets
52
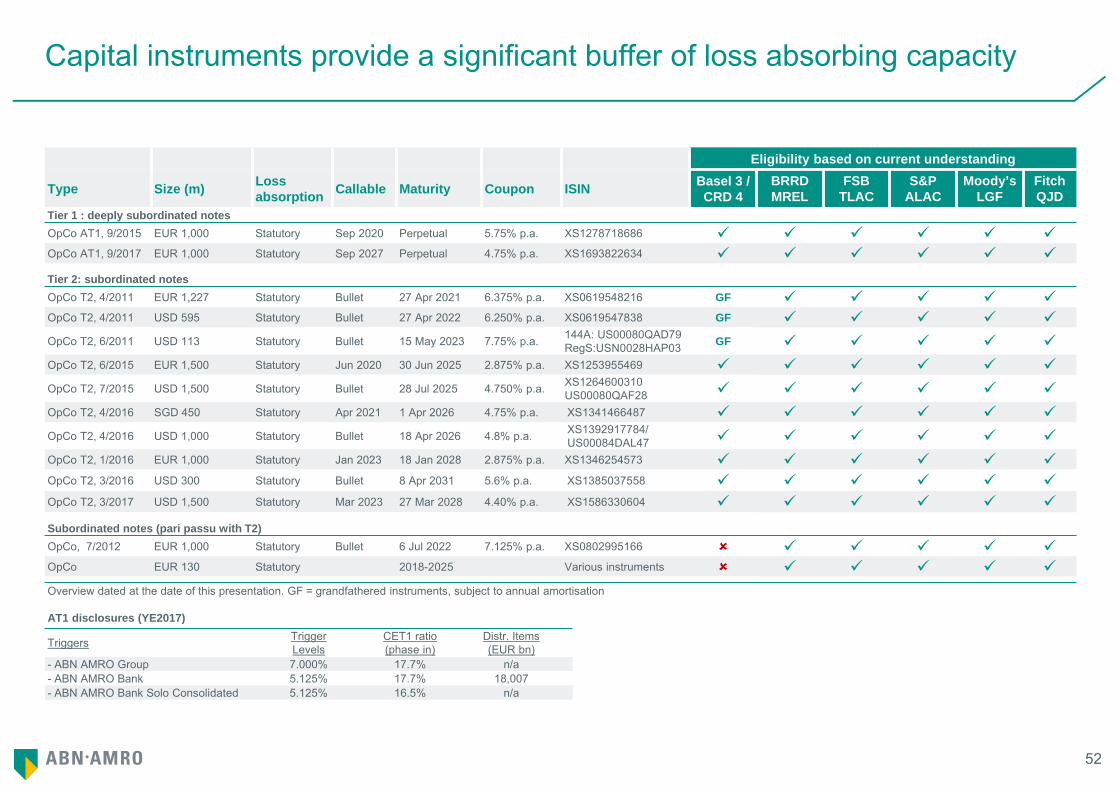
Capital instruments provide a significant buffer of loss absorbing capacity
AT1 disclosures (YE2017)
Triggers TriggerLevels
CET1 ratio (phase in)
Distr. Items(EUR bn)
- ABN AMRO Group 7.000% 17.7% n/a- ABN AMRO Bank 5.125% 17.7% 18,007- ABN AMRO Bank Solo Consolidated 5.125% 16.5% n/a
Eligibility based on current understanding
Type Size (m) Loss absorption Callable Maturity Coupon ISIN Basel 3 /
CRD 4BRRDMREL
FSBTLAC
S&PALAC
Moody’sLGF
FitchQJD
Tier 1 : deeply subordinated notesOpCo AT1, 9/2015 EUR 1,000 Statutory Sep 2020 Perpetual 5.75% p.a. XS1278718686 OpCo AT1, 9/2017 EUR 1,000 Statutory Sep 2027 Perpetual 4.75% p.a. XS1693822634 Tier 2: subordinated notesOpCo T2, 4/2011 EUR 1,227 Statutory Bullet 27 Apr 2021 6.375% p.a. XS0619548216 GF OpCo T2, 4/2011 USD 595 Statutory Bullet 27 Apr 2022 6.250% p.a. XS0619547838 GF OpCo T2, 6/2011 USD 113 Statutory Bullet 15 May 2023 7.75% p.a. 144A: US00080QAD79
RegS:USN0028HAP03 GF OpCo T2, 6/2015 EUR 1,500 Statutory Jun 2020 30 Jun 2025 2.875% p.a. XS1253955469 OpCo T2, 7/2015 USD 1,500 Statutory Bullet 28 Jul 2025 4.750% p.a. XS1264600310
US00080QAF28 OpCo T2, 4/2016 SGD 450 Statutory Apr 2021 1 Apr 2026 4.75% p.a. XS1341466487 OpCo T2, 4/2016 USD 1,000 Statutory Bullet 18 Apr 2026 4.8% p.a. XS1392917784/
US00084DAL47 OpCo T2, 1/2016 EUR 1,000 Statutory Jan 2023 18 Jan 2028 2.875% p.a. XS1346254573 OpCo T2, 3/2016 USD 300 Statutory Bullet 8 Apr 2031 5.6% p.a. XS1385037558 OpCo T2, 3/2017 USD 1,500 Statutory Mar 2023 27 Mar 2028 4.40% p.a. XS1586330604
Subordinated notes (pari passu with T2)OpCo, 7/2012 EUR 1,000 Statutory Bullet 6 Jul 2022 7.125% p.a. XS0802995166 OpCo EUR 130 Statutory 2018-2025 Various instruments Overview dated at the date of this presentation. GF = grandfathered instruments, subject to annual amortisation
53
23.8
72.5
Wholesale maturities ≤1yr
Liquiditybuffer
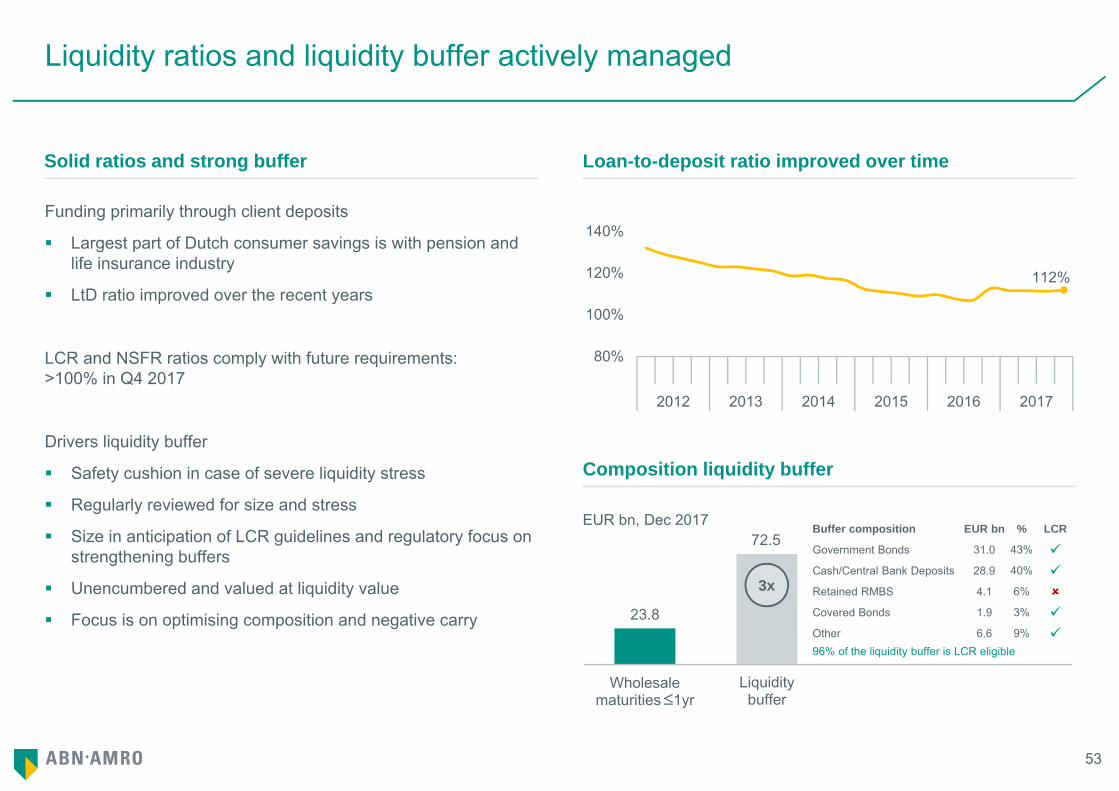
Liquidity ratios and liquidity buffer actively managed
Funding primarily through client deposits
Largest part of Dutch consumer savings is with pension and life insurance industry
LtD ratio improved over the recent years
LCR and NSFR ratios comply with future requirements: >100% in Q4 2017
Drivers liquidity buffer
Safety cushion in case of severe liquidity stress
Regularly reviewed for size and stress
Size in anticipation of LCR guidelines and regulatory focus on strengthening buffers
Unencumbered and valued at liquidity value
Focus is on optimising composition and negative carry
Solid ratios and strong buffer Loan-to-deposit ratio improved over time
Composition liquidity buffer
EUR bn, Dec 2017
3x
Buffer composition EUR bn % LCR
Government Bonds 31.0 43% Cash/Central Bank Deposits 28.9 40% Retained RMBS 4.1 6% Covered Bonds 1.9 3% Other 6.6 9% 96% of the liquidity buffer is LCR eligible
225253 /246156 =91.5%
112%
80%
100%
120%
140%
2012 2013 2014 2015 2016 2017
54
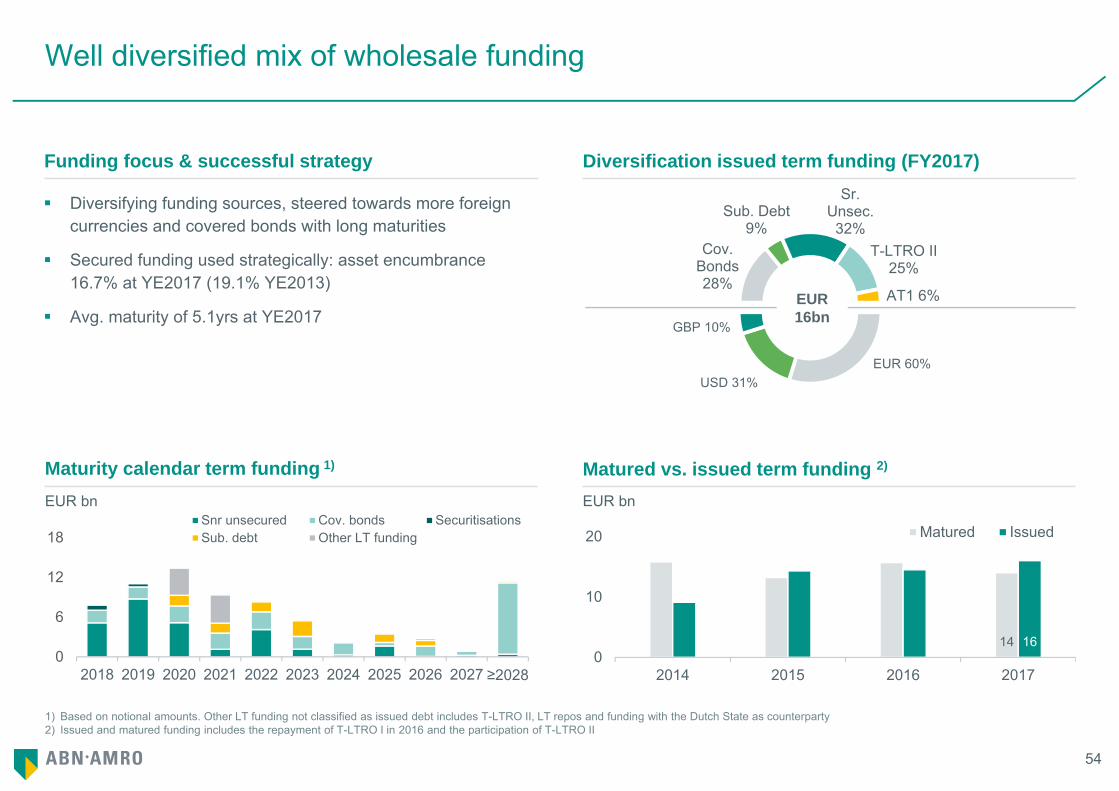
Cov. Bonds 28%
Sub. Debt 9%
Sr. Unsec. 32%
T-LTRO II 25%
AT1 6%
EUR 60%USD 31%
GBP 10%
1) Based on notional amounts. Other LT funding not classified as issued debt includes T-LTRO II, LT repos and funding with the Dutch State as counterparty2) Issued and matured funding includes the repayment of T-LTRO I in 2016 and the participation of T-LTRO II
Well diversified mix of wholesale funding
Diversifying funding sources, steered towards more foreign currencies and covered bonds with long maturities
Secured funding used strategically: asset encumbrance 16.7% at YE2017 (19.1% YE2013)
Avg. maturity of 5.1yrs at YE2017
Funding focus & successful strategy Diversification issued term funding (FY2017)
Matured vs. issued term funding 2)Maturity calendar term funding 1)
14 160
10
20
2014 2015 2016 2017
Matured Issued
EUR bn
0
6
12
18
2018 2019 2020 2021 2022 2023 2024 2025 2026 2027 ≥2028
Snr unsecured Cov. bonds SecuritisationsSub. debt Other LT funding
EUR bn
EUR16bn
55
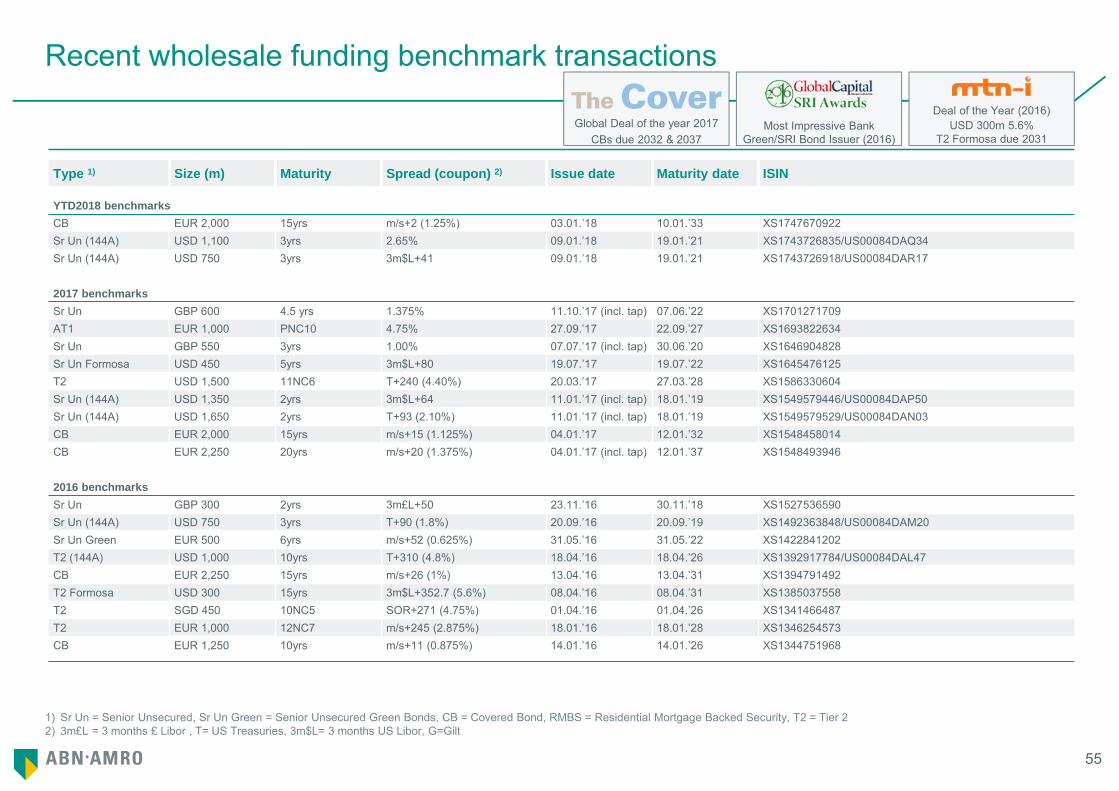
1) Sr Un = Senior Unsecured, Sr Un Green = Senior Unsecured Green Bonds, CB = Covered Bond, RMBS = Residential Mortgage Backed Security, T2 = Tier 22) 3m£L = 3 months £ Libor , T= US Treasuries, 3m$L= 3 months US Libor, G=Gilt
Recent wholesale funding benchmark transactionsDeal of the Year (2016)
USD 300m 5.6%T2 Formosa due 2031
Most Impressive BankGreen/SRI Bond Issuer (2016)
Global Deal of the year 2017CBs due 2032 & 2037
The Cover
Type 1) Size (m) Maturity Spread (coupon) 2) Issue date Maturity date ISIN
YTD2018 benchmarks CB EUR 2,000 15yrs m/s+2 (1.25%) 03.01.’18 10.01.’33 XS1747670922Sr Un (144A) USD 1,100 3yrs 2.65% 09.01.’18 19.01.’21 XS1743726835/US00084DAQ34Sr Un (144A) USD 750 3yrs 3m$L+41 09.01.’18 19.01.’21 XS1743726918/US00084DAR17
2017 benchmarks Sr Un GBP 600 4.5 yrs 1.375% 11.10.’17 (incl. tap) 07.06.’22 XS1701271709AT1 EUR 1,000 PNC10 4.75% 27.09.’17 22.09.’27 XS1693822634Sr Un GBP 550 3yrs 1.00% 07.07.’17 (incl. tap) 30.06.’20 XS1646904828Sr Un Formosa USD 450 5yrs 3m$L+80 19.07.’17 19.07.’22 XS1645476125T2 USD 1,500 11NC6 T+240 (4.40%) 20.03.’17 27.03.’28 XS1586330604Sr Un (144A) USD 1,350 2yrs 3m$L+64 11.01.’17 (incl. tap) 18.01.’19 XS1549579446/US00084DAP50Sr Un (144A) USD 1,650 2yrs T+93 (2.10%) 11.01.’17 (incl. tap) 18.01.’19 XS1549579529/US00084DAN03 CB EUR 2,000 15yrs m/s+15 (1.125%) 04.01.’17 12.01.’32 XS1548458014CB EUR 2,250 20yrs m/s+20 (1.375%) 04.01.’17 (incl. tap) 12.01.’37 XS1548493946
2016 benchmarks Sr Un GBP 300 2yrs 3m£L+50 23.11.’16 30.11.’18 XS1527536590Sr Un (144A) USD 750 3yrs T+90 (1.8%) 20.09.’16 20.09.’19 XS1492363848/US00084DAM20Sr Un Green EUR 500 6yrs m/s+52 (0.625%) 31.05.’16 31.05.’22 XS1422841202T2 (144A) USD 1,000 10yrs T+310 (4.8%) 18.04.’16 18.04.’26 XS1392917784/US00084DAL47CB EUR 2,250 15yrs m/s+26 (1%) 13.04.’16 13.04.’31 XS1394791492T2 Formosa USD 300 15yrs 3m$L+352.7 (5.6%) 08.04.’16 08.04.’31 XS1385037558T2 SGD 450 10NC5 SOR+271 (4.75%) 01.04.’16 01.04.’26 XS1341466487T2 EUR 1,000 12NC7 m/s+245 (2.875%) 18.01.’16 18.01.’28 XS1346254573CB EUR 1,250 10yrs m/s+11 (0.875%) 14.01.’16 14.01.’26 XS1344751968
56
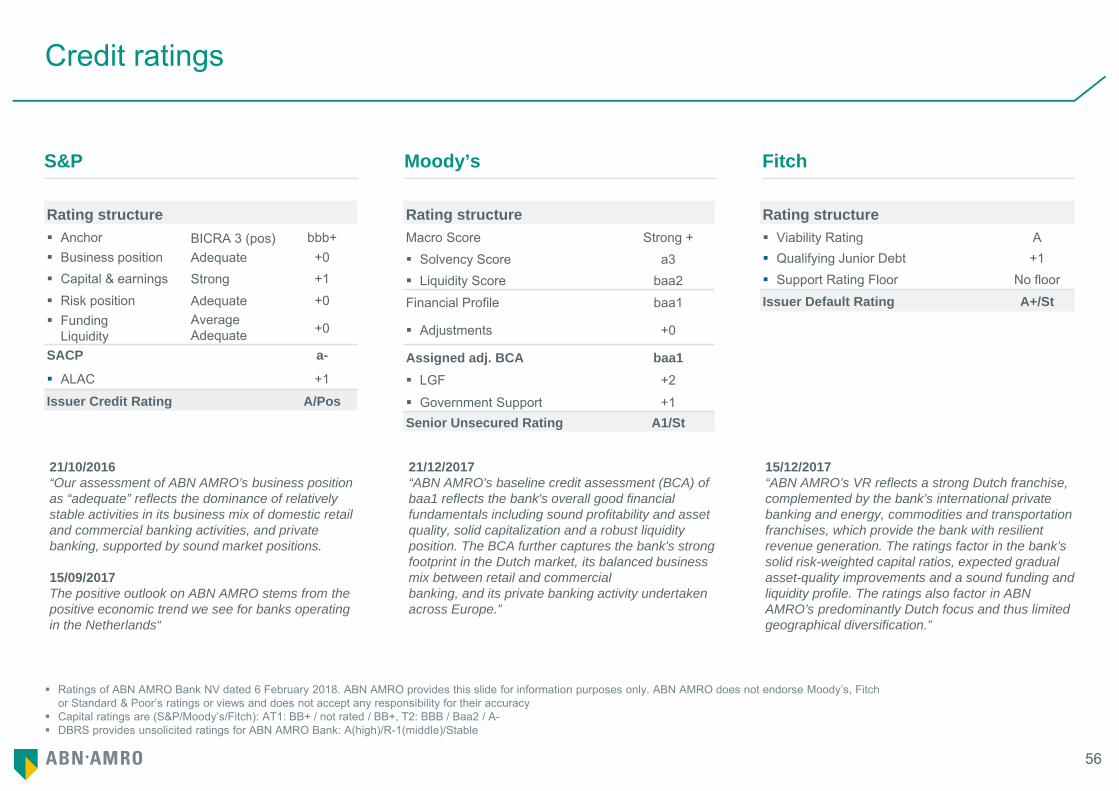
Ratings of ABN AMRO Bank NV dated 6 February 2018. ABN AMRO provides this slide for information purposes only. ABN AMRO does not endorse Moody’s, Fitch or Standard & Poor’s ratings or views and does not accept any responsibility for their accuracy
Capital ratings are (S&P/Moody’s/Fitch): AT1: BB+ / not rated / BB+, T2: BBB / Baa2 / A- DBRS provides unsolicited ratings for ABN AMRO Bank: A(high)/R-1(middle)/Stable
Credit ratings
S&P Moody’s Fitch
Rating structure Rating structure Rating structure Anchor BICRA 3 (pos) bbb+ Macro Score Strong + Viability Rating A Business position Adequate +0 Solvency Score a3 Qualifying Junior Debt +1 Capital & earnings Strong +1 Liquidity Score baa2 Support Rating Floor No floor Risk position Adequate +0 Financial Profile baa1 Issuer Default Rating A+/St Funding
LiquidityAverageAdequate +0 Adjustments +0
SACP a- Assigned adj. BCA baa1 ALAC +1 LGF +2Issuer Credit Rating A/Pos Government Support +1
Senior Unsecured Rating A1/St
21/10/2016“Our assessment of ABN AMRO’s business position as “adequate” reflects the dominance of relatively stable activities in its business mix of domestic retail and commercial banking activities, and private banking, supported by sound market positions.
15/09/2017The positive outlook on ABN AMRO stems from the positive economic trend we see for banks operating in the Netherlands“
21/12/2017“ABN AMRO's baseline credit assessment (BCA) of baa1 reflects the bank's overall good financial fundamentals including sound profitability and asset quality, solid capitalization and a robust liquidity position. The BCA further captures the bank's strongfootprint in the Dutch market, its balanced business mix between retail and commercialbanking, and its private banking activity undertaken across Europe.”
15/12/2017“ABN AMRO’s VR reflects a strong Dutch franchise, complemented by the bank’s international private banking and energy, commodities and transportation franchises, which provide the bank with resilient revenue generation. The ratings factor in the bank’s solid risk-weighted capital ratios, expected gradual asset-quality improvements and a sound funding and liquidity profile. The ratings also factor in ABN AMRO’s predominantly Dutch focus and thus limited geographical diversification.”
57
For the purposes of this disclaimer ABN AMRO Group N.V. and its consolidated subsidiaries are referred to as "ABN AMRO“. This document (the “Presentation”) has been prepared by ABN AMRO. For purposes of this notice, the Presentation shall include any document that follows and relates to any oral briefings by ABN AMRO and any question-and-answer session that follows such briefings. The Presentation is informative in nature and is solely intended to provide financial and general information about ABN AMRO following the publication of its most recent financial figures. This Presentation has been prepared with care and must be read in connection with the relevant Financial Documents (latest Quarterly Report and Annual Financial Statements, "Financial Documents"). In case of any difference between the Financial Documents and this Presentation the Financial Documents are leading. The Presentation does not constitute an offer of securities or a solicitation to make such an offer, and may not be used for such purposes, in any jurisdiction (including the member states of the European Union and the United States) nor does it constitute investment advice or an investment recommendation in respect of any financial instrument. Any securities referred to in the Presentation have not been and will not be registered under the US Securities Act of 1933.
The information in the Presentation is, unless expressly stated otherwise, not intended for residents of the United States or any "U.S. person" (as defined in Regulation S of the US Securities Act 1933). No reliance may be placed on the information contained in the Presentation. No representation or warranty, express or implied, is given by or on behalf of ABN AMRO, or any of its directors or employees as to the accuracy or completeness of the information contained in the Presentation. ABN AMRO accepts no liability for any loss arising, directly or indirectly, from the use of such information. Nothing contained herein shall form the basis of any commitment whatsoever. ABN AMRO has included in this Presentation, and from time to time may make certain statements in its public statements that may constitute “forward-looking statements”. This includes, without limitation, such statements that include the words ‘expect’, ‘estimate’, ‘project’, ‘anticipate’, ‘should’, ‘intend’, ‘plan’, ‘probability’, ‘risk’, ‘Value-at-Risk (“VaR”)’, ‘target’, ‘goal’, ‘objective’, ‘will’, ‘endeavour’, ‘outlook’, 'optimistic', 'prospects' and similar expressions or variations on such expressions. In particular, the Presentation may include forward-looking statements relating but not limited to ABN AMRO’s potential exposures to various types of operational, credit and market risk. Such statements are subject to
uncertainties. Forward-looking statements are not historical facts and represent only ABN AMRO's current views and assumptions on future events, many of which, by their nature, are inherently uncertain and beyond our control. Factors that could cause actual results to differ materially from those anticipated by forward-looking statements include, but are not limited to, (macro)-economic, demographic and political conditions and risks, actions taken and policies applied by governments and their agencies, financial regulators and private organisations (including credit rating agencies), market conditions and turbulence in financial and other markets, and the success of ABN AMRO in managing the risks involved in the foregoing. Any forward-looking statements made by ABN AMRO are current views as at the date they are made. Subject to statutory obligations, ABN AMRO does not intend to publicly update or revise forward-looking statements to reflect events or circumstances after the date the statements were made, and ABN AMRO assumes no obligation to do so.
Disclaimer

WebsiteABN AMRO Group www.abnamro.com/ir
AddressGustav Mahlerlaan 101082 PP AmsterdamThe Netherlands
20180207 Investor Relations - non-US Q4 2017
Recommended