Embed Size (px)
Citation preview

VALUE CREATION FUELS ACCELERATED GROWTH
April 2018

GTC AT A GLANCELeading investor and developer in CEE&SEE region
2
Key financial metrics Balanced portfolio providing stable rental income and significant
growth potential from secured developments
Property book value €1,958m
of which income
generating€1,649m
of which dev. under
construction €148m
of which projects in
planning stage€43m
of which projects in pre-
planning stage€59m
Annualised in-place rent(3) €110m
Net debt €829
LTV 42%
In-place rental yield 6.8%
FFO I €47m
Note: (1) Includes Residential landbank & inventory; (2) Excludes €1m of investment in associates and 50% joint ventures;
(3) Net of rent-free periods
GTC is a leading commercial real estate investor and developer in Poland and capital cities of CEE and SEE countries.
GTC has one of the longest-standing property platforms with more than a 24 year track record in the region
As of 31 December 2017
Income generating84%
Completed residential
<1%
Properties under construction
8%
Projects in planning
stage2%
Projects in pre-planning
stage3%
Landbank for developments
<1% Non-core(1)
3%
Office52%
Retail32%
GAV
€1,958m
As of 31 December 2017
(2)
Source: GTC

KEY EVENTS AND ACHIEVEMENTS SINCE 2013Restructuring process completed
3
August 2014
Mr. Thomas
Kurzmann
(appointed as CEO
in May 2014) joins
GTC in August
2014
Q4 2013 – Q4 2015
Lone Star buys up
to 61% anchor
stake in GTC
Implementation of
new corporate
strategy
Nov. 2015 - Now
GTC successfully executes
a €140m capital increase,
34% oversubscription
Realization of the growth
strategy through acquisition of
income generating assets and
land;
€293m of assets acquired
December 2015
2015 results prove
positive effect of
restructuring
measures
implemented: GTC
back on the
growth path
December 2014
Fundamental realignment
of property values, incl.
devaluations of over
€300m since Lone Star
entry; completion of
restructuring of non-
performing loans
September 2017August 2016
Listing on
Johannesburg
Stock Exchange
December 2017
Completion of
Galeria Północna,
Warsaw, Poland
(64,800 sq. m)
128,000 sq. m
under construction
128,400 sq. m in
planning stage
175,000 sq. m in
pre-planning stage
Source: GTC
2015 - 2017
Completion of
56,000 sq. m office
space
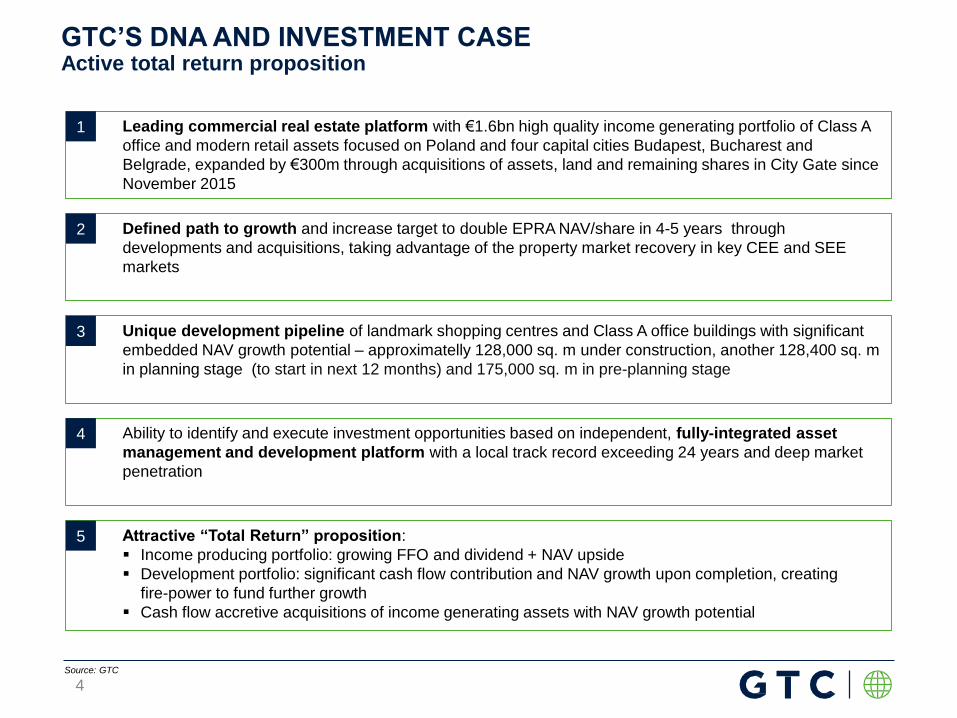
GTC’S DNA AND INVESTMENT CASEActive total return proposition
4
Leading commercial real estate platform with €1.6bn high quality income generating portfolio of Class A
office and modern retail assets focused on Poland and four capital cities Budapest, Bucharest and
Belgrade, expanded by €300m through acquisitions of assets, land and remaining shares in City Gate since
November 2015
1
Unique development pipeline of landmark shopping centres and Class A office buildings with significant
embedded NAV growth potential – approximatelly 128,000 sq. m under construction, another 128,400 sq. m
in planning stage (to start in next 12 months) and 175,000 sq. m in pre-planning stage
3
Defined path to growth and increase target to double EPRA NAV/share in 4-5 years through
developments and acquisitions, taking advantage of the property market recovery in key CEE and SEE
markets
2
Ability to identify and execute investment opportunities based on independent, fully-integrated asset
management and development platform with a local track record exceeding 24 years and deep market
penetration
4
Attractive “Total Return” proposition:
Income producing portfolio: growing FFO and dividend + NAV upside
Development portfolio: significant cash flow contribution and NAV growth upon completion, creating
fire-power to fund further growth
Cash flow accretive acquisitions of income generating assets with NAV growth potential
5
Source: GTC

LEADING COMMERCIAL REAL ESTATE PLATFORM
5
Center Point, Budapest

Core97%
Non core
3%
GTC PORTFOLIO
(31 December 2017)#
Book value
(€m)%
Annualised
in-place rent
(€m)
GLA
(ths. sqm)
Income generating (a+b) 37 1,649 84% 110 621
a) Office 34 1,018 52% 76(1) 474
b) Retail 3 631 32% 34(2) 147
Completed residential(3) 1 4 <1% - -
Investment properties
under construction5 148 8% - 128
Projects in planning
stage5 43 2% - 128
Projects in pre-planning
stage6 59 3% - 175
Landbank for
developments2 4 <1% - -
CORE PORTFOLIO 56 1,907 97% NM
NON-CORE PORTFOLIO(4) 50 3% NM
TOTAL 1,958 100% NM
Top tenants
Asset location by GAV(5)
Notes: (1) Does not include expected rent on 6% vacant space (2) Does not include expected rent on 6% vacant space (3) Includes investment in Osiedle Konstancja phase VI; (4) Non-core landbank, „Residential
Landbank & Inventory” (5) Excludes €1m of investment in associates and joint ventures;
High quality core portfolio of 34 office and 3 retail buildings
95% of leases and rental income €-denominated
Top tier tenants, mostly multinational corporations and leading brands
Capital cities outside Poland46%
Poland51%
As of 31 December 2017
Source: GTC
GAV
€1,958m
LEADING COMMERCIAL REAL ESTATE PLATFORMHigh quality portfolio generating €110m of annualised in place rent
6
Warsaw€411m25%Rest of Poland
€546m33%
Bucharest€196m12%
Zagreb€105m
6%
Budapest€229m14%
Belgrade€163m10%
GAV
€1,958m
Retail86%
Office14%
Note (1) Excludes €1m of investment in associates and 50% joint ventures; (2) Excludes €4m of Investment in Osiedle Konstancja phase VI (3) Includes Residential landbank & inventory
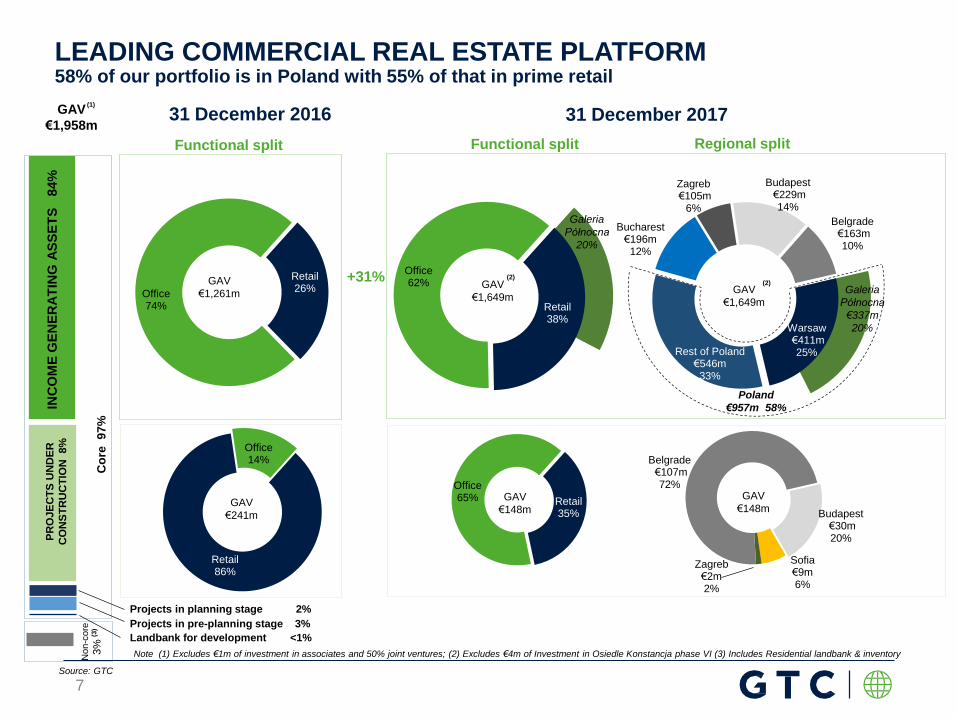
LEADING COMMERCIAL REAL ESTATE PLATFORM58% of our portfolio is in Poland with 55% of that in prime retail
Co
re 9
7%
Non-c
ore
3%
INC
OM
E G
EN
ER
AT
ING
AS
SE
TS
8
4%
PR
OJE
CT
S U
ND
ER
CO
NS
TR
UC
TIO
N
8%
(3)
GAV
€1,649m
Poland
€957m 58%
Retail26%
Office74%
GAV
€1,649m
Functional split Regional split
Retail35%
Office65%
Budapest€30m20%
Sofia€9m6%
Zagreb€2m2%
Belgrade€107m72%
GAV
€148m
(1)
Retail38%
Office62%
31 December 2016 31 December 2017
GAV
€1,261m
GAV
€241m
Source: GTC
Functional split
(2)(2)
GAV
€148m
+31%Galeria
Północna
€337m
20%
Galeria
Północna
20%
7
Landbank for development <1%
Projects in planning stage 2%
Projects in pre-planning stage 3%

< 10 years old71%
> 10 years old29%
Note: (1) Cities with more than 200,000 inhabitants
Building age
LocationsOccupancy rate
Capital cities CEE58%
Major Polish cities(1)
35%
Warsaw7%
91% 92% 93% 93% 94%
2013 2014 2015 2016 2017
by GAV
€1,018m
€1,018m
by GAV
OFFICE PORTFOLIO OVERVIEWSustainable high occupancy of prime office buildings provides solid recurring incomeAs of 31 December 2017
Source: GTC
Green certification
Office overview
474,000sq. m GLA
34buildings
€76m annualised
in-place rent
€1,018m GAV
40%
16%
15%
2%
27%
LEED BREEAM Others
Under certification No Certificaton
Note: Data for Avenue Centre are presented together with Avenue Mall, Zagreb, excl. number of buildings
71% assets
with green
certification
8

Building age
LocationsOccupancy rate
by GAV
€631m
€631m
by GAV
RETAIL PORTFOLIO OVERVIEWLandmark shopping centres in local marketsAs of 31 December 2017
Source: GTC
Green certification
Retail assets overview
147,000sq. m GLA
3buildings
€34m annualised
in-place rent
€631m GAV
53%47%
91% 90% 89%95% 94%
2013 2014 2015 2016 2017
< 10 years old83%
> 10 years old17%
Zagreb17%
Warsaw53%
Częstochowa30%
Note: Data for Avenue Centre are presented together with Avenue Mall, Zagreb, excl. number of buildings
9

10 largest assets constitute 73% of GAV of income generating portfolio
Top propertiesAsset
classCountry City
Book Value
€m
GLA
ths. sq. m
Rent
€/sq. m/month
Occupancy
%
Galeria Północna Poland Warsaw 337 65 21.3 89%
Galeria Jurajska Poland Czestochowa 190 49 19.8 97%
City Gate Romania Bucharest 147 48 18.6 96%
Avenue Mall Zagreb Croatia Zagreb 105 34 20.8 99%
Center Point Hungary Budapest 85 41 13.1 97%
Korona Office Complex Poland Cracow 82 38 15.0 89%
University Business Park Poland Łódź 72 40 12.7 91%
Duna Tower Hungary Budapest 66 31 12.7 95%
FortyOne Serbia Belgrade 62 28 16.1 97%
Aeropark Business Centre Poland Warsaw 53 29 14.2 77%
TOTAL 1,199 403
Galeria Jurajska, Czestochowa, Poland
City Gate, Bucharest, Romania
Avenue Mall Zagreb, Zagreb, Croatia
Center Point, Budapest, Hungary Duna Tower, Budapest, Hungary
Re
tail
Off
ice
Korona Office Complex, Cracow, Poland
PROPERTY OVERVIEWHigh quality assets base in Poland and capital cities of CEE
Source: GTC
Galeria Północna, Warsaw, Poland
10

WALT (by in-place rent) by country
Occupancy by country
3.2
2.3 2.4
3.4
5.0
2.9
Poland Hungary Serbia Romania Poland Croatia
Average yields by country
7.4% 7.3%
8.3%
7.4%
5.6%
6.8%
Poland Hungary Serbia Romania Poland Croatia
89%98% 97% 97% 93%
99%
Poland Hungary Serbia Romania Poland Croatia
GLA (sq. m) by country
LEADING COMMERCIAL REAL ESTATE PLATFORM
212
119
7667
113
34
Poland Hungary Serbia Romania Poland Croatia
RetailOffice RetailOffice
RetailOfficeRetailOffice
As of 31 December 2017
Source: GTC
Note: Data for Avenue Centre are presented together with Avenue Mall, Zagreb
11

DEFINED PATH TO GROWTH
12
Ada Mall, Serbia

0%
2%
4%
6%
8%
2010 2011 2012 2013 2014 2015 2016 2017
Investment yield Vacancy rate
0%
3%
6%
9%
12%
15%
18%
21%
2010 2011 2012 2013 2014 2015 2016 2017
Investment yields Vacancy rate
Poland Warsaw - Retail
Hungary Budapest - Office
Poland and Hungary with strong macro performance translating into rising rents, decrease in vacancy rates and yield
compression
Average rent at 35-40 €/sq. m
Average prime rent at 22.5 €/sq. m197,000
80,000
278,000
Supply2017
Take-up2017
sq. m
-10%
-5%
0%
5%
10%
15%
2009 2010 2011 2012 2013 2014 2015 2016 2017F
GDP Growth Unemployment rate
0%
5%
10%
15%
2009 2010 2011 2012 2013 2014 2015 2016 2017F
GDP Growth Unemployment rate
0
100
200
300
400
500
600
700
800
Saturation (GLA/1 000 inhibitants)
13
Net Take-up
Renewals
CEE AND SEE KEY CAPITALS WITH FAVOURABLE SUPPLY/ DEMAND PATTERN (1/2)
Source: JLL;Colliers; IMF World Economic Outlook

0%
3%
6%
9%
12%
15%
18%
2010 2011 2012 2013 2014 2015 2016 2017
Investment yields Vacancy rate
0%
3%
6%
9%
12%
15%
18%
2010 2011 2012 2013 2014 2015 2016 2017
Investment yields Vacancy rate
Romania
CEE AND SEE KEY CAPITALS WITH FAVOURABLE SUPPLY/ DEMAND PATTERN (2/2)
Bucharest - Office
Serbia Belgrade - Office
Serbia and Romania also showing strong recovery momentum which positively impacts real estate markets
Average prime rent at 18.5 €/sq. m
Average rent at 15-16.5 €/sq. m 18,300
30,000
44,700
Supply2017
Take-up2017
sq. m
179,000123,000
171,000
Supply2017
Take-up2017
sq. m
Net Take-up
Renewals
-10%
-5%
0%
5%
10%
2009 2010 2011 2012 2013 2014 2015 2016 2017F
GDP Growth Unemployment rate
-5%
0%
5%
10%
15%
20%
25%
30%
2009 2010 2011 2012 2013 2014 2015 2016 2017F
GDP Growth Unemployment rate
14
Net Take-up
Renewals
Source: Colliers; CBRE; JLL; IMF World Economic Outlook

0%
2%
4%
6%
8%
10%
12%
14%
Q4'03 Q4'04 Q4'05 Q4'06 Q4'07 Q4'08 Q4'09 Q4'10 Q4'11 Q4'12 Q4'13 Q4'14 Q4'15 Q4'16 Q4'17
Bucharest Budapest Warsaw Belgrade
7.5%
MARKETS PROVIDE OPPORTUNITIES FOR ATTRACTIVE EQUITY RETURNS
15
Real estate prime office yields
Rental yield spreads at widest level in more than a decade for the CEE and SEE region
Spread between rental yield and cost of debt depending on respective city; high spread allows GTC to realise mid-
teens FFO yields in acquisitions
6.0%
8.5%
5.25%
1.8%-2.5%
3.1%-3.5%3.0-3.5%
2.45%-2.75%
Warsaw Belgrade Bucharest Budapest
Sp
read
:
275 b
ps-
345
bp
s
Sp
read
:
400 b
ps
-
450 b
ps
Sp
read
:
325 b
ps
-
355
bp
s
Cost of debt and yield spreads in capital cities
Marginal cost of debt based on GTC assumption
Sp
read
:
500 b
ps-
540 b
ps
Source: JLL

TANGIBLE ACQUISITION & DEVELOPMENT PIPELINEStrategy implemented since capital increase in 2015
16
Selection criteria
Institutional grade office and retail assets with value-add potential and/or significant cash flow / FFO
contribution potential
Located in Warsaw or other major Polish cities and capital cities of CEE and SEE countries
Funding Efficient non-recourse asset level bank financing
Maintaining an average group level LTV of max. 50%
Acquisition/development of yielding, value-add assets
Current pipeline
High FFO yield
High NAV growth potential
New development in phases based on demand, pre-leases and financing
Source: GTC
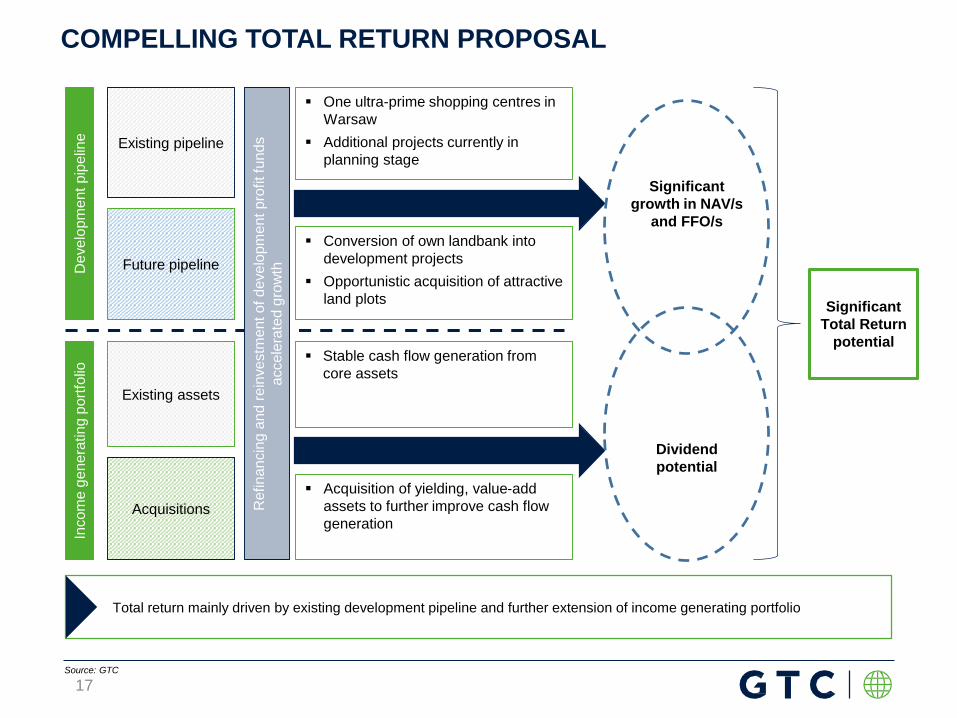
One ultra-prime shopping centres in
Warsaw
Additional projects currently in
planning stageExisting pipeline
Existing assets
COMPELLING TOTAL RETURN PROPOSAL
17
De
ve
lopm
ent
pip
elin
eIn
com
e g
ene
ratin
g p
ort
folio
Future pipeline
Acquisitions
Conversion of own landbank into
development projects
Opportunistic acquisition of attractive
land plots
Acquisition of yielding, value-add
assets to further improve cash flow
generation
Stable cash flow generation from
core assets
Significant
growth in NAV/s
and FFO/s
Dividend
potential
Total return mainly driven by existing development pipeline and further extension of income generating portfolio
Significant
Total Return
potential
Source: GTC
Re
fin
an
cin
g a
nd
re
inve
stm
ent o
f d
eve
lopm
ent p
rofit fu
nd
s
accele
rate
d g
row
th

COMPELLING TOTAL RETURN PROPOSAL
Investment
Development profit
FFO + Equity Growth
Refinancing Capacity
Significant Cash Inflow
2015 2016 Dec 2017
EPRA NAV (€m) 779 897 1,073
EPRA NAV growth 26.1% 15.1% 19.6%
Dividend for the year ¹ 0.0% 3.3% 3.9%
Total return 26.1% 18.4% 23.5%
Accumulated total return 26.1% 44.5% 68%
Note (1) Dividend for 2016 was paid in 2017; In 2015 the company raised €140m capital; In 2017 the company raised €21m capital (Share dividend)
Self propelling investment cycle
18
(€m)
0
200
400
600
800
1 000
1 200
0%
10%
20%
30%
40%
50%
60%
70%
80%
2015 2016 2017
EPRA NAV Dividend for the year
Accumulated total return

• As part of our strategy, we are developing an income-generating portfolio through acquisition and
development of income-generating assets. This leads to accretive FFO I and NAV growth that provides for
growing dividend potential
• Dividend will be based on the availability of cash, the FFO I growth plans, capital expenditure requirements
and planned acquisitions as well as the share of external financing in the Company’s overall equity
• Results achieved in 2017 allow us to recommend a dividend of PLN 0.33 per share
• DPS up by 22%
DIVIDEND POLICY
Dividend recommendation of PLN 0.33 / share, DPS up 22%
Source: GTC
19

EXECUTION OF GROWTH STRATEGY€582m investment created €262m of additional value and increased annual in place rent to €110m
As of 31 December 2017
Source: GTC
€34m
€93m
€155m
€54m
€168m
€78m
€28m
€85m
€149m
2015 2016 2017 Total
Expenditure on investment property Purchase of completed assets, land, subsidiaries and minorities Value creation
€69m
€844m
Investment
€116m €346m €382m
€262m
€300m
€282m
20

GAV
We target to double EPRA NAV/share in next 4-5 years with current equity Continuation of GTC’s strategy to deliver growth and shareholder value creation
FFO
GAV has grown at a 15% CAGR since 2014
Intention to significantly grow GAV
utilising the existing platform
1.3 1.3 1.6 2.0
2014 2015 2016 2017
GAV (€bn)
EPRA NAV (€bn)
Robust historical FFO development
Intention to grow FFO over-
proportionally
FFO (€mm)
Dividend Dividend payout to remain in line with stated policy
LTV LTV expected to remain below mid-term target of 50%
Self-funded strategy (no additional capital injection required to achieve our targets)
NAV
EPRA NAV almost doubled since 2014
Intention to double again EPRA
NAV/SHARE without raising new equity
Portfolio
composition
Sector and geographic portfolio focus expected to remain broadly in line with current portfolio
including developments
2.0
2017 2021/22
0.6 0.8 0.9 1.1
2014 2015 2016 2017
1.1
2017 2021/22
28 38 42 47
2014 2015 2016 2017 2017 2021/22
47
Historical performance Target*
*based on our expectation that the positive market environment remains unchanged
21
Occupancy
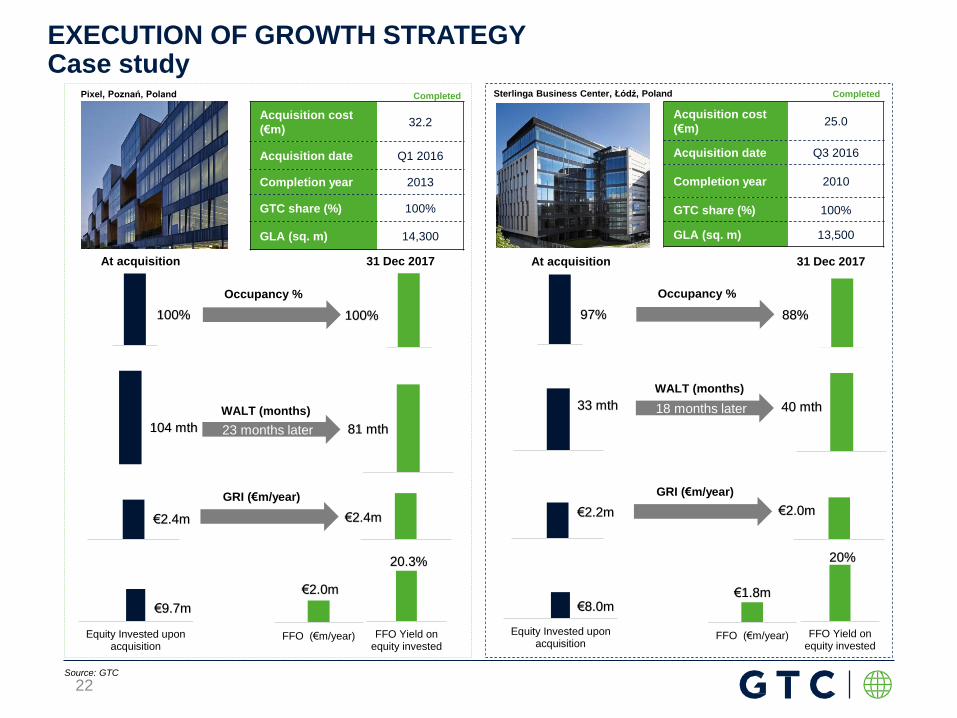
22
Acquisition cost
(€m)32.2
Acquisition date Q1 2016
Completion year 2013
GTC share (%) 100%
GLA (sq. m) 14,300
Acquisition cost
(€m)25.0
Acquisition date Q3 2016
Completion year 2010
GTC share (%) 100%
GLA (sq. m) 13,500Duna Tower
Budapest, Hungary
Occupancy
GRI (€m/year)
Equity Invested uponacquisition
WALT (months)
FFO Yield onequity invested
FFO (€m/year)
100% 100%
104 mth 81 mth23 months later
€2.4m €2.4m
€9.7m
GRI (€m/year)
€2.0m
Occupancy %
WALT (months)
Occupancy
WALT (months)
GRI (€m/year)
Equity Invested uponacquisition
FFO Yield onequity invested
FFO (€m/year)
97% 88%
33 mth 40 mth18 months later
€2.2m €2.0m
€8.0m€1.8m
Occupancy %
WALT (months)
GRI (€m/year)
Occupancy
WALT (months)
GRI (€m/year)
Pixel, Poznań, Poland Sterlinga Business Center, Łódź, Poland
20.3% 20%
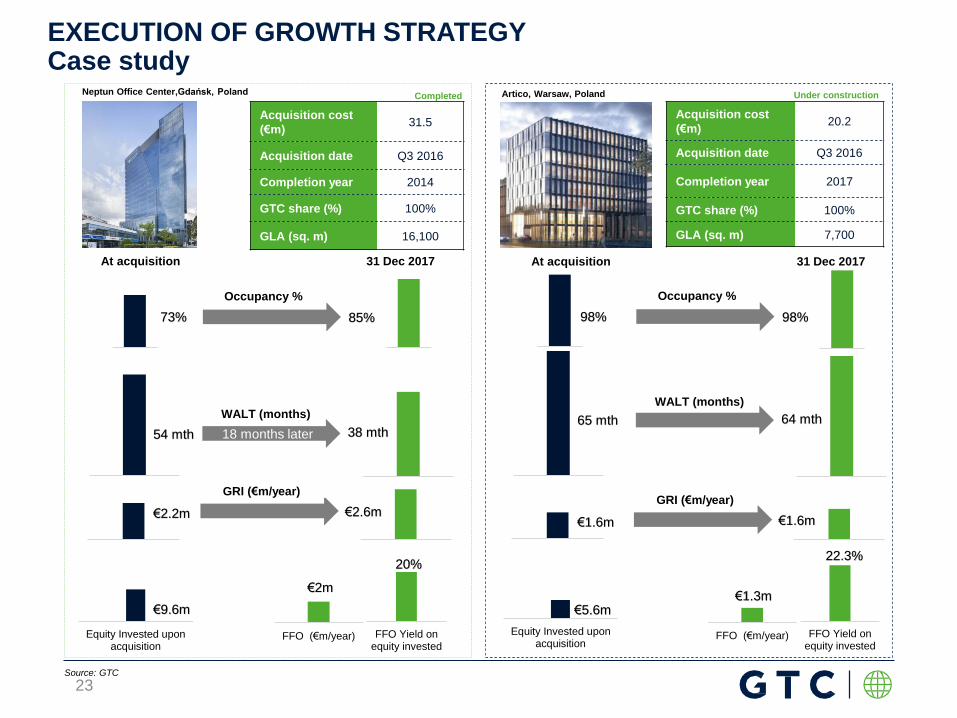
EXECUTION OF GROWTH STRATEGYCase study
Completed Completed
GRI (€m/year)
At acquisition 31 Dec 2017 At acquisition 31 Dec 2017
Source: GTC
Occupancy
23
Acquisition cost
(€m)31.5
Acquisition date Q3 2016
Completion year 2014
GTC share (%) 100%
GLA (sq. m) 16,100
Acquisition cost
(€m)20.2
Acquisition date Q3 2016
Completion year 2017
GTC share (%) 100%
GLA (sq. m) 7,700Duna Tower
Budapest, Hungary
Occupancy
GRI (€m/year)
WALT (months)
FFO Yield onequity invested
FFO (€m/year)
73% 85%
54 mth 38 mth18 months later
€2.2m €2.6m
€9.6m
€2m
Occupancy %
WALT (months)
Occupancy
GRI (€m/year)
FFO Yield onequity invested
FFO (€m/year)
98% 98%
65 mth 64 mth
€1.6m €1.6m
€5.6m€1.3m
Occupancy %
WALT (months)
Occupancy
GRI (€m/year)
Artico, Warsaw, PolandNeptun Office Center,Gdańsk, Poland
WALT (months) WALT (months) WALT (months)
22.3%
EXECUTION OF GROWTH STRATEGYCase study
Completed Under construction
GRI (€m/year)GRI (€m/year)
GRI (€m/year)
20%
At acquisition 31 Dec 2017 At acquisition 31 Dec 2017
Equity Invested uponacquisition
Equity Invested uponacquisition
Source: GTC

GRI (€m/year)
24
Acquisition cost
(€m)53.0
Acquisition date Q4 2015
Completion year 2006
GTC share (%) 100%
GLA (sq. m) 31,300
Acquisition cost
(€m)32.5
Acquisition date Q2 2016
Completion year 2008/2009
GTC share (%) 100%
GLA (sq. m) 14,800
Duna Tower, Budapest, Hungary
Premium Point
Bucharest, Romania
Premium Plaza
Bucharest, Romania
Occupancy
WALT (months)
GRI (€m/year)
Occupancy
WALT (months)
FFO Yield onequity invested
FFO (€m/year)
82% 95%
43 mth 34 mth26 months later
€4.1m €4.6m
€19.8m
GRI (€m/year)
15.2%€3.0m
Occupancy %
WALT (months)
GRI (€m/year)
Occupancy
WALT (months)
GRI (€m/year)
Equity Invested uponacquisitionity
FFO Yield onequity invested
FFO (€m/year)
81% 97%
33 mth 30 mth20 months later
€2.6m €3.2m
€13.5m
15.6%€2.1m
Occupancy %
WALT (months)
GRI (€m/year)
Occupancy
WALT (months)
EXECUTION OF GROWTH STRATEGYCase study
Completed Completed
At acquisition 31 Dec 2017 At acquisition 31 Dec 2017
Equity Invested uponacquisition
Source: GTC

DEVELOPMENT PIPELINE
25
Galeria Północna, Warsaw

City
Total
GLA
(ths.
sq.
m)
Investment
cost
until
31.12.2017
(€m)
Total
investment
cost
(€m)
Revaluation
gain
recognized
until
31.12.2017
(€m)
Book value
as at
31.12.2017
(€m)
Expected
development
yield
JLL
prime
yield
Expected
rent
(€m)
Expected
completion
Under construction
White House Budapest 21.5 28.8 48.1 1.5 30.3 8.3% 6.00% 4.0 Q2 2018
Ada Mall Belgrade 34.4 47.7 105.3 3.7 51.4 10.0% 8.00% 10.5 Q1 2019
Green Heart Belgrade 46.0 54.3 92.7 1.1 55.4 9.5% 8.50% 8.8 2018/2019
ABC I Sofia 15.6 8.9 28.2 - 8.9 9.6% 7.75% 2.7 Q1 2019
Matrix A Zagreb 10.4 2.5 20.2 - 2.5 8.9% 8.25% 1.8 Q2 2019
TOTAL UNDER CONSTRUCTION 127.9 142.2 294.5 6.3 148.5 27.8
Planning stage - Construction to start within 12 months
ABC II Sofia 17.5 6.4 31.2 - 6.4 10.0% 7.75% 3.1 2019/2020
City Rose Park 1&2 Bucharest 35.5 8.0 69.2 - 8.0 9.8% 7.50% 6.8 H1 2020
Matrix B Zagreb 10.4 2.2 20.2 - 2.2 8.9% 8.25% 1.8 H1 2020
Kompakt Budapest 29.0 13.0 64.0 - 13.0 8.8% 6.00% 5.6 2019/2020
The Twist - Budapest City
TowerBudapest 36.0 13.6 96.1 - 13.6 8.7% 6.00% 8.4 2020
TOTAL PLANNING – 12 M 128.4 43.2 280.7 - 43.2 25.7
Planning stage
City Rose Park 3 Bucharest 14.5 3.2 28.6 - 3.2 9.4% 7.50% 2.7 2020/2021
GTC X Belgrade 17.0 5.5 30.9 - 5.5 10.7% 8.50% 3.3 2019/2020
Galeria Wilanów Warsaw 61.0 33.1 180.0 - 33.1 10.0% 4.90% 18.0 2020
Matrix (F) (ca.3-5 build.) Zagreb 54.7 12.1 104.0 - 12.1 8.9% 8.25% 9.3 2021/2023
Platinum Business Park 6 Warsaw 12.9 2.1 27.1 - 2.1 8.2% 6.00% 2.2 2021
Mikołowska Katowice 15.0 3.2 31.5 - 3.2 7.9% 7.00% 2.5 2021
TOTAL PLANNING 175.1 59.2 402.1 - 59.2 38.0
GRAND TOTAL 431.4 244.6 977.3 250.9 91.5
Source: GTC
Note: (1) Investment cost includes cost of land, construction cost, marketing cost and cost of finance; (2) JLL prime yield as published in City Reports
(1)
UNIQUE DEVELOPMENT PIPELINEUnlocking significant embedded value through development projects
(1) (2)
26

White House
Budapest, Hungary
GLA (sq. m) 21,500
Parking units 299
Total investment cost
(€m)48.1
Cost up to date (€m) 28.8
Recognized
revaluation gain up to
date (€m)
1.5
Assumed
development
yield
8.3%
Expected completion Q2 2018
Ada Mall
Belgrade, Serbia
GLA (sq. m) 34,400
Parking units 1,000
Total investment cost
(€m)105.3
Cost up to date (€m) 47.7
Recognized
revaluation gain up to
date (€m)
3.7
Assumed
development
yield
10%
Expected completion Q1 2019
UNIQUE DEVELOPMENT PIPELINE128,000 sq. m under construction out of which 49,000 sq. m to be completed in 2018
Source: GTC
Green Heart
Belgrade, Serbia
GLA (sq. m)
46,000
(I ph. – 26,000;
II ph. – 20,000)
Parking units 880
Total investment
cost (€m)92.7
Cost up to date
(€m)54.3
Recognized
revaluation gain up
to date (€m)
1.1
Assumed
development yield9.5%
Expected
completion
I ph.- 2018
II ph. - 2019
Advance Business Center I
Sofia, Bulgaria
GLA (sq. m) 15,600
Parking units 230
Total investment cost
(€m)28.2
Cost up to date (€m) 8.9
Recognized revaluation
gain up to date (€m)-
Assumed development
yield9.6%
Expected completion Q1 2019
Matrix A
Zagreb, Croatia
GLA (sq. m) 10,400
Parking units 300
Total investment cost
(€m)20.2
Cost up to date (€m) 2.5
Recognized
revaluation gain up to
date (€m)
-
Assumed development
yield8.9%
Expected completion Q2 2019
27

UNIQUE DEVELOPMENT PIPELINE128,400 sq. m in the planning stage in 5 projects planned for 2019-2020
Source: GTC
Advance Business Center II
Sofia, Bulgaria
GLA
(sq. m)17,500
Parking units 300
GTC share (%) 100%
Expected
completion2019/2020
GLA
(sq. m)35,500
Parking units 780*
GTC share (%) 100%
Expected
completionH1 2020
City Rose Park 1&2
Bucharest, Romania
GLA
(sq. m)10,400
Parking units 300
GTC share (%) 100%
Expected
completionH1 2020
Matrix B
Zagreb, Croatia
GLA
(sq. m)29,000
Parking units 580
GTC share (%) 100%
Expected
completion2019/2020
Kompakt
Budapest, Hungary
GLA
(sq. m)36,000
Parking units 620
GTC share (%) 100%
Expected
completion2020
The Twist – Budapest
City Tower
Budapest, Hungary
* For 3 buildings
28

FULLY INTEGRATED PLATFORM
29
Korona Office Complex, Cracow

HIGH QUALITY PROPERTY MANAGEMENT AND DEVELOPMENT PLATFORM WITH DEEP MARKET KNOW-HOW
30
Competitive advantage through entrepreneurial local
management structures
Coverage of full value chain provides for independence and
optionality
Str
ate
gy
Asset Management
DevelopmentActive management
Efficient management structure combining centralized functions and local offices in close proximity to properties allows for swift
and resource-efficient realization of value creation potential
Source: GTC
ATTRACTIVE “TOTAL RETURN” PROPOSITION
31
5
Avenue Mall, Zagreb

FFO I
FFO I/shareEPRA NAV/share
€0.09
€0.10
2016 2017
€1.95
€2.28
31 Dec'16 31 Dec'17
€42M
€47M
2016 2017
EPRA NAV
€897M
€1,073M
31 Dec'16 31 Dec'17
RECORD RESULTS
+20%
Source: GTC
+13%
+17%+11%€0.34 €0.34
2016 2017
€125M
€189M
2016 2017
Profit before tax
+51%
Earnings/shareAverage number
of shares
2016: 460,216,478
2017: 465,467,259
Earning per share in 2016 was positively impacted by one off tax benefit in the amount of €0,10 per share
32

GAV EBITDA
Key metrics 2017 2016
Gross margin from
rental activity (€m)91 87
Rental margin 74% 76%
EBITDA (€m) 78 72
FFO I (€m) 47 42
FFO I /share (€) 0.10 0.09
RECORD RESULTS
Source: GTC
Key metrics 31 Dec. 2017 31 Dec. 2016
GAV (€m) 1,958 1,624
Net Debt (€m) 829 703
Net LTV 42% 43%
EPRA NAV (€m) 1,073 897
EPRA NAV/share (€) 2.28 1.95
€1,624M
€1,958M
31 Dec'16 31 Dec'17
+21%
€87M€91M
2016 2017
Gross margin from
rental activity
+5%
€72M
€78M
2016 2017
+9%
33

35 34 27 17 19
81
57 78
50
34
25
148
159
41
226
31 Dec.'18 31 Dec.'19 31 Dec.'20 31 Dec.'21 31 Dec.'22 31 Dec.'23 andbeyond
137
225
176
126
60
307
EUR89%
Other currencies
11%
Fixed/hedged90%
Floating10%
Unsecured debt 18%
Secured debt82%
Balanced debt split
As of 31 December 2017
Debt maturity
As of 31 December 2017
Interest rate split
Bonds
€m
* Other currencies include PLN and HUF
Loans to be recycled/sale of asset
As of 31 December 2017
CONSERVATIVE FINANCING STRUCTUREAverage interest rate down to 2.8% p.a.
For 12M
ended
Source: GTC
4.3%
3.4%3.2%
2.8%
2014 2015 2016 2017
Average interest rate
Loans amortization
34

FFO I bridge
€m
FUNDS FROM OPERATIONS (FFO I)Robust acquisitions and developments drive FFO I
FFO I
€m
FFO I / share
€
28
38
42
47
2014 2015 2016 2017
As of 31 December 2017
FFO I per share of €0.10
Robust operational development
Significant development pipeline to further boost
FFO I
Solid basis for sustainable and long term dividend
policy
189 (4)(149)
4 5 347
Profit before tax Tax paid FV re-measurement SBP Foreign exchangedifferences, net
Unpaid, financialexpenses, net
FFO
0.090.10
2016 2017
Source: GTC
+11%
35

SHAREHOLDER INFORMATION
36
City Gate, Bucharest
1 700
2 200
2 700
3 200
3 700
4 200
4 700
5 200
5,00
6,00
7,00
8,00
9,00
10,00
11,00
GTC mWIG 40
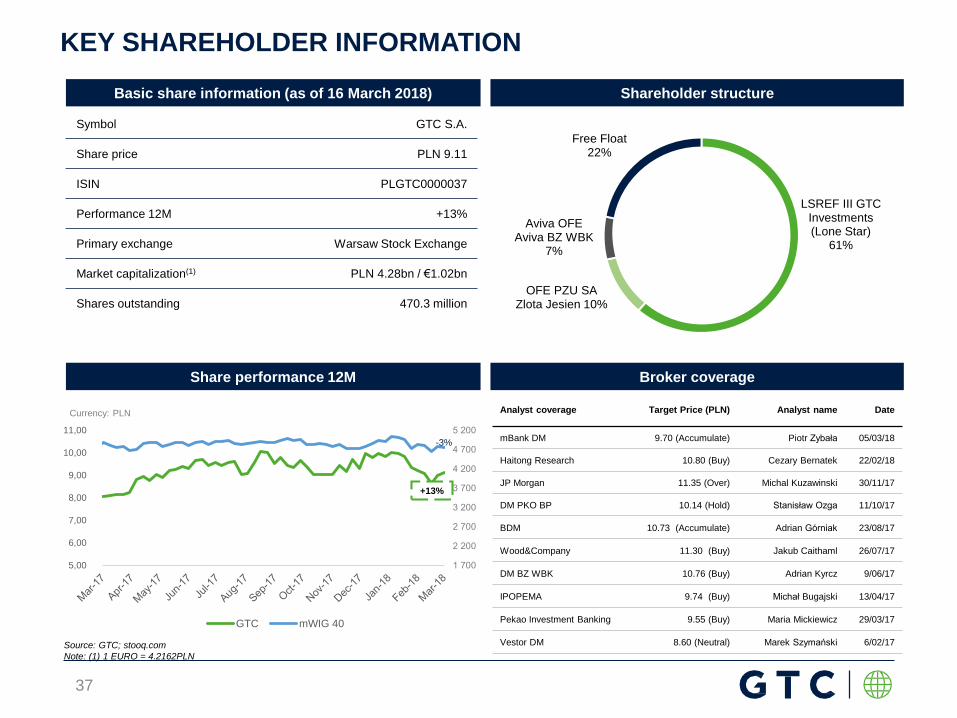
Basic share information (as of 16 March 2018)
Source: GTC; stooq.com
Note: (1) 1 EURO = 4.2162PLN
Shareholder structure
Share performance 12M Broker coverage
Currency: PLN
Symbol GTC S.A.
Share price PLN 9.11
ISIN PLGTC0000037
Performance 12M +13%
Primary exchange Warsaw Stock Exchange
Market capitalization(1) PLN 4.28bn / €1.02bn
Shares outstanding 470.3 million
LSREF III GTC Investments (Lone Star)
61%
OFE PZU SA Zlota Jesien 10%
Aviva OFE Aviva BZ WBK
7%
Free Float22%
+13%
KEY SHAREHOLDER INFORMATION
-3%
Analyst coverage Target Price (PLN) Analyst name Date
mBank DM 9.70 (Accumulate) Piotr Zybała 05/03/18
Haitong Research 10.80 (Buy) Cezary Bernatek 22/02/18
JP Morgan 11.35 (Over) Michal Kuzawinski 30/11/17
DM PKO BP 10.14 (Hold) Stanisław Ozga 11/10/17
BDM 10.73 (Accumulate) Adrian Górniak 23/08/17
Wood&Company 11.30 (Buy) Jakub Caithaml 26/07/17
DM BZ WBK 10.76 (Buy) Adrian Kyrcz 9/06/17
IPOPEMA 9.74 (Buy) Michał Bugajski 13/04/17
Pekao Investment Banking 9.55 (Buy) Maria Mickiewicz 29/03/17
Vestor DM 8.60 (Neutral) Marek Szymański 6/02/17
37

ADDITIONAL
MATERIAL
38

39
A) FINANCIALS

(€m) 2017 2016
Rental and service revenue 123 114
Cost of rental operations (32) (28)
Residential sale result 2 1
Gross margin from operations 92 87
Selling expenses (2) (3)
G&A expenses w/o share based provision (12) (11)
Profit/(loss) from revaluation of invest. property and
impairment of residential projects149 85
Other income/ (expenses),net (5) (3)
Profit (loss) from continuing operations before tax
and finance income / (expense)222 155
Foreign exchange differences, net (5) 2
Finance expenses, net (29) (28)
Share of profit/(loss) of associates - (4)
Profit/(loss) before tax 189 125
Taxation (32) 35
Profit/(loss) for the period 157 160
Attributable to equity holders of the parent 156 159
Attributable to non-controlling interest - 1
Comments
Profit from revaluation
reflects mainly
developers profit upon
completion of Galeria
Północna and FortyOne
III combined with value
appreciation of income
generating assets
following an
improvement in their
operating results (mostly
Galeria Jurajska)
2
2
1 An increase in rental and
service revenue mainly
due to acquisition of
income generating
assets and completion of
projects
1
INCOME STATEMENT51% uplift in pre-tax profit
Source: GTC
3
In 2016 the Company
recognized a one–off tax
benefit of €48m,
following a merger of
GTC S.A. with GTC
Real Estate Investments
Ukraine B.V. and GTC
RH B.V.
3
40

(€m) 31 Dec 2017 31 Dec 2016
Investment property, assets held for sale
and L.T. assets (incl. IPUC)1,941 1,605
Residential landbank and inventory 16 19
Escrow accounts for purchase of assets 1 -
Fixed assets 7 6
Investment in shares and associates 1 4
Cash & cash equivalents 149 150
Deposits 53 28
Vat receivable 7 17
Other current assets 8 10
TOTAL ASSETS 2,183 1,839
Common equity 937 787
Minorities 4 3
Short and long term financial debt 1,034 893
Derivatives 3 5
Deferred tax liabilities 126 98
Other liabilities 79 53
TOTAL EQUITY AND LIABILITIES 2,183 1,839
Increase in investment
property driven by acquisitions
and development activity offset
partially by disposal of Galleria
Stara Zagora and Galleria
Burgas
1
Comments
1
3
Increase in common equity
due to an increase in
accumulated profit and an
increase in share premium
following issue of L series
shares (for the purpose of
dividend payment) above the
nominal value
3
Source: GTC
4
Increase in debt comes
mainly from issue of new
corporate bonds and loan
(€79m) as well as a
drawdown under Galeria
Pólnocna loan facility
(€152m). The increase was
partially offset by repayment
of bank loans (€27m)
following the sale of projects
and repayment of bonds
(€46m)
4
2
Strong cash position2
BALANCE SHEETValue creation from Galeria Północna underpins future development and acquisition
41

Source: GTC
42
Cost of financing¹
CONSERVATIVE FINANCING STRUCTURELTV at 42%, interest cover of 3.5x
40
28 2730
2014 2015 2016 2017
€m
Short and long term financial debt
922
739
893
1,034
31 Dec. 2014 31 Dec. 2015 31 Dec. 2016 31 Dec. 2017
€m
Note (1) Cash basis, including loan origination costs
Source: GTC
As of 31 December 2017
LTV
54%
39%43% 42%
2014 2015 2016 2017
€m
Financing activity
€79m of new bonds and corporate loans
€151m of new construction loans
€333m of refinancing loans
PLN 196m of bonds repayment
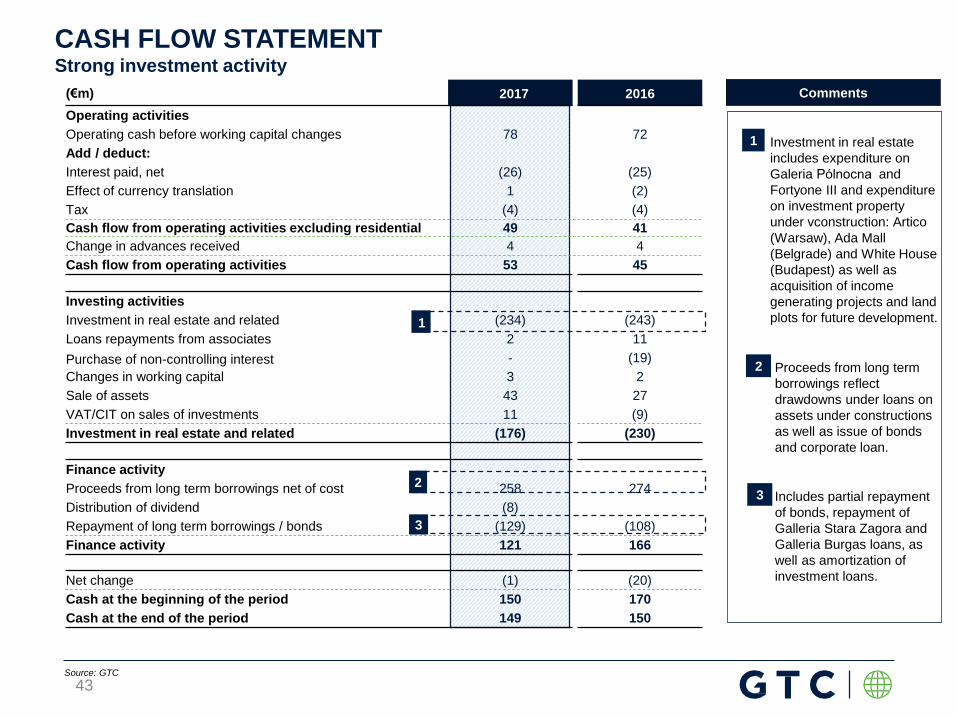
(€m) 2017 2016
Operating activities
Operating cash before working capital changes 78 72
Add / deduct:
Interest paid, net (26) (25)
Effect of currency translation 1 (2)
Tax (4) (4)
Cash flow from operating activities excluding residential 49 41
Change in advances received 4 4
Cash flow from operating activities 53 45
Investing activities
Investment in real estate and related (234) (243)
Loans repayments from associates 2 11
Purchase of non-controlling interest - (19)
Changes in working capital 3 2
Sale of assets 43 27
VAT/CIT on sales of investments 11 (9)
Investment in real estate and related (176) (230)
Finance activity
Proceeds from long term borrowings net of cost 258 274
Distribution of dividend (8)
Repayment of long term borrowings / bonds (129) (108)
Finance activity 121 166
Net change (1) (20)
Cash at the beginning of the period 150 170
Cash at the end of the period 149 150
Investment in real estate
includes expenditure on
Galeria Pólnocna and
Fortyone III and expenditure
on investment property
under vconstruction: Artico
(Warsaw), Ada Mall
(Belgrade) and White House
(Budapest) as well as
acquisition of income
generating projects and land
plots for future development.
1
Comments
1
2
Proceeds from long term
borrowings reflect
drawdowns under loans on
assets under constructions
as well as issue of bonds
and corporate loan.
2
CASH FLOW STATEMENTStrong investment activity
3
Includes partial repayment
of bonds, repayment of
Galleria Stara Zagora and
Galleria Burgas loans, as
well as amortization of
investment loans.
3
1
Source: GTC
43

(€m) 31 December 2017 31 December 2016
Long-term bank debt and financial liabilities 908 739
Short-term bank debt and financial liabilities 126 154
Loans from minorities (10) (18)
Deferred issuance debt expense 7 6
Total bank debt and financial liabilities 1,031 881
Cash & cash equivalents & deposits 202 178
Net debt and financial liabilities 829 703
Total property (including escrow funds deposited for acquisition of land) 1,958 1,624
Net loan to value ratio 42% 43%
Average interest rate 2.8% 3.2%
Interest cover 3.5x 3.5x
DEBT AND LTV
Source: GTC
44
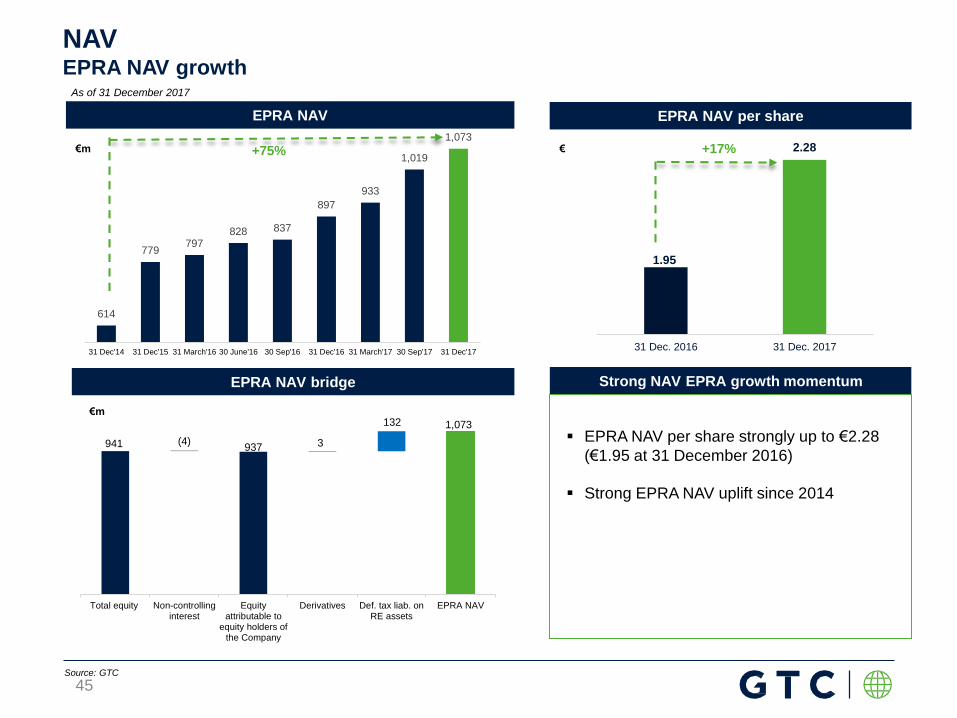
EPRA NAV
€m
NAVEPRA NAV growth
EPRA NAV bridge
614
779797
828 837
897
933
1,019
1,073
31 Dec'14 31 Dec'15 31 March'16 30 June'16 30 Sep'16 31 Dec'16 31 March'17 30 Sep'17 31 Dec'17
EPRA NAV per share
Strong NAV EPRA growth momentum
€m
As of 31 December 2017
EPRA NAV per share strongly up to €2.28
(€1.95 at 31 December 2016)
Strong EPRA NAV uplift since 2014
1.95
2.28
31 Dec. 2016 31 Dec. 2017
+17%
EPRA NAV per share
€
941 (4)937 3
132 1,073
Total equity Non-controllinginterest
Equityattributable to
equity holders ofthe Company
Derivatives Def. tax liab. onRE assets
EPRA NAV
+75%
Source: GTC
45

46
B) YIELDING ASSETS BY COUNTRY

Note:
IDEAL TIMING TO HAVE EXPOSURE IN CEE AND SEE MARKETS
47
rental growth slowing rents falling
rents bottoming out; rental growth
accelerating
Source: JLL
BUCHAREST, WARSAW, Kiev,
Moscow, Zurich
Geneva
Istanbul
London WE
Athens
Lyon, Oslo
London City
BUDAPEST, Prague,
Edinburgh, Munich,
Copenhagen,
Stockholm
Paris CBD
Brussels
Amsterdam,
Barcelona,
Helsinki, Lizbona,
Madrid, Rome,
St. Petersburg
Rents in the CEE and SEE vary by market
GTC ideally positioned to benefit from anticipated rent reversion in key CEE and SEE markets
GTC market
Milan
Luxemburg, Berlin
Frankfurt, Stuttgart
Dublin
Dusseldorf, Cologne

POLAND
48
Univeristy Business Park, Łódź Galeria Jurajska, Częstochowa
Francuska Office Center, Katowice
Aeropark Business Center, WarsawKorona Office Complex, Kraków
Pascal, Kraków
Globis Poznań, Poznań
Globis Wrocław, Wrocław
Number of
buildings19
Book value
(€m)
957
(45% office;
55% retail)
% of income
generating
portfolio
58%
GLA
(ths. sq. m)325
Occupancy
(%)91%
Average
headline rent
(€/sq. m)
16.5
Key statisticsImpressions
Pixel, PoznańSterlinga Business Center, Łódź
Source: GTC
Galeria Północna, Warszawa
Artico, Warsaw

Location Częstochowa, Poland
Year of completion 2009
Book value as at 31/12/17 €190m
GLA 48,700 sq. m
Occupancy 97%
WALT by rental income 3.4 yrs
Annualised in-place rent €11.0m
Average rent 19.8 €/sq. m
Overv
iew
TO
P 5
TE
NA
NT
S
SHOPING MALL
INVESTMENT PROPERTYGaleria Jurajska
Source: GTC
49

Location Warsaw, Poland
Year of completion 2017
Book value as at 31/12/17 €337m
GLA 64,800 sq. m
Occupancy 89%
WALT by rental income 6.3 yrs
Annualised in-place rent €14.7m
Average rent 21.3 €/sq. m
Green certification LEED GOLD pre-certification
Overv
iew
TO
P 5
TE
NA
NT
S
SHOPING MALL
INVESTMENT PROPERTYGaleria Północna
Source: GTC
50
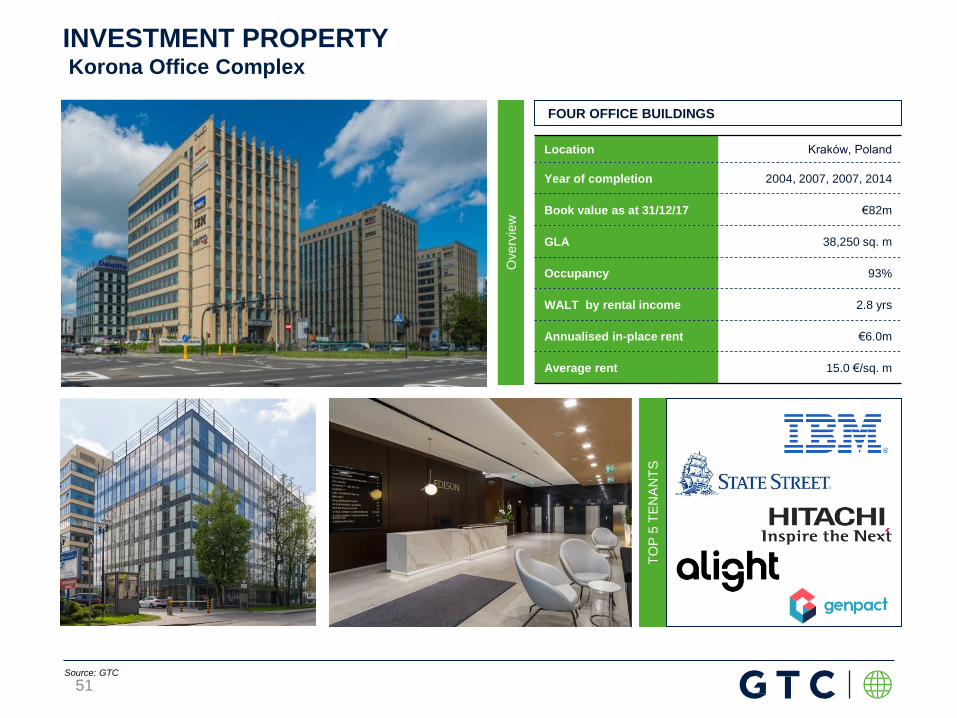
Location Kraków, Poland
Year of completion 2004, 2007, 2007, 2014
Book value as at 31/12/17 €82m
GLA 38,250 sq. m
Occupancy 93%
WALT by rental income 2.8 yrs
Annualised in-place rent €6.0m
Average rent 15.0 €/sq. m
Overv
iew
TO
P 5
TE
NA
NT
S
FOUR OFFICE BUILDINGS
INVESTMENT PROPERTYKorona Office Complex
Source: GTC
51

Location Poznań, Poland
Year of completion 2003
Book value as at 31/12/17 €29m
GLA 13,500 sq. m
Occupancy 96%
WALT by rental income 2.5 yrs
Annualised in-place rent €2.2m
Average rent 13.8 €/sq. m
Overv
iew
TO
P 5
TE
NA
NT
S
OFFICE BUILDING
INVESTMENT PROPERTYGlobis Poznań
Source: GTC
52

Location Warsaw, Poland
Year of completion 2007,2008,2011
Book value as at 31/12/17 €53m
GLA 28,800 sq. m
Occupancy 77%
WALT by rental income 2.3 yrs
Annualised in-place rent €3.5m
Average rent 14.2 €/sq. m
Green certification LEED GOLD
Overv
iew
TO
P 5
TE
NA
NT
S
THREE OFFICE BUILDINGS
INVESTMENT PROPERTYAeropark Office Centre
Source: GTC
53

Location Poznań, Poland
Year of completion 2013
Book value as at 31/12/17 €34m
GLA 14,300 sq. m
Occupancy 100%
WALT by rental income 6.8 yrs
Annualised in-place rent €2.4m
Average rent 13.7 €/sq. m
Green certification BREEAM VERY GOOD
Overv
iew
TO
P T
EN
AN
T
OFFICE BUILDING
INVESTMENT PROPERTYPixel
Source: GTC
54

Location Wrocław, Poland
Year of completion 2008
Book value as at 31/12/17 €36m
GLA 16,100 sq. m
Occupancy 99%
WALT by rental income 3.1 yrs
Annualised in-place rent €2.7m
Average rent 14.5 €/sq. m
Overv
iew
TO
P 5
TE
NA
NT
S
OFFICE BUILDING
INVESTMENT PROPERTYGlobis Wrocław
Source: GTC
55

Location Łódź, Poland
Year of completion 2010
Book value as at 31/12/17 €29m
GLA 13,400 sq. m
Occupancy 88%
WALT by rental income 3.4 yrs
Annualised in-place rent €2.0m
Average rent 14.0 €/sq. m
Green certification BREEAM EXCELLENT
Overv
iew
TO
P 4
TE
NA
NT
S
OFFICE BUILDING
INVESTMENT PROPERTYSterlinga Business Center
Source: GTC
56
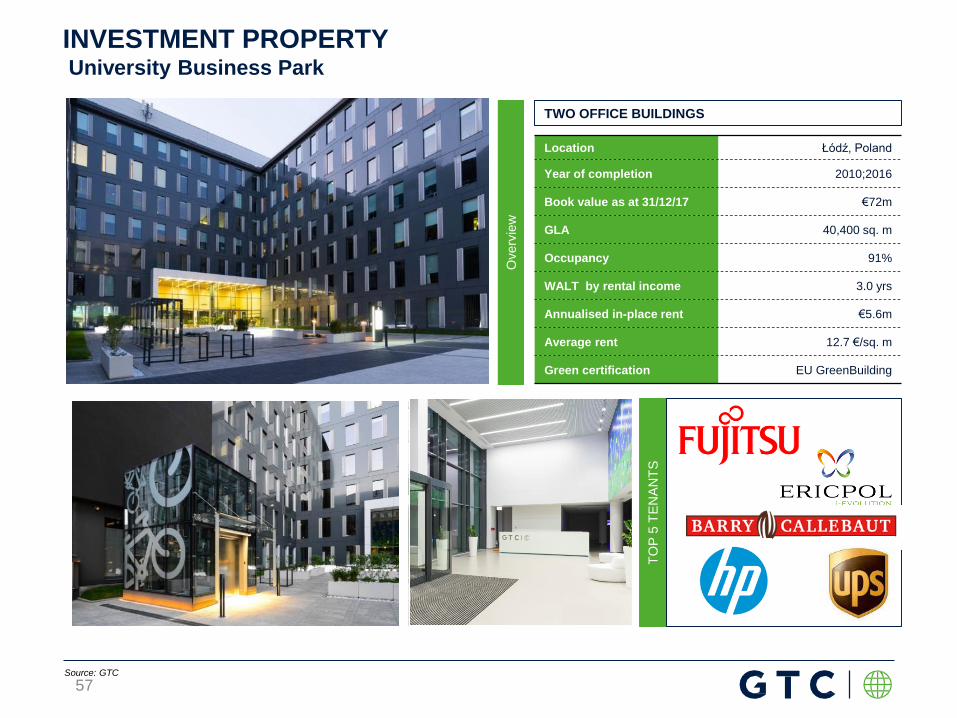
Location Łódź, Poland
Year of completion 2010;2016
Book value as at 31/12/17 €72m
GLA 40,400 sq. m
Occupancy 91%
WALT by rental income 3.0 yrs
Annualised in-place rent €5.6m
Average rent 12.7 €/sq. m
Green certification EU GreenBuilding
Overv
iew
TO
P 5
TE
NA
NT
S
TWO OFFICE BUILDINGS
INVESTMENT PROPERTYUniversity Business Park
Source: GTC
57

Location Gdańsk, Poland
Year of completion 2014
Book value as at 31/12/17 €35m
GLA 16,100 sq. m
Occupancy 85%
WALT by rental income 3.1 yrs
Annualised in-place rent €2.6m
Average rent 15.8 €/sq. m
Green certification BREEAM VERY GOOD
Overv
iew
TO
P 5
TE
NA
NT
S
OFFICE BUILDING
INVESTMENT PROPERTYNeptun Office Center
Source: GTC
58

Location Katowice, Poland
Year of completion 2010
Book value as at 31/12/17 €40m
GLA 23,000 sq. m
Occupancy 79%
WALT by rental income 2.3 yrs
Annualised in-place rent €2.7m
Average rent 14.2 €/sq. m
Green certification EU GreenBuilding
Overv
iew
TO
P 5
TE
NA
NT
S
TWO OFFICE BUILDINGS
INVESTMENT PROPERTYFrancuska Office Centre
Source: GTC
59

Overv
iew
TO
P T
EN
AN
TS
OFFICE BUILDING
INVESTMENT PROPERTYArtico
Source: GTC
60
Location Warsaw, Poland
Year of completion 2017
Book vaue as at 31/12/17 €21m
GLA 7,700 sq. m
Occupancy 98%
WALT by rental income 5.4 yrs
Annualised in-place rent €1.6m
Average rent 17.1 €/sq. m
Green certification Under BREEAM certification

HUNGARY
61
Center Point, Budapest
Spiral, Budapest
GTC Metro, Budapest
Impressions
Duna Tower, Budapest
Key statistics
Number of
buildings5
Book value
(€m)
229
(100% office)
% of income
generating
portfolio
14%
GLA
(ths. sq. m)119
Occupancy
(%)98%
Average
headline rent
(€/sq. m)
12.1
Source: GTC

Location Budapest, Hungary
Year of completion 2004; 2006
Book value as at 31/12/17 €85m
GLA 40,900 sq. m
Occupancy 97%
WALT by rental income 1.9 yrs
Annualised in-place rent €6.2m
Average rent 13.1 €/sq. m
Green certification LEED GOLD
Overv
iew
TO
P 5
TE
NA
NT
S
TWO OFFICE BUILDINGS
INVESTMENT PROPERTYCenter Point
Source: GTC
62

Location Budapest, Hungary
Year of completion 2006
Book value as at 31/12/17 €66m
GLA 31,300 sq. m
Occupancy 95%
WALT by rental income 2.8 yrs
Annualised in-place rent €4.6m
Average rent 12.7 €/sq. m
Green certification BREEAM GOOD
Overv
iew
TO
P 5
TE
NA
NT
S
OFFICE BUILDING
INVESTMENT PROPERTYDuna Tower
Source: GTC
63

Location Budapest, Hungary
Year of completion 2009
Book value as at 31/12/17 €50m
GLA 30,600 sq. m
Occupancy 100%
WALT by rental income 2.3 yrs
Annualised in-place rent €3.9m
Average rent 10.6 €/sq. m
Overv
iew
OFFICE BUILDING
INVESTMENT PROPERTYSpiral
Source: GTC
64

Location Budapest, Hungary
Year of completion 2010
Book value as at 31/12/17 €28m
GLA 16,200 sq. m
Occupancy 100%
WALT by rental income 2.4 yrs
Annualised in-place rent €2.3m
Average rent 11.6 €/sq. m
Overv
iew
TO
P T
EN
AN
T
OFFICE BUILDING
INVESTMENT PROPERTYGTC Metro
Source: GTC
65

ROMANIA
66
City Gate, Bucharest
Impressions
Premium Point, BucharestPremium Plaza, Bucharest
Key statistics
Number of
buildings5
Book value
(€m)
196
(100% office)
% of income
generating
portfolio
12%
GLA
(ths. sq. m)67
Occupancy
(%)97%
Average
headline rent
(€/sq. m)
18.4
Source: GTC
Cascade Office Building, Bicharest
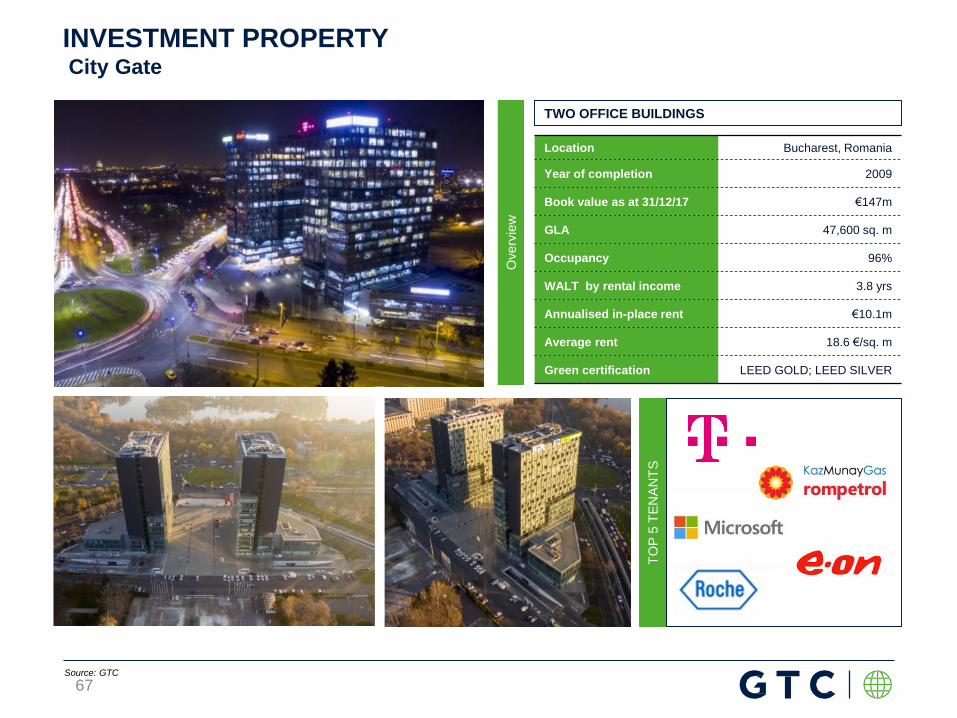
Location Bucharest, Romania
Year of completion 2009
Book value as at 31/12/17 €147m
GLA 47,600 sq. m
Occupancy 96%
WALT by rental income 3.8 yrs
Annualised in-place rent €10.1m
Average rent 18.6 €/sq. m
Green certification LEED GOLD; LEED SILVER
Overv
iew
TO
P 5
TE
NA
NT
S
TWO OFFICE BUILDINGS
INVESTMENT PROPERTYCity Gate
Source: GTC
67

Location Bucharest, Romania
Year of completion 2005
Book value as at 31/12/17 €9m
GLA 4,200 sq. m
Occupancy 100%
WALT by rental income 2.4 yrs
Annualised in-place rent €0.9m
Average rent 17.5 €/sq. m
Overv
iew
TO
P 4
TE
NA
NT
S
OFFICE BUILDING
INVESTMENT PROPERTYCascade Office Building
Source: GTC
Taiwan TC
B Cafe Retail
68

Location Bucharest, Romania
Year of completion 2008; 2009
Book value as at 31/12/17 €39m
GLA 14,800 sq. m
Occupancy 97%
WALT by rental income 2.5 yrs
Annualised in-place rent €3.2m
Average rent 18.2 €/sq. m
Green certification DGNB GOLD
Overv
iew
TO
P 5
TE
NA
NT
S (
Pre
miu
m P
laza)
OFFICE BUILDING
INVESTMENT PROPERTYPremium Point and Premium Plaza
Source: GTC
TO
P 5
TE
NA
NT
S (
Pre
miu
m P
oin
t)
69

SERBIA
70
Belgrade Business Centre, Belgrade
19 Avenue, Belgrade
GTC House, Belgrade
Impressions
Fortyone phase I-III, Belgrade
Key statistics
Number of
buildings6
Book value
(€m)
163
(100% office)
% of income
generating
portfolio
10%
GLA
(ths. sq. m)76
Occupancy
(%)97%
Average
headline rent
(€/sq. m)
16.4
Source: GTC

Location Belgrade, Serbia
Year of completion 2005
Book value as at 31/12/17 €26m
GLA 13,300 sq. m
Occupancy 97%
WALT by rental income 3.1 yrs
Annualised in-place rent €2.5m
Average rent 16.1 €/sq. m
Green certification LEED GLOD
Overv
iew
TO
P 5
TE
NA
NT
S
OFFICE BUILDING
INVESTMENT PROPERTYGTC House
Source: GTC
71

Location Belgrade, Serbia
Year of completion 2008
Book value as at 31/12/17 €36m
GLA 17,100 sq. m
Occupancy 96%
WALT by rental income 1.3 yrs
Annualised in-place rent €3.4m
Average rent 17.4 €/sq. m
Green certification LEED GOLD
Overv
iew
TO
P 5
TE
NA
NT
S
OFFICE BUILDING
INVESTMENT PROPERTY19 Avenue
Source: GTC
EU Delegation Serbia
Australian Embassy
72

Location Belgrade, Serbia
Year of completion 2009
Book value as at 31/12/17 €39m
GLA 17,700 sq. m
Occupancy 98%
WALT by rental income 2.5 yrs
Annualised in-place rent €3.4m
Average rent 16.3 €/sq. m
Overv
iew
TO
P 3
TE
NA
NT
S
OFFICE BUILDING
INVESTMENT PROPERTYBelgrade Business Center
Source: GTC
73

Location Belgrade, Serbia
Year of completion 2015,2016,2017
Book value as at 31/12/17 €62m
GLA 28,000 sq. m
Occupancy 97%
WALT by rental income 2.8 yrs
Annualised in-place rent €4.7m
Average rent 16.1 €/sq. m
Green certification LEED GOLD
Overv
iew
TO
P 5
TE
NA
NT
S
THREE OFFICE BUILDINGS
INVESTMENT PROPERTYFortyOne I - III
Source: GTC
74
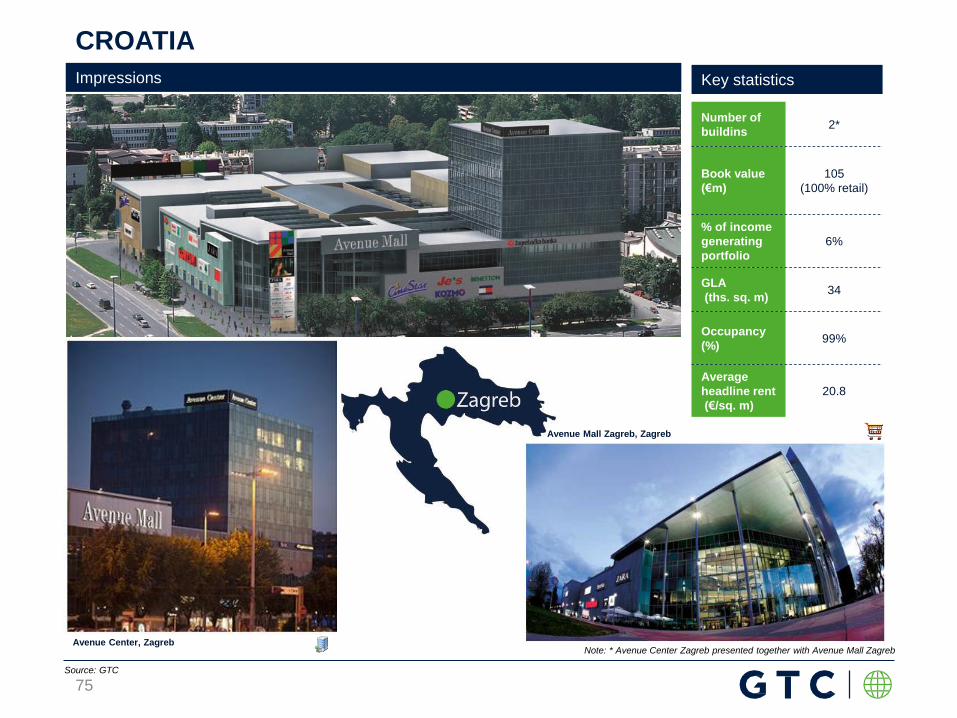
CROATIA
75
Avenue Mall Zagreb, Zagreb
Avenue Center, Zagreb
Impressions Key statistics
Number of
buildins2*
Book value
(€m)
105
(100% retail)
% of income
generating
portfolio
6%
GLA
(ths. sq. m)34
Occupancy
(%)99%
Average
headline rent
(€/sq. m)
20.8
Source: GTC
Note: * Avenue Center Zagreb presented together with Avenue Mall Zagreb

Location Zagreb, Croatia
Year of completion 2007
Book value as at 31/12/17 €105m
GLA 34,300 sq. m
Occupancy 99%
WALT by rental income 2.9 yrs
Annualised in-place rent €7.9m
Average rent 20.8 €/sq. m
Overv
iew
TO
P 5
TE
NA
NT
S (
Avenue
Centr
e)
RETAIL AND OFFICE BUILDINGS
INVESTMENT PROPERTYAvenue Mall Zagreb & Avenue Centre
Source: GTC
TO
P 5
TE
NA
NT
S (
Avenue
Mall)
76

PORTFOLIO: INCOME GENERATING PROPERTIES
As of 31 December 2017 Poland Hungary Serbia Croatia Romania Total
Office projects
Number of building 17 5 6 1* 5 34
Total GLA (ths. sq. m) 212 119 76 - 67 474
Book value (€m) 430 229 163 - 196 1,018
Average rent (€/sq. m) 14.0 12.1 16.4 - 18.4 14.7
Average occupancy (%) 89% 98% 97% - 97% 94%
Retail projects
Number of buildings 2 - - 1 - 3
Total GLA (ths. sq. m) 113 - - 34 - 147
Book value (€m) 527 - - 105 - 631
Average rent (€/sq. m) 20.6 - - 20.8 - 20.7
Average occupancy (%) 93% - - 99% - 94%
Total
Number of buildings 19 5 6 2 5 37
Total GLA (ths. sq. m) 325 119 76 34 67 621
Book value (€m) 957 229 163 105 196 1,649
Average rent (€/sq. m) 16.5 12.1 16.4 20.8 18.4 16.1
Average occupancy (%) 91% 98% 97% 99% 97% 94%
Note: * Avenue Center Zagreb presented together with Avenue Mall Zagreb
Source: GTC
77

78
C) PROJECTS UNDER CONSTRUCTION

VÁCI ÚT 47
Budapest
Hungary
GLA (sq. m) 21,500
Parking units 299
Completion year Q2 2018
GTC share (%) 100%
Description
Location
Pro
ject deta
ils
OFFICE BUILDING
GTC White House is that
very place: exhilarating,
uplifting green architecture
including an entirely
refurbished turn-of-the-
century stand alone loft of
2,000 sq. m
Class A office building
Underground parking
250-2,880 sq. m leasable areas
per floor
3 minutes walk to the metro
10 minutes to city center
UNDER CONSTRUCTIONWHITE HOUSE
Source: GTC
79

Belgrade, Serbia
situated at the intersection
of the residential neighbourhood
of Banovo Brdo, the Ada
Ciganlija Island, the old city
of Belgrade and New Belgrade
GLA (sq. m) 34,400
Parking units 1,000
Completion year Q1 2019
GTC share (%) 100%
Description
Location
Pro
ject deta
ils
The new shopping
destination spans of
commercial space, and
three levels of
underground parking
linked together by the mall.
Location in Belgrade, in the main
city recreation area (lake, park,
water sports, golf course, etc.)
The increasingly popular
recreational zone often has over
100,000 visitors daily and up to
300,000 at weekends, which
makes Ada Mall one of the best
located malls in Serbia.
More than 1,000 car parking
spaces
UNDER CONSTRUCTIONADA MALL
Source: GTC
80

GLA (sq. m) 46,000
Parking units 880
Completion
year2018/2019
GTC share (%) 100%
Description
Location
Pro
ject deta
ils
OFFICE BUILDING
Green Heart is office
development project in
Belgrade which offers
premium office space
25,500 sq. m of new office space
Three class A office building
Land size – 19,500 sq. m
Underground parking
Restaurant and shops in complex
5 min. to city center
15 min. to airport
Milutina Milankovica
Belgrade
Serbia
UNDER CONSTRUCTIONGREEN HEART
Source: GTC
81
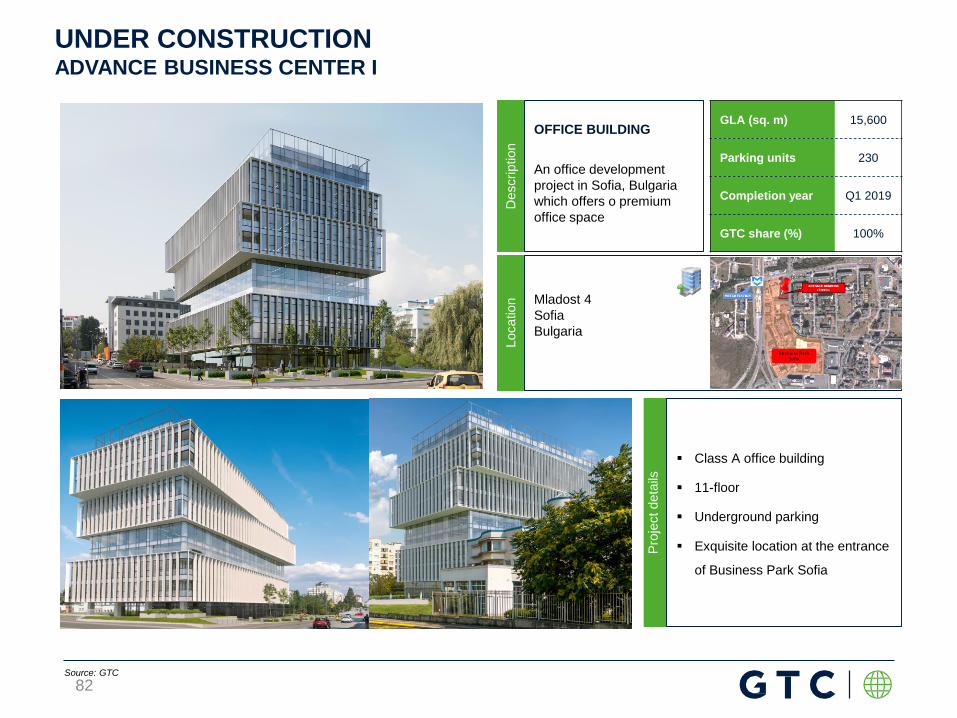
Mladost 4
Sofia
Bulgaria
GLA (sq. m) 15,600
Parking units 230
Completion year Q1 2019
GTC share (%) 100%
Description
Location
Pro
ject deta
ils
OFFICE BUILDING
An office development
project in Sofia, Bulgaria
which offers o premium
office space
Class A office building
11-floor
Underground parking
Exquisite location at the entrance
of Business Park Sofia
UNDER CONSTRUCTIONADVANCE BUSINESS CENTER I
Source: GTC
82

Slovanska Avenija
Zagreb
Croatia
GLA (sq. m) 10,400
Parking units 300
Completion year Q2 2019
GTC share (%) 100%
Description
Location
Pro
ject deta
ils
OFFICE COMPLEX
An office development
project in Zagreb which
offers premium office
space
Class A office building
1,320 – 1,650 sq. m leasable
area per floor
10 min. to city center
Underground parking
UNDER CONSTRUCTIONMATRIX A
Source: GTC
83

84
D) PROJECTS IN PLANNING STAGE

1 Samara Str
Sofia
Bulgaria
GLA (sq. m) 17,500
Parking units 300
Completion year2019/
2020
GTC share (%) 100%
Description
Location
Pro
ject deta
ils
OFFICE BUILDING
An office development
project in Sofia, Bulgaria
which offers o premium
office space
Class A office building
12-floor office building
Underground parking
Exquisite location at the entrance
of Business Park Sofia
PLANNING STAGE - Construction to start within 12 monthsADVANCE BUSINESS CENTER II
Source: GTC
85

Center North Area
68 Clabucet Str
Bucharest
Romania
Description
Location
Pro
ject deta
ils
OFFICE COMPLEX
Class A office
development project in
Bucharest, Romania which
offers o premium office
space
Three Class A office buildings
Underground parking
Direct access from Expozitiei
Boulevard, close to existing
public transportation (tram and
bus lines), convenient easy
access to the international airport
and close to two new planned
metro stations of the planned M6
line of the Bucharest Metro
GLA (sq. m) 35,500
Parking units780for 3
buildings
Completion year H1 2020
GTC share (%) 100%
Source: GTC
PLANNING STAGE - Construction to start within 12 monthsCITY ROSE PARK 1&2
86

Slovanska Avenija
Zagreb
Croatia
GLA (sq. m) 10,400
Parking units 300
Completion year H1 2020
GTC share (%) 100%
Description
Location
Pro
ject deta
ils
OFFICE COMPLEX
An office development
project in Zagreb which
offers premium office
space
Class A office building
1,320 – 1,650 sq. m leasable
area per floor
10 min. to city center
Underground parking
PLANNING STAGE - Construction to start within 12 monthsMATRIX B
Source: GTC
87

Dózsa György u. 63
Budapest
Hungary
Description
Location
Pro
ject deta
ils
OFFICE COMPLEX
A class A office
development project in
Budapest, Hungary which
offers o premium office
space
Class A office buildings
Underground parking
PLANNING STAGE - Construction to start within 12 monthsKOMPAKT
GLA (sq. m) 29,000
Parking units 580
Completion year2019/
2020
GTC share (%) 100%
Source: GTC
88
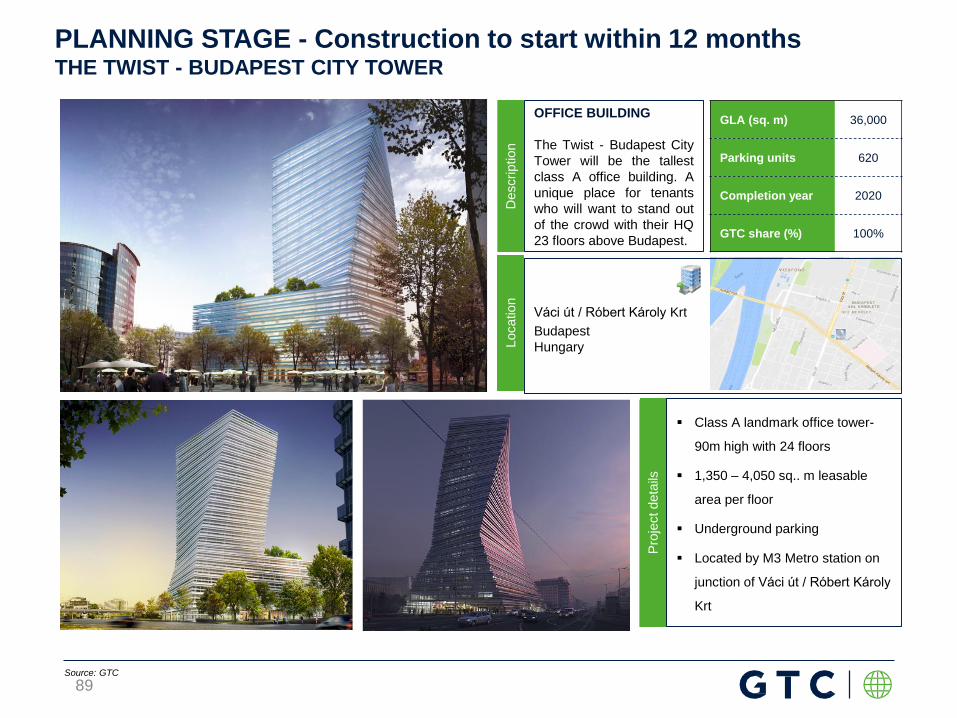
GLA (sq. m) 36,000
Parking units 620
Completion year 2020
GTC share (%) 100%
Description
Pro
ject deta
ils
OFFICE BUILDING
The Twist - Budapest City
Tower will be the tallest
class A office building. A
unique place for tenants
who will want to stand out
of the crowd with their HQ
23 floors above Budapest.
Class A landmark office tower-
90m high with 24 floors
1,350 – 4,050 sq.. m leasable
area per floor
Underground parking
Located by M3 Metro station on
junction of Váci út / Róbert Károly
Krt
PLANNING STAGE - Construction to start within 12 monthsTHE TWIST - BUDAPEST CITY TOWER
Source: GTC
Location
Váci út / Róbert Károly Krt
Budapest
Hungary
89

FFO
EBITDA
profit before tax less tax paid, after adjusting for non-cash transactions (such as fair value
or real estate re-measurement, share base payment provision and unpaid financial
expenses) and one off items (such as FX differences and residential activity)
earning before fair value adjustments, interest, tax, depreciation and amortization
EPRA NAV total equity less non-controlling interest, less: deferred tax liability related to real estate
assets and derivatives at fair value
DEFINITIONS
90

DISCLAIMERTHIS PRESENTATION IS NOT FOR RELEASE, DIRECTLY OR INDIRECTLY, IN OR INTO THE UNITED STATES OF AMERICA, AUSTRALIA, CANADA OR JAPAN.
THIS PRESENTATION IS NOT AN OFFER TO SELL OR THE SOLICITATION OF AN OFFER TO BUY ANY SECURITIES. BY ATTENDING OR VIEWING THIS PRESENTATION,
YOU ACKNOWLEDGE AND AGREE TO BE BOUND BY THE FOLLOWING LIMITATIONS AND RESTRICTIONS.
This presentation (the ”Presentation”) has been prepared by Globe Trade Centre S.A. (”GTC S.A.”, the “Company”) solely for use by its clients and shareholders or analysts and
should not be treated as a part of any an invitation or offer to sell any securities, invest or deal in or a solicitation of an offer to purchase any securities or recommendation to
conclude any transaction, in particular with respect to securities of GTC S.A.
The information contained in this Presentation is derived from publicly available sources which the Company believes are reliable, but GTC S.A. does not make any representation
as to its accuracy or completeness. GTC S.A. shall not be liable for the consequences of any decision made based on information included in this Presentation.
The information contained in this Presentation has not been independently verified and is, in any case, subject to changes and modifications. GTC S.A.'s disclosure of the data
included in this Presentation is not a breach of law for listed companies, in particular for companies listed on the Warsaw Stock Exchange. The information provided herein was
included in current or periodic reports published by GTC S.A. or is additional information that is not required to be reported by the Company as a public company.
In no event may the content of this Presentation be construed as any type of explicit or implicit representation or warranty made by GTC S.A. or, its representatives. Likewise, neither
GTC S.A. nor any of its representatives shall be liable in any respect whatsoever (whether in negligence or otherwise) for any loss or damage that may arise from the use of this
Presentation or of any information contained herein or otherwise arising in connection with this Presentation.
The Presentation contains forward-looking statements. All statements other than statements of historical fact included in the Presentation are forward-looking statements. Forward-
looking statements give the Company’s current expectations and projections relating to its financial condition, results of operations, plans, objectives, future performance and
business. These statements may include, without limitation, any statements preceded by, followed by or including words such as “target,” “believe,” “expect,” “aim,” “intend,” “may,”
“anticipate,” “estimate,” “plan,” “project,” “will,” “can have,” “likely,” “should,” “would,” “could” and other words and terms of similar meaning or the negative thereof. Such forward-
looking statements involve known and unknown risks, uncertainties and other important factors beyond the Company’s control that could cause the Company’s actual results,
performance or achievements to be materially different from the expected results, performance or achievements expressed or implied by such forward-looking statements. Such
forward-looking statements are based on numerous assumptions regarding the Company’s present and future business strategies and the environment in which it will operate in the
future. The Company makes no representation, warranty or prediction that the factors anticipated in such forward-looking statements will be present, and such forward-looking
statements represent, in each case, only one of many possible scenarios and should not be viewed as the most likely or typical scenario. The forward looking statements included in
this Presentation does not constitute profit forecast or estimates.
GTC S.A. does not undertake to publish any updates, modifications or revisions of the information, data or statements, including any forward‐looking statements, contained herein
should there be any change in the strategy or intentions of GTC S.A., or should facts or events occur that affect GTC S.A.'s strategy or intentions, or any change in events,
conditions or circumstances on which the forward‐looking statements are based, unless such reporting obligations arises under the applicable laws and regulations.
GTC S.A. hereby informs persons viewing this Presentation that the only source of reliable data describing GTC S.A.'s financial results, forecasts, events or indexes are current or
periodic reports submitted by GTC S.A. in satisfaction of its disclosure obligation under Polish law. This presentation does not constitute or form part of and should not be construed
as, an offer to sell, or the solicitation or invitation of any offer to buy or subscribe for or underwrite or otherwise acquire, any securities of GTC S.A., any holding company or any of its
subsidiaries in any jurisdiction or any other person, nor an inducement to enter into any investment activity. In particular, this presentation does not constitute an offer of securities for
sale into the United States. No securities of GTC S.A. have been or will be registered under the U.S. Securities Act, or with any securities regulatory authority of any State or other
jurisdiction in the United States, and may not be offered or sold within the United States, absent registration or an exemption from, or in a transaction not subject to, the registration
requirements of the Securities Act of 1933, as amended, and applicable state laws.
The distribution of this presentation and related information may be restricted by law in certain jurisdictions and persons into whose possession any document or other information
referred to herein comes should inform themselves about and observe any such restrictions. Any failure to comply with these restrictions may constitute a violation of the securities
laws of any such jurisdiction.
Note: Due to rounding, numbers presented throughout the Presentation may not add up precisely to the totals provided and percentages may not precisely reflect the absolute
figures.
91

GLOBE TRADE CENTRE SA
17 Stycznia 45A
02-146 Warsaw
T (22) 16 60 700
F (22) 16 60 705
www.gtc.com.pl