1365 Partially Implantable Active Middle Ear Implant for Sensorineural
Hearing Loss
Submission to MSAC
MSAC Application 1365
October 2015
MAIN BODY OF THE SUBMISSION
Submission prepared by:MED-EL Implant Systems Australasia Pty LtdSuite 2.07, 90-96 Bourke Rd Alexandria NSW 2015Australia
Contact person:Mrs Robyn Shakes / Managing DirectorPh: 0431 570 389 [email protected]
Ms Matylda Jaworski / Regulatory AffairsPh: 0415 539 206 [email protected]

EXECUTIVE SUMMARY
Executive SummaryThis application is seeking Medicare Benefits Schedule (MBS) listing of “Partially
Implantable Active Middle Ear Implant for Sensorineural Hearing Loss”. The Australian
Medical Services Advisory Committee (MSAC) has reviewed before (Application 1137,
2010).
In Australia, the insertion of a partially implantable Middle Ear Implant is not offered as a
treatment option so far, resulting in a very niche population of people with a SNHL and a
medical condition preventing the use of conventional hearing aids (CHA) that is currently left
untreated.
The Australian Medical Services Advisory Committee (MSAC) has reviewed Implantable
Active Middle Ear Implant once before and compared it to cochlea implants (CI) and bone
anchored hearing aids (BAHA). MSAC noted MEI will augment existing options of BAHA and
CI when conventional hearing aids do not work or cannot be tolerated.
MSAC’s conclusions from the 2009 review were as follows:
Safety: due to the absence of comparative evidence it is not possible to accurately
compare the rates of adverse events between patients receiving MEI, CI or BAHA,
although a total of 1,222 patients were used to inform the safety of MEI. MSAC
agreed there are no long term safety data available for MEI but on the limited
available evidence, MEI is likely to be at least as safe as BAHA and CI. Surgical
complexity of MEI is similar to CI and greater than BAHA. CI is a more risky
procedure than BAHA, and BAHA site problems are not experienced with MEI. The
current submission contains new clinical evidence and also requests MBS listing at
the same fee as for CC which represents a reduction in cost versus previous
submissions.
Clinical effectiveness: MSAC noted there was a paucity of high level evidence with
which to assess the effectiveness of the MEI. In the absence of any comparative
studies, MSAC could not be confident of the comparative effectiveness of MEI versus
BAHA, and thus could not conclude that MEI is more effective than BAHA in any
patient group. The majority of the available studies assessed MEI in patients with
SNHL. This is reflective of the anticipated Australian practice suggested by the
clinical experts. MSAC cautioned against the very small number of studies of highly
variable quality, and agreed that superior effectiveness of MEI over CI or BAHA could
not be demonstrated.
Economic evaluation: Due to insufficient data on comparative effectiveness to
support a full cost-effectiveness analysis, a cost comparison was conducted for the
i
EXECUTIVE SUMMARY
different costs associated with each of the three procedures. MSAC noted there was
no measure of the magnitude of clinical benefit included in the economic analysis. In
addition, MSAC noted that substantial co-payment/out of pocket expenses would be
likely for some MBS items. MSAC noted there would be major out-of-pocket
expenses for in-hospital services but that these do not contribute to the Safety Net
accumulations. MSAC did not agree with expert opinion and the numbers suggested
in the application, that MEI would replace current CI and BAHA use, or that there
would be a large pool of unmet need of those with hearing loss due to the cosmetic
attraction of MEI versus BAHA, but rather noted, the selection of MEI over BAHA or
CI is determined on a case-by-case basis and depends on the patient’s individual
circumstances and options. MSAC noted that individuals who currently persist with
hearing loss or a less than optimal hearing aid, may consider MEI implantation but
would not consider BAHA or CI. Sensitivity analysis suggests that if one percent of
the estimated pool of individuals with moderate or severe hearing loss elected to
have MEI, the additional cost would be AUD 2,291,787. These estimates are based
on prevalence data of hearing loss in Australia and include a large proportion of older
Australians for whom an MEI would not be suitable. MSAC agreed that the main
reason for implantation of a MEI is not cosmetic, but rather medical reasons in
subjects with chronic external otitis who cannot tolerate occlusion of the external ear
canal. MSAC also accepted that some patients would ‘choose’ MEI due to greater
convenience than BAHA and CI. MSAC noted the base case assumed full
substitution giving a cost saving per patient of AUD 5,878 in the current pool of
patients, and that substitution of MEI for CI would be cost saving (76% of current pool
have CI), whilst substitution for BAHA would be cost-increasing (24% of current pool
have BAHA). Therefore, the net effect is cost saving with full substitution if MEI
results in patients being at least as well off as, or better off than, after BAHA or CI.
MSAC noted the outcomes depend on the type and severity of HL, and presence of
therapy-resistant external otitis (or any other medical conditions that may arise out of
using BAHA or CI), and would therefore influence the level of substitution across
categories. However, the evidence suggests that full substitution is unlikely (low
usage to date) and MEI does not appear to be superior to CI. MSAC concluded that
MEI is more expensive than BAHA, but less expensive than CI. MSAC was unable to
identify any particular sub group of patients who would be suitable for MEI due to
failure of hearing aids and other conservative treatment.
Budgetary impacts: MSAC estimated the first year cost of an MEI, BAHA and CI is
AUD 23,873, AUD 15,207 and AUD 34,466 respectively. However, MSAC found
uncertainty around the utilisation estimates, but acknowledged the applicant’s
ii
EXECUTIVE SUMMARY
response to the final Assessment Report stressed the importance of enforcing
appropriate medical indications for use of MEI. Based on 2006-07 MBS data, the
total cost of BAHA would be AUD 1,611,957 (106 patients) and the total cost of CI
would be AUD 11,270,250 (327 patients). This gives a total cost of AUD 12,882,207.
If MEI were used instead of BAHA and CI, the total cost would be AUD 10,336,916.
Hence, the cost savings of performing MEI as a direct replacement for BAHA and CI
would be over AUD 2.5 million.
MSAC’s advice to the minister: After considering the strength of the available
evidence in relation to the safety, effectiveness and cost-effectiveness of the middle
ear implant as a treatment for hearing loss, MSAC does not support public funding
for middle ear implants.
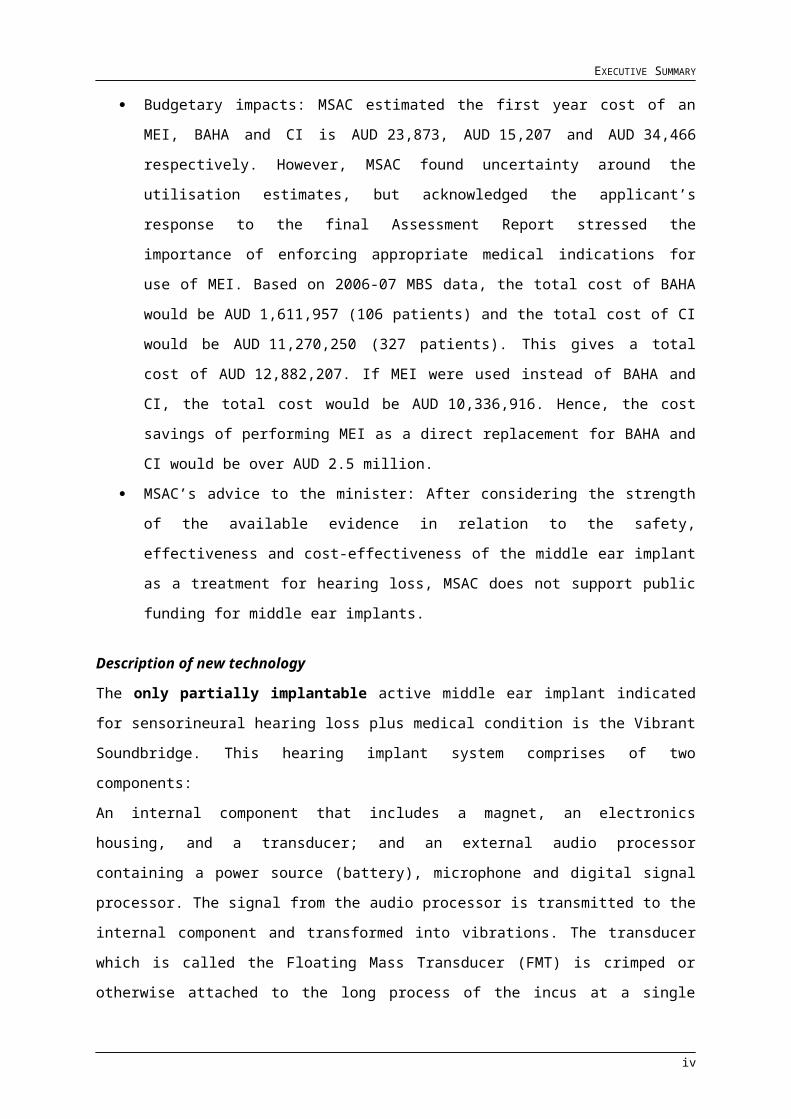
Description of new technologyThe only partially implantable active middle ear implant indicated for sensorineural hearing
loss plus medical condition is the Vibrant Soundbridge. This hearing implant system
comprises of two components:
An internal component that includes a magnet, an electronics housing, and a transducer;
and an external audio processor containing a power source (battery), microphone and digital
signal processor. The signal from the audio processor is transmitted to the internal
component and transformed into vibrations. The transducer which is called the Floating
Mass Transducer (FMT) is crimped or otherwise attached to the long process of the incus at
a single point and mechanically drives the ossicular chain. The amplified vibrations can be
adjusted via an external auditory processor (AP) to suit different degrees of hearing losses.
Battery life of the AP is 6 days. Patients can place new batteries in or charge their existing
batteries.
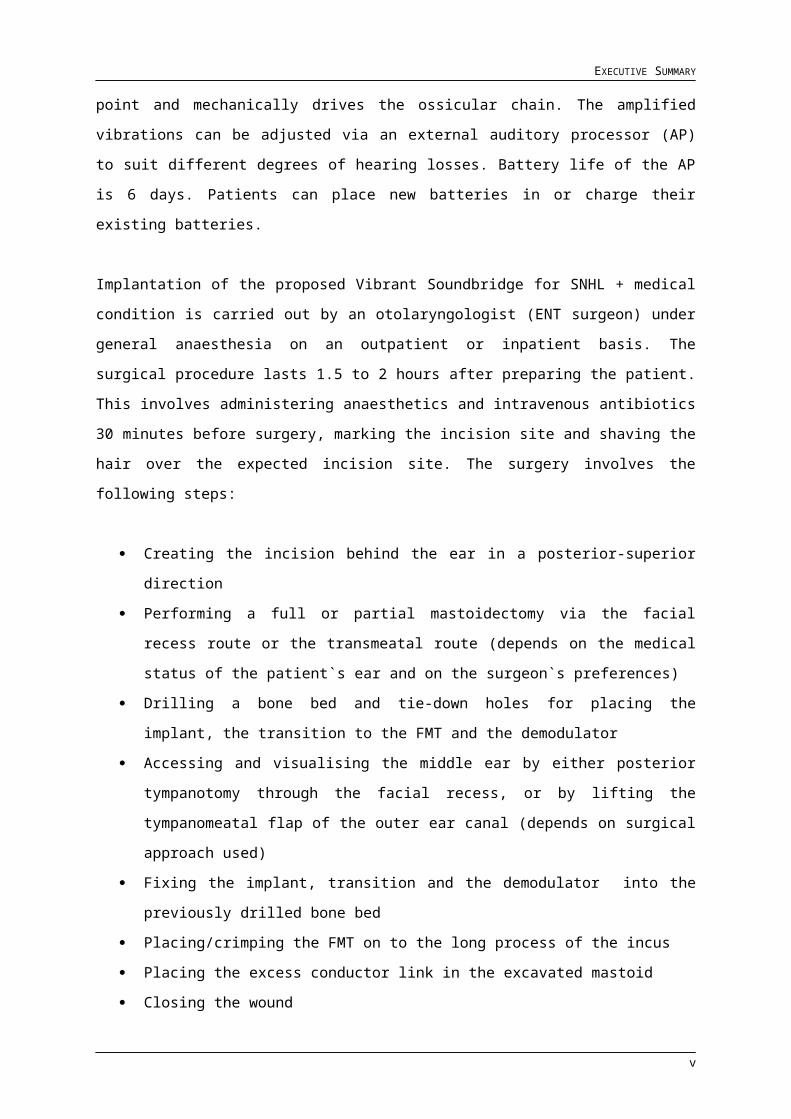
Implantation of the proposed Vibrant Soundbridge for SNHL + medical condition is carried
out by an otolaryngologist (ENT surgeon) under general anaesthesia on an outpatient or
inpatient basis. The surgical procedure lasts 1.5 to 2 hours after preparing the patient. This
involves administering anaesthetics and intravenous antibiotics 30 minutes before surgery,
marking the incision site and shaving the hair over the expected incision site. The surgery
involves the following steps:
Creating the incision behind the ear in a posterior-superior direction
Performing a full or partial mastoidectomy via the facial recess route or the
transmeatal route (depends on the medical status of the patient`s ear and on the
surgeon`s preferences)
iii
EXECUTIVE SUMMARY
Drilling a bone bed and tie-down holes for placing the implant, the transition to the
FMT and the demodulator
Accessing and visualising the middle ear by either posterior tympanotomy through
the facial recess, or by lifting the tympanomeatal flap of the outer ear canal (depends
on surgical approach used)
Fixing the implant, transition and the demodulator into the previously drilled bone
bed
Placing/crimping the FMT on to the long process of the incus
Placing the excess conductor link in the excavated mastoid
Closing the wound
6 to 8 weeks after surgery the patient is fitted with the audio processor (AP) and initial
programming is carried out. The patient is followed-up on a regular basis and the AP is re-
programmed when necessary.
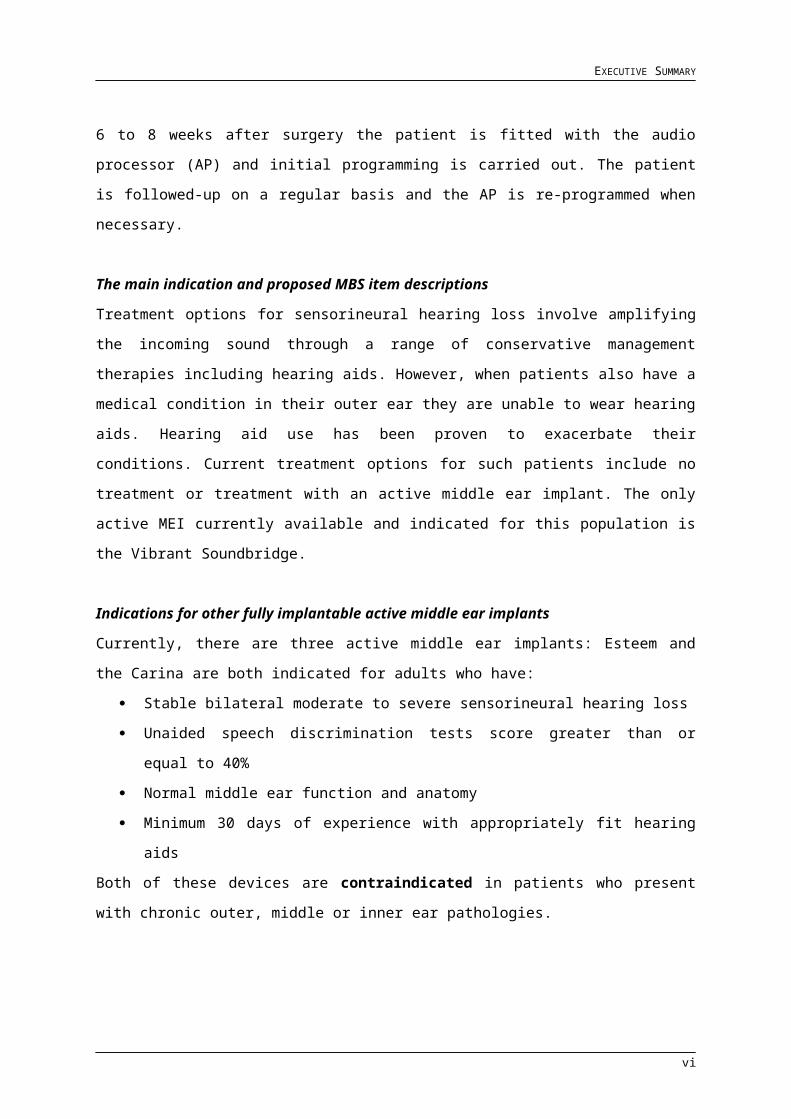
The main indication and proposed MBS item descriptionsTreatment options for sensorineural hearing loss involve amplifying the incoming sound
through a range of conservative management therapies including hearing aids. However,
when patients also have a medical condition in their outer ear they are unable to wear
hearing aids. Hearing aid use has been proven to exacerbate their conditions. Current
treatment options for such patients include no treatment or treatment with an active middle
ear implant. The only active MEI currently available and indicated for this population is the
Vibrant Soundbridge.
Indications for other fully implantable active middle ear implantsCurrently, there are three active middle ear implants: Esteem and the Carina are both
indicated for adults who have:
Stable bilateral moderate to severe sensorineural hearing loss
Unaided speech discrimination tests score greater than or equal to 40%
Normal middle ear function and anatomy
Minimum 30 days of experience with appropriately fit hearing aids
Both of these devices are contraindicated in patients who present with chronic outer,
middle or inner ear pathologies.
iv
EXECUTIVE SUMMARY
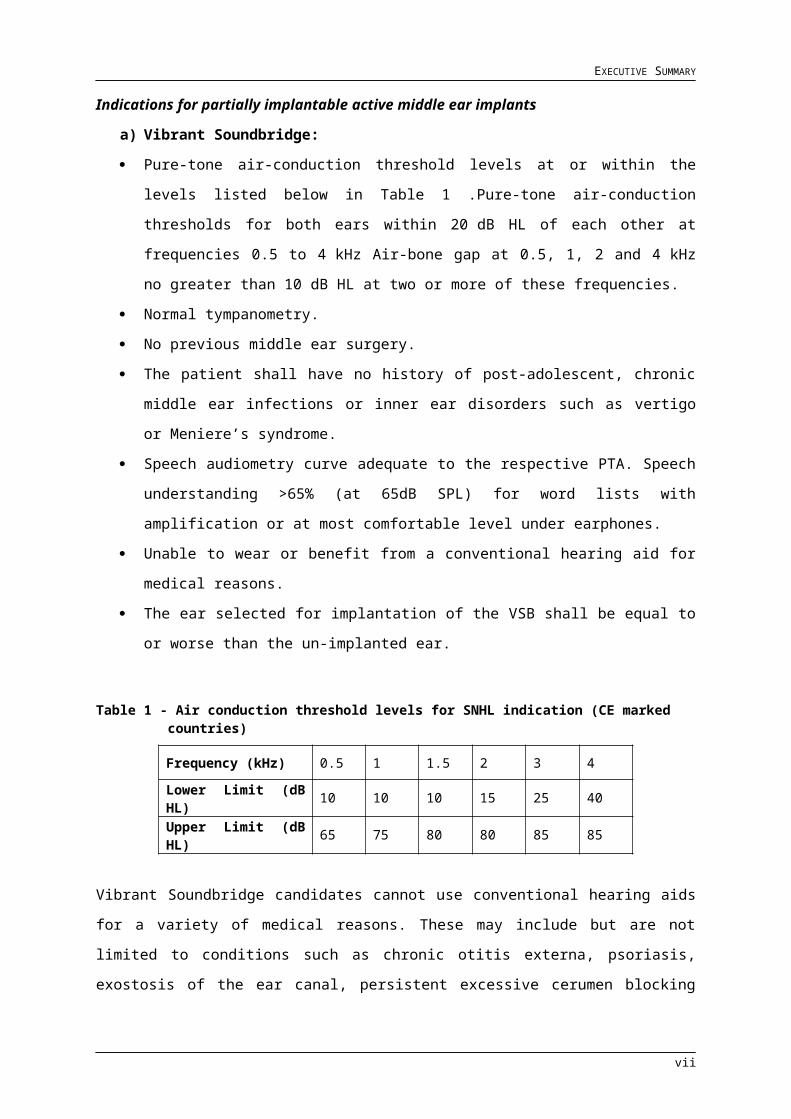
Indications for partially implantable active middle ear implantsa) Vibrant Soundbridge: Pure-tone air-conduction threshold levels at or within the levels listed below in Table
1 .Pure-tone air-conduction thresholds for both ears within 20 dB HL of each other at
frequencies 0.5 to 4 kHz Air-bone gap at 0.5, 1, 2 and 4 kHz no greater than 10 dB
HL at two or more of these frequencies.
Normal tympanometry.
No previous middle ear surgery.
The patient shall have no history of post-adolescent, chronic middle ear infections or
inner ear disorders such as vertigo or Meniere’s syndrome.
Speech audiometry curve adequate to the respective PTA. Speech understanding
>65% (at 65dB SPL) for word lists with amplification or at most comfortable level
under earphones.
Unable to wear or benefit from a conventional hearing aid for medical reasons.
The ear selected for implantation of the VSB shall be equal to or worse than the un-
implanted ear.
Table 1 - Air conduction threshold levels for SNHL indication (CE marked countries)
Frequency (kHz) 0.5 1 1.5 2 3 4
Lower Limit (dB HL) 10 10 10 15 25 40
Upper Limit (dB HL) 65 75 80 80 85 85
Vibrant Soundbridge candidates cannot use conventional hearing aids for a variety of
medical reasons. These may include but are not limited to conditions such as chronic otitis
externa, psoriasis, exostosis of the ear canal, persistent excessive cerumen blocking the ear
canal, absent or deformed pinnae following skin cancer, unusual morphology affecting the
ear canal or pinna that prevent the use of conventional hearing aids.
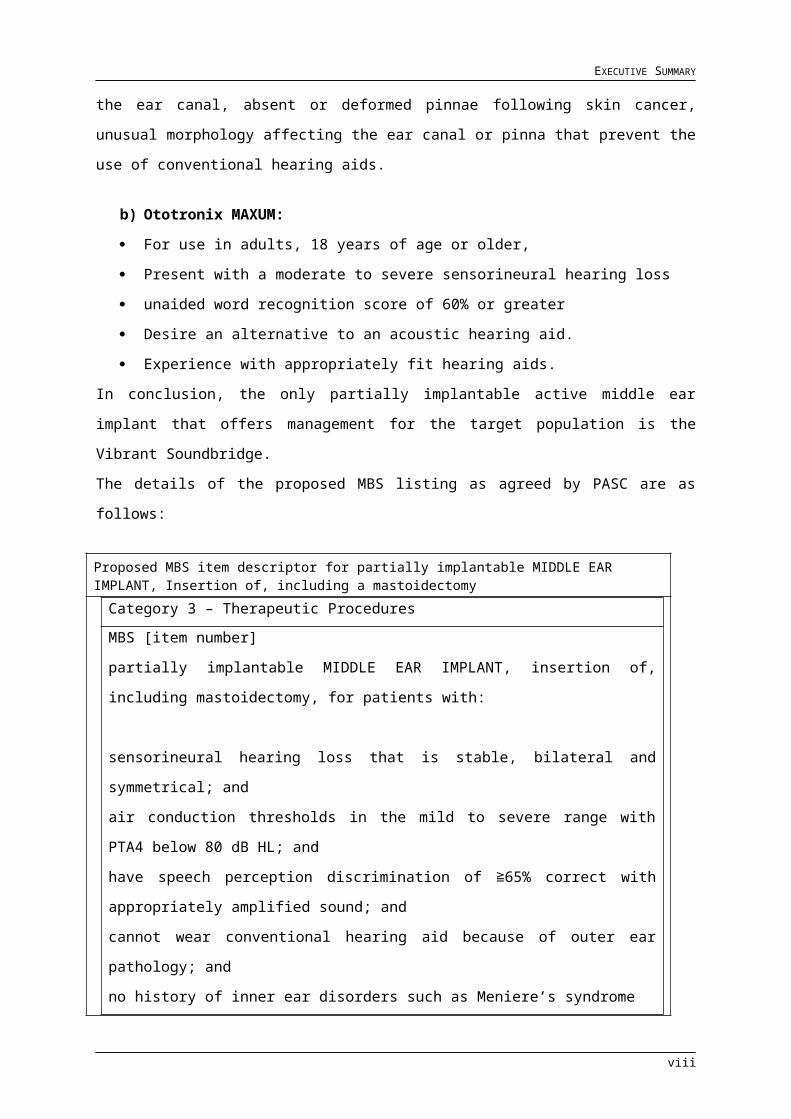
b) Ototronix MAXUM: For use in adults, 18 years of age or older,
Present with a moderate to severe sensorineural hearing loss
unaided word recognition score of 60% or greater
Desire an alternative to an acoustic hearing aid.
Experience with appropriately fit hearing aids.
In conclusion, the only partially implantable active middle ear implant that offers
management for the target population is the Vibrant Soundbridge.
v
EXECUTIVE SUMMARY
The details of the proposed MBS listing as agreed by PASC are as follows:
Proposed MBS item descriptor for partially implantable MIDDLE EAR IMPLANT, Insertion of, including a mastoidectomy
Category 3 – Therapeutic Procedures
MBS [item number]
partially implantable MIDDLE EAR IMPLANT, insertion of, including mastoidectomy,
for patients with:
sensorineural hearing loss that is stable, bilateral and symmetrical; and
air conduction thresholds in the mild to severe range with PTA4 below 80 dB HL;
and
have speech perception discrimination of ≧65% correct with appropriately amplified
sound; and
cannot wear conventional hearing aid because of outer ear pathology; and
no history of inner ear disorders such as Meniere’s syndrome
a normal middle ear (no history of middle ear surgery or of post-adolescent, chronic
middle ear infections; and normal tympanometry; and on audiometry the air-bone
gap is ≦10 dBHL at two or more of the following frequencies: 0.5, 1, 2 and 4 kHz).
Fee: $1,876.59 (based on mastoidectomy item).
(Anaes)
Rationale for the proposed listing and clinical management algorithm
Insertion of a partially implantable MEI is not reimbursed by the MBS. This treatment is
proposed as an additional option to the current practice for a sub-population of patients that
are currently left untreated.
vi
EXECUTIVE SUMMARY
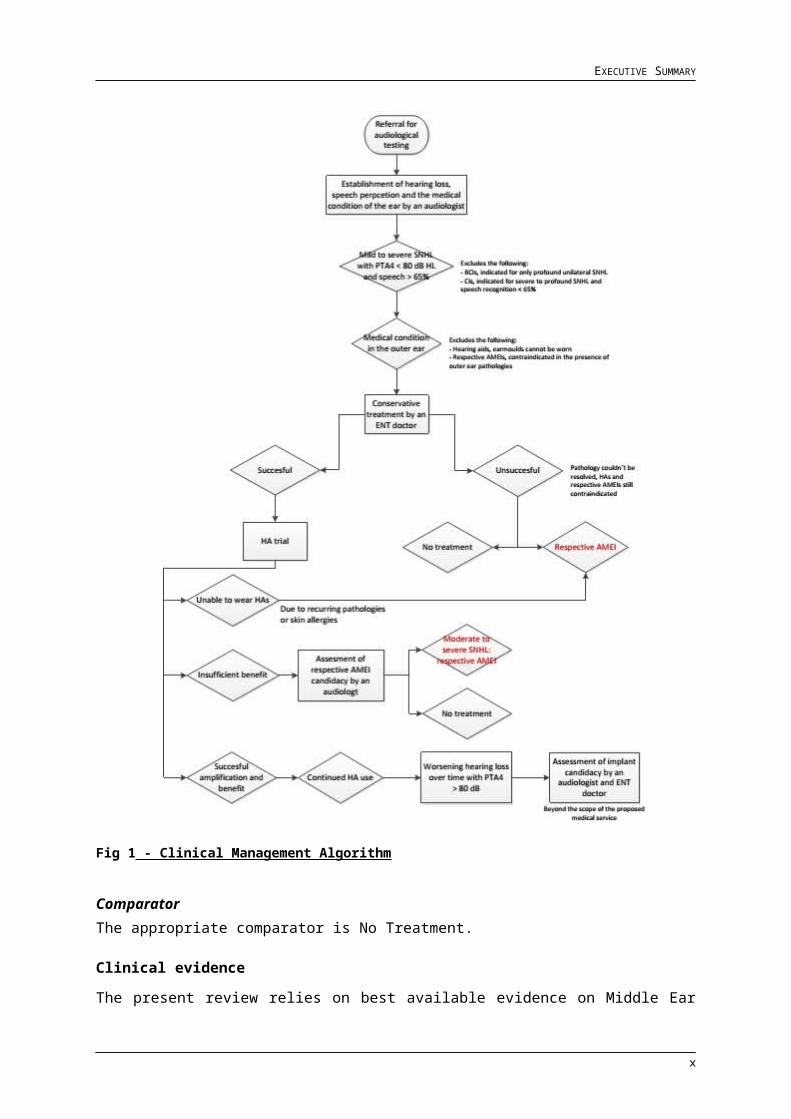
Fig 1 - Clinical Management Algorithm
Comparator The appropriate comparator is No Treatment.
Clinical evidenceThe present review relies on best available evidence on Middle Ear Implants to draw
conclusions about their relative effectiveness and safety.
vii
EXECUTIVE SUMMARY
Overall, an assessment of the study characteristics that could potentially influence test
validity showed that the following studies demonstrated notable characteristics that differed
from all studies:
Memari (Memari et al., 2011) is unique in that it represents a different geographical
location (Iran) and may reflect differences in the provision of health care.
In three studies, Pok et al. (2010), Sziklai et al. (2011) and Gerard et al. (2012), the
length of follow-up was not specified. The first two studies are of prospective design
and it could be assumed that data was collected at initial fitting. The latter is a
retrospective study where a longer follow-up could be assumed (Gerard et al.,
2012;Pok et al., 2010;Sziklai I, 2011).
Keeping these studies in mind, the literature available on middle ear implants demonstrates
that implantation of the VSB:
Results in a significant improvement in sound-field hearing thresholds
Results in significantly better speech recognition/comprehension in quiet and noisy
situations
Leads to few difficulties in understanding speech in relatively easy listening
conditions, as compared to noisy conditions; and improves health in general
Is a safe procedure with minor adverse events resolving on their own or with local
treatment
Assessment of VSB outcomes at a long-term follow-up demonstrate:
A small but non-significant shift in bone conduction thresholds over time
Constant functional gain
Slight decrease in recognition/comprehension over time, yet still significantly better
outcomes than baseline
Sustained subjective benefit
In the field of middle ear implants it can be concluded that the VSB is;
At least as effective as other partially or fully implantable MEI
At least as safe as other partially implantable MEI
Superior in terms of safety in regard to fully-implantable MEI
The evidence base used to reach the conclusions above are summarised in Table 28 with
respect to important features of the evidence outlined in Section B.8 of the PBAC
Guidelines.
.
viii

EXECUTIVE SUMMARY
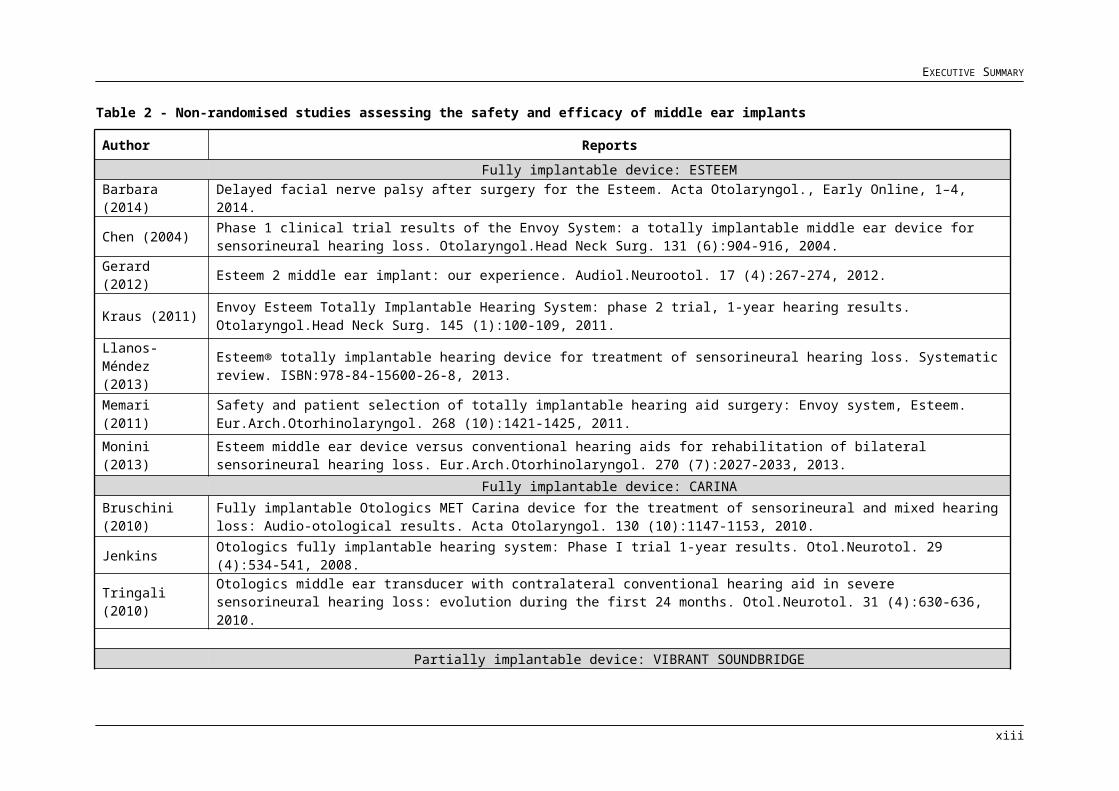
Table 2 - Non-randomised studies assessing the safety and efficacy of middle ear implants
Author Reports
Fully implantable device: ESTEEM
Barbara (2014) Delayed facial nerve palsy after surgery for the Esteem. Acta Otolaryngol., Early Online, 1–4, 2014.
Chen (2004) Phase 1 clinical trial results of the Envoy System: a totally implantable middle ear device for sensorineural hearing loss. Otolaryngol.Head Neck Surg. 131 (6):904-916, 2004.
Gerard (2012) Esteem 2 middle ear implant: our experience. Audiol.Neurootol. 17 (4):267-274, 2012.
Kraus (2011) Envoy Esteem Totally Implantable Hearing System: phase 2 trial, 1-year hearing results. Otolaryngol.Head Neck Surg. 145 (1):100-109, 2011.
Llanos-Méndez (2013)
Esteem® totally implantable hearing device for treatment of sensorineural hearing loss. Systematic review. ISBN:978-84-15600-26-8, 2013.
Memari (2011) Safety and patient selection of totally implantable hearing aid surgery: Envoy system, Esteem. Eur.Arch.Otorhinolaryngol. 268 (10):1421-1425, 2011.
Monini (2013) Esteem middle ear device versus conventional hearing aids for rehabilitation of bilateral sensorineural hearing loss. Eur.Arch.Otorhinolaryngol. 270 (7):2027-2033, 2013.
Fully implantable device: CARINA
Bruschini (2010) Fully implantable Otologics MET Carina device for the treatment of sensorineural and mixed hearing loss: Audio-otological results. Acta Otolaryngol. 130 (10):1147-1153, 2010.
Jenkins Otologics fully implantable hearing system: Phase I trial 1-year results. Otol.Neurotol. 29 (4):534-541, 2008.
Tringali (2010) Otologics middle ear transducer with contralateral conventional hearing aid in severe sensorineural hearing loss: evolution during the first 24 months. Otol.Neurotol. 31 (4):630-636, 2010.
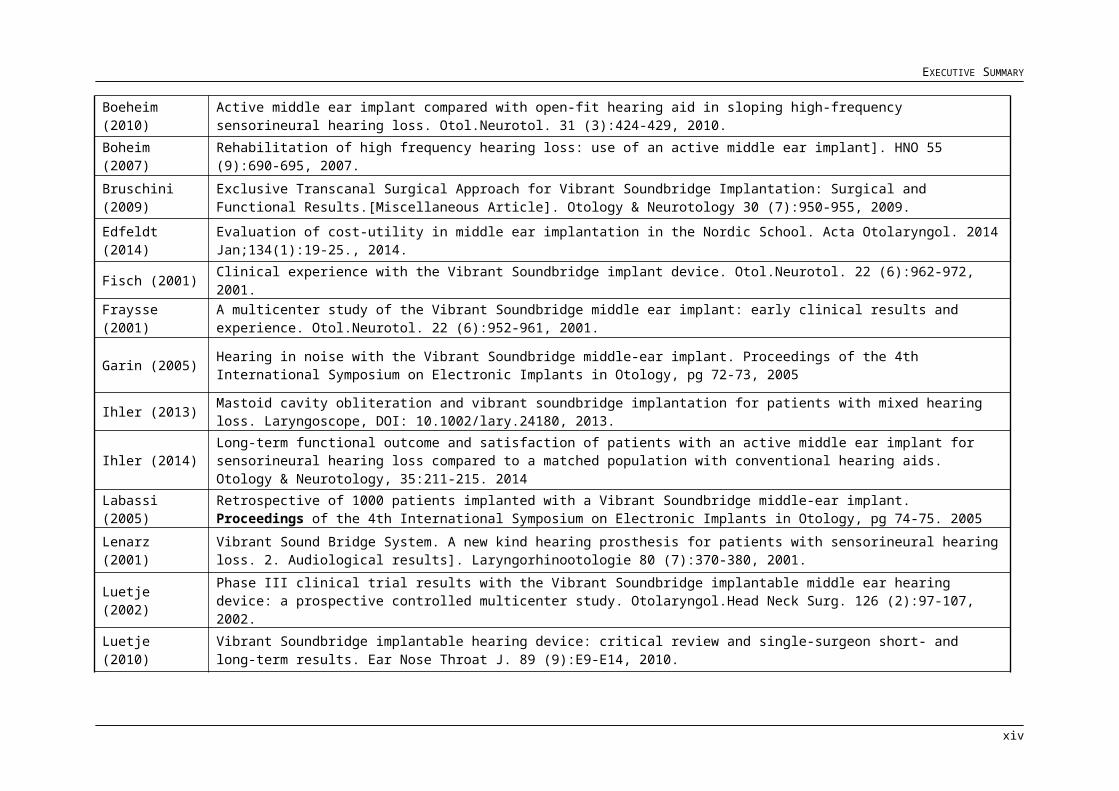
Partially implantable device: VIBRANT SOUNDBRIDGE
Boeheim (2010) Active middle ear implant compared with open-fit hearing aid in sloping high-frequency sensorineural hearing loss. Otol.Neurotol. 31 (3):424-429, 2010.
ix
EXECUTIVE SUMMARY
Boheim (2007) Rehabilitation of high frequency hearing loss: use of an active middle ear implant]. HNO 55 (9):690-695, 2007.
Bruschini (2009) Exclusive Transcanal Surgical Approach for Vibrant Soundbridge Implantation: Surgical and Functional Results.[Miscellaneous Article]. Otology & Neurotology 30 (7):950-955, 2009.
Edfeldt (2014) Evaluation of cost-utility in middle ear implantation in the Nordic School. Acta Otolaryngol. 2014 Jan;134(1):19-25., 2014.
Fisch (2001) Clinical experience with the Vibrant Soundbridge implant device. Otol.Neurotol. 22 (6):962-972, 2001.
Fraysse (2001) A multicenter study of the Vibrant Soundbridge middle ear implant: early clinical results and experience. Otol.Neurotol. 22 (6):952-961, 2001.
Garin (2005) Hearing in noise with the Vibrant Soundbridge middle-ear implant. Proceedings of the 4th International Symposium on Electronic Implants in Otology, pg 72-73, 2005
Ihler (2013) Mastoid cavity obliteration and vibrant soundbridge implantation for patients with mixed hearing loss. Laryngoscope, DOI: 10.1002/lary.24180, 2013.
Ihler (2014) Long-term functional outcome and satisfaction of patients with an active middle ear implant for sensorineural hearing loss compared to a matched population with conventional hearing aids. Otology & Neurotology, 35:211-215. 2014
Labassi (2005) Retrospective of 1000 patients implanted with a Vibrant Soundbridge middle-ear implant. Proceedings of the 4th International Symposium on Electronic Implants in Otology, pg 74-75. 2005
Lenarz (2001) Vibrant Sound Bridge System. A new kind hearing prosthesis for patients with sensorineural hearing loss. 2. Audiological results]. Laryngorhinootologie 80 (7):370-380, 2001.
Luetje (2002) Phase III clinical trial results with the Vibrant Soundbridge implantable middle ear hearing device: a prospective controlled multicenter study. Otolaryngol.Head Neck Surg. 126 (2):97-107, 2002.
Luetje (2010) Vibrant Soundbridge implantable hearing device: critical review and single-surgeon short- and long-term results. Ear Nose Throat J. 89 (9):E9-E14, 2010.
Mosnier (2008) Benefit of the Vibrant Soundbridge Device in Patients Implanted For 5 to 8 Years.[Report]. Ear & Hearing 29 (2):281-284, 2008.
Pok (2010) Clinical experience with the active middle ear implant Vibrant Soundbridge in sensorineural hearing loss. Adv.Otorhinolaryngol. 69:51-58, 2010.
x
EXECUTIVE SUMMARY
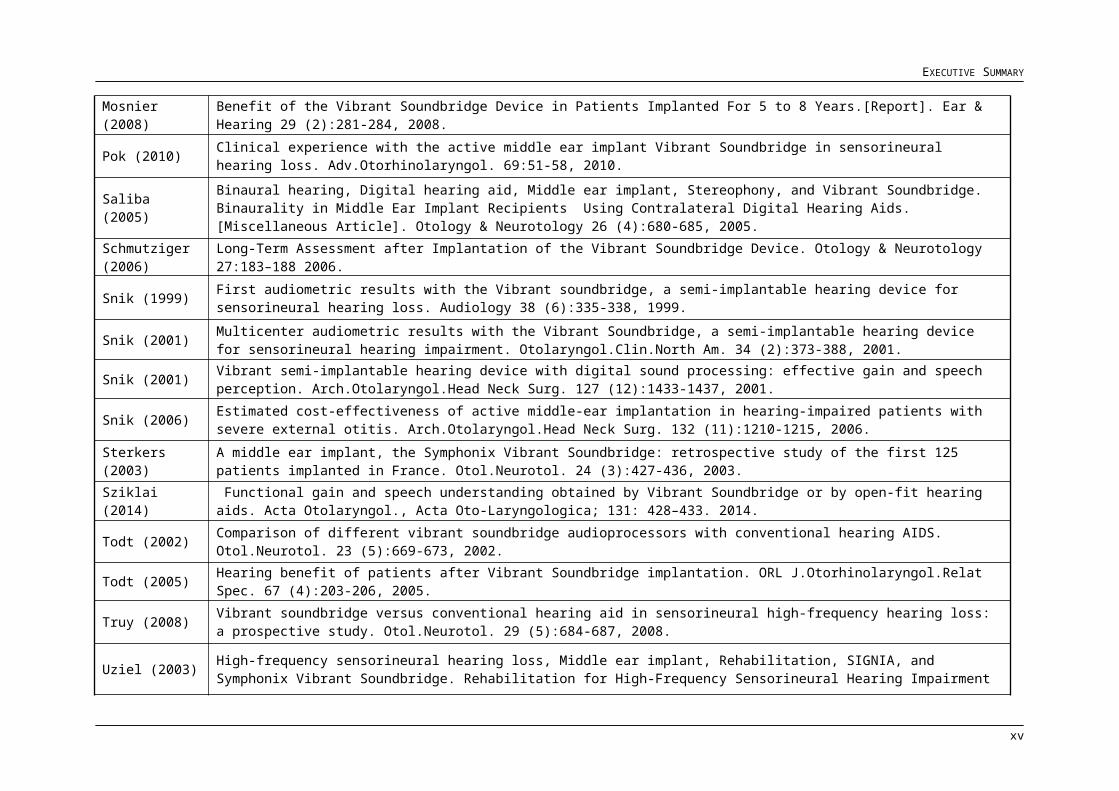
Saliba (2005) Binaural hearing, Digital hearing aid, Middle ear implant, Stereophony, and Vibrant Soundbridge. Binaurality in Middle Ear Implant Recipients Using Contralateral Digital Hearing Aids.[Miscellaneous Article]. Otology & Neurotology 26 (4):680-685, 2005.
Schmutziger (2006) Long-Term Assessment after Implantation of the Vibrant Soundbridge Device. Otology & Neurotology 27:183–188 2006.
Snik (1999) First audiometric results with the Vibrant soundbridge, a semi-implantable hearing device for sensorineural hearing loss. Audiology 38 (6):335-338, 1999.
Snik (2001) Multicenter audiometric results with the Vibrant Soundbridge, a semi-implantable hearing device for sensorineural hearing impairment. Otolaryngol.Clin.North Am. 34 (2):373-388, 2001.
Snik (2001) Vibrant semi-implantable hearing device with digital sound processing: effective gain and speech perception. Arch.Otolaryngol.Head Neck Surg. 127 (12):1433-1437, 2001.
Snik (2006) Estimated cost-effectiveness of active middle-ear implantation in hearing-impaired patients with severe external otitis. Arch.Otolaryngol.Head Neck Surg. 132 (11):1210-1215, 2006.
Sterkers (2003) A middle ear implant, the Symphonix Vibrant Soundbridge: retrospective study of the first 125 patients implanted in France. Otol.Neurotol. 24 (3):427-436, 2003.
Sziklai (2014) Functional gain and speech understanding obtained by Vibrant Soundbridge or by open-fit hearing aids. Acta Otolaryngol., Acta Oto-Laryngologica; 131: 428–433. 2014.
Todt (2002) Comparison of different vibrant soundbridge audioprocessors with conventional hearing AIDS. Otol.Neurotol. 23 (5):669-673, 2002.
Todt (2005) Hearing benefit of patients after Vibrant Soundbridge implantation. ORL J.Otorhinolaryngol.Relat Spec. 67 (4):203-206, 2005.
Truy (2008) Vibrant soundbridge versus conventional hearing aid in sensorineural high-frequency hearing loss: a prospective study. Otol.Neurotol. 29 (5):684-687, 2008.
Uziel (2003)High-frequency sensorineural hearing loss, Middle ear implant, Rehabilitation, SIGNIA, and Symphonix Vibrant Soundbridge. Rehabilitation for High-Frequency Sensorineural Hearing Impairment in Adults with the Symphonix Vibrant Soundbridge: A Comparative Study.[Miscellaneous Article]. Otology & Neurotology 24 (5):775-783, 2003.
Vincent (2004) A longitudinal study on postoperative hearing thresholds with the Vibrant Soundbridge device. Eur.Arch.Otorhinolaryngol. 261 (9):493-496, 2004.
Partially implantable device: MAXUM
xi
EXECUTIVE SUMMARY
NO LITERATURE AVAILABLE FOR THE MAXUM DEVICE
Partially implantable device: SOUNDTEC
Hough (2002) Middle ear electromagnetic semi-implantable hearing device: results of the phase II SOUNDTEC direct system clinical trial. Otol.Neurotol. 23 (6):895-903, 2002.
Roland (2001) Verification of improved patient outcomes with a partially implantable hearing aid, The SOUNDTEC direct hearing system. Laryngoscope 111 (10):1682-1686, 2001.
Silverstein (2005)
Electromagnetic hearing device, Ossicular magnet, Semi-implantable hearing device, and SOUNDTEC. Experience with the SOUNDTEC Implantable Hearing Aid.[Miscellaneous Article]. Otology & Neurotology 26 (2):211-217, 2005.
SYSTEMATIC REVIEWAlberta Health and Wellness (2011)
Middle Ear Implants for the Treatment of Hearing Loss, Final STE Report: December 2011
Butler (2013) Efficacy of the active middle-ear implant in patients with sensorineural hearing loss. J.Laryngol.Otol. 127 Suppl 2:S8-16, 2013.
CEDIT (2002) Middle ear implants - systematic review, expert panel. Anonymous. 2002.
Kahue (2014) Middle ear implants for rehabilitation of sensorineural hearing loss: a systematic review of FDA approved devices (Provisional abstract). Otol Neurotol. Aug;35(7):1228-37, 2014.
Klein (2012) Hearing aid, Hearing loss, and Middle ear implant. A Systematic Review of the Safety and Effectiveness of Fully Implantable Middle Ear Hearing Devices: The Carina and Esteem Systems.[Review]. Otology & Neurotology 33 (6):916-921, 2012.
MSAC (2010) Middle ear implant for sensorineural, conductive and mixed hearing losses. MSAC, 2010
xii
EXECUTIVE SUMMARY
The type of economic evaluation presentedUsing the grid provided in Table 12 and Table 13, the most appropriate method for
comparing the proposed medical service against its main comparator No intervention is a
cost effectiveness analysis. The same method was used for comparing the two types of
partially implantable middle ear implants, the Vibrant Soundbridge and MAXUM. A modelling
approach was taken as analysis was based on the data available from the non-randomised
studies identified in the literature. A decision tree with embedded Markov processes was
built that represented the pathways by which a person may decide to receive middle ear
implantation or not, and the clinical events that may occur following their decision. The
clinical events in the model are defined as events that can affect the costs and course of
treatment in the short or long-term. These include recurring medical conditions in the No
intervention arm; and adverse events, device failure, explantation/reimplantation and
ceasing MEI use in the intervention arm. The model is illustrated in figure 11. The Markov
model built to represent the pathway for receiving the proposed medical service was cloned
for the MAXUM and the two middle ear implants were compared. Both models were
populated with cost data (mostly) from the MBS and effectiveness data obtained from the
literature. The comparison of VSB against no intervention was based upon utility values; and
the comparison of the two MEI was based upon patient benefit scores measured by the
APHAB. The time horizon of the model was 10 years with a cyle length of 6 months; and
costs and effectiveness outcomes were discounted at a 5% rate.
The cost per patientThe estimated costs of partially implantable MEIs per procedure was calculated to be
AUD 24.468 for the VSB and AUD 13.850 for the MAXUM/SOUNDTEC (see Section D.4).
Compared to no intervention, the provision of the Vibrant Soundbridge AMEI results in an
improvement of 1.41 QALYs at An incremental cost of AUD 21.927 per patient. The Vibrant
Soundbridge is more costly than the MAXUM implant system with an increment of AUD
10.619 and also proves to be more beneficial for the patient with effectiveness improved by
199 units.
Sustainability of the proposed MBS fee for insertion of a partially implantable Middle Ear Implant
The addition of the insertion of a partially implantable MEI to the MBS as proposed in this
application will lead to an increase in direct treatment costs. The results of the cost-
effectiveness analysis clearly indicate that the VSB is a highly cost-effective treatment when
compared to No Treatment with an incremental cost-effectiveness ratio of 15.575
xiii
EXECUTIVE SUMMARY
AUD/QALY. When compared to the MAXUM the incremental cost-effectiveness ratio is
53.25 AUD/effectiveness. This is a much smaller ICER however as effectiveness outcomes
are inverted it represents a significant improvement in patient perceived benefit.
Deterministic sensitivity analysis demonstrated the results of the base-case analysis to be
generaly robust against variations in the input values of single variables. Results were most
sensitive to the total cost of MEI(VSB) provision, and to a lesser extent to the probability of
revision surgery and ceasing to use MEI. Comparing the VSB against the MAXUM also
revealed cost and effectiveness results that were generally robust to variation in the value of
input parameters. The cost outcomes were most sensitive to the costs of VSB and MAXUM
provision, and then to a lesser extent to the probability of ceasing to use MAXUM and VSB,
and revision surgery following implantation with either device.
The variables found to be effective in DSA were entered into a probabilistic sensitivity
analysis. PSA results indicated similar results to base-case outcomes. Providing a partially
implantable MEI, namely the Vibrant Soundbridge, as associated with increased QALY
ranging from 1,19 to 1,52 but also increased costs ranging from AUD 21.881,48 to AUD
22.265,86, when compared to receiving no intervention. When compared to the MAXUM, the
Vibrant Soundbridge was associated with increased effectiveness ranging from 176 to 211,9
but also increased costs ranging from AUD 10.505,87 to AUD 10.745,28.
Based on further sensitivity analysis where the discount rate was varied, the total cost per
patient for the Vibrant Soundbridge over the implant lifetime of 10 years would be AUD
26.059,55 and AUD 24.468,43 using 0 % and 5 % discounting. The QALY associated with
MEI was more influenced with a decrease from 1.75 to 1.41. The resulting ICER for the VSB
against no intervention can thus be calculated as 13.160.06 and 15.575,26, respectively.
Similar outcomes were seen when comparing the VSB to the MAXUM: Discounting over a
10-year time period did not influence incremental costs too much while effectiveness
outcomes were significantly decreased. The resulting ICER was 45,75 and 53.25, at 0 %
and 5 % discounting rates.
The time horizon of the model was also extended to a 20 year time period. The total cost per
patient for the Vibrant Soundbridge increased from AUD 24.468,43 at 10 years to AUD
31.149,79 at 20 years. The QALY associated with MEI was more influenced with a decrease
from 10.27 to 15.5. The resulting ICER for the VSB against no intervention can thus be
calculated as 15.575,25 and 12.986,73, respectively. Comparing the VSB to the MAXUM
showed that over a 20-year time horizon differences in the cost and effectiveness of the two
interventions become more apparent. The incremental cost was AUD 10.618,57 at 10 years
and AUD 13.981,69 at 20 years; and the incremental effectiveness improved from 199.41 to
306.85.
xiv
EXECUTIVE SUMMARY
Estimated extent of Use and Financial ImplicationsBased on the prevalence data provided in Section E.1, within the first year after listing,
between 33 and 103 cases of insertion of a partially implantable Middle Ear Implant are to be
expected. A further annual increase of 1.7 % per year is to be expected in accordance with
the population growth. The calculation of number of services each year is based on the
assumption that the existing pool of eligible patients could be implanted over a 10 to 15 year
period, with 10 years representing a maximum and 15 years representing a minimum
number of services per year. Of course this assumption may be influenced by patients’
preferences, their willingness to undergo a surgical procedure and their ability to pay out-of-
pocket for additional services or non-covered device costs. Taking a mean number of 71
implnated patients into account, in the first year a cost of AUD 133.263 is expected to the
MBS for the proposed item. Total costs to the MBS for the associated items, pre-, post- and
reimplantation related items, are estimated to sum up to AUD 144.895 in the first year of
implementing the proposed service. Total non-MBS associated costs for the proposed
intervention include the costs for hospital stay, counselling, batteries as well as the implant
and processor, although the sum of AUD 1.062.435 may be covered by the patient or private
insurances. The overall total costs of the proposed intervention is therefore AUD 1.340.594
in the first year. Taking the population growth into account, these costs will rise to
AUD 1.4537.883 in the fifth year of implementation. Considering the deterministic sensitivity
analysis provided in section E5, the number of procedures varies by ± 10 around the base
case values presented for each year.
xv

Table of Contents
Executive Summary................................................................................................................iTable of Contents................................................................................................................xviList of Tables.......................................................................................................................xixList of Figures...................................................................................................................xxiiiList of Attachments...........................................................................................................xxivList of Volumes..................................................................................................................xxvAbbreviations....................................................................................................................xxviA. Details of the proposed intervention and its intended use on the MBS...............1
A.1 Requested MBS listing and details of the intervention.............................................................................................. 1
A.1.1 Health technology assessment background.................................................................................................... 7
A.1.2 SNHL + medical condition and screening background..................................................................................12
A.2 Indications and Contraindications........................................................................................................................... 13
A.2.1 Indications for active middle ear implants...................................................................................................... 13
A.2.2 Definition and incidence of the medical condition..........................................................................................14
A.2.3. Existing arrangements................................................................................................................................... 19
A.2.4 Market approval status of Vibrant Soundbridge............................................................................................. 20
A.2.5 Reimbursement status of middle ear implants............................................................................................... 21
A.2.6 Proposed listing of partially implantable active middle ear implants..............................................................21
A.3 Intervention details.................................................................................................................................................. 23
A.3.1 Clinical management pre-intervention........................................................................................................... 23
A.3.2 Clinical management intervention.................................................................................................................. 24
A.3.3 Clinical management post-intervention.......................................................................................................... 26
A.4 Main comparator..................................................................................................................................................... 27
A.5 Clinical management algorithm............................................................................................................................... 33
A.6 Differences between the proposed intervention and main comparator....................................................................34
B. Systematic evaluation of the evidence for the proposed medical device..........35B.1 Description of the search strategy........................................................................................................................... 35
B.2 Listing of included non-randomised studies............................................................................................................ 36
B.3 Assessment of the measures taken by investigators to minimise bias in the direct randomised trials....................48
B.4 Characteristics of the non-randomised studies....................................................................................................... 57
B4.1 Eligibility criteria............................................................................................................................................. 57
B4.2 Patient baseline characteristics..................................................................................................................... 58
B4.3 Interventions in the non-randomised studies................................................................................................. 59
B.5 Outcome measures and analysis of the literature................................................................................................... 60
B.6 Systematic overview of the results of the non-randomised studies.........................................................................64
B.6.1 Efficacy outcomes......................................................................................................................................... 64
B.6.2 Safety Outcomes........................................................................................................................................... 80
xvi

B.7 Extended assessment of comparative harms.......................................................................................................... 84
B.8 Interpretation of the clinical evidence...................................................................................................................... 85
C. Translating the clinical evaluation to the listing requested for inclusion in the economic evaluation................................................................................................89
C.1.1 Applicability of outcome comparisons............................................................................................................ 90
C.1.2 Circumstances of use.................................................................................................................................... 91
C.1.3 Extrapolation issues...................................................................................................................................... 91
C.1.4 Transformation issues................................................................................................................................... 91
D. Economic evaluation for the main indication........................................................93D.1 Decision model........................................................................................................................................................ 93
D.2 Population and circumstances of use reflected in the economic evaluation............................................................94
D.2.1 Baseline population....................................................................................................................................... 94
D.2.2 Circumstances of use.................................................................................................................................... 95
D.3 Structure and rationale of the economic evaluations............................................................................................... 97
D.3.1 Systematic literature review........................................................................................................................... 97
D.3.2 Structure of the economic model and its justification...................................................................................100
D.3.3 Time horizon and outcomes used in the economic evaluation....................................................................105
D.3.4 Discounting.................................................................................................................................................. 105
D.3.5 Methods used to generate the results......................................................................................................... 105
D.4 Variables in the economic evaluation.................................................................................................................... 106
D.4.1 Transition probabilities................................................................................................................................. 106
D.4.2 Direct health-care resources........................................................................................................................ 111
D.4.3 Health outcomes.......................................................................................................................................... 118
D.5 Results of the main economic evaluation.............................................................................................................. 121
D.6. Sensitivity analysis................................................................................................................................................... 125
D.6.1. Deterministic sensitivity analysis....................................................................................................................... 125
D.6.2. Probability sensitivity analysis.......................................................................................................................... 130
D.6.3. Sensitivity of the results to changes in the modelled economic evaluation......................................................132
E. Estimated extent of use and financial implications............................................135E.1 Justification of the selection of sources of data..................................................................................................... 136
E.1.1 Prevalence of hearing loss in Australia according to DAP...........................................................................136
E.1.2 Prevalence of hearing loss according to the application..............................................................................138
E.2 Estimation of use and costs of the proposed listing.............................................................................................. 139
E.2.1 Historical and projected use of insertion of a partially implantable MEI.......................................................139
E.2.2 Estimated costs of insertion of partially implantable MEIs on the MBS.......................................................141
E.3 Estimation of changes in use and cost of other medical services.........................................................................142
E.4 Net financial implications to the MBS.................................................................................................................... 148
E.5 Identification, estimation and reduction of uncertainty...........................................................................................151
E.5.1 Deterministic Sensitivity Analysis on the proportion of candidates..............................................................152
E.5.2 Deterministic Sensitivity Analysis on external ear pathologies....................................................................157
xvii
LIST OF TABLES
List of Tables
Table 1 - Air conduction threshold levels for SNHL indication (CE marked countries)......................................................................................................................................v
Table 2 - Non-randomised studies assessing the safety and efficacy of middle ear implants......................................................................................................................ix
Table 3 - Air conduction threshold levels for SNHL indication (CE marked countries)....................................................................................................................................14
Table 4 - Prevalence of hearing loss in selected European countries........................15Table 5 - MEI components listed on the ARTG.............................................................21Table 6 - Air conduction threshold levels for SNHL indication (CE marked countries)
....................................................................................................................................24Table 7 - Summary of indications and contraindications for the Vibrant Soundbridge
....................................................................................................................................29Table 8 - Summary of research questions that the assessment will investigate......31Table 9 - Search strategy for identifying studies on middle ear implants in treating
sensorineural hearing loss......................................................................................36Table 10 - Non-randomised studies assessing the safety and efficacy of middle ear
implants.....................................................................................................................39Table 11 - Systematic reviews and HTA reports...........................................................43Table 12 - Summary of comparator study characteristics included in the evaluation
....................................................................................................................................50Table 13 - Summary of Vibrant Soundbridge study characteristics included in the
evaluation..................................................................................................................52Table 14 - Eligibility criteria.............................................................................................57Table 15 - Characteristics of study participants and duration of follow-up compared
in trials.......................................................................................................................59Table 16 - Functional gain VSB.......................................................................................64Table 17 - Functional gain comparator.........................................................................66Table 18 - Speech in quiet VSB.......................................................................................67Table 19 - WRS; Speech in quiet comparator................................................................70Table 20 - SRT, speech in quiet comparator.................................................................71Table 21 - Table speech in noise VSB............................................................................73Table 22 - Speech in noise comparator.........................................................................75Table 23 - Subjective outcomes VSB.............................................................................77
xviii

LIST OF TABLES
Table 24 - Subjective outcomes VSB pooled................................................................78Table 25 - Subjective outcomes comparator.................................................................79Table 26 - Adverse events VSB.......................................................................................81Table 27 - Adverse events comparator..........................................................................82Table 28 - Summary of the evidence base supporting the therapeutic claims..........86Table 29 - Classification of an intervention for determination of economic
evaluation to be presented......................................................................................94Table 30 – Comparison of baseline populations and circumstances of use.............96Table 31 – Overview of economic evaluations identified in the literature..................98Table 32 – The main Markov states included in the main economic evaluation......101Table 33 – Base case model assumptions..................................................................104Table 34 – The estimated rate of recurring pathologies.............................................107Table 35 - Estimated rate of adverse events in individual studies............................108Table 36 - Estimated rate of voluntary non-use of the Vibrant Soundbridge...........111Table 37 - Total costs per patient for successful VSB implantation in the first 6
months.....................................................................................................................113Table 38 - Long-term costs of VSB use.......................................................................114Table 39 - Costs associated with adverse events and device failure for the Vibrant
Soundbridge system...............................................................................................115Table 40 - Total costs per patient associated with recurring outer ear pathologies
..................................................................................................................................115Table 41 - Total costs per patient for successful MAXUM/Soundtec implantation in
the first 6 months....................................................................................................117Table 42 - Long-term costs of Maxum/Soundtec use.................................................118Table 43 - Costs associated with adverse events and device failure for the
Maxum/Soundtec system.......................................................................................118Table 44 - Health outcome values used in the main economic evaluation..............119Table 45 - Age-dependent values used to model incremental utility in the main
economic evaluation...............................................................................................120Table 46 - Health outcome values used for comparing partially implantable MEI...120Table 47 - Base-case results produced by the state-transition model comparing VSB
vs. No intervention..................................................................................................121Table 48 - Base-case results produced by the state-transition model comparing VSB
vs. Maxum/Soundtec intervention.........................................................................121Table 49 - Costs accumulated over a period of 10 years for all interventions as
depicted by the model............................................................................................122
xix
LIST OF TABLES
Table 50 - List of health states and summary of cost impacts and health outcomes included in the economic evaluation....................................................................124
Table 51 – Deterministic sensitivity analysis for the main economic evaluation (all monetary outcomes in AUD)..................................................................................126
Table 52 – Deterministic sensitivity analysis for comparing partially implantable MEI (all monetary outcomes in AUD)...........................................................................127
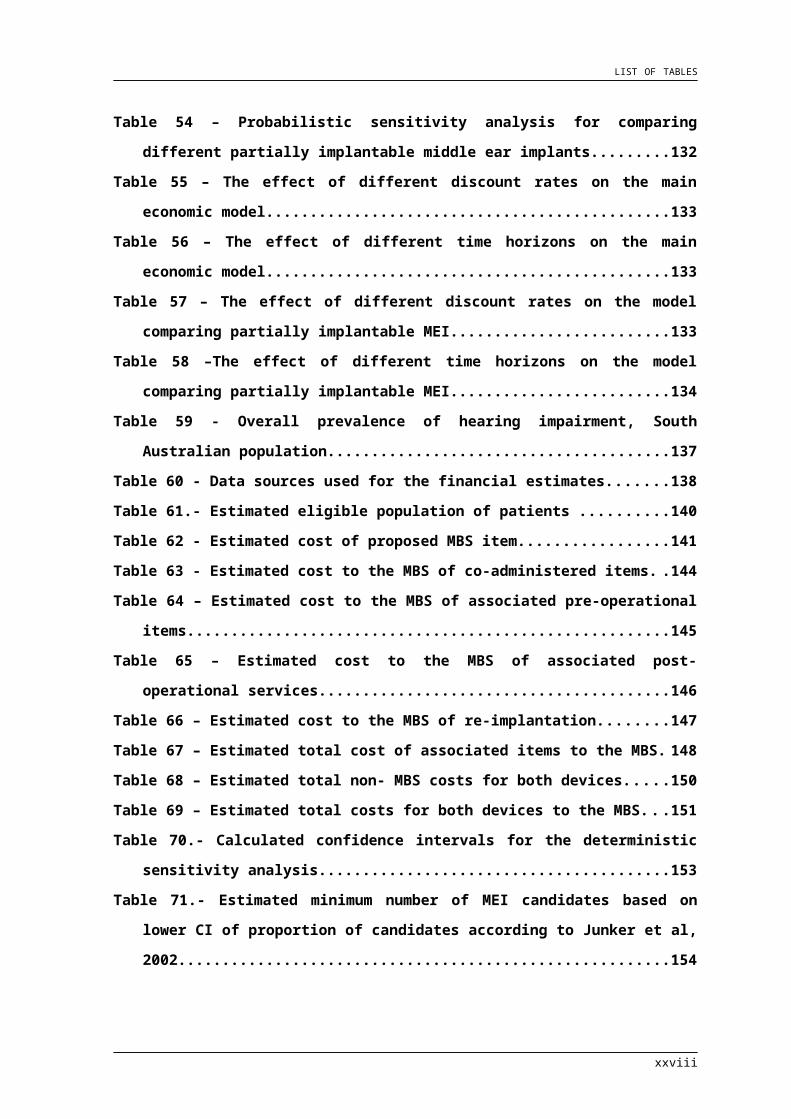
Table 53 –Probabilistic sensitivity analysis for the main economic evaluation......131Table 54 – Probabilistic sensitivity analysis for comparing different partially
implantable middle ear implants...........................................................................132Table 55 – The effect of different discount rates on the main economic model......133Table 56 – The effect of different time horizons on the main economic model.......133Table 57 – The effect of different discount rates on the model comparing partially
implantable MEI.......................................................................................................133Table 58 –The effect of different time horizons on the model comparing partially
implantable MEI.......................................................................................................134Table 59 - Overall prevalence of hearing impairment, South Australian population
..................................................................................................................................137Table 60 - Data sources used for the financial estimates..........................................138Table 61.- Estimated eligible population of patients .................................................140Table 62 - Estimated cost of proposed MBS item.......................................................141Table 63 - Estimated cost to the MBS of co-administered items...............................144Table 64 – Estimated cost to the MBS of associated pre-operational items............145Table 65 – Estimated cost to the MBS of associated post-operational services.....146Table 66 – Estimated cost to the MBS of re-implantation..........................................147Table 67 – Estimated total cost of associated items to the MBS..............................148Table 68 – Estimated total non- MBS costs for both devices....................................150Table 69 – Estimated total costs for both devices to the MBS..................................151Table 70.- Calculated confidence intervals for the deterministic sensitivity analysis
..................................................................................................................................153Table 71.- Estimated minimum number of MEI candidates based on lower CI of
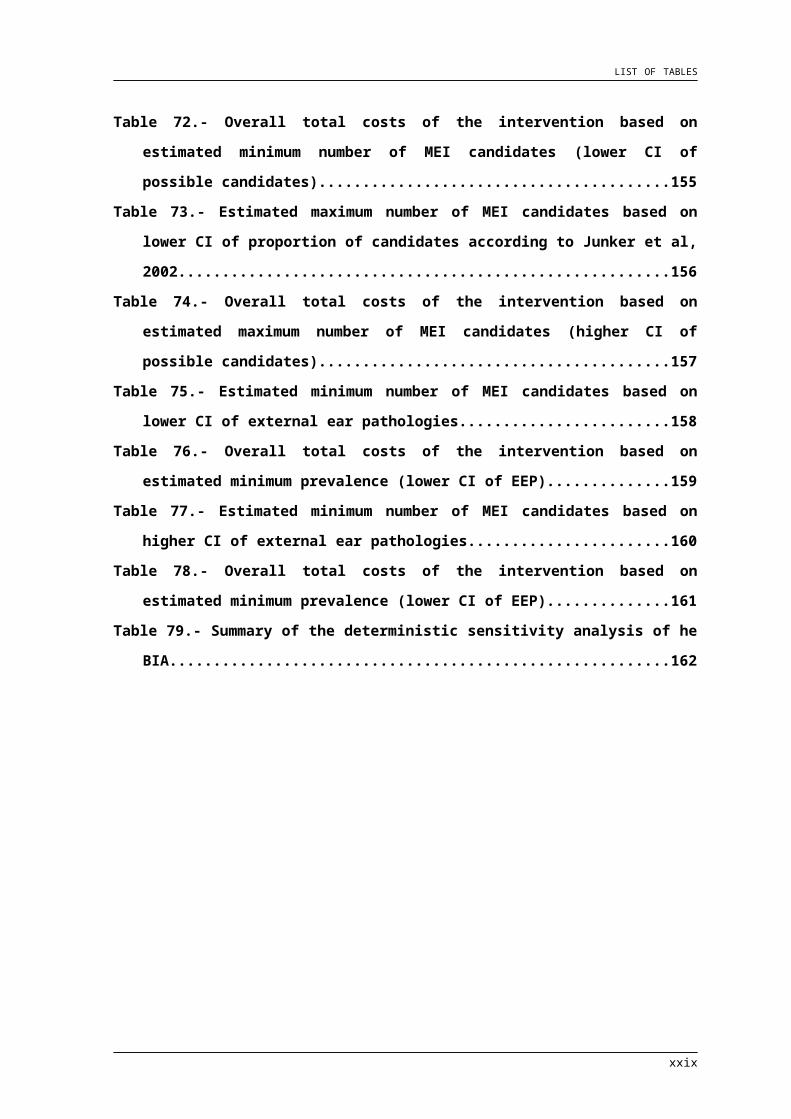
proportion of candidates according to Junker et al, 2002..................................154Table 72.- Overall total costs of the intervention based on estimated minimum
number of MEI candidates (lower CI of possible candidates)............................155Table 73.- Estimated maximum number of MEI candidates based on lower CI of
proportion of candidates according to Junker et al, 2002..................................156
xx

LIST OF TABLES
Table 74.- Overall total costs of the intervention based on estimated maximum number of MEI candidates (higher CI of possible candidates)..........................157
Table 75.- Estimated minimum number of MEI candidates based on lower CI of external ear pathologies.........................................................................................158
Table 76.- Overall total costs of the intervention based on estimated minimum prevalence (lower CI of EEP).................................................................................159
Table 77.- Estimated minimum number of MEI candidates based on higher CI of external ear pathologies.........................................................................................160
Table 78.- Overall total costs of the intervention based on estimated minimum prevalence (lower CI of EEP).................................................................................161
Table 79.- Summary of the deterministic sensitivity analysis of he BIA..................162
xxi
LIST OF FIGURES
List of Figures
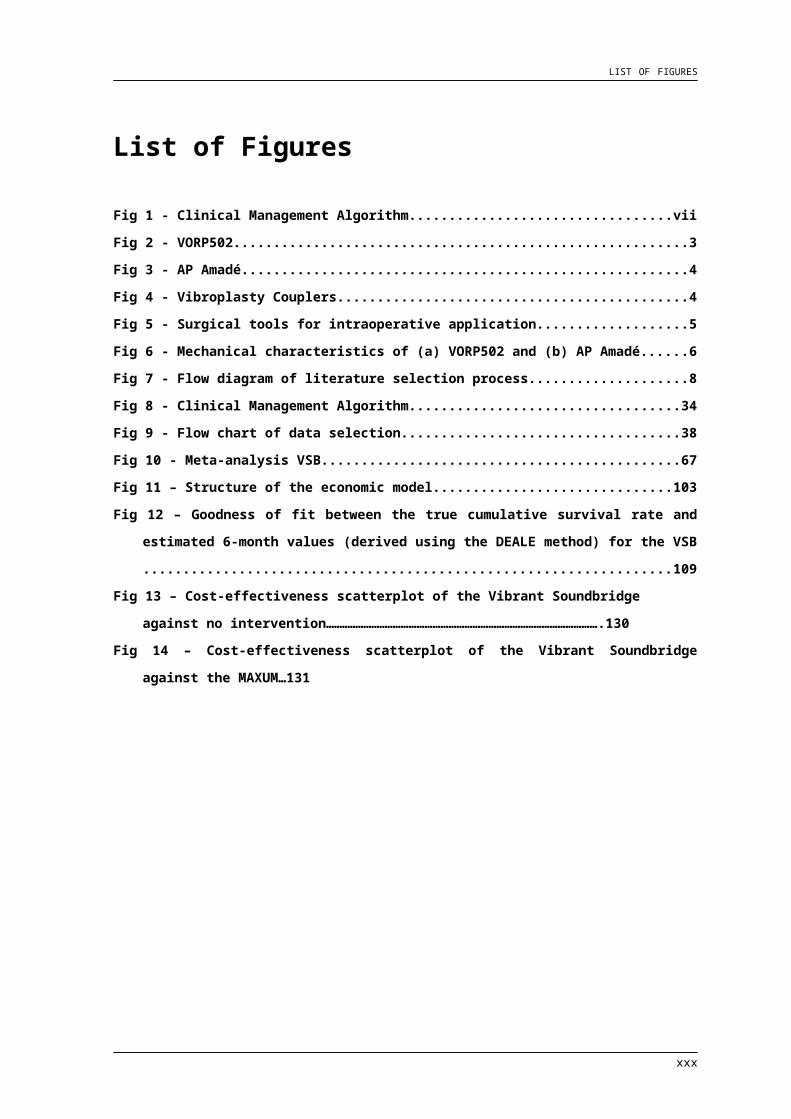
Fig 1 - Clinical Management Algorithm.......................................................................................viiFig 2 - VORP502............................................................................................................................... 3Fig 3 - AP Amadé............................................................................................................................. 4Fig 4 - Vibroplasty Couplers...........................................................................................................4Fig 5 - Surgical tools for intraoperative application.....................................................................5Fig 6 - Mechanical characteristics of (a) VORP502 and (b) AP Amadé.......................................6Fig 7 - Flow diagram of literature selection process....................................................................8Fig 8 - Clinical Management Algorithm.......................................................................................34Fig 9 - Flow chart of data selection..............................................................................................38Fig 10 - Meta-analysis VSB...........................................................................................................67Fig 11 – Structure of the economic model................................................................................103Fig 12 – Goodness of fit between the true cumulative survival rate and estimated 6-month
values (derived using the DEALE method) for the VSB...................................................109Fig 13 – Cost-effectiveness scatterplot of the Vibrant Soundbridge against no
intervention………………………………………………………………………………………….130Fig 14 – Cost-effectiveness scatterplot of the Vibrant Soundbridge against the MAXUM…131
xxii
LISTS OF ATTACHMENTS AND VOLUMES
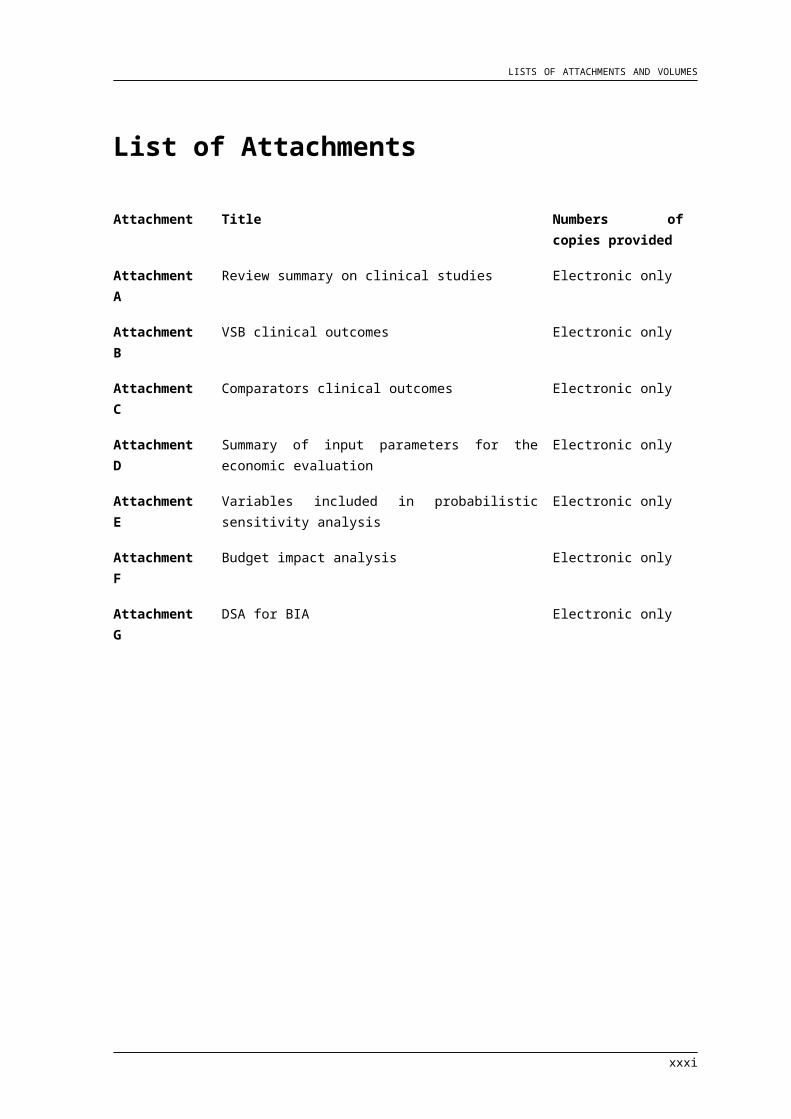
List of Attachments
Attachment Title Numbers of copies provided
Attachment A Review summary on clinical studies Electronic only
Attachment B VSB clinical outcomes Electronic only
Attachment C Comparators clinical outcomes Electronic only
Attachment D Summary of input parameters for the economic evaluation
Electronic only
Attachment E Variables included in probabilistic sensitivity analysis Electronic only
Attachment F Budget impact analysis Electronic only
Attachment G DSA for BIA Electronic only
xxiii
LISTS OF ATTACHMENTS AND VOLUMES
List of Volumes
Volume Numbers of copies provided
1. Main body of the submission 4
2. Attachments volume 4
3. References volume 4
xxiv
ABBREVIATIONS
Abbreviations
xxv
ABBREVIATIONS
Abbreviation Full term
AC Air conduction
AMEI Active Middle Ear Implant
AP Audio Processor
APHAB Abbreviated Profile of Hearing Aid Benefit
AR-DRG Australian Refined Diagnostic Related Group
ARTG Australian Register of Therapeutic Goods
AUD Australian Dollar
BAHA Bone anchored hearing aid
BC Bone conduction
BIA Budget impact analysis
CBAs controlled before and after studies
C/MHL Conductive and mixed hearing loss
CEA Cost effectiveness analysis
CEDIT Comite d'Evaluation et de Diffusion des Innovations Technologiques
CI Cochlear Implant
CHA Conventional Hearing Aid
COSI Client-orientated scale of improvement
CRD Cochrane Library, and The Centre of Reviews and Dissemination
CUA cost-utility analysis
DAP Decision Analytical Protocol
dB Decibel
DALYs Disability Adjusted Life Years
DRG diagnosis-related group
DSA Deterministic sensitivity analysis
DVA Department of Veteran Affairs
ENT Ear, Nose & Throat
FDA United States Food and Drug Administration
FG Functional Gain
FMT Floating Mass Transducer
FU Follow up
xxvi
ABBREVIATIONS
Abbreviation Full term
xxvii
ABBREVIATIONS
Abbreviation Full term
GBA Gemeinsamer Bundesausschuss (Federal Joint Committee)
G-DRG German Diagnosis Related Group
GHABP Glasgow Hearing Aid Benefit Profile
GP General Practitioner
HA Hearing aid
HDSS Hearing Device Satisfaction Scale
HICP the harmonized consumer price index
HL hearing loss/ hearing level
HTA Health technology assessment
HUI Health Utilities Index
ICER Incremental Cost-Effectiveness Ratio
IOI-HA International Outcome Inventory for Hearing Aids
ITS Interrupted time series
MBS Medicare Benefits Schedule
MEI Middle Ear Implant
N/A Not Applicable
n.a. Not available
n.d. Not determined
nCBAs not controlled before and after studies
NHB Net Health Benefit
NIHL Noise induced hearing loss
NMB Net Monetary Benefit
OFIA Operational and Financial Impact Analysis
OPS Operationen- und Prozedurenschlüssel (Operating Procedures)
OW Oval window
PHAB Profile of Hearing Aid Benefit
PHAP Profile of Hearing Aid Performance
PICO Population – Indication – Comparator – Outcome(s)
PL Prosthesis List
PSA Probabilistic sensitivity analysis
xxviii
ABBREVIATIONS
Abbreviation Full term
QALY Quality Adjusted Life Year
RCT Randomized Controlled Trial
RW Round window
SHACQ Soundbridge Hearing Aid Comparison Questionnaire
SNHL Sensorineural Hearing Loss
SNR50 signal-to-noise ratio where 50% of the presented test material is
understood
SPL Sound Pressure Level
UAMC University of Arizona Medical Center
VORP Vibrating Ossicular Prosthesis
VSB Vibrant Soundbridge
WHO World Health Organization
WRS word recognition score in quiet
xxix
A. DETAILS OF THE PROPOSED INTERVENTION AND ITS INTENDED USE ON THE MBS
A. Details of the proposed intervention and its intended use on the MBSA.1 Requested MBS listing and details of the intervention
This application is seeking Medicare Benefits Schedule (MBS) listing for insertion of Active
Middle Ear Implants (AMEI) in Sensorineural Hearing Loss (SNHL) plus a medical condition.
The Vibrant Soundbridge (VSB) was first implanted in 1996. The device was approved with
the CE marking in February 1998 and by the FDA in August 2000. Due to favorable results
in adults affected by mixed and conductive hearing loss (Beltrame et al., 2009;Colletti et al.,
2009;Colletti et al., 2006;Huttenbrink et al., 2008;Kiefer et al., 2006) VSB-candidacy
indications were extended to include not only sensorineural but also mixed and conductive
hearing losses in patients 18 years of age or older. As of November 2008, the VSB had been
implanted in more than 60 children and adolescents in countries throughout the world with
favourable results. In June 2009, the VSB received approval for patients younger than 18
years of age in the European Union and all other countries accepting the CE marking
(Cremers et al., 2010) audiologic results and the risk profile are comparable to the adult
population (Claros and Pujol, 2013;Colletti et al., 2013;Roman et al., 2012;Zernotti et al.,
2012). Middle ear implants have been implanted in children under the age of 5 with
favourable results (Frenzel et al., 2010;Mandala et al., 2011).
This application intends to treat patients with active middle ear implants, with a hearing loss
who cannot wear hearing aids because of a medical condition which precludes wearing
hearing aids. These patients need to be aided, but their hearing is not at a level which
requires a cochlear implant, and is ineligible for a bone conduction implant. Therefore an
active middle ear implant represents their only alternative for restoring hearing.
Category [3 ] – [Therapeutic Procedures]
MBS [item number (Note: this will be assigned by the Department if listed on the MBS)]
[Proposed item descriptor]
MIDDLE EAR IMPLANT, Insertion of, including a mastoidectomy, for patients who have:
Air conduction thresholds in the mild to severe range with PTA4 below 80 dB HL;
Sensorineural hearing loss and cannot wear conventional hearing aids for a variety of
reasons. However, these individuals can still benefit from the amplification of sounds;
Medical conditions precluding the use of hearing aids, such as chronic otitis externa,
psoriasis, exostosis of the ear canal, persistent excessive cerumen blocking the ear canal,
1
A. DETAILS OF THE PROPOSED INTERVENTION AND ITS INTENDED USE ON THE MBS
absent or deformed pinnas following cancer treatment, unusual morphology affecting the
ear canal or pinna;
Speech perception discrimination of at least 65% correct with appropriately amplified sound.
Fee: $[1,876.59 - Proposed fee] - based on Mastoidectomy item
[(Anaes.) - Proposed relevant explanatory notes]
The internal components of the proposed medical service are currently being funded
through surgical budgets, private health fund exgratia applications (and subsequent
approval) and occasionally by patients themselves. The external audio processor, upgrades,
programming and maintenance is publicly funded through Australian Hearing to eligible
clients. Otherwise the service is either self-funded or funded through the exgratia private
health fund application.
Details of the interventionThe only partially implantable active middle ear implant indicated for sensorineural hearing
loss plus medical condition is the Vibrant Soundbridge
MaterialsThe materials in the VSB were selected to be inert with respect to body tissue. For the
implanted parts, commonly used long-term implant materials were used. The materials in
direct tissue contact are:
For the implant itself, the VORP502, the materials in direct body contact are:
NuSil MED-4750,
Titanium Grade 1 (ASTM F67), and
Loctite Hysol.
For the AP Amadé, the material in direct body contact is:
Xylex® ResinHX8300HP (Colors formulated for Dark Chocolate, Terra Brown, Golden Sand,
Silver Grey).
For the Vibroplasty Couplers, the Vibroplasty-OW-Coupler, the Vibroplasty-CliP-Coupler, the
Vibroplasty-Bell-Coupler, and the Vibroplasty-RW-Coupler the material in direct body contact
is:
Titanium Grade 2 (ASTM F67).
2
A. DETAILS OF THE PROPOSED INTERVENTION AND ITS INTENDED USE ON THE MBS
For the generic tools, the materials in direct body contact are:
Medical Grade Stainless Steel (Forming Forceps),
Non-magnetic Medical Grade Stainless Steel (Skin Flap Gauge 7).
The VORP Sizer Kit underwent a change to the product materials. Originally the product was
made of:
Polypropylene (both, VORP template and FMT Sizer).
The currently marketed VORP Sizer Kit is made of:
Medical Grade Thermoplastic Elastomere (VORP template)
Medical Grade Polypropylene (FMT Sizer).
The biological safety of these materials was preclinically established according to ISO
10993.
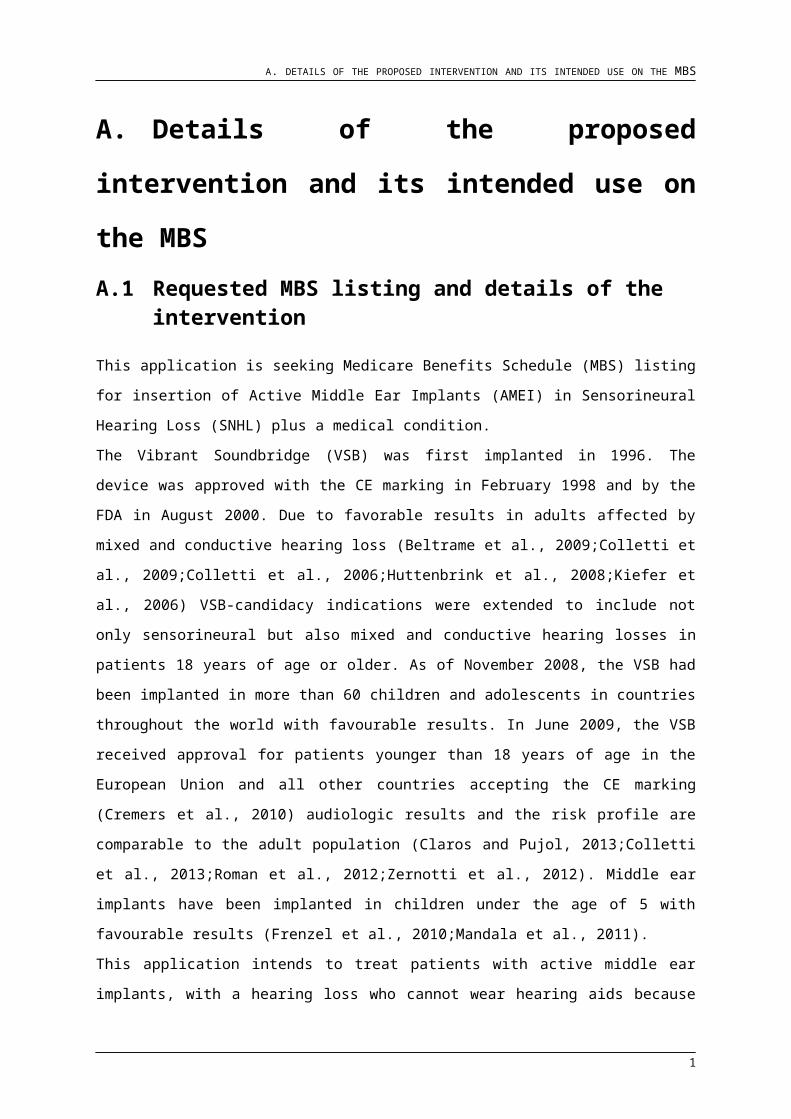
Device ComponentsThe VSB System consists of an internal part (VORP502), an external audio processor (AP Amadé), the Vibroplasty Couplers, generic tools (accessories to facilitate the
implantation), and the fitting system of the AP (application software SYMFIT).
The internal part is surgically implanted. It consists of the FMT, conductor link, electronic
package (demodulator) and a magnet surrounded by an internal coil. The AP is held onto the
intact skin by magnetic attraction over the implant. It contains a microphone, processing
electronics and a battery for power. The following is a depiction of the main internal and
external system components:
a b
Fig 2 - VORP502 (a) entire implant, (b) enlarged view of the FMT
3
A. DETAILS OF THE PROPOSED INTERVENTION AND ITS INTENDED USE ON THE MBS
Fig 3 - AP Amadé
The Vibroplasty Couplers provide additional placement options for the FMT in subjects
affected by conductive or mixed hearing loss. They are specifically designed to be used in
concert with the FMT. Four Vibroplasty Couplers are available: the Vibroplasty-OW-Coupler
(oval window), the Vibroplasty-CliP-Coupler, the Vibroplasty-Bell-Coupler, and the
Vibroplasty-RW-Coupler (round window) – see Fig 4. All Couplers, except for the
Vibroplasty-RW-Coupler are available in four different sizes. Depending on the design, the
Vibroplasty Couplers may be placed either on the stapes footplate in the oval window, the
stapes head, or the round window. As can be seen from Fig 4, the different types account
for the anatomic variability in compromised middle ears.
a b
c d
Fig 4 - Vibroplasty Couplers (a) Vibroplasty-OW-Coupler (oval window), (b) Vibroplasty-CliP-Coupler, (c) Vibroplasty-Bell-Coupler, and (d) Vibroplasty-RW-Coupler (round window)
Several optional surgical tools are available for use with the VSB. These include: the
Forming Forceps, the Skin Flap Gauge 7, and the VORP Sizer Kit. The Forming Forceps
can be used to form the FMT attachment around the incus and the Skin Flap Gauge 7 can
4
A. DETAILS OF THE PROPOSED INTERVENTION AND ITS INTENDED USE ON THE MBS
be used to evaluate the thickness of the skin flap in the area covering the coil section of the
implant. The VORP Sizer Kit, consisting of VORP template and FMT Sizer, is intended to be
used during implantation to support a safe and effective procedure: the VORP template can
be used to facilitate positioning of the implant on the skull and creation of the bone bed. The
FMT Sizer is intended to be used during surgery to determine the volumetric requirements of
the Floating Mass Transducer and assure adequate access for the FMT in the middle ear.
a b
c
Fig 5 - Surgical tools for intraoperative application (a) Forming Forceps, (b) Skin Flap Gauge 7, and (c) VORP Sizer Kit containing VORP template and FMT Sizer.
Prior to use, the AP Amadé is programmed to meet the particular hearing needs of the
patient. Programming hardware and software are similar to hearing aid programming
equipment, and programming typically takes about 30 minutes. Programming is done by
trained hearing professionals. Standard fitting hardware are a PC, a hearing aid interface
modem - HiPro box, and a standard programming cable that usually are available at implant
centers and hearing professional practices.
The fitting is performed in the off-the-shelf hearing instrument fitting software, CONNEXX
6.4.3 or higher (Siemens). To enable CONNEXX to recognize the AP, the database SYMFIT
is needed. The SYMFIT is used to program the APs of the VSB System as a single fitting
user interface.
5
A. DETAILS OF THE PROPOSED INTERVENTION AND ITS INTENDED USE ON THE MBS
Mechanical CharacteristicsThe VORP502 is an elongated silicone and titanium implant. Its weight is 9.30 g. The weight
of the AP Amadé is 8.00 g including the battery and the magnet. Key dimensions are
supplied in the following illustration.
a b
Fig 6 - Mechanical characteristics of (a) VORP502 and (b) AP Amadé.
Other CharacteristicsPower SupplyThe implant system is powered by one hearing aid (type 675) battery in the audio processor
(AP). As described in section 4.0, the processed audio signal and the energy required for
generating the vibration is coupled to the implant via an inductive link. The implant has been
intentionally designed to be passive when not activated with the AP and therefore does not
require an energy source of its own.
Electrical CharacteristicsUnlike other hearing implants such as cochlear implants, neither the AP nor the implant itself
is capable of delivering electrical signals to the patient. Electricity is exclusively needed to
operate the circuits within the AP, which then supplies signals to the implant via electronic
induction. The implant system is only active in the way that it creates mechanical
(vibrational) energy, which is passed to the inner ear.
Signal Processing CapabilitiesAudio signal processing is exclusively performed by the AP. The following key features have
to be present in the AP to ensure that effective bone conduction stimulation can be
achieved:
Frequency response equalization: The audio signal picked up by the microphone is
processed through a filter bank. The filter bank is used to equalize the frequency
6

A. DETAILS OF THE PROPOSED INTERVENTION AND ITS INTENDED USE ON THE MBS
response of the bone conduction pathway. In addition, it is used to adapt the signal
processing to the individual patient’s degree of hearing loss.
Dynamics processing: Due to the constrained dynamic range of the bone conduction
pathway (compared to the normal auditory pathway via the tympanic membrane)
dynamics processing (specifically compression) is needed. As with frequency
response equalization, the patient’s degree of hearing loss influences the setting of
the dynamics processor.
Additional features may be available in different models of the AP. They can be used to
increase listening comfort in certain situations, but do not contribute to the clinical benefit of
the VSB established within this report.
Individual ProgrammingThe key features - frequency response equalization and dynamics processing settings -
have to be individually programmed for each patient. This programming is performed with a
software application (Symfit) and a fitting interface (e.g. HiPro or NOAHlink). The
programming is done by trained hearing specialists at each center and settings cannot be
changed by the individual VSB user.
A.1.1 Health technology assessment background
Health technology assessment (HTA) is a multidisciplinary activity that systematically
examines the technical performance, safety, clinical efficacy, and effectiveness, cost, cost
effectiveness, organizational implications, social consequences, legal, and ethical
considerations of the application of a health technology. HTA activities are characterized by
a systematic and structured way of answering questions by evaluating and synthesizing
available evidence from the literature (Fig 7).
7

A. DETAILS OF THE PROPOSED INTERVENTION AND ITS INTENDED USE ON THE MBS
Fig 7 - Flow diagram of literature selection process (adapted from Khan et al.)
The proposed medical service has been considered under MSAC application 1137 in 2010.
While the assessment compared the MEI to Cochlear implants and BAHA as comparators,
which have been excluded for the current application 1365, the main conclusions were:
SAFETY: Overall, absolute evidence from case series studies suggests that MEI
appears to be as safe as CI and BAHA. Certain adverse events are likely to be more
8
A. DETAILS OF THE PROPOSED INTERVENTION AND ITS INTENDED USE ON THE MBS
commonly seen in children, specifically with the BAHA, paediatric bone is softer than
that of adults, and has a longer osseointegration time, and hence may be more
susceptible to device loosening or damage. Additionally, children may be likely to
sustain head trauma during rambunctious play. Children may also be less reliable at
cleaning and maintaining their implant site. This may be especially important in the
case of the BAHA.
EFFECTIVENESS: Generally, MEI implantation and/or activation led to
improvements in patients with MHL and CHL. Only one comparative study assessed
the MEI versus the CI, and no comparative studies assessed the MEI versus the
BAHA. Functional gain provided by the MEI was usually of clinical significance (≥10
dB). Other effectiveness outcomes were varied and not uniformly reported across the
studies. Where reported, quality of life and patient satisfaction outcomes showed
improvements after MEI implantation or activation. Where reported, technical
outcomes generally showed improvements after MEI implantation or activation but
statistical analyses were generally not supplied. Generally the MEI appears to be as
effective as the HA in patients with MHL.
COST-EFFECTIVENESS: The estimated costs of MEI, BAHA and CI were taken
from a number of sources (MBS, Australian Refined Diagnostic Related Group (AR-
DRG), manufacturer’s implants and the median charged MBS fee). A one-night
hospital stay would be necessary for all MEI (compare to 90% for CI and none for
BAHA); MEI can be performed as day surgery and under local anaesthetic. Only
costs incurred in the 1st year were considered. Although the MEI was shown to
provide an overall cost saving if used as a direct replacement for CI/BAHA, it was
indicated that if MEI replaces BAHA there will be an increase in cost. However, this
did not take into account the treatment costs of infection rates in the long term
associated with a percutaneous character of the BAHA abutment.
However, it was also indicated that there was:
Significant risk of residual hearing loss in MEI implantation compared to no risk in
BAHA implantation; Unlike the CI literature, the MEI literature included many patients
with mild or moderate HL. In these patients, any further deterioration in hearing may
be of greater clinical importance compared with losses in patients with severe or
profound HL. Patients with CHL did not report significantly worse residual hearing
after implantation. Proposed reconsideration is based on the fact that MEI cannot be compared to CI as the audiological criteria for the two implants are
9
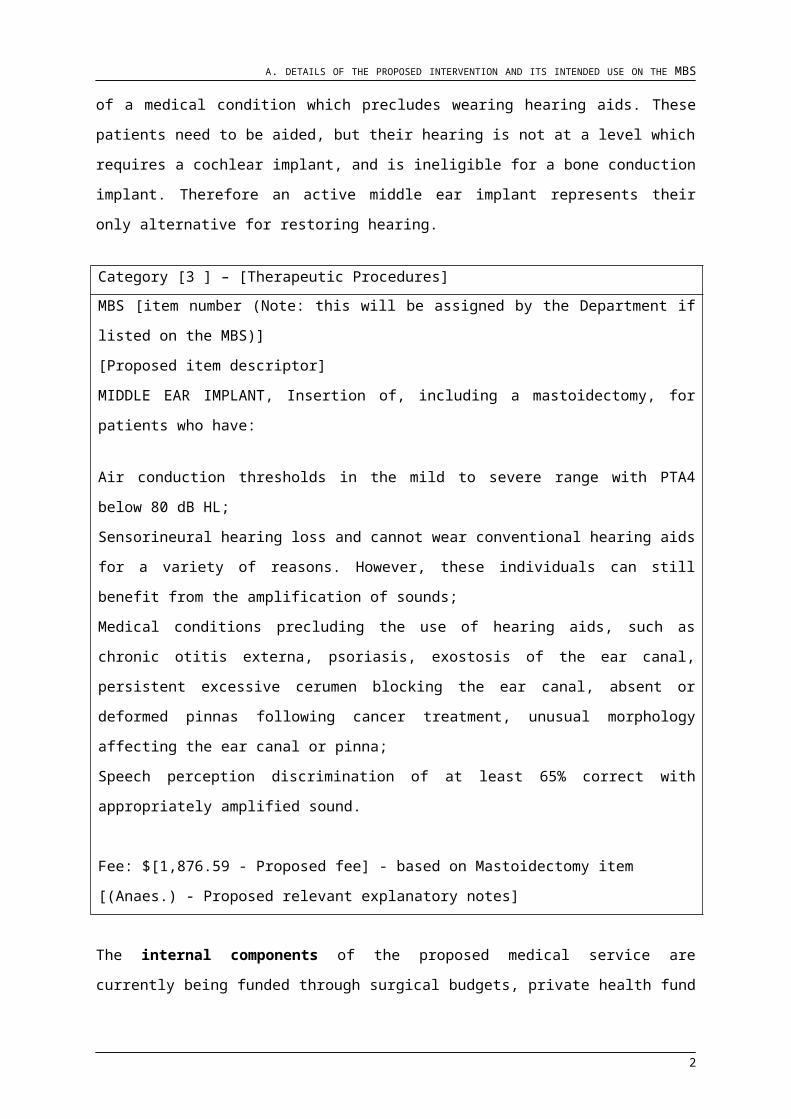
A. DETAILS OF THE PROPOSED INTERVENTION AND ITS INTENDED USE ON THE MBS
mutually exclusive. There is a sizable body of research showing the risk of loss of residual hearing with MEI is negligible.
A sizeable unaddressed pool of patients who may be eligible for MEI, not presently
accessing implantable devices, and may represent the largest uptake for leakage of
MEI. Therefore no cost saving with MEI, only growth; Proposed reconsideration is based on the fact MEI implants remain an important option for a group of patients who cannot benefit from conventional hearing aids or other prosthesis.
In addition, other international health technology assessment (HTA) agencies have reviewed
insertion of partially implantable Middle Ear implants.
The systematic literature review by Butler et al. (Butler et al., 2013) which was funded
by MSAC reports about the effectiveness of active middle-ear implants in subjects
affected by sensorineural hearing loss and compared the outcomes with external
hearing aids. The authors performed a systematic search of several electronic
databases, including PubMed and Embase, in order to identify relevant studies for
inclusion. The active middle ear implants under evaluation include the VSB, the
Otologics MET, the Envoy Esteem and the Ototronix Maxum (formerly, Soundtec
Direct Drive Hearing System). A total of 14 comparative studies were included. 9
articles reported on the primary outcome of functional gain: one publication found
that the middle-ear implant worked better than external hearing aids, while another
found that external hearing aids were generally significantly better than middle-ear
implants. 6 of the 7 remaining studies found that middle-ear implants were better
than external hearing aids, although generally no clinically significant difference was
seen. The authors concluded that in general, active middle ear implants appear to be
as effective as external hearing aids for patients with sensorineural hearing loss.
Another systematic review was published in the Journal of Otology & Rhinology
(Klein et al., 2013). The article is based on the final STE Report of the University of
Alberta (Alberta Health and Wellness Report, 2011). The main objective was to
examine the current state of the science related to the safety and effectiveness of the
Vibrant Soundbridge middle ear implant in the treatment of hearing loss. Several data
bases including MEDLINE, EMBASE, The Cochrane Library, Web of Science,
CINAHL, PsycINFO and the Centre for Reviews and Dissemination were searched
without date or language limits. Finally, 44 studies involving a total 832 patients met
10
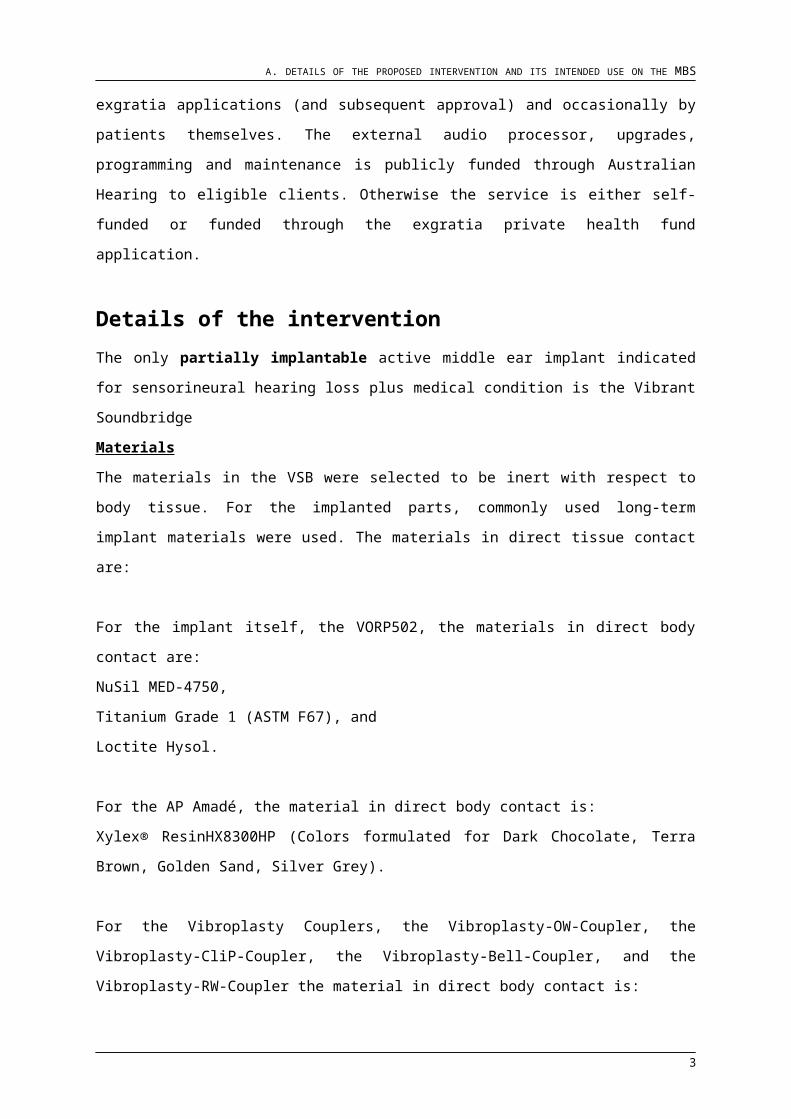
A. DETAILS OF THE PROPOSED INTERVENTION AND ITS INTENDED USE ON THE MBS
the study’s eligibility criteria. The authors concluded that the majority of studies which
compared the VSB to conventional hearing aids, reported statistically significant
improvements in functional gain, speech reception, and quality of life with the VSB.
Regarding speech recognition, the findings were mixed. Among studies that
compared the VSB to the unaided condition, there was clinical benefit observed in all
categories with the device. Adverse event rates were reasonably low, although VSB
implantation poses a significant risk compared to non-invasive treatment with
conventional hearing aids. The Vibrant Soundbridge middle ear implant appears to
offer a safe and effective alternative for patients able and unable to wear
conventional hearing aids.
The STE report for the province of Alberta (Alberta Health and Wellness Report,
2011) is a systematic review of the evidence on middle ear implants (MEI) for the
treatment of hearing loss. The objectives of this review were to determine the safety,
effectiveness and cost-effectiveness of MEI in comparison to external hearing aids,
bone anchored hearing aids (BAHA), or cochlear implants; to identify particular sub-
groups of patients who might benefit most from MEI, and to summarize the current
criteria for using MEI versus alternative treatments for hearing loss. Main outcomes
were:
o Safety: The partially implantable Vibrant Soundbridge and fully implantable
Carina appear to be relatively safe. There were few reports of major
complications, and these occurred at rates similar to those with BAHA. A
greater number of major complications was reported with the fully implantable
Esteem, including high rates of nerve damage. Revision surgeries and
explantations were more frequent with the Esteem and Carina MEIs. No
significant safety issues associated with conventional hearing aids were
found. While in this review, the safety of MEI was not specifically compared to
that of cochlear implants because of differences in eligible patient populations
(cochlear implants are typically indicated for more severe hearing loss),
based on previously published reviews of cochlear implants, MEI appears to
be at least as safe as cochlear implants.
o Effectiveness Evidence: Middle ear implants offer functional gains
comparable to those achieved with hearing aids. Based on limited evidence,
MEIs appear to provide greater improvements in the perception of speech in
noisy situations and in sound quality. Due to differences in the severity of
hearing loss in patients eligible for cochlear implants and those eligible for
11
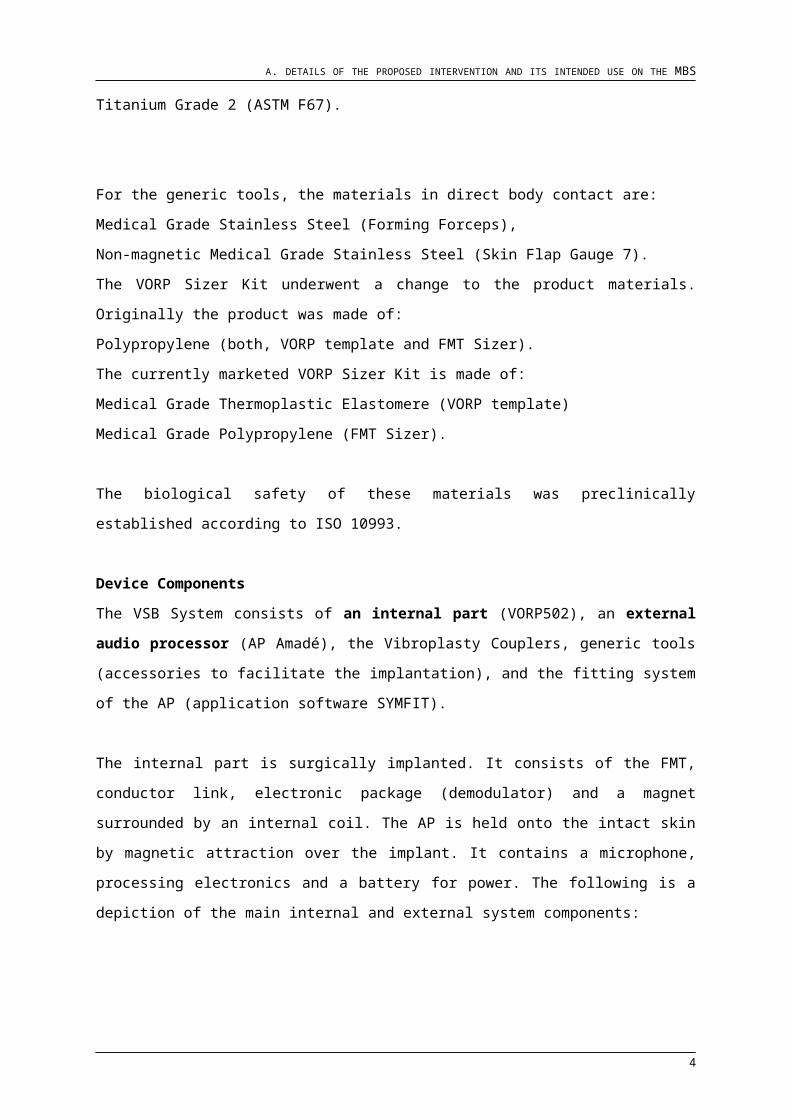
A. DETAILS OF THE PROPOSED INTERVENTION AND ITS INTENDED USE ON THE MBS
MEI, the comparative effectiveness of these two devices could not be
assessed
o Economical Evidence: A cost-effectiveness analysis could not be conducted
because for patients who are not medically able to wear a hearing aid, and
who are ineligible for a BAHA, there are currently no alternative treatment
options. Based on an estimated 20 patients receiving MEI per year in Alberta,
the total budget impact over 5 years would be $2,677,497.
o In conclusion, the authors state that although the technology has been in use
for over 10 years, good quality evidence on MEI is still lacking. In patients
medically able to wear conventional hearing aids, the evidence indicates that
MEI offers a similar improvement in functional gain to that achieved with
conventional hearing aids, but may offer greater improvement with respect to
perception of speech in noise and sound quality. In the small group of
patients who are medically unable to use conventional hearing aids, MEI
appears to offer a viable treatment option.
In the UK, the Vibrant Soundbridge is approved for SNHL according to the Clinal
Commissioning Policy Statement: Active Middle Ear Implant, December 2012,
Reference; NHSCB/D9/b/2: “Active middle ear implants are not routinely
commissioned except under the following circumstances, as no other alternative
treatment is available: Patients with bilateral sensorineural hearing loss in whom
conventional hearing aids have been used and found to be medically unsuitable due
to conditions of the external ear”.
A.1.2 SNHL + medical condition and screening background
Individuals suspected of having a hearing loss are referred for a full audiometric evaluation
of their hearing. This evaluation consists of pure tone audiometry and speech testing. Pure
tone audiometry is divided into air conduction and bone conduction testing where the first
indicates the sensitivity of the entire hearing system, and the latter indicates the sensitivity of
the inner ear only. Thresholds of audibility, also named hearing thresholds, are determined
at frequencies from 250 to 8000 Hz which is the range of sound that the human ear is most
sensitive to. Normal hearing is represented by air and bone conduction thresholds below
25 dB HL. Anything greater than 25 dB HL represents various levels of hearing loss. Without
public funding, these patients who would be respective AMEI candidates are currently left
untreated.
12
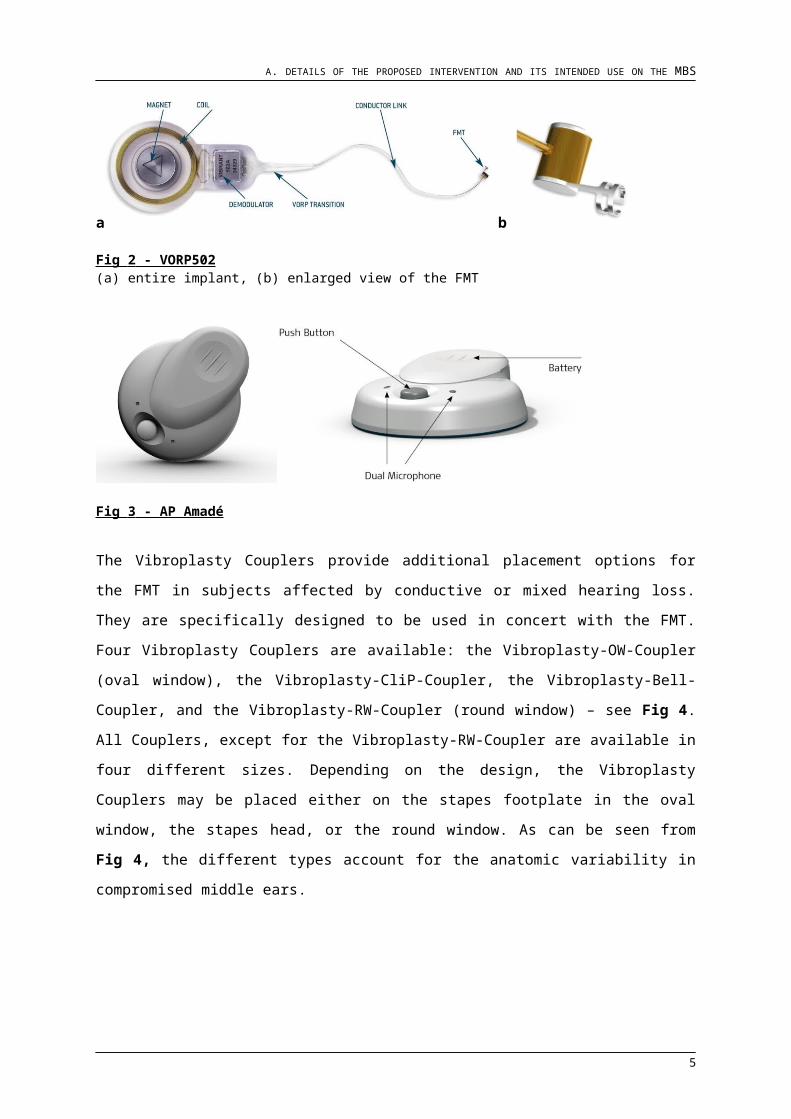
A. DETAILS OF THE PROPOSED INTERVENTION AND ITS INTENDED USE ON THE MBS
A.2 Indications and Contraindications
A.2.1 Indications for active middle ear implants
Out of the three active middle ear implants the Esteem and the Carina are both indicated for
adults who have:
Stable bilateral moderate to severe sensorineural hearing loss
Unaided speech discrimination tests score greater than or equal to 40%
Normal middle ear function and anatomy
Minimum 30 days of experience with appropriately fit hearing aids
Both of these devices are contraindicated in patients who present with chronic outer, middle or inner ear pathologies.
These criteria represent a population who could alternatively be treated by conventional
HAs, or by a cochlear implant when amplification is insufficient. The only active middle ear
implant that offers management for the target population is the Vibrant Soundbridge.
The indications for the Vibrant Soundbridge are: Pure-tone air-conduction threshold levels at or within the levels listed below in Table
3. Pure-tone air-conduction thresholds for both ears within 20 dB HL of each other at
frequencies .5 to 4 kHz Air-bone gap at 0.5, 1, 2 and 4 kHz no greater than 10 dB HL
at two or more of these frequencies.
Normal tympanometry.
No previous middle ear surgery.
The patient shall have no history of post-adolescent, chronic middle ear infections or
inner ear disorders such as vertigo or Meniere’s syndrome.
Speech audiometry curve adequate to the respective PTA. Speech understanding
>65% (at 65 dB SPL) for word lists with amplification or at most comfortable level
under earphones.
Unable to wear or benefit from a conventional hearing aid for medical reasons.
The ear selected for implantation of the VSB shall be equal to or worse than the un-
implanted ear.
13
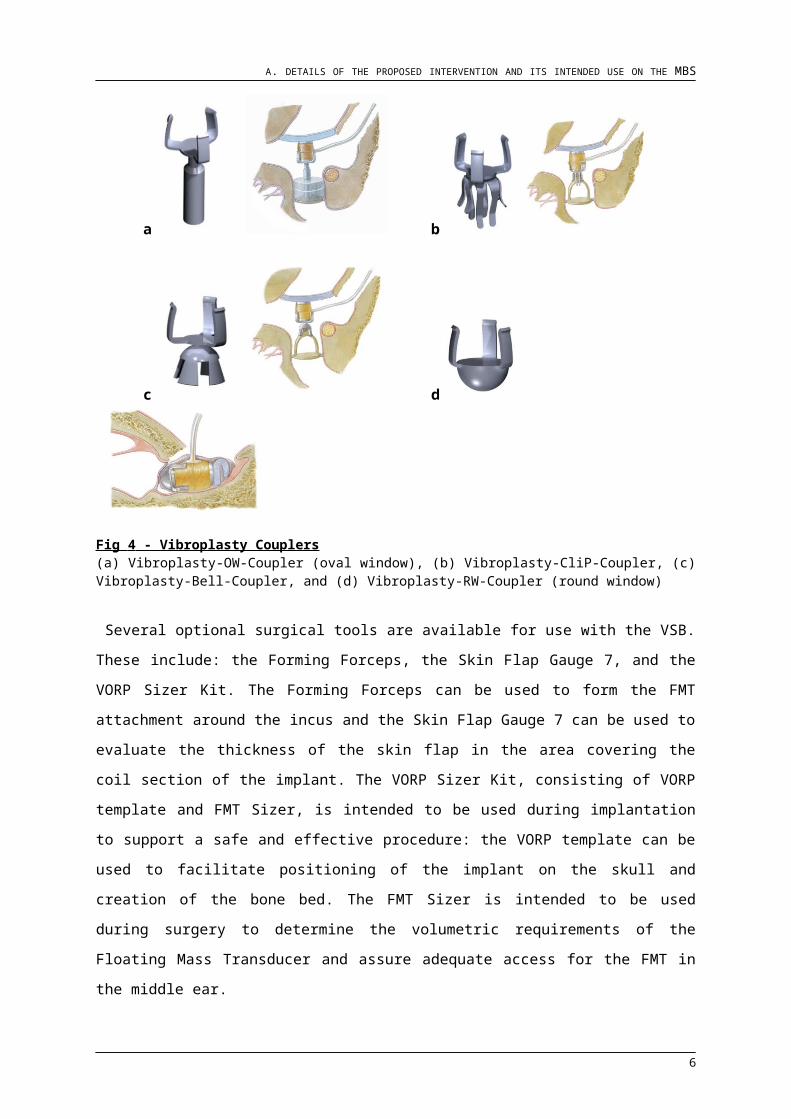
A. DETAILS OF THE PROPOSED INTERVENTION AND ITS INTENDED USE ON THE MBS
Table 3 - Air conduction threshold levels for SNHL indication (CE marked countries)
Frequency (kHz) 0.5 1 1.5 2 3 4
Lower Limit (dB HL) 10 10 10 15 25 40
Upper Limit (dB HL) 65 75 80 80 85 85
Vibrant Soundbridge candidates cannot use conventional hearing aids for a variety of
medical reasons. These may include but are not limited to conditions such as chronic otitis
externa, psoriasis, exostosis of the ear canal, persistent excessive cerumen blocking the ear
canal, absent or deformed pinnas following skin cancer, unusual morphology affecting the
ear canal or pinna that prevent the use of conventional hearing aids.
A.2.2 Definition and incidence of the medical condition
Clinical needHearing loss is among the most frequent physical impairments in industrialized nations.
According to the statistics of the WHO, approximately 51 million adults in developed
countries suffer from a moderate or greater hearing loss, 13 million of whom have a severe
to profound hearing loss.1 This represents 6.6% of the population. This number is
considerably higher in the adult population, where the share of persons with hearing loss is
estimated to range from 17% to more than 20%
Although the methodologies of available epidemiological surveys differ, these numbers
correspond roughly to data compiled on the basis of a survey in Germany for the year 2011.
According to this study (Deutscher Schwerhörigenbund e.V., 2012), approximately 21
percent of the population over 14 years of age suffer from mild to profound hearing loss.
The epidemiological data for Germany are comparable to data in other European countries,
with age-specific prevalence rates of hearing loss (as measured in dB) varying by ±2%.
However, direct comparison of the data is limited due to differences in the methods and tools
employed to collect and tabulate data and to classify results (Roth et al., 2011).
Table 4 - Prevalence of hearing loss in selected European countries
Country Survey 21-39 dB 40–69 dB 70–94 dB >95 dB Total
Italy 2170 pers over 18 17.1% 4.0% 1.2% 0.3% 22.5%
Finland 3518 pers over 25 17.2% 4.3% 0.5% 0.04% 22.1%
Denmark 705 pers age 30-50 3.4% 0.2%
1 Moderate hearing loss is defined as a hearing threshold level in the better ear of 41 dBHTL or more (averaged over 0.5, 1, 2, 4kHz). Severe to profound hearing loss is a hearing threshold level in the better ear of 61 dBHTL or more (averaged over 0.5, 1, 2, 4kHz).
14
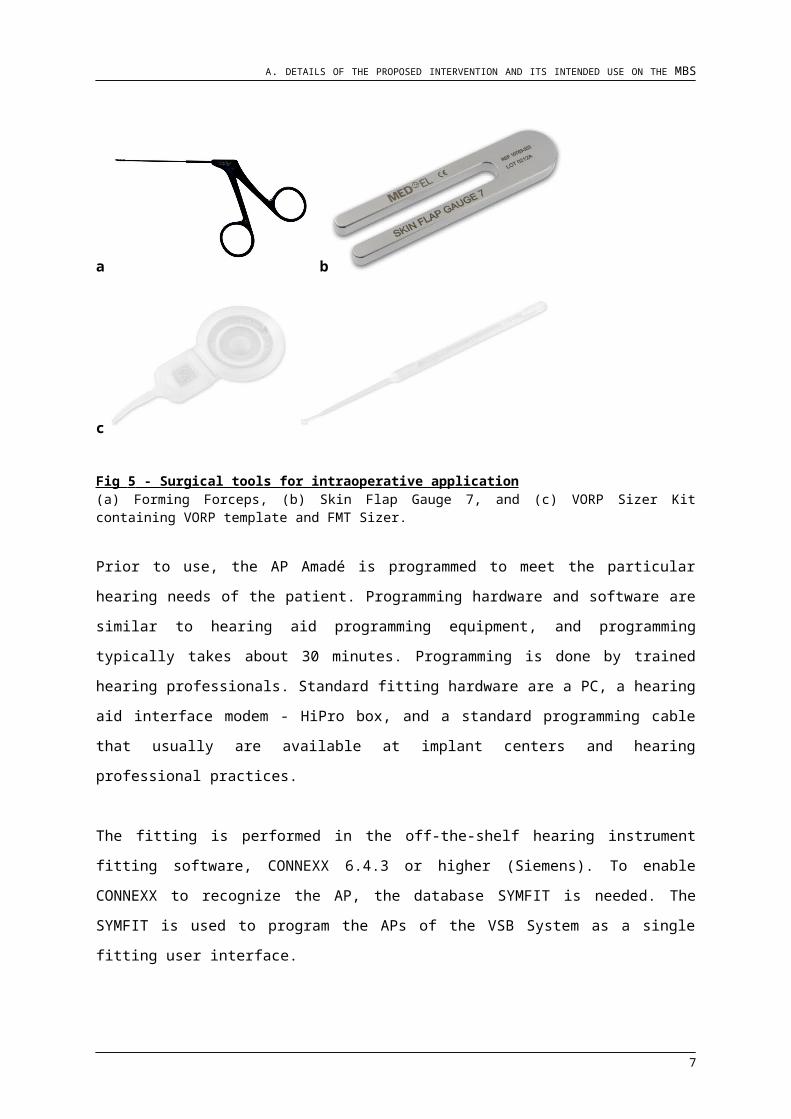
A. DETAILS OF THE PROPOSED INTERVENTION AND ITS INTENDED USE ON THE MBS
Sweden 590 pers over 20 18.1% 4.5% 0% 0% 22.6%
UK 2662 pers over 18 16.8% 4.9% 0.7% 0.2% 22.6%
Germany 2031 pers over 16 11.0% 7.0% 1.4% 0.3% 19.7%
Germany 18+ years 11.7% 7.3% 1.5% 0.3% 20.8%
Germany 20+ years 11.9% 7.4% 1.5% 0.3% 21.1%
Germany 25+ years 12.7% 7.9% 1.6% 0.4% 22.6%
Source: Deutscher Schwerhörigenbund www.schwerhoerigen-netz.de „Internationale Statistikvergleiche" and http://www.oesb-dachverband.at/schwerhoerigkeit/statistik/"
Surveys also reveal that hearing loss is increasing among children and adolescents.
According to the data of the U.S. National Health and Nutrition Examination Survey, the
prevalence of hearing loss among adolescents aged 12-19 years increased from 14.9% to
19.5% between 1994 and 2006, representing an increase of 31% (Kahue et al.,
2014;Shargorodsky et al., 2010).
Hearing loss and its consequencesHearing loss may be caused by interference with the transmission of sound from the outer to
the inner ear (conductive hearing loss), damage within the inner ear or to the auditory nerve
or auditory centres in the brain (sensorineural hearing loss). In some cases, hearing loss
may be the result of both sensorineural and conductive hearing loss and is then referred to
as mixed hearing loss.
Sensorineural hearing loss is the most common type of hearing loss and its most common
form is aged-related hearing loss, or presbycusis. This progressive condition is caused by
the loss of function of hair cells in the inner ear, a gradual process that ultimately leads to
deafness. Hearing loss in adults may also be caused by excessive exposure to noise or
ototoxic drugs, metabolic disorders, infections or genetic factors.
Partial hearing loss is the term used to describe types of hearing loss that are mild to severe,
thus permitting the person with hearing loss to hear some sounds. In general partial hearing
loss affects high-frequency hearing more than low-frequency hearing.
In children, hearing loss may have a genetic aetiology or have prenatal, perinatal or
postnatal causes. The latter include conditions such as meningitis and viral infection of the
inner ear (for example, rubella or measles), as well as premature birth and congenital
infections. Deafness that occurs before the development of language is described as
prelingual, whereas deafness that occurs after the development of language is described as
postlingual.
15
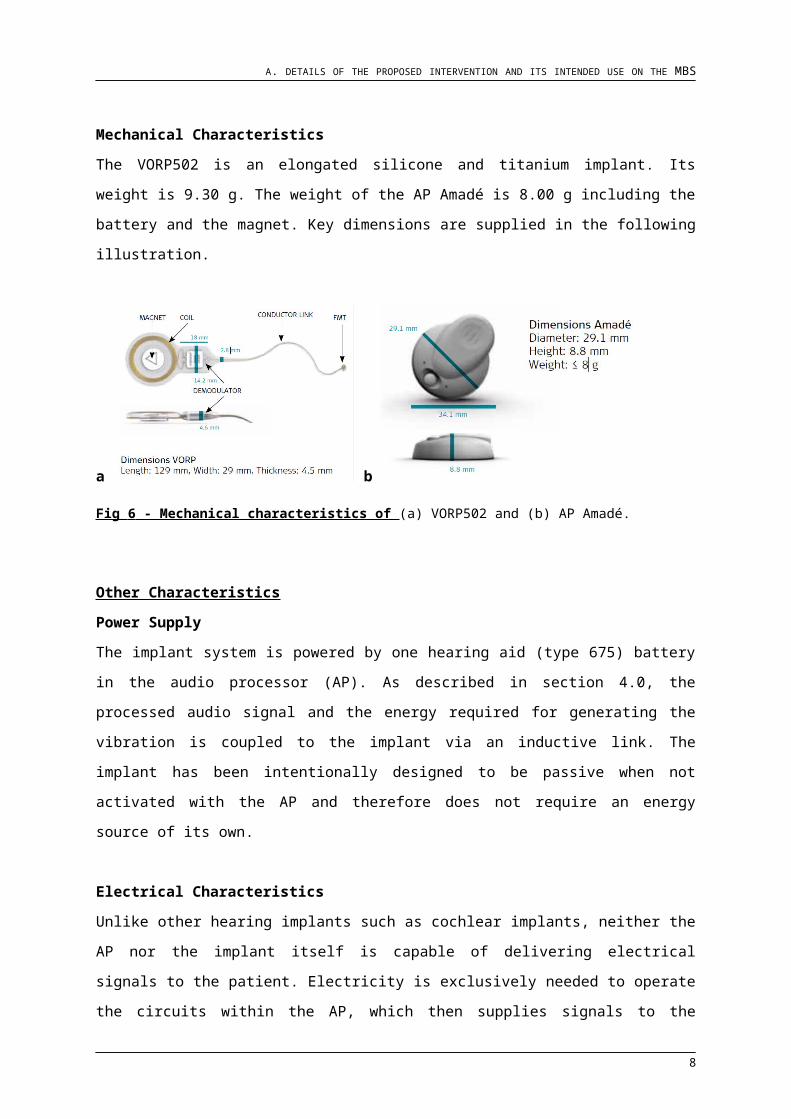
A. DETAILS OF THE PROPOSED INTERVENTION AND ITS INTENDED USE ON THE MBS
Studies of age-specific differences in speech-recognition performance in noise indicate that
there are significant age-related deficits related to high frequency hearing loss (Dubno et al.,
1984). The Beaver Dam Epidemiology of Hearing Loss Study shows significant age effects
in word recognition scores in competing messages for both men and women, with
performance consistently poorer in men than in women at all age groups and hearing loss
categories (Cruickshanks et al., 1998).
In children, even mild hearing loss can impair speech and language development, have
negative effects on academic achievement and impair social and emotional development
(Borg et al., 2007;Moeller et al., 2007;Stevenson et al., 2010). In addition to the immediate
effects on the ability to hear and understand speech, age-related hearing loss and partial
hearing loss can have grave consequences for mental health and overall quality of life.
However, deafness and hearing loss are not typically associated with increased mortality,
and need not be associated with significant morbidity. Furthermore, some people who are
deaf identify with a cultural model of deafness that does not consider deafness to be an
impairment. For hearing-impaired individuals who use sign language as their preferred
language and grow up as members of the 'Deaf Community', deafness may not have a
major impact on quality of life. However, for a child who is born deaf within a hearing family
or for a person who becomes deaf and is accustomed to functioning in a hearing
environment, deafness usually does have a significant impact on quality of life. In children,
deafness typically has significant consequences on linguistic, cognitive, emotional,
educational and social development. In adults, the loss of hearing affects the ability to hear
environmental noises and to understand speech. This, in turn, can affect the ability to take
part in daily activities and engage in the accustomed social and professional networks, thus
leading to isolation and, in some cases, psychological problems (Meinzen-Derr et al.,
2011;Stevenson et al., 2010). In the case of partial hearing loss as described above, patients
can "hear" but they typically cannot understand voices when they are in a "difficult" acoustic
environment; i.e. an environment in which there is background noise. This often leads to
social isolation and may have a number of other negative effects on the quality of life as well
as on psychological and physical well-being.
A recent study of 496 elderly patients (over 85 years) in Linköping, Sweden found that
mental health problems and depression were more likely among patients with hearing loss
who didn't use their hearing aids than among those who used hearing aids regularly (Oberg
et al., 2012). In a representative cohort study of 604 patients in the 60- to 69-year-old age
group of non-institutionalized subjects who underwent both audiometric and cognitive tests,
Lin (Lin et al., 2011) found that greater hearing loss is associated with poorer cognitive
functioning: a 25 dB increase in hearing loss is associated with a reduction in cognitive
performance of 7 years. In a larger prospective study of a cohort of 1985 elderly patients
16
A. DETAILS OF THE PROPOSED INTERVENTION AND ITS INTENDED USE ON THE MBS
(mean age = 77.8 years), hearing loss was found to be independently associated with
accelerated cognitive decline and cognitive impairment (Lin et al., 2011). Other studies have
found that adults with acquired hearing loss report a significantly lower quality of life than
persons with normal hearing (Fellinger et al., 2007;Hallberg et al., 2008). "The literature …
clearly demonstrates that hearing loss is associated with physical, emotional, mental and
social well-being. Depression, anxiety, emotional instability, phobias, withdrawal, isolation,
lessened health status and lessened self-esteem are not “just quality of life” issues. For
many people, uncorrected hearing loss is a serious “life or death” issue." (Kochkin, 2010).
The loss of hearing at adult age also results in the degradation of the peripheral and central
nervous system; including the degeneration of spiral ganglion cells, changes in the
sensitivity of neurons and the reorganization of sound representation (Leake et al.,
1999;Leake et al., 2008). Numerous studies show that the degree of degradation in the
nervous system and other negative effects on the neural system and cognitive ability are
correlated with the duration of deafness or hearing loss (Blamey, 1997;Blamey et al., 2013).
Hearing loss in general has been related to a number of quality of life issues:
lower earning power, especially among persons with severe to profound hearing loss;
strained personal relationships (especially for age-related mild-moderate hearing
loss) and negative dysfunctional communication;
discrimination;
communication problems
behaviors to compensate hearing loss;
increased incidence of depression and depressive symptoms;
reduced emotional stability;
increased anxiety and social phobias;
poorer cognitive functioning;
poorer health status;
societal isolation.
In light of the aging of the population in almost all countries, hearing loss will pose an ever
greater problem at individual level and in a public health framework.
Statistics Canada’s 2006 Participation and Activity Limitation Survey found that hearing
impairment may affect an individual’s education in various ways, including the choice of
educational and training options, the time required to complete courses, and the level of
education attained. One out of five people who reported hearing limitations said that they
had discontinued their education because of their condition. People with severe hearing
difficulties were much more likely than those with mild hearing impairment (43.5% versus
16.8%) to withdraw from school. The survey responses also indicated that hearing difficulties
limited both the type of work and number of hours worked. Many individuals with hearing
17
A. DETAILS OF THE PROPOSED INTERVENTION AND ITS INTENDED USE ON THE MBS
limitations believed that their condition made it more difficult for them to advance in their
career, change jobs, or find work (Brennan et al., 2009). A recent Australian study found an
association between hearing loss and walking ability. The authors speculated that this may
be due to problems with balance caused by hearing problems, together with a fear of falling,
and a decline in physical and social involvement. Limited social interactions may also affect
the cognitive decline associated with hearing loss (Karpa et al., 2010). A systematic review
of health-related quality of life in individuals with sensorineural hearing loss and hearing aids
concluded that most studies which used a disease-specific quality of life measure (i.e.,
specific to hearing loss as opposed to generic health measures) found improved emotional
and social well-being in hearing aid users. However, findings from studies that used generic
quality of life measures varied. Nevertheless, the authors concluded that hearing aids
provide a low-risk, relatively non-invasive treatment that improves quality of life by reducing
“psychological, social and emotional effects of SNHL” (Chisolm et al., 2007). A systematic
review of bone-anchored hearing aids found similar differences in quality of life reported by
studies that used generic versus disease-specific measures (Colquitt et al., 2011).
There are many causes of acquired sensorineural hearing loss after birth. The majority are
listed below:
Meningitis, malaria, cytomegalovirus, or other infections such as mumps,
toxoplasmosis and measles occur. These are particularly common in poor developing
countries.
Iodine deficiency leading to endemic cretinism – one sixth of the world population is
at risk of iodine deficiency; the numbers with related hearing loss are not known.
Noise induced hearing loss (NIHL) due to excessive noise exposure, either social or
industrial. Most developed countries have legislation limiting the noise exposure at
work to no more than 90dB. In recent years, the impact of social noise has become
apparent and studies indicate that young people are losing some high frequency
hearing from loud music in enclosed places such as dance clubs, or when using
personal stereos. Much talk is made about the need to raise awareness of the
problem but very few countries have sufficiently robust legislation to protect the
public.
Ototoxicity is a common cause of hearing loss. It is well known that many powerful
drugs such as some antibiotics, or cytotoxics (anti-cancer drugs) can damage the
hearing with some people being more susceptible than others. However, in life
threatening conditions hearing loss may be a lesser consideration.
Presbyacusis is the hearing impairment caused by aging of hair cells in the cochlea.
There is no direct cause and there is no specific treatment apart from hearing
18
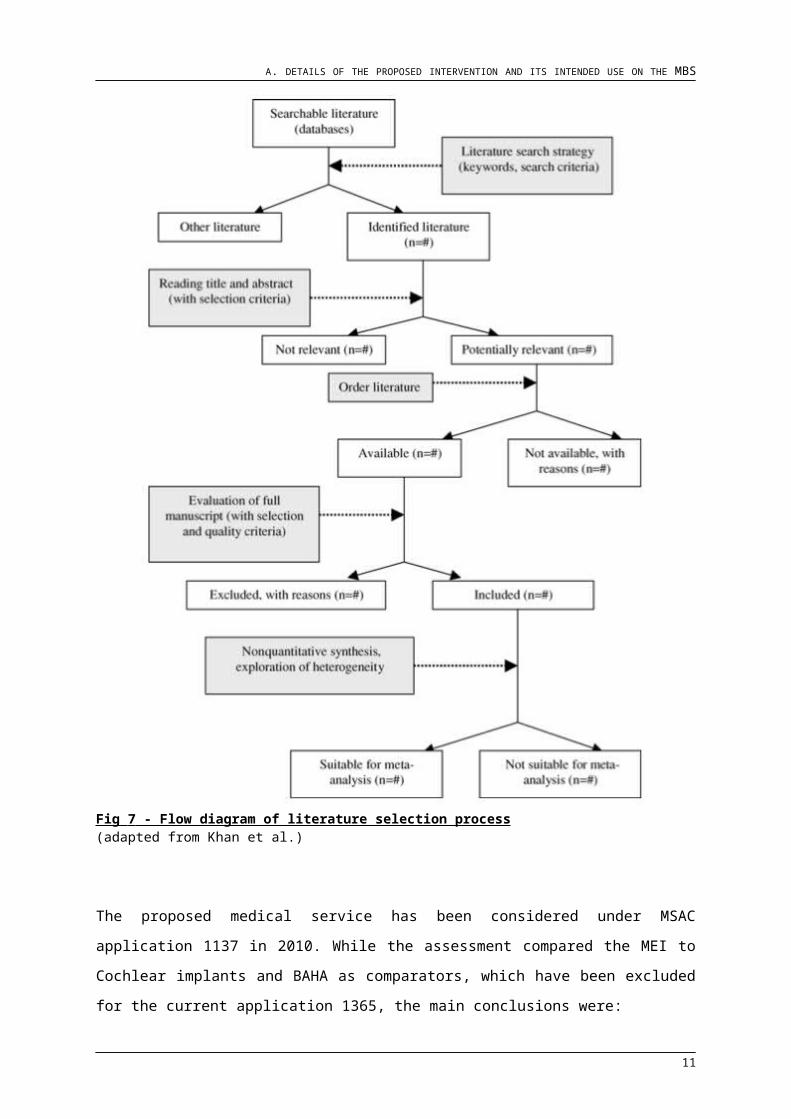
A. DETAILS OF THE PROPOSED INTERVENTION AND ITS INTENDED USE ON THE MBS
rehabilitation. Since the world population is aging, more and more adults are
affected.
Sudden hearing loss, sporadic occurrence often idiopathic.
A recent systematic review estimated that 30% of European men, and 20% of
European women over the age of 70, had age-related hearing loss (of 30 dB HL or
more in their better ear), and by the age of 80, this increased to 55% of men and
45% of women (Roth et al., 2011). In the US, one study found a prevalence rate of
hearing loss (of 25 dB HL or more) of 63% in US adults over the age of 70 (Lin et al.,
2011). Inconsistencies in the definitions of hearing loss, ear (better ear or worse ear)
in which the hearing level is measured, and the age ranges used to distinguish age-
related hearing loss exist across the few available studies on adult onset hearing
loss, making it difficult to determine the prevalence of hearing loss more precisely
(Lin et al., 2011).
In children, the prevalence of sensorineural hearing loss (>40dB) is estimated to be 1
in 1,000 live births (Carney and Moeller, 1998). Children seem to be developing
noise-induced hearing loss at increasing rates, possibly due to the use of musical
instruments, audio equipment, fireworks, toy guns and telephones.
Middle ear implants are significantly more expensive than external hearing aids and
involve a technically difficult surgical procedure – as a result they may not appeal to
many patients (Shohet et al., 2011).
A.2.3. Existing arrangements
Individuals are identified through audiometric testing to identify mild to severe sensorineural
hearing loss with a PTA4 below 80 dB HL, unaided speech recognition above 65%, and the
presence of an outer ear pathology. Outer ear pathologies are treated conservatively by an
ENT doctor, even though the results may not always be successful. Patients with
sensorineural hearing loss are usually treated by conventional HAs, or by a cochlear implant
when amplification is insufficient.
The patient population being proposed in this application consists of individuals who have
moderate to severe sensorineural hearing loss and a medical condition precluding the use of
conventional hearing aids. These patients need to be aided, but their hearing is not at a level
which requires a cochlear implant.
Also, bone conduction implants are not indicated for this degree and type of hearing loss.
Therefore an active middle ear implant represents their only alternative for restoring hearing.
Without public funding, these patients who would be respective AMEI candidates are
currently left untreated.
19
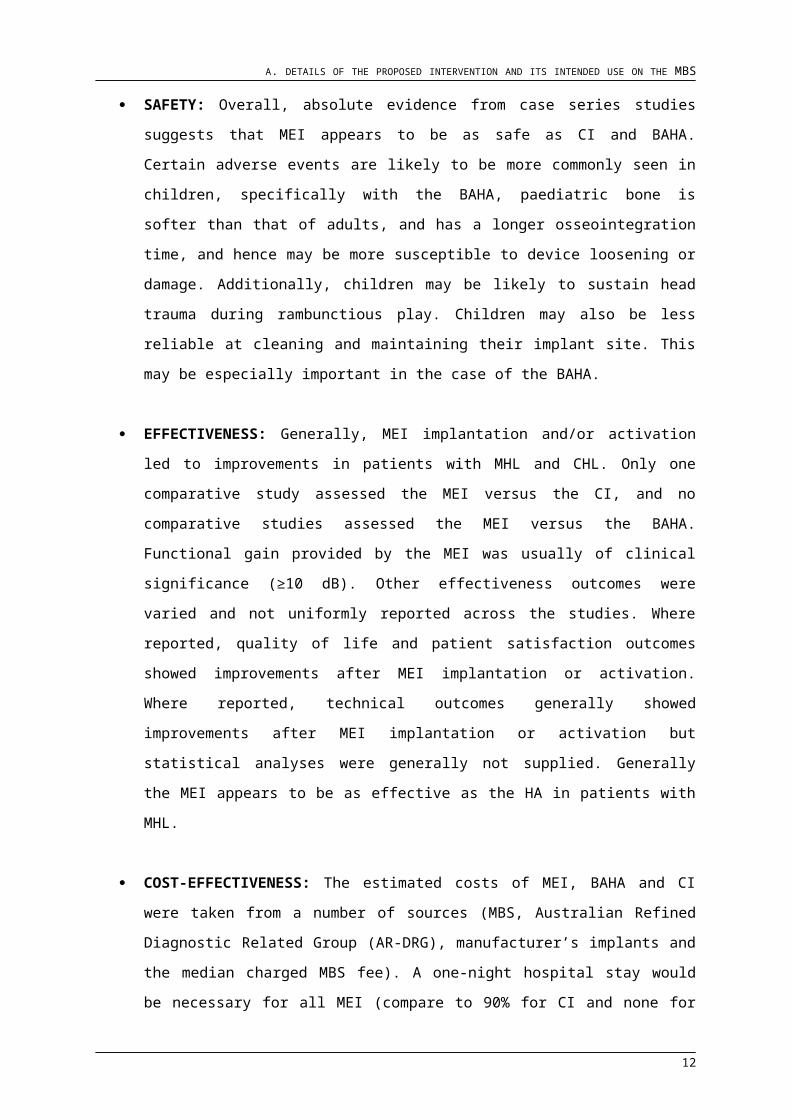
A. DETAILS OF THE PROPOSED INTERVENTION AND ITS INTENDED USE ON THE MBS
Otherwise the MEI treatment option is either self-funded or funded through exgratia private
health funding.
Other devices as the Vibrant Soundbridge, classified as an active middle ear implant
indicated for sensorineural hearing loss are the Esteem (Envoy) and Carina (Otologics) and
are fully implantable hearing implants and as such excluded from this application. All of the
device systems are on the Australian Register of Therapeutic Goods (ARTG). All of these
devices have received CE Mark approval as well as United States Food and Drug
Administration (FDA) approval, but for none of the systems a MBS item descriptor has been
assigned yet.
Relevant existing MBS item that the proposed medical service would most closely resemble
in terms of complexity and time:
Category [3 ] – [Therapeutic Procedures]
MBS 41554 MASTOIDECTOMY, intact wall technique, with myringoplasty and ossicular
chain reconstruction
(Anaes.) (Assist.)
Fee: $1,876.95 Benefit: 75% = $1,407.75
A.2.4 Market approval status of Vibrant Soundbridge
The VSB System is a long-standing technology: in 1998, the VSB was approved for mild to
severe sensorineural hearing loss in the European Union and markets accepting the CE
mark. The respective clinical data were collected in the course of two multicenter studies,
one performed in the United States of America (Luetje et al., 2002), the other one performed
in Europe (Fisch et al., 2001;Snik et al., 2001). Subsequent to the VSB-approval for patients
younger than 18 years of age in the European Union and all other countries accepting the
CE marking in 2009. As of November 2008, the VSB has been implanted in more than 60
children and adolescents in countries throughout the world with favourable results (Cremers
et al., 2010;Mandala et al., 2011;Sia, 2012).
A.2.5 Reimbursement status of middle ear implants
The insertion of an active middle ear implant (AMEI) by any method is not reimbursed on the
MBS and the device is not listed on the Prosthesis List (PL). AMEI’s however are currently
registered under the Australian Register of Therapeutic Goods (ARTG) and the implantation
procedure is performed in public and private hospitals throughout Australia and may be
funded by public hospital surgical budgets, private health fund ex-gratia payments and
20
A. DETAILS OF THE PROPOSED INTERVENTION AND ITS INTENDED USE ON THE MBS
occasionally is self-funded by patients.
Table 5 - MEI components listed on the ARTG
ARTG No Product Indication
170179
Amade audio processor - Middle ear implant system sound
processor
The Amade audio processor is an external part of the Vibrant Soundbridge system. The Vibrant Soundbridge system is indicated for use in patients who have mild to severe hearing impairment and cannot achieve success or adequate benefit from traditional therapy.
161702
Vibrating Ossicular Prosthesis (VORP) 502X - Hearing aid, middle ear implant.
For use in adults, adolescents and children who have mild to severe hearing impairment and cannot achieve success or adequate benefit from traditional therapy. For sensorineural HL, the VORP is crimped to the long process of the incus to directly drive the ossicular chain.
185533
Vibroplasty Coupler -Hearing aid, middle
ear implant.
The Vibroplasty Couplers are intended to be used in combination with the Vibrant Soundbridge to facilitate the coupling between the FMT and a Vibratory Structure of the middle ear. The prosthesis type is chosen on the basis of the ossicular remnants once all primary disease has been removed from the middle ear.
A.2.6 Proposed listing of partially implantable active middle ear implants
Rationale for the proposed listingAdult onset hearing loss ranked eighth in the 20 leading specific causes of burden of disease
and injury in Australia in 2003. This burden of disease is calculated using an estimate of
years of healthy life lost due to disability caused by disease and is measured in Disease
Adjusted Life Years (DALYs). One DALY represents the loss of the equivalent of one year of
full health. Using DALYs, the burden of diseases that cause early death but little disability
(e.g. drowning or measles) can be compared to that of diseases that do not cause death but
do cause disability (e.g. cataract causing blindness). In 2003, Adult onset hearing loss
contributed to 64,853 DALYs, equating to 2.5% of the total DALYs for Australia that year. For
2005, Access Economics reported an estimated 95,005 DALYs were lost due to hearing
loss, representing 3.8% of the total burden of disease from all causes of disability and
premature death (WHO report; Global Burden of Disease:DALYs, Part 4 (2004).
Prevalence of hearing loss in the better ear (Hearing thresholds ≥ 25 dB) in Australia was
reported in a study of Wilson et al (Wilson et al., 1999) to be on the overall population
22.2%. Treatment options for sensorineural hearing loss involve amplifying the incoming
sound through a range of conservative management therapies including hearing aids.
However, when patients also have a medical condition in their outer ear they are unable to
wear hearing aids - HA use has been proven to exacerbate their conditions. Current
treatment options for such patients include no treatment or treatment with an active middle
21
A. DETAILS OF THE PROPOSED INTERVENTION AND ITS INTENDED USE ON THE MBS
ear implant.
The only partially implantable active middle ear implant that offers management for the
target population is the Vibrant Soundbridge.
Proposed MBS listing(s)
The details of the MBS listing agreed by PASC are as follows:
Proposed MBS item descriptor for partially implantable MIDDLE EAR IMPLANT, Insertion of, including a mastoidectomy
Category 3 – Therapeutic Procedures
MBS [item number]
partially implantable MIDDLE EAR IMPLANT, insertion of, including mastoidectomy, for
patients with:
sensorineural hearing loss that is stable, bilateral and symmetrical; and
air conduction thresholds in the mild to severe range with PTA4 below 80 dB HL; and
have speech perception discrimination of ≧65% correct with appropriately amplified
sound; and
cannot wear conventional hearing aid because of outer ear pathology; and
no history of inner ear disorders such as Meniere’s syndrome
a normal middle ear (no history of middle ear surgery or of post-adolescent, chronic
middle ear infections; and normal tympanometry; and on audiometry the air-bone gap is ≦10 dBHL at two or more of the following frequencies: 0.5, 1, 2 and 4 kHz).
Fee: $1,876.59 (based on mastoidectomy item).
(Anaes)
A.3 Intervention details
A.3.1 Clinical management pre-intervention
Individuals suspected of having a hearing loss are referred for a full audiometric evaluation
of their hearing. This evaluation consists of pure tone audiometry and speech testing. Pure
tone audiometry is divided into air conduction and bone conduction testing where the first
indicates the sensitivity of the entire hearing system, and the latter indicates the sensitivity of
the inner ear only. Thresholds of audibility, also named hearing thresholds, are determined
at frequencies from 250 to 8000 Hz which is the range of sound that the human ear is most
sensitive to. Normal hearing is represented by air and bone conduction thresholds below
25 dB. Anything greater than 25 dB HL represents various levels of hearing loss.
Sensorineural hearing loss is indicated by equal air and bone conduction thresholds above
22

A. DETAILS OF THE PROPOSED INTERVENTION AND ITS INTENDED USE ON THE MBS
25 dB, and means that the outer hair cells of the cochlea are damaged. Speech testing is
carried out to support the audiological results in determining treatment options for hearing
loss.
Treatment options for sensorineural hearing loss involve amplifying the incoming sound
through a range of conservative management therapies including hearing aids. However,
when patients also have a medical condition in their outer ear they are unable to wear
hearing aids. Hearing aid use has been proven to exacerbate their conditions. Current
treatment options for such patients include no treatment or treatment with an active middle
ear implant. The only active MEI currently available and indicated for this population is the
Vibrant Soundbridge.
Indications for other active middle ear implantsCurrently, there are three active middle ear implants: Esteem and the Carina are both
indicated for adults who have:
Stable bilateral moderate to severe sensorineural hearing loss
Unaided speech discrimination tests score greater than or equal to 40%
Normal middle ear function and anatomy
Minimum 30 days of experience with appropriately fit hearing aids
Both of these devices are contraindicated in patients who present with chronic outer, middle
or inner ear pathologies.
These criteria represent a population who could alternatively be treated by conventional
HAs, or by a cochlear implant when amplification is insufficient. The only active middle ear
implant that offers management for the target population is the Vibrant Soundbridge.
Indications for the Vibrant Soundbridge: Pure-tone air-conduction threshold levels at or within the levels listed below in Table
1 .Pure-tone air-conduction thresholds for both ears within 20 dB HL of each other at
frequencies 0.5 to 4 kHz Air-bone gap at 0.5, 1, 2 and 4 kHz no greater than 10 dB
HL at two or more of these frequencies.
Normal tympanometry.
No previous middle ear surgery.
The patient shall have no history of post-adolescent, chronic middle ear infections or
inner ear disorders such as vertigo or Meniere’s syndrome.
Speech audiometry curve adequate to the respective PTA. Speech understanding
>65% (at 65dB SPL) for word lists with amplification or at most comfortable level
under earphones.
Unable to wear or benefit from a conventional hearing aid for medical reasons.
23
A. DETAILS OF THE PROPOSED INTERVENTION AND ITS INTENDED USE ON THE MBS
The ear selected for implantation of the VSB shall be equal to or worse than the un-
implanted ear.
Table 6 - Air conduction threshold levels for SNHL indication (CE marked countries)
Frequency (kHz) 0.5 1 1.5 2 3 4
Lower Limit (dB HL) 10 10 10 15 25 40
Upper Limit (dB HL) 65 75 80 80 85 85
Vibrant Soundbridge candidates cannot use conventional hearing aids for a variety of
medical reasons. These may include but are not limited to conditions such as chronic otitis
externa, psoriasis, exostosis of the ear canal, persistent excessive cerumen blocking the ear
canal, absent or deformed pinnas following skin cancer, unusual morphology affecting the
ear canal or pinna that prevent the use of conventional hearing aids.
A.3.2 Clinical management intervention
The only partially implantable active middle ear implant indicated for sensorineural hearing
loss plus medical condition is the Vibrant Soundbridge. This hearing implant system
comprises of two components:
An internal component that includes a magnet, an electronics housing, and a transducer;
and an external audio processor containing a power source (battery), microphone and digital
signal processor. The signal from the audio processor is transmitted to the internal
component and transformed into vibrations. The transducer which is called the Floating
Mass Transducer (FMT) is crimped or otherwise attached to the long process of the incus at
a single point and mechanically drives the ossicular chain. The amplified vibrations can be
adjusted via an external auditory processor (AP) to suit different degrees of hearing losses.
Battery life of the AP is 6 days. Patients can place new batteries in or charge their existing
batteries.
Implantation of the proposed Vibrant Soundbridge for SNHL + medical condition is carried
out by an otolaryngologist (ENT surgeon) under general anaesthesia on an outpatient or
inpatient basis. The surgical procedure lasts 1.5 to 2 hours after preparing the patient. This
involves administering anaesthetics and intravenous antibiotics 30 minutes before surgery,
marking the incision site and shaving the hair over the expected incision site. The surgery
involves the following steps:
24

A. DETAILS OF THE PROPOSED INTERVENTION AND ITS INTENDED USE ON THE MBS
Creating the incision behind the ear in a posterior-superior direction
Performing a full or partial mastoidectomy via the facial recess route or the
transmeatal route (depends on the medical status of the patient`s ear and on the
surgeon`s preferences)
Drilling a bone bed and tie-down holes for placing the implant, the transition to the
FMT and the demodulator
Accessing and visualising the middle ear by either posterior tympanotomy through
the facial recess, or by lifting the tympanomeatal flap of the outer ear canal (depends
on surgical approach used)
Fixing the implant, transition and the demodulator into the previously drilled bone
bed
Placing/crimping the FMT on to the long process of the incus
Placing the excess conductor link in the excavated mastoid
Closing the wound
6 to 8 weeks after surgery the patient is fitted with the audio processor (AP) and initial
programming is carried out. The patient is followed-up on a regular basis and the AP is re-
programmed when necessary.
A.3.3 Clinical management post-intervention
Post-Implantation of the Vibrant SoundbridgeActivation of audio Processor (AP) and Follow-up Fittings with audiologists take place
approximately eight weeks after implantation of the AMEI. The AP fitting is performed using
the VIBRANT MED-EL SYMFIT 6.0 software and off-the-shelf hearing instrument fitting
software, CONNEXX 6.4 (Siemens) or higher version. The fitting software products are used
in conjunction with an off-the-shelf hearing aid interface modem, Hi-Pro Box or the Noah
Link (GN Otometrics) and a Personal Computer. The VIBRANT MED-EL SYMFIT 6.0
software provides a parameter database, which enables the audio Processor to be
programed with the CONNEXX software. The programming process is performed by a
trained hearing professional (audiologist) and typically takes about 30 minutes. The workflow
during the activation visit is as follows: The patient’s audiogram is entered in the CONNEXX
software.
CONNEXX uses the air conduction thresholds to propose a “first fit” based on the
DSL I/O gain prescription rule (Select the appropriate acclimatization level 1 to 4;
25
A. DETAILS OF THE PROPOSED INTERVENTION AND ITS INTENDED USE ON THE MBS
based on the level of experience with hearing aids).
The audiologist has the opportunity to fine-tune the settings (frequency response and
dynamic range compression) and enable features to enhance listening comfort (e.g.,
wind noise reduction), keeping in mind that it may be too early to obtain objective
measurements as the healing may not be complete.
All follow up visits (FU) are referred to the activation visit and take place at 1, 6 and 12
months post activation.
One month post activation aims to optimize the first fitting and to achieve quick information
about the audiological benefit from the devices:
AC and BC pure tone audiometry to control the hearing thresholds
Optimization of the fitting
Warble tone thresholds in sound field in unaided and aided conditions at 500, 750,
1000, 1500, 2000, 3000, 4000, 6000, and 8000 Hz. If necessary, the contralateral ear
has to be masked (not plugged; to avoid the occlusion effect) by using a second
loudspeaker.
Six months post activation AC and BC pure tone audiometry
Warble tone thresholds in sound field in unaided and aided conditions at 500, 750,
1000, 1500, 2000, 3000, 4000, 6000, and 8000 Hz. Free field masking if necessary
Unaided/ aided speech perception in quiet: SRT for 50% speech understanding and
WRS in sound field. If required, the contralateral ear is masked, using a free field
speech noise.
Unaided/ aided speech in noise: to find out the signal-to-noise ratio where 50% of the
presented test material is understood (SNR50) in unaided vs. aided condition. The
measurement is performed at 1 meter away in front of the subject (S0N0)
Optimization of fitting: only if necessary
Twelve months post activation AC and BC pure tone Audiometry
Warble tone thresholds in sound field in unaided and aided condition at 500, 750,
1000, 1500, 2000, 3000, 4000, 6000, and 8000 Hz. Free field masking if necessary
speech audiometry with headphones
26
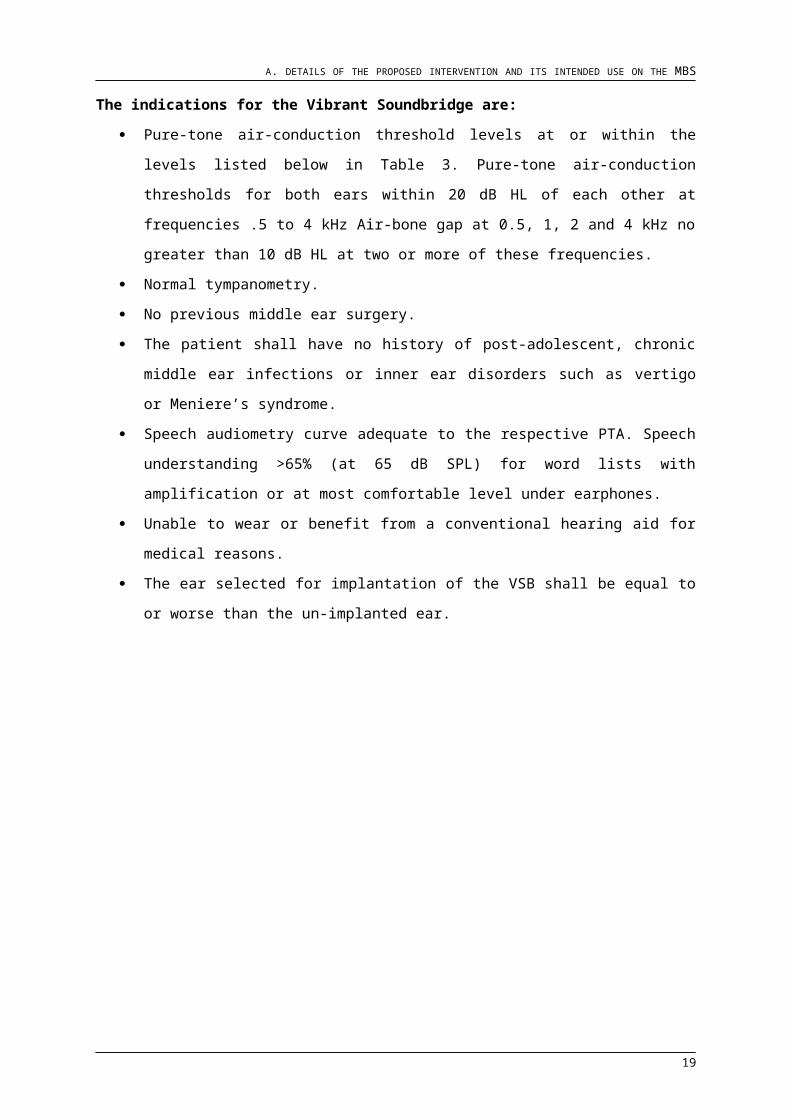
A. DETAILS OF THE PROPOSED INTERVENTION AND ITS INTENDED USE ON THE MBS
A.4 Main comparator
PASC agreed in the latest “1365 Ratified meeting outcomes from the August 2014 PASC
meeting” protocol, that the comparator is no treatment for the proposed subgroup of patients
with SNHL. PASC advised that eligible partially implantable active middle ear implants
should also be compared with each other in order to assess whether they achieve similar
safety and clinical effectiveness outcomes.
To our opinion, the only partially implantable, active middle ear implant that offers
management for the target population is the Vibrant Soundbridge, but for the sake of
completeness and to compile a generic assessment of the evidence for the medical service
associated with Middle Ear Implants we extended our evaluation to the following
comparators: partially implanted middle ear implant, (Maxum, Ototronix/Soundtec) as well as
fully implantable middle ear devices such as Carina (Otologics LLC) and Esteem (Envoy
Medical).
Furthermore, we do feel the need to point out that, although having included the Maxum
system in this assessment report, the device set-up is a contraindication to our intended
treatment group. This is based on the fact that the Maxum system is placing the sound
processor in the ear canal. As stated by the company itself the system comprises of an
‘External component: a deep insertion, completely-in-the-canal, open-fit, electromagnetic
sound processor (IPC) that is worn in the external auditory canal, similar to a conventional
hearing aid’.
The Vibrant Soundbridge is for Patients with stable, sensorineural hearing loss with an
outer ear pathology that prevents the wearing of a hearing aid and who have:
PTA4 below 80 dB HL with one of the following air conduction thresholds:
mild hearing loss - 25 dB ≤ BEHL0.5-4kHz < 40 dB; or
moderate hearing loss - 40 dB ≤ BEHL0.5–4 kHz < 70 dB; or
severe hearing loss - 70 dB ≤ BEHL0.5–4 kHz < 95 dB; and
speech perception discrimination of ≧65% correct with appropriately amplified
sound; and
bilateral, symmetrical hearing loss with PTA thresholds in both ears within 20 dBHL0.5-
4 kHz of each other; and
a normal middle ear (no history of middle ear surgery or of post-adolescent, chronic
middle ear infections); and
normal tympanometry;
on audiometry, the air-bone gap is ≦10 dBHL0.5-4 kHz at two or more frequencies.
no history of other inner ear disorders such as Meniere’s disease.
27
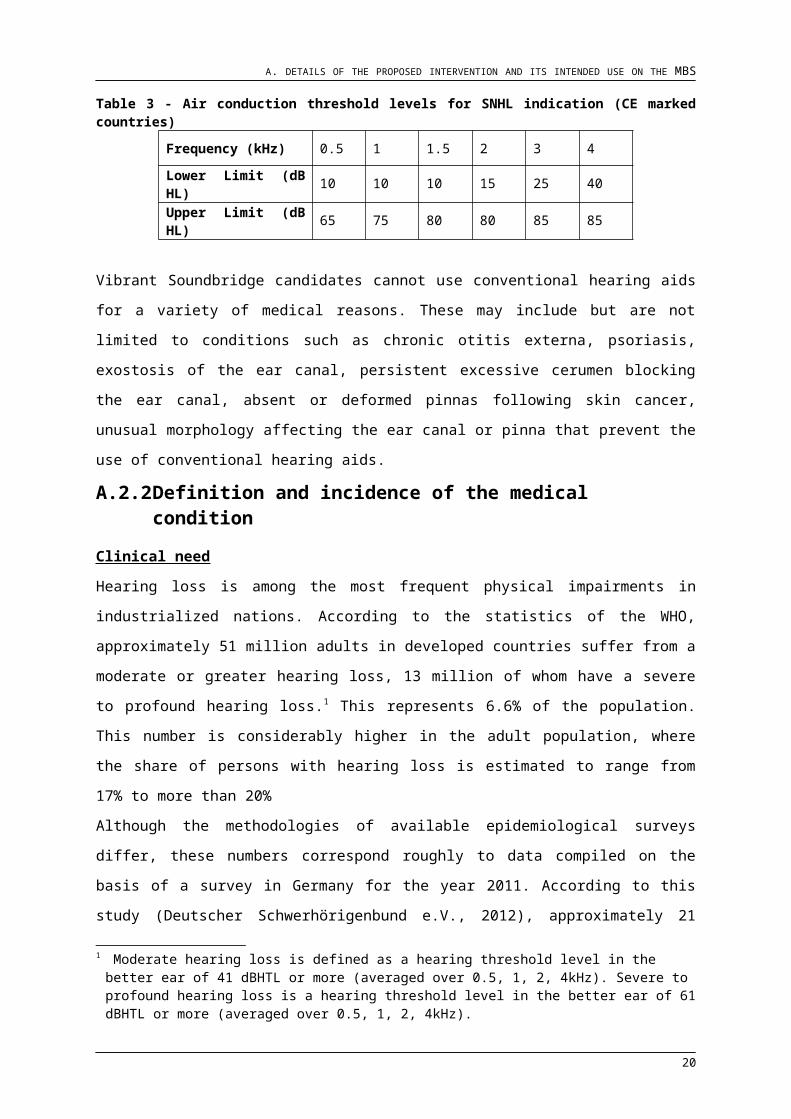
A. DETAILS OF THE PROPOSED INTERVENTION AND ITS INTENDED USE ON THE MBS
Patient Contraindications:
A patient is known to be intolerant of the materials used in the implant (medical grade
silicone elastomer, medical grade epoxy and titanium).
A patient with retrocochlear, or central auditory disorders.
A patient with nonresponsive active ear infection and/or chronic fluid in or about the
ear.
A patient whose hearing loss has demonstrated an improving and decreasing
fluctuation over a two year period of 15 dB in either direction.
A patient with any physical, psychological, or emotional disorder that would interfere
with surgery or the ability to perform on test and rehabilitation procedures.
A patient with a skin or scalp condition that may preclude attachment of the Audio
Processor with a magnet.
28
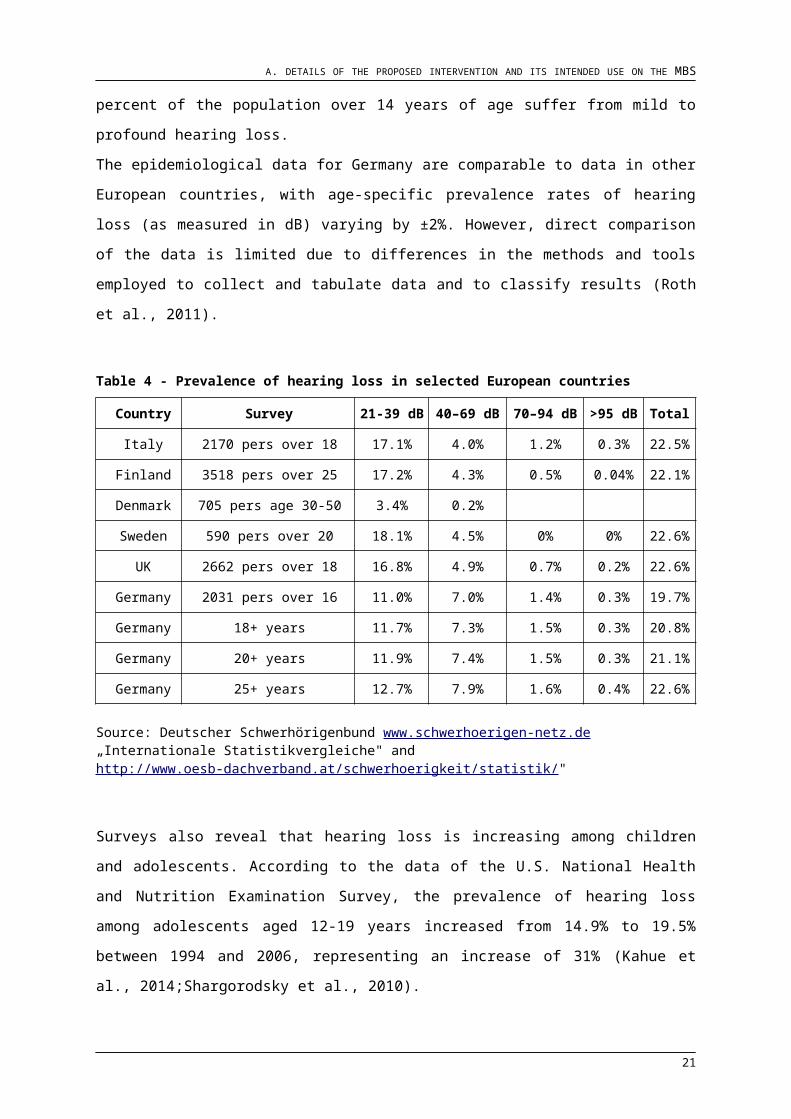
A. DETAILS OF THE PROPOSED INTERVENTION AND ITS INTENDED USE ON THE MBS
Table 7 - Summary of indications and contraindications for the Vibrant Soundbridge
Targets of the proposed medical service
Excluded medical services within AMEI criteria
Excluded medical services beyond AMEI criteria
Population
Individuals who have: Individuals who have: Individuals who have:• mild to moderate sensorineural hearing loss • up to severe sensorineural hearing loss • severe to profound sensorineural hearing
loss• stable bilateral symmetrical hearing loss
• stable unilateral or bilateral symmetrical hearing loss
• stable unilateral or bilateral, symmetrical or asymmetrical hearing loss
• a medical condition in the outer ear and a normal middle ear • normal outer and middle ear • normal outer and middle ear for CI; normal or
pathological outer or middle ears for BCI
• unable to wear or benefit from HAs due to medical reasons
• previously used HAs but received no or limited benefit
• previously used HAs but received no or limited benefit
• no previous middle ear surgery • no history of otitis externa or eczema for the outer ear canal • no previous middle ear surgery
• no history of post-adolescent, chronic middle ear infections or inner ear disorders such as vertigo or Meniere’s syndrome.
• no history of post-adolescent, chronic middle ear infections or inner ear disorders such as vertigo or Meniere’s syndrome.
• no history of post-adolescent, chronic middle ear infections or retrocochlear disorders
• unaided speech recognition above 65%
• unaided speech recognition above 40 dB for AMEI • unaided speech recognition below 65%
Intervention AMEI Hearing aids, AMEI CI, BCIComparator(s) No treatment - -
Outcomes affected
Hearing thresholds, speech perception in quiet and noise, sound localisation, quality of life and other subjective benefits
Hearing thresholds, speech perception in quiet and noise, sound localisation, quality of life and other subjective benefits
Hearing thresholds, speech perception in quiet and noise, sound localisation, quality of life and other subjective benefits
29

A. DETAILS OF THE PROPOSED INTERVENTION AND ITS INTENDED USE ON THE MBS
The only other partially implantable middle ear devise is the Maxum Systems, Ototronix/Soundtec
Manufactured by Ototronix®, LLC, Houston, TX
Based on original SoundTec™ technology and FDA approved
The Maxum system uses a rare-earth magnet implanted on the middle ear bones, and a
sound processor worn in the ear canal. The minimally invasive implant procedure can be
performed in a procedure room or outpatient clinic under a local anaesthetic. The sound
processor sends electric signals to a transceiver coil and these signals are transferred by
electromagnetic energy across the eardrum to the MAXUM implant which causes the
ossicles to vibrate, thereby directly stimulating the cochlea (inner ear).
Patient Indications:
For use in adults, 18 years of age or older,
Present with a moderate to severe sensorineural hearing loss
unaided word recognition score of 60% or greater
Desire an alternative to an acoustic hearing aid.
Experience with appropriately fit hearing aids.
Patient Contraindications:
For subjects who have conductive hearing loss,
Retrocochlear or central auditory disorder,
Active middle ear infections,
Tympanic membrane perforations associated with recurrent middle ear infections,
Disabling tinnitus.
Other, but fully implantable active middle ear implants are the Esteem and the Carina
system, both are indicated for adults who have:
Stable bilateral moderate to severe sensorineural hearing loss
Unaided speech discrimination tests score greater than or equal to 40%
Normal middle ear function and anatomy
Minimum 30 days of experience with appropriately fit hearing aids
Both of these devices are contraindicated in patients who present with chronic outer, middle
or inner ear pathologies. These criteria represent a population who could alternatively be
treated by conventional HAs, or by a cochlear implant when amplification is insufficient. MEI
implants are an important option for a small group of patients who cannot wear conventional
hearing aids or other prosthesis for medical reasons.
30
A. DETAILS OF THE PROPOSED INTERVENTION AND ITS INTENDED USE ON THE MBS
Table 8 - Summary of research questions that the assessment will investigate
Population Intervention Comparator Outcomes to be assessed
Patients with stable, sensorineural hearing loss with an outer ear pathology that prevents the wearing of a hearing aid and who have:• a PTA4 below 80 dBHL with one of the
following air conduction thresholds:- mild HL - 25 dB ≤ BEHL0.5-4kHz < 40 dB; or- moderate HL - 40 dB ≤ BEHL0.5–4 kHz < 70 dB; or- severe HL - 70 dB ≤ BEHL0.5–4 kHz < 95 dB; AND
• have speech perception discrimination of ≧65% correct with appropriately amplified sound; and
• bilateral, symmetrical SNHL with PTA thresholds in both ears within 20 dBHL0.5-
4kHz of each other; and• a normal middle ear (no history of middle
ear surgery or of post-adolescent, chronic middle ear infections); and
• normal tympanometry; and• on audiometry the air-bone gap is ≦10
dBHL0.5-4kHz at two or more frequencies); and
• no history of other inner ear disorders such as Meniere’s disease.
Middle ear implant
No treatment
Effectiveness outcomes:- Abbreviated Profile of Hearing Aid Benefit- Client-orientated scale of improvement- Functional gain- Speech recognition- Sound-field assessment- Speech comprehension scores- Self-assessment scales- Patient preference
Safety outcomes:- Complications- Adverse events- Infection rates- Taste disturbance- Fibrosis- Aural fullness- Acoustic trauma- Dizziness- Damage to the middle ear- Revision surgery- Explant rate- Device failure- Mortality
Clinical Questions
1. In patients with outer ear pathology that prevents use of a conventional hearing aid, who have mild, moderate or severe SNHL that is stable, bilateral and symmetrical and who meet all other criteria set out in Table 7, is the MEI more effective compared to no treatment?
2. In patients with outer ear pathology the prevents use of a conventional hearing aid, who have mild, moderate or severe SNHL that is stable, bilateral and symmetrical and who meet all other criteria set out in Table 7, is the middle ear implant as safe as no treatment?
In terms of overall clinical claims for the proposed medical service against its main
comparator presenting consequences for health outcomes VSB compared to no treatment,
the following can be summarised:
Bone conduction thresholds after VSB implantation are no worse than before. The
mean change in thresholds is 1-3 dB which is clinically non-significant.
Air conduction hearing thresholds are superior with the VSB. The functional gain with
the VSB ranges from 12,5 dB HL to 33 dB HL.
VSB is superior in terms of speech understanding, especially in noisy indications.
Compared to no treatment the VSB provides 30 to 50% improvement, depending on
the test used and the presentation level.
Long-term postoperative patient satisfaction and quality of life results are superior to
31
A. DETAILS OF THE PROPOSED INTERVENTION AND ITS INTENDED USE ON THE MBS
no treatment.
In the previous MSAC assessment (application 1137, Conductive, Mixed and Sensorineural
Hearing Loss) CI (item 41617) and BCI (items 41603 and 41604 – osseo-integration
procedures) were used as comparators. However, the intended population hearing is not at
a level which requires a cochlear implant and is out of criteria of the BCI treatment range
(Ref.: Cochlear website: BAHA not indicated for pure SNHL). Thus the population intended
for MEI would otherwise be left untreated. In contrast to cochlear implants, an active middle
ear implant is not inserted into the inner ear. Instead, the direct drive amplification process
maximizes the potential of an individual's residual cochlear function via the middle ear.
Unlike bone conduction hearing implants (where sound is routed to the cochlear with the
best cochlear reserve), an active middle ear implant can improve the hearing in the
implanted ear thus providing true binaural hearing. Binaural hearing is essential to optimize
hearing potential and develop auditory skills such as sound localization, hearing in
background noise and spatial awareness.
MSAC’s Recommendation in 2010 for 1137 after considering the then in force compiled
evidence was that MEI was for people who could not tolerate occlusion of the ear canal. It
was agreed on that patients may opt for the MEI out of convenience. It was concluded that,
substituting the MEI for the BCI and CI services would lead to an overall cost saving. MSAC
agreed that the MEI was more expensive than the BCI, but less expensive than the CI.
MSAC furthermore concluded that substituting the MEI for the CI would lead to a cost saving
but the outcome may be less effective; and that the MEI for the BCI would lead to a cost
increase but with no increase in effectiveness.
32
A. DETAILS OF THE PROPOSED INTERVENTION AND ITS INTENDED USE ON THE MBS
A.5 Clinical management algorithm
The proposed medical service is highlighted presenting the only treatment option for the
target population.
These individuals are identified through audiometric testing to identify mild to severe
sensorineural hearing loss with a PTA4 below 80 dB HL, unaided speech recognition above
65%, and the presence of an outer ear pathology. Outer ear pathologies are treated
conservatively by an ENT doctor, even though the results may not always be successful. As
a result the respective AMEI, the Vibrant Soundbridge, is provided. When conservative
treatment is successful it can be followed by a Hearing Aid trial which may exacerbate the
previous ear pathology, leading again to the treatment options of the respective AMEI or no
treatment. Hearing aids may not provide sufficient benefit for all patients, who could then
receive an AMEI for pure moderate to severe sensorineural hearing loss or have to be left
untreated.
Without public funding, these patients who would be respective AMEI candidates are
currently left untreated. Otherwise the MEI treatment option is either self-funded or funded
through exgratia private health funding.
33

A. DETAILS OF THE PROPOSED INTERVENTION AND ITS INTENDED USE ON THE MBS
Fig 8 - Clinical Management Algorithm
A.6 Differences between the proposed intervention and main comparator
As the only comparator is NO TREATMENT this section is not applicable.
34
B. SYSTEMATIC EVALUATION OF THE EVIDENCE FOR THE PROPOSED MEDICAL DEVICE
B. Systematic evaluation of the evidence for the proposed medical device
A systematic review of the literature was carried out to evaluate the following questions;
1. In patients with outer ear pathology preventing the use of a conventional hearing aid,
who have mild, moderate or severe SNHL that is stable, bilateral and symmetrical and
who meet all other indication criteria, is the MEI more effective compared to no treatment?
2. In patients with outer ear pathology preventing the use of a conventional hearing aid,
who have mild, moderate or severe SNHL that is stable, bilateral and symmetrical and
who meet all other indication criteria, is the middle ear implant as safe as no treatment?
Other middle ear implant systems that are FDA approved or CE marked for patients with
moderate or severe SNHL that is stable, bilateral and symmetrical and who meet all other
relevant indication criteria, were included in the review to provide a better picture of the
performance of the proposed medical service.
B.1 Description of the search strategy
A structured search strategy was developed (Table 9) to search several online databases
to identify studies published before the study inception date of 17.09.2014. The databases
searched included Pubmed and OVIDSP (MEDLINE); Embase, BIOSIS Previews,
Deutsche Arzteblatt and SciSearch from the German Institute of Medical Documentation
and Information (DIMDI); the Cochrane Library, and The Centre of Reviews and
Dissemination (CRD) database. The search was extended to full texts of articles and
included papers published in English or German; and excluded studies published before
1996. The list of study titles was supplemented with potentially relevant publications
already known by the research team; and the bibliographic references of reviews were
searched to locate additional relevant materials.
35
B. SYSTEMATIC EVALUATION OF THE EVIDENCE FOR THE PROPOSED MEDICAL DEVICE
Table 9 - Search strategy for identifying studies on middle ear implants in treating sensorineural hearing loss
Search term
1 Soundbridge.tw
2 floating mass transducer.tw
3 middle ear implant
4 implantable hearing aid
5 implantable hearing device
6 1 or 2 or 3 or 4 or 5
7 6 AND hearing loss, sensorineural[MeSH Terms]
B.2 Listing of included non-randomised studies
The citations identified by the literature search were evaluated against the PICOS criteria
detailed below. Unrelated citations were removed and the full texts of the remaining were
obtained for further screening. Studies were excluded if they still did not fulfil the eligibility
criteria, or if the study design or reporting was of low quality. Screening of citations and of
the full texts was conducted by two reviewers working independently from each other, with
any uncertainties resolved by discussion or through consultation with a third researcher.
Participants: Subjects of any age, gender or ethnicity; with mild, moderate or severe
sensorineural hearing loss of any aetiology in one or both ear(s), who have failed all other
conservative medical, surgical, pharmaceutical treatment and could not benefit from
conventional hearing aids (CHA) were included in this review. Subjects with a mixed or
conductive hearing loss, or with a profound unilateral hearing loss were excluded.
Intervention: The intervention included was unilateral implantation with the Vibrant
Soundbridge middle ear implant by means of incus Vibroplasty. Any surgical approach
was considered. Bilateral VSB implantation was excluded.
Comparators: Unilateral VSB implantation was compared to receiving no surgical
intervention; and presented against the Maxum (formerly SOUNDTEC Direct Drive)
partially implantable MEI, and the Esteem and Carina fully implantable hearing devices.
Outcomes: Data was searched on safety, efficacy and economical outcomes with the
VSB. Safety-oriented outcomes included complication/adverse event rates, damage to the
middle ear / inner ear revision surgery/explant rate/device failure and mortality. Efficacy
36
B. SYSTEMATIC EVALUATION OF THE EVIDENCE FOR THE PROPOSED MEDICAL DEVICE
outcomes were divided into audiological outcomes including hearing thresholds, functional
gain, speech perception in quiet and noise, speech recognition thresholds; and subjective
outcomes determined by questionnaires, patient-oriented scales of improvement and
satisfaction scales. Data related to quality of life (QALY, ICER) were considered under
economical outcomes.
Study Design: Systematic reviews and meta-analyses, clinical studies including
randomized or nonrandomized comparative studies, case series, case-control studies,
controlled/not controlled before-and-after studies (CBAs and nCBAs) and interrupted time
series (ITS) analyses) were included in this review. Non-systematic reviews, case reports,
letters, editorials; and animal, in-vitro and laboratory studies were excluded. Clinical
studies with sample sizes less than 5 were also excluded.
The results of the database search and study selection is depicted in Fig 9. Out of a total
of 670 citations, 86 were found to be matching the PICOS criteria. Upon screening the full-
texts 39 were were excluded due to: unavailable full-tests (2), overlapping samples (5),
small sample size (5), sample out of criteria (3), wrong study design (5), wrong
comparator (1), low quality data reporting (9), unrelated outcomes (4), no outcome data
(3), data collapsed across conditions (1). 42 studies remained to be included in the
submission. These are listed in Table 10.
The manual search for relevant studies yielded in the inclusion of 6 more publications.
Four of these were identified from study bibliographies; one was a recent publication not
picked up by the database search; and another was a HTA report from Alberta, Canada.
Overall, the data from 47 studies are presented in this submission.
37
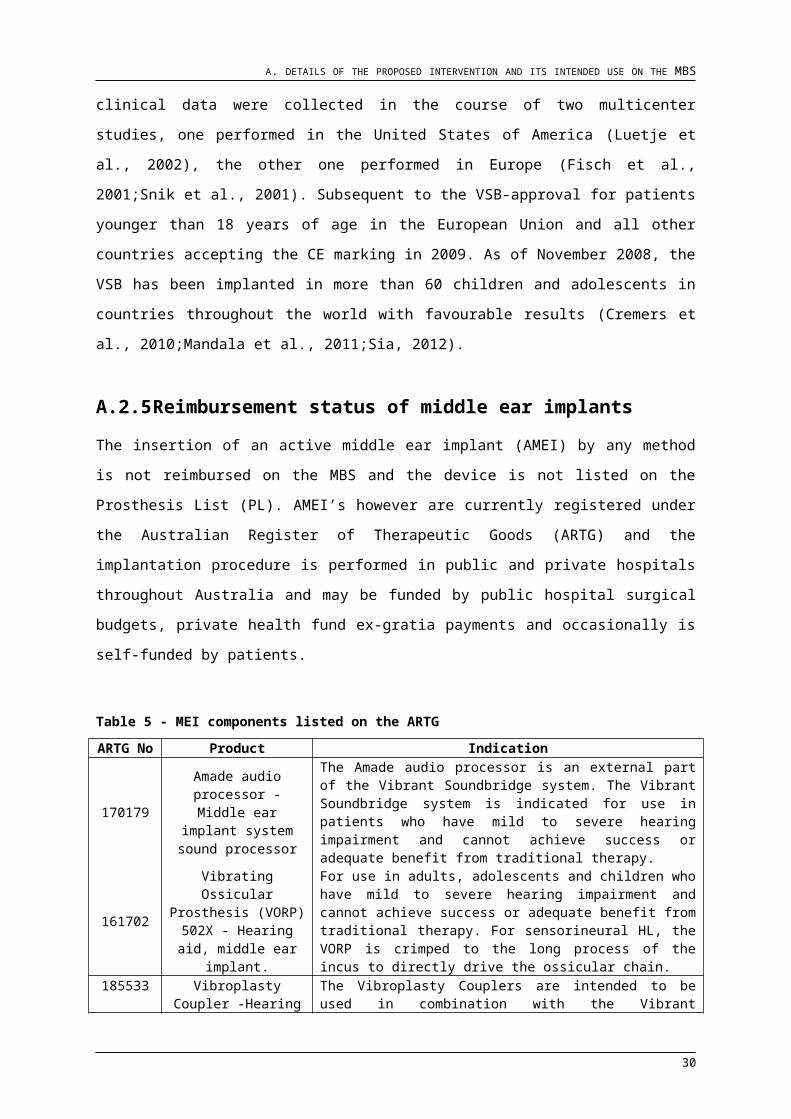
B. SYSTEMATIC EVALUATION OF THE EVIDENCE FOR THE PROPOSED MEDICAL DEVICE
Fig 9 - Flow chart of data selection
Non-randomised studiesA list of all non-randomised studies is presented in Table 10. Most studies compare MEI
performance against that obtained in the unaided condition pre- or post-operatively. Some
studies have included a baseline condition aided with hearing aids; this data has however
been excluded from the submission. Results of the individual studies are summarised
through the following sections.
38
B. SYSTEMATIC EVALUATION OF THE EVIDENCE FOR THE PROPOSED MEDICAL DEVICE
Table 10 - Non-randomised studies assessing the safety and efficacy of middle ear implants
Author Reports
Fully implantable device: ESTEEM
Barbara (2014) Delayed facial nerve palsy after surgery for the Esteem. Acta Otolaryngol., Early Online, 1–4, 2014.
Chen (2004) Phase 1 clinical trial results of the Envoy System: a totally implantable middle ear device for sensorineural hearing loss. Otolaryngol.Head Neck Surg. 131 (6):904-916, 2004.
Gerard (2012) Esteem 2 middle ear implant: our experience. Audiol.Neurootol. 17 (4):267-274, 2012.
Kraus (2011) Envoy Esteem Totally Implantable Hearing System: phase 2 trial, 1-year hearing results. Otolaryngol.Head Neck Surg. 145 (1):100-109, 2011.
Llanos-Méndez (2013)
Esteem® totally implantable hearing device for treatment of sensorineural hearing loss. Systematic review. ISBN:978-84-15600-26-8, 2013.
Memari (2011) Safety and patient selection of totally implantable hearing aid surgery: Envoy system, Esteem. Eur.Arch.Otorhinolaryngol. 268 (10):1421-1425, 2011.
Monini (2013) Esteem middle ear device versus conventional hearing aids for rehabilitation of bilateral sensorineural hearing loss. Eur.Arch.Otorhinolaryngol. 270 (7):2027-2033, 2013.
Fully implantable device: CARINA
Bruschini (2010) Fully implantable Otologics MET Carina device for the treatment of sensorineural and mixed hearing loss: Audio-otological results. Acta Otolaryngol. 130 (10):1147-1153, 2010.
Jenkins Otologics fully implantable hearing system: Phase I trial 1-year results. Otol.Neurotol. 29 (4):534-541, 2008.
Tringali (2010) Otologics middle ear transducer with contralateral conventional hearing aid in severe sensorineural hearing loss: evolution during the first 24 months. Otol.Neurotol. 31 (4):630-636, 2010.
Partially implantable device: VIBRANT SOUNDBRIDGE
Boeheim (2010) Active middle ear implant compared with open-fit hearing aid in sloping high-frequency sensorineural hearing loss. Otol.Neurotol. 31 (3):424-429, 2010.
Boheim (2007) Rehabilitation of high frequency hearing loss: use of an active middle ear implant]. HNO 55 (9):690-695, 2007.
39
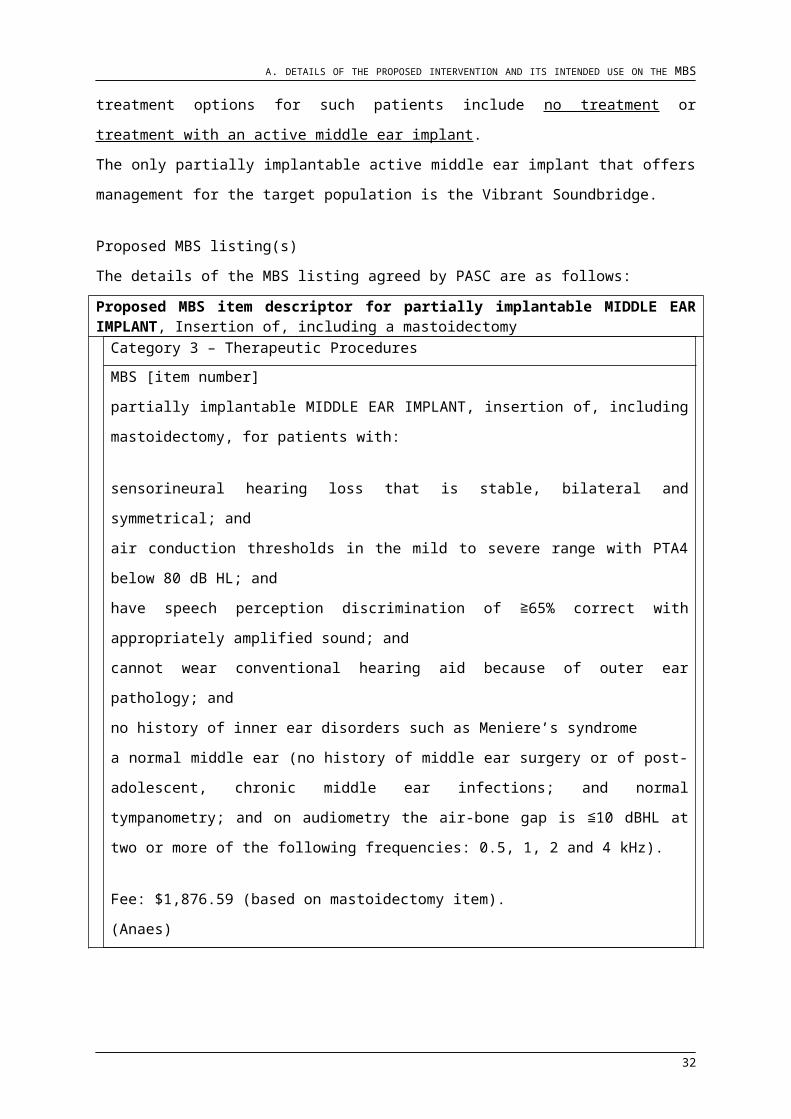
B. SYSTEMATIC EVALUATION OF THE EVIDENCE FOR THE PROPOSED MEDICAL DEVICE
Bruschini (2009) Exclusive Transcanal Surgical Approach for Vibrant Soundbridge Implantation: Surgical and Functional Results.[Miscellaneous Article]. Otology & Neurotology 30 (7):950-955, 2009.
Edfeldt (2014) Evaluation of cost-utility in middle ear implantation in the Nordic School. Acta Otolaryngol. 2014 Jan;134(1):19-25., 2014.
Fisch (2001) Clinical experience with the Vibrant Soundbridge implant device. Otol.Neurotol. 22 (6):962-972, 2001.
Fraysse (2001) A multicenter study of the Vibrant Soundbridge middle ear implant: early clinical results and experience. Otol.Neurotol. 22 (6):952-961, 2001.
Garin (2005) Hearing in noise with the Vibrant Soundbridge middle-ear implant. Proceedings of the 4th International Symposium on Electronic Implants in Otology, pg 72-73, 2005
Ihler (2013) Mastoid cavity obliteration and vibrant soundbridge implantation for patients with mixed hearing loss. Laryngoscope, DOI: 10.1002/lary.24180, 2013.
Ihler (2014) Long-term functional outcome and satisfaction of patients with an active middle ear implant for sensorineural hearing loss compared to a matched population with conventional hearing aids. Otology & Neurotology, 35:211-215. 2014
Labassi (2005) Retrospective of 1000 patients implanted with a Vibrant Soundbridge middle-ear implant. Proceedings of the 4th International Symposium on Electronic Implants in Otology, pg 74-75. 2005
Lenarz (2001) Vibrant Sound Bridge System. A new kind hearing prosthesis for patients with sensorineural hearing loss. 2. Audiological results]. Laryngorhinootologie 80 (7):370-380, 2001.
Luetje (2002) Phase III clinical trial results with the Vibrant Soundbridge implantable middle ear hearing device: a prospective controlled multicenter study. Otolaryngol.Head Neck Surg. 126 (2):97-107, 2002.
Luetje (2010) Vibrant Soundbridge implantable hearing device: critical review and single-surgeon short- and long-term results. Ear Nose Throat J. 89 (9):E9-E14, 2010.
Mosnier (2008) Benefit of the Vibrant Soundbridge Device in Patients Implanted For 5 to 8 Years.[Report]. Ear & Hearing 29 (2):281-284, 2008.
Pok (2010) Clinical experience with the active middle ear implant Vibrant Soundbridge in sensorineural hearing loss. Adv.Otorhinolaryngol. 69:51-58, 2010.
40
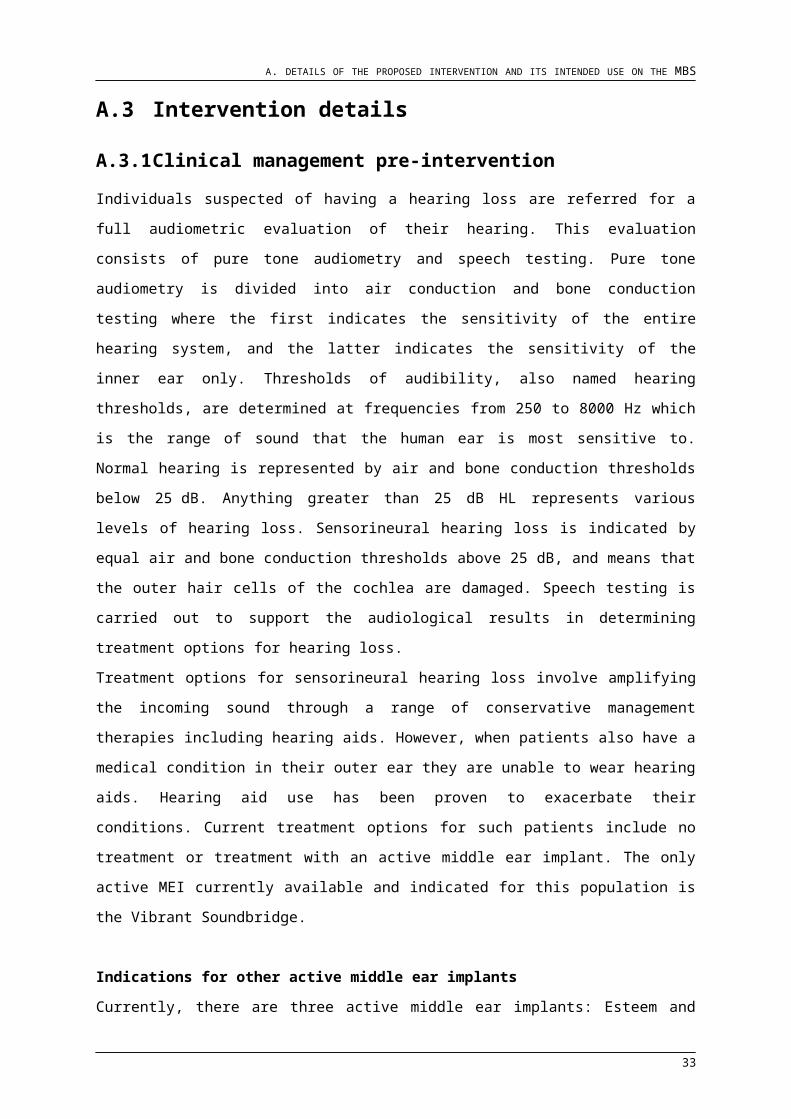
B. SYSTEMATIC EVALUATION OF THE EVIDENCE FOR THE PROPOSED MEDICAL DEVICE
Saliba (2005) Binaural hearing, Digital hearing aid, Middle ear implant, Stereophony, and Vibrant Soundbridge. Binaurality in Middle Ear Implant Recipients Using Contralateral Digital Hearing Aids.[Miscellaneous Article]. Otology & Neurotology 26 (4):680-685, 2005.
Schmutziger (2006) Long-Term Assessment after Implantation of the Vibrant Soundbridge Device. Otology & Neurotology 27:183–188 2006.
Snik (1999) First audiometric results with the Vibrant soundbridge, a semi-implantable hearing device for sensorineural hearing loss. Audiology 38 (6):335-338, 1999.
Snik (2001) Multicenter audiometric results with the Vibrant Soundbridge, a semi-implantable hearing device for sensorineural hearing impairment. Otolaryngol.Clin.North Am. 34 (2):373-388, 2001.
Snik (2001) Vibrant semi-implantable hearing device with digital sound processing: effective gain and speech perception. Arch.Otolaryngol.Head Neck Surg. 127 (12):1433-1437, 2001.
Snik (2006) Estimated cost-effectiveness of active middle-ear implantation in hearing-impaired patients with severe external otitis. Arch.Otolaryngol.Head Neck Surg. 132 (11):1210-1215, 2006.
Sterkers (2003) A middle ear implant, the Symphonix Vibrant Soundbridge: retrospective study of the first 125 patients implanted in France. Otol.Neurotol. 24 (3):427-436, 2003.
Sziklai (2014) Functional gain and speech understanding obtained by Vibrant Soundbridge or by open-fit hearing aids. Acta Otolaryngol., Acta Oto-Laryngologica; 131: 428–433. 2014.
Todt (2002) Comparison of different vibrant soundbridge audioprocessors with conventional hearing AIDS. Otol.Neurotol. 23 (5):669-673, 2002.
Todt (2005) Hearing benefit of patients after Vibrant Soundbridge implantation. ORL J.Otorhinolaryngol.Relat Spec. 67 (4):203-206, 2005.
Truy (2008) Vibrant soundbridge versus conventional hearing aid in sensorineural high-frequency hearing loss: a prospective study. Otol.Neurotol. 29 (5):684-687, 2008.
Uziel (2003)High-frequency sensorineural hearing loss, Middle ear implant, Rehabilitation, SIGNIA, and Symphonix Vibrant Soundbridge. Rehabilitation for High-Frequency Sensorineural Hearing Impairment in Adults with the Symphonix Vibrant Soundbridge: A Comparative Study.[Miscellaneous Article]. Otology & Neurotology 24 (5):775-783, 2003.
Vincent (2004) A longitudinal study on postoperative hearing thresholds with the Vibrant Soundbridge device. Eur.Arch.Otorhinolaryngol. 261 (9):493-496, 2004.
Partially implantable device: MAXUM
41

B. SYSTEMATIC EVALUATION OF THE EVIDENCE FOR THE PROPOSED MEDICAL DEVICE
NO LITERATURE AVAILABLE FOR THE MAXUM DEVICE
Partially implantable device: SOUNDTEC
Hough (2002) Middle ear electromagnetic semi-implantable hearing device: results of the phase II SOUNDTEC direct system clinical trial. Otol.Neurotol. 23 (6):895-903, 2002.
Roland (2001) Verification of improved patient outcomes with a partially implantable hearing aid, The SOUNDTEC direct hearing system. Laryngoscope 111 (10):1682-1686, 2001.
Silverstein (2005)
Electromagnetic hearing device, Ossicular magnet, Semi-implantable hearing device, and SOUNDTEC. Experience with the SOUNDTEC Implantable Hearing Aid.[Miscellaneous Article]. Otology & Neurotology 26 (2):211-217, 2005.
42

B. SYSTEMATIC EVALUATION OF THE EVIDENCE FOR THE PROPOSED MEDICAL DEVICE
Systematic reviews and HTA reportsCitation details of the systematic reviews and HTA reports identified in the literature
search are provided in Table 11. Due to the heterogeneity in the data collected by the
included studies a meta-analysis was not possible in any systematic review. Only the
economical data available from the HTA reports are included in this submission.
Table 11 - Systematic reviews and HTA reports
SYSTEMATIC REVIEW
Kahue (2014)
Middle ear implants for rehabilitation of sensorineural hearing loss: a
systematic review of FDA approved devices (Provisional abstract). Otol
Neurotol. Aug;35(7):1228-37, 2014.
Butler (2013)Efficacy of the active middle-ear implant in patients with sensorineural
hearing loss. J.Laryngol.Otol. 127 Suppl 2:S8-16, 2013.
Klein (2012)
Hearing aid, Hearing loss, and Middle ear implant. A Systematic
Review of the Safety and Effectiveness of Fully Implantable Middle Ear
Hearing Devices: The Carina and Esteem Systems.[Review]. Otology &
Neurotology 33 (6):916-921, 2012.
Alberta Health and
Wellness (2011)
Middle Ear Implants for the Treatment of Hearing Loss, Final STE
Report: December 2011
Medical Services
Advisory Committee
(2010)
Middle ear implant for sensorineural, conductive and mixed hearing
losses.MSAC, 2010
Comite d'Evaluation et de
Diffusion des Innovations
Technologiques (2002)
Middle ear implants - systematic review, expert panel. Anonymous.
2002.
Kahue (2014)
This systematic review by Kahue 2014 evaluates safety and efficacy of middle ear implant
(MEI) systems for the rehabilitation of sensorineural hearing loss. Systematic data search
used MEDLINE and Cochrane Library databases. Initial study inclusion required the
publication to be in the English language; the use of the Vibrant Soundbridge,
SOUNDTEC Direct, or Esteem MEI; independent reporting of patients with purely SNHL;
at least 5 implanted ears; and comparative data between preoperative and postoperative
audiometric performance. An initial search yielded 3,020 articles that were screened
based on title and abstract. A full manuscript review of the remaining 80 articles was
performed, of which 17 unique studies satisfied inclusion criteria and were evaluated.
Variables including functional gain, speech recognition score improvement, audiometric
43
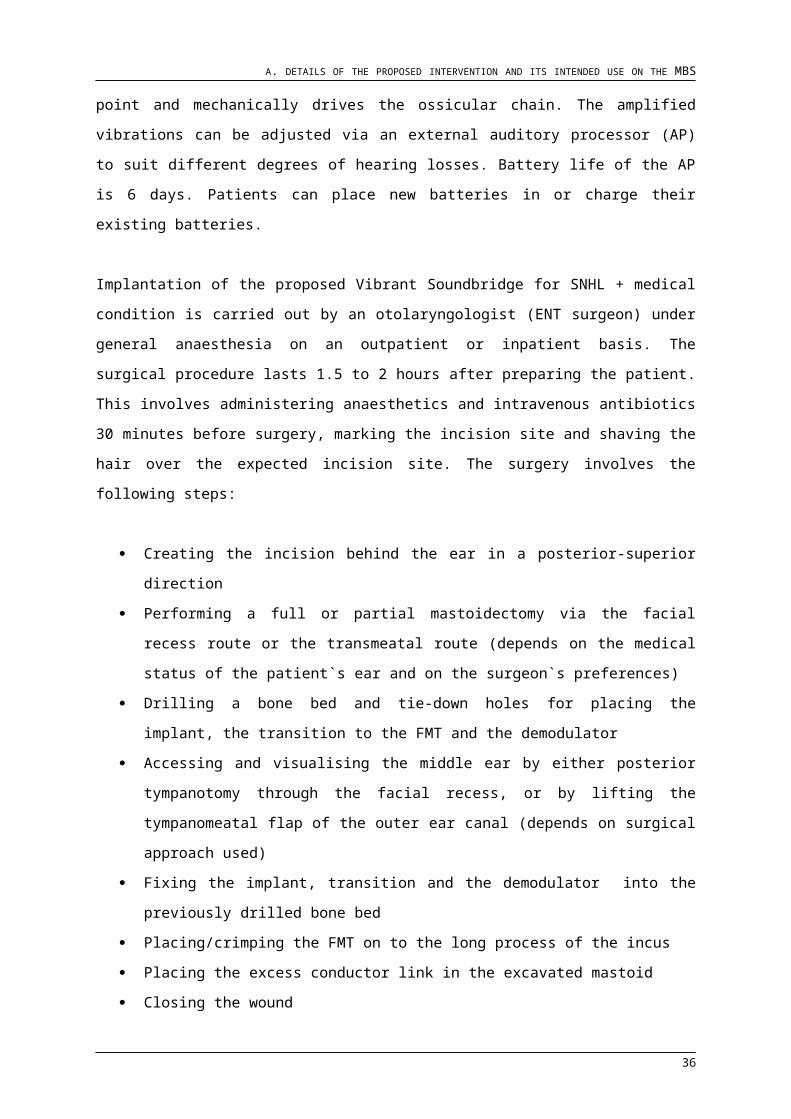
B. SYSTEMATIC EVALUATION OF THE EVIDENCE FOR THE PROPOSED MEDICAL DEVICE
threshold shift following surgery, adverse events, and patient reported outcome measures
were recorded. Study quality was appraised according to author conflict of interest,
prospective or retrospective study design, inclusion criteria, number of patients, proper
use of study controls, outcome measures reported, length of follow-up, and level of
evidence. Heterogeneous outcome reporting precluded meta-analysis; instead a
structured review was performed using best available data. Kahue 2014 concluded that
the majority of studies evaluating the safety and efficacy of MEIs are retrospective in
nature with limited follow-up. To date, no prospective randomized controlled trial exists
comparing contemporary air conduction hearing aid performance and MEI outcomes.
Furthermore he concluded that, middle ear implants offer an effective method of
rehabilitating moderate-to-severe SNHL. Functional gain and speech recognition
improvement appears on par with optimally fitted HAs, whereas patient-perceived
outcome measures suggest that MEIs provide enhanced sound quality while reducing
occlusion effect. Kahue 2014 summarizes that the future of MEIs is promising; however,
further improvements in device reliability, safety, and insurance coverage are needed.
Butler (2013)
A systematic review was conducted by Butler et al (2013) to advise on the effectiveness of
the active middle-ear implant in patients with sensorineural hearing loss, compared with
external hearing aids. Several electronic databases, PubMed, Embase Cochrane Library
and Current Contents databases, in order to identify relevant studies and reviews for the
period between database inception and March 2012 have been screened. Only
comparative studies were eligible for inclusion. Initial eligibility on the basis of study
citation was conservatively determined by one reviewer (if unclear from the abstract, the
full text paper was obtained). The bibliographies of all included studies were hand
searched for any relevant references which may have been missed by the literature
search. The Literature search resulted in fourteen comparative studies identified for
inclusion, employing a variety of middle-ear implant devices, including the Envoy Esteem,
Otologics Middle Ear Transducer, Soundtec Direct Drive Hearing System and Vibrant
Soundbridge. Nine studies reported on the primary outcome of functional gain: one found
that the middle-ear implant was significantly better than external hearing aids (p<0.001),
while another found that external hearing aids were generally significantly better than
middle-ear implants (p<0.05). Six of the seven remaining studies found that middle-ear
implants were better than external hearing aids, although generally no clinically significant
difference (i.e.≥10 dB) was seen. Commonly reported adverse events following device
implantation included middle-ear effusion, haematoma of the ear canal or tympanic
44

B. SYSTEMATIC EVALUATION OF THE EVIDENCE FOR THE PROPOSED MEDICAL DEVICE
membrane, and pain. In the three studies reporting adverse events, device malfunction
occurred in 5.7 per cent of patients. Butler 2013 concluded from evidence compiled in this
review that the active middle-ear implant is as effective as the external hearing aid in
improving hearing outcomes in patients with SNHL.
Klein (2012)
Klein 2012 performed a systematic review of evidence from existing research on the
safety and efficacy of the Esteem Hearing System (Envoy, Minneapolis, MN, USA) and
the Carina Fully Implantable Hearing Device (Otologics, Boulder, CO, USA). Systematic
search was performed after The Cochrane Collaboration guidelines and the PRISMA
statement. Sources used were MEDLINE, EMBASE, The Cochrane Library, Web of
Science, CINAHL, PsycINFO, and the Centre for Reviews and Dissemination. Titles and
abstracts of 7,700 citations were screened, and 30 articles were selected for full review, of
which, 7 articles on the Esteem and 13 on the Carina met the study’s eligibility criteria.
Information was extracted using a pretested data abstraction form, and study quality was
assessed using the Oxford Centre for Evidence-Based Medicine Levels of Evidence. Klein
2014 concluded that the majority of studies were quasi-experimental, pre- post
comparisons of aided and unaided conditions. Complication rates with the Esteem were
higher than with the Carina, and most commonly included taste disturbance. However,
device failure was common with the Carina, predominately related to charging difficulties.
For both devices, clinically significant improvements in functional gain, speech reception,
and speech recognition over the unaided condition were found. In studies comparing the
Esteem or Carina to hearing aids, findings were mixed. Although improvements in
functional gain were similar to those for hearing aids, speech recognition and quality of life
were greater with the implants. Despite limited evidence, these devices seem to offer a
relatively safe and effective treatment option, particularly for patients who are medically
unable to wear conventional hearing aids.
Alberta Health and Wellness (2011)
This STE report is a systematic review of the evidence on middle ear implants (MEI) for
the treatment of hearing loss. The objectives of this review were to determine the safety,
effectiveness and cost-effectiveness of MEI in comparison to external hearing aids, bone
anchored hearing aids (BAHA), or cochlear implants; to identify particular sub-groups of
patients who might benefit most from MEI, and to summarize the current criteria for using
MEI versus alternative treatments for hearing loss. A budget impact analysis and
economic decision model were also prepared based on the published literature,
45
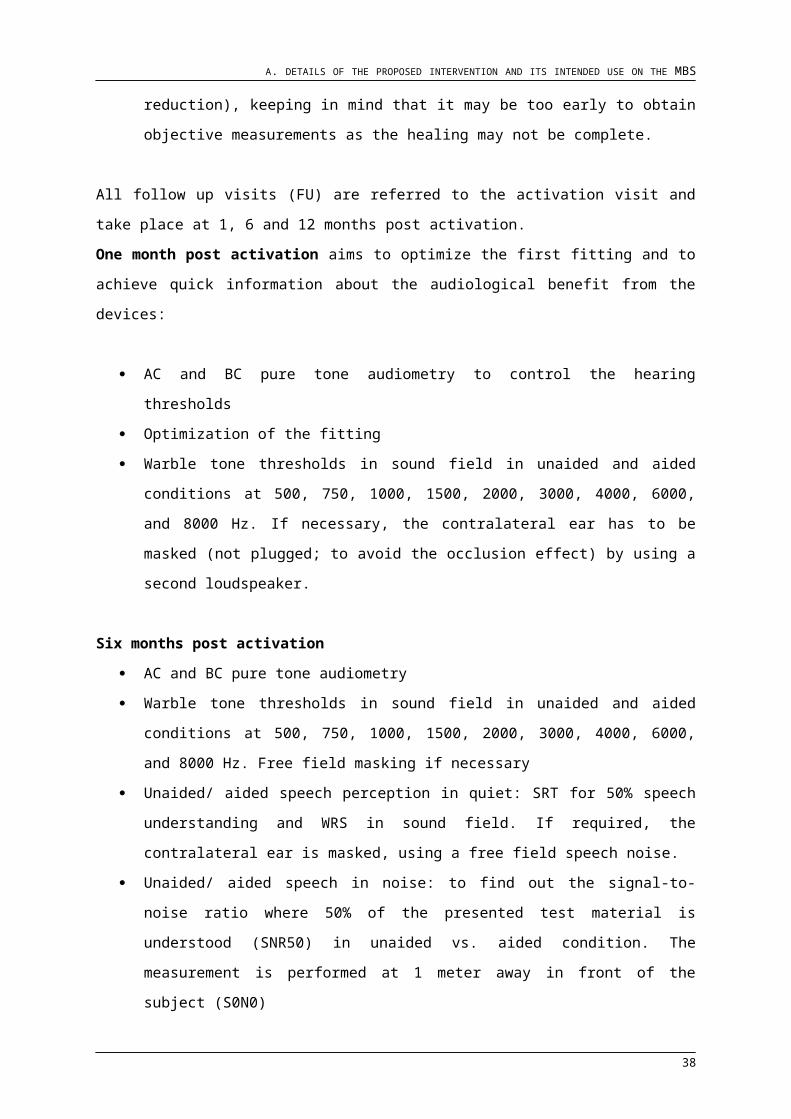
B. SYSTEMATIC EVALUATION OF THE EVIDENCE FOR THE PROPOSED MEDICAL DEVICE
information provided by the manufacturers, expert clinical opinion, and Alberta Health and
Wellness administrative data. MEIs reviewed and licensed by Health Canada were the
Vibrant Soundbridge® (Med-El) and the Esteem® (Envoy Medical). A third MEI, the
Carina® fully implantable hearing aid (Otologics), was still in the process of obtaining
licensing in Canada. All three devices are included in this assessment. A literature search
was conducted for published and unpublished studies on middle ear implants, bone-
anchored hearing aids and cochlear implants in the international literature before
September 2011. The review of the Vibrant Soundbridge (VSB), Esteem, and Carina
middle ear implants included 60 studies representing a total of 1009 patients. There were
25 studies meeting the inclusion criteria for BAHA, which collectively included 638
patients. The compiled Evidence of Safety data on the partially implantable Vibrant
Soundbridge and fully implantable Carina appear to be relatively safe. There were few
reports of major complications, and these occurred at rates similar to those with BAHA. A
greater number of major complications were reported with the fully implantable Esteem,
including high rates of nerve damage. Revision surgeries and explanations were more
frequent with the Esteem and Carina MEIs. No significant safety issues associated with
conventional hearing aids were found. While in this review, the safety of MEI was not
specifically compared to that of cochlear implants because of differences in eligible patient
populations (cochlear implants are typically indicated for more severe hearing loss), based
on previously published reviews of cochlear implants, MEI appears to be at least as safe
as cochlear implants. The Evidence of Effectiveness showed for middle ear implants offer
comparable functional gains to those achieved with hearing aids. Based on the limited
evidence, MEIs appear to provide greater improvements in the perception of speech in
noisy situations and in sound quality. MEI also appears to be at least as effective as
BAHA in patients who may be eligible for both devices. Due to differences in the severity
of hearing loss in patients eligible for cochlear implants and those eligible for MEI, the
comparative effectiveness of these two devices could not be assessed. A cost-
effectiveness analysis could not be conducted because for patients who are not medically
able to wear a hearing aid, and who are ineligible for a BAHA, there were no alternative
treatment options. Only three economic evaluations have been published on MEIs. The
quality of these studies was low. They also differed in the assumptions made, conditions
around the use of comparators, and sources of cost data. Budget Impact calculations
were based on an estimated 20 patients receiving MEI per year in Alberta (based on
Expert Advisory Group discussions), the total budget impact over 5 years would be
$2,677,497. Concluding remarks were that, although the technology has been in use for
over 10 years, good quality evidence on MEI is still lacking. In patients medically able to
46

B. SYSTEMATIC EVALUATION OF THE EVIDENCE FOR THE PROPOSED MEDICAL DEVICE
wear conventional hearing aids, the evidence indicates that MEI offers a similar
improvement in functional gain to that achieved with conventional hearing aids, but may
offer greater improvement with respect to perception of speech in noise and sound quality.
In the small group of patients who are medically unable to use conventional hearing aids,
MEI appears to offer a viable treatment option.
Medical Services Advisory Committee (2010)
The Medical Service Advisory Committee 2010 performed a systematic review on clinical
comparators for MEI according to the type and severity of hearing loss: In patients with
mild or moderate sensorineural, conductive or mixed hearing losses, the comparator is the
bone anchored hearing aid (BAHA). In patients with severe sensorineural or mixed
hearing losses, the comparator is the cochlear implant (CI). In patients with severe
conductive hearing loss, the comparator is the BAHA. The evidence presented in the
selected studies was assessed and classified using the dimensions of evidence defined
by the National Health and Medical Research Council (NHMRC 2000) including strength
of the evidence, size of the effect and relevance of the evidence. The included studies
presented a variety of MEI devices. While most studies assessed the VSB MEI, the
Otologics MET, Envoy Esteem, Rion device, SOUNDTEC DDHS, and TICA MEIs were
also assessed. Additionally, some studies described instances in which the MEI
attachment method or the devices themselves had been modified to permit implantation.
Hence, differences in components and attachment occurred between the six identified
different MEI devices and also between patients receiving the same MEI. MSAC
concluded for the MEI device safety outcomes, drawn from comparative, case series and
case report data for a total of 1222 patients. There were no deaths associated with MEI
implantation. Most adverse events were relatively rare and of low severity with the Vibrant
Soundbridge (VSB). Residual hearing loss (RHL) after implantation was an important
adverse event which was only reported in MEI patients. Most of the evidence for the
effectiveness of the MEI has been derived from level IV evidence. Generally, MEI
implantation and/or activation led to improvements in patients with mild, moderate and
severe sensorineural hearing loss (SNHL); SNHL of undefined severity; mild, moderate
and severe mixed hearing loss (MHL); MHL of undefined severity; and CHL. The MEI
appears to be at least as effective as the HA. While most studies assessed the VSB MEI,
the Otologics middle ear transducer (MET), Envoy Esteem, Rion device, SOUNDTEC
Direct Drive Hearing System (DDHS) and TICA MEIs were also assessed. Expert opinion
of the Advisory Panel stated that although there were slight differences between the MEI
devices, their method of implantation was similar enough for pooled outcomes to be
47
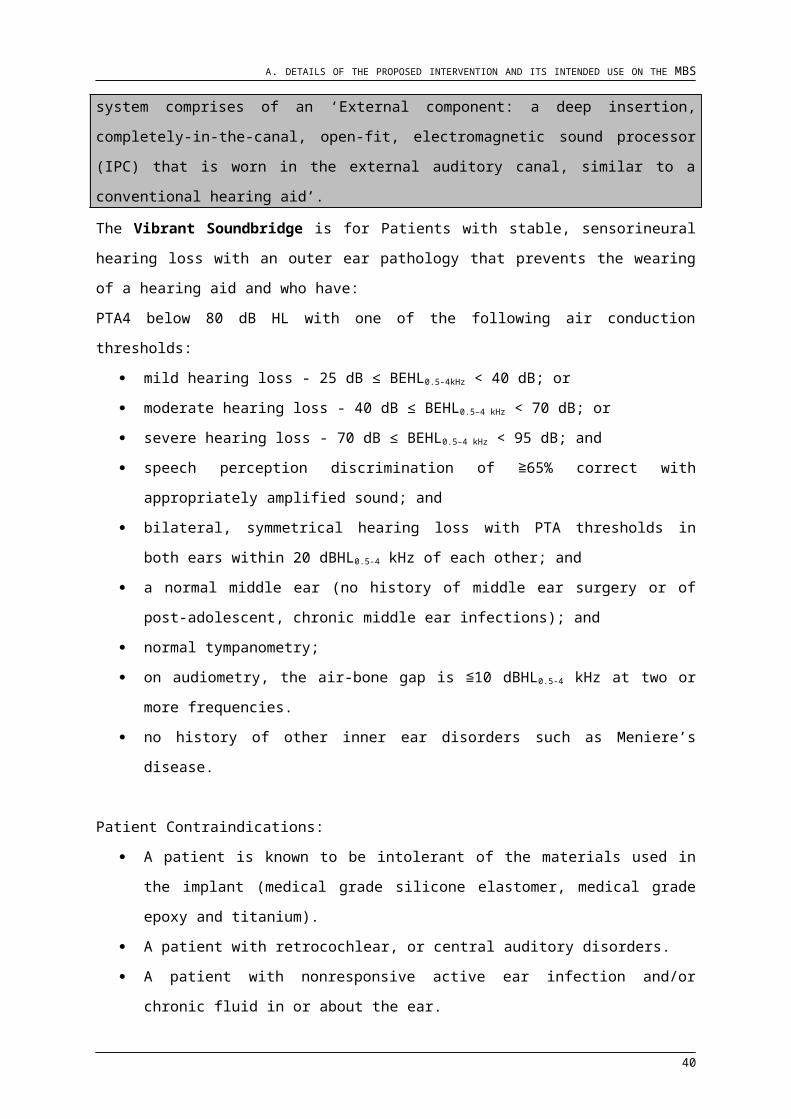
B. SYSTEMATIC EVALUATION OF THE EVIDENCE FOR THE PROPOSED MEDICAL DEVICE
reported. The majority of the available studies assessed the MEI in patients with SNHL.
This is reflective of the anticipated Australian practice suggested by clinical experts. The
reporting of effectiveness outcomes was compromised by the lack of uniform outcome
measurements. The economic evaluation was to performed to compare the cost-
effectiveness of MEI relative to BAHA and CI. In the absence of conclusive effectiveness
data, a cost analysis was conducted to compare the different costs associated with each
of the three procedures on which MSAC noted that MEI is more expensive than BAHA,
but MEI is less expensive than CI.
Comite d'Evaluation et de Diffusion des Innovations Technologiques (2002)
This review was performed by horizon scanning documents and gives a concise overview
of the MEIs which were available in that market at the time (CEDIT 2002). Neither a
search strategy nor a list of references was provided. The devices considered were the
Vibrant Soundbridge, the Otologics Middle Ear Transducer and the SOUNDTEC Direct
Drive Hearing System. The population considered by this document is limited. A simple
economic analysis was performed which stated that the cost of hospital based
management of the MEI in adults is approximately €10,000, of which 56 per cent was the
cost of the device itself. This document noted that the undebatable medical indications for
receiving the MEI are skin pathology or anatomical abnormality in the ear canal, due to
the fact that this makes the use of the HA more difficult. It recommended the
establishment of the defined audiological parameters for the use of the MEI.
B.3 Assessment of the measures taken by investigators to minimise bias in the direct randomised trials
Bias is any systematic error in the design, conduct or analysis of a study which results in
estimates which depart from true values. An unbiased study is free from systematic error.
Many types of bias have been named, but three general types can be identified which
were screened for: selection bias, information bias and confounding bias. Selection bias is
a systematic error in a study caused by the individuals selected into the study being
different from the entire target population in an important way (ie the instance of selecting
or the fact of having been selected is insufficient or not stated at all; a carefully chosen or
representative collection of patients with beneficial outcomes regarding study hypothesis).
The Berkson's bias, is a type of selection bias which may occur in case-control studies
which are based entirely on hospital studies. Information bias is a systematic error in a
48
B. SYSTEMATIC EVALUATION OF THE EVIDENCE FOR THE PROPOSED MEDICAL DEVICE
study caused by errors in the data which are collected in the study, or in the analysis of
the data (ie details derived from study, experience, or instructions are insufficient;
knowledge of specific events or situations are insufficiently reported; a collection of facts
or data (statistical information) presented insufficient or not at all or data is published
several times; a numerical measure of the uncertainty of an experimental outcome). The
converse of an unpublished study is a study that is published several times. This is often,
but not always, obvious (ie Barbara et al 2009, 2011 and 2014; excluded) If duplicate
publications represent several updates of the data, then the most recent was used.
Uncertainty’ covers concepts such as inadequate minimization of important sources of
bias, lack of statistical significance in an underpowered trial, detecting clinically
unimportant therapeutic differences, inconsistent results across trials, and trade‐offs within
the comparative effectiveness and/or the comparative safety considerations. Various
randomization procedures /collapse of data or patient groups were used across the trials
Zwartenkot 2013; excluded). An uneven distribution of patients between the studies can
be reported for almost all studies, but does not result in biased outcomes. Whether the
differences were significant or whether statistical adjustments of results were conducted
was only reported in few trials. Not all evidence carries the same weight of truth that is
systematically collected from a carefully crafted sufficient sample that decreases biases
and promotes generalization. For example in none of the studies the outcome assessor,
audiologist or ENT surgeon, was blinded to the post-operative audiological or subjective
test evaluations, which is in this application not relevant as outcomes cannot be biased.
Not all evidence tests a hypothesis in the most relevant and effective way that
demonstrates that differences seen did not happen by chance alone.
The methodological quality of each included study was critically appraised. Each study
was assessed according to the likelihood that bias, confounding and/or chance may have
influenced its results. To evaluative the rigor and weight of the evidence necessary for
evidence based practice and independent research we used the Cochrane Consumers &
Communication review group, study quality guidelines, quality criteria levels as
summarized in Table 12 and Table 13.
49
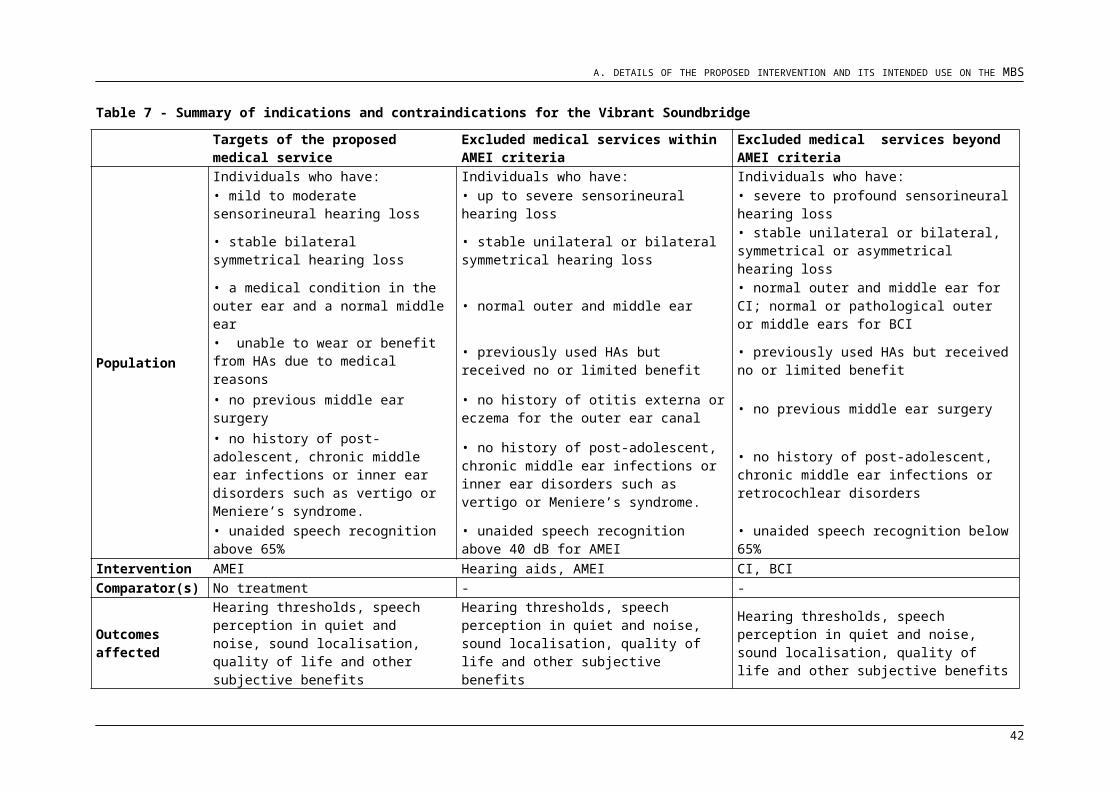
B. SYSTEMATIC EVALUATION OF THE EVIDENCE FOR THE PROPOSED MEDICAL DEVICE
Table 12 - Summary of comparator study characteristics included in the evaluation
Study
level of evidence
n Follow-up Outcomes Conclusion
Oxf
ord
ebM
NH
MR
C
Fully implantable device: ESTEEMBarbara et al. 2011 Italy III III-3 18
adults1.5-2
months
AC and BC pure tone thresholds, Speech recognition in quiet,Quality of life
beneficial results in subjects suffering from high frequency, severe bilateral sensorineural hearing loss (SNHL)Prospective,
pre/post studyBarbaraet al. 2014Italy IV IV 34
adults3
months Adverse events delayed facial nerve (FN) impairment and taste disturbances were found in a limited number of subjects.Prospective, cross-
sectional studyChen et al. 2004USA III III-2 7
adults4
months
AC and BC pure tone thresholds, Functional gain, Speech recognition in quiet and noise, Quality of life, Adverse events
feasibility of a totally implantable middle-ear device for sensorineural hearing loss was provenProspective,
multicenter studyGerard et al. 2012 Belgium III III-3 13
adultsnot
stated
AC and BC pure tone thresholds, Functional gain, Speech recognition in quiet and noise, Quality of Life, Adverse events
offers good functional and satisfaction results; however, careful selection of patients is required. The implant is safe and only associated with classic auditory implant complications
Retrospective, pre/post studyMonini et al. 2013 Germany
III III-3 15 adults
3 months
Functional gain, Speech recognition in quiet, Quality of life
possible beneficial role for rehabilitation of SNHL in selected candidates and improvement of quality of life was concludedRetrospective,
cohort study
Memari et al. 2011 Iran
III III-2 10 adults
19-40 months
AC and BC pure tone thresholds, Functional gain, Adverse events
surgery seems to be realtively safe. Correct selection of patients is very important and infuences postoperative results. Hearing gain in current devices is similar to conventional hearing aids, but with better subjective hearing quality.
Prospective, pre/post study
50
B. SYSTEMATIC EVALUATION OF THE EVIDENCE FOR THE PROPOSED MEDICAL DEVICE
Study
level of evidence
n Follow-up Outcomes Conclusion
Oxf
ord
ebM
NH
MR
C
Kraus et al.2011USA III III-2 57
adults12
months
AC and BC pure tone thresholds, Functional gain, Speech recognition in quiet and noise, Quality of life, Adverse events
hearing results are statistically superior to baseline, best-fit HAs for SRT and WRS and the Esteem system is safe.Prospective,
multicenter studyFully implantable device: CARINA
Bruschini et al. 2010 Italy
IV III-3 7 adults
12-21 months
AC and BC pure tone thresholds, Functional gain, Speech recognition in quiet, Quality of life
is a viable treatment for moderate to severe SNHL and for mixed hearing loss and that in selected cases it could represent an alternative to conventional hearing aids. Implantation without affecting residual cochlear hearing levels and auditory performance could be shown to be similar or better than that reported with Ha's. Device proved to be well tolerated.
Prospective, pre/post study
Jenkins et al. 2008 USA
III III-1 20 adults
12 months
AC and BC pure tone thresholds, Functional gain, Speech recognition in quiet and noise, Quality of life, Adverse events
feasibility and lack of deleterious effects on native hearing was shown. Significant challenges in its clinical application have been encountered, and the company is addressing these issues in design revisions. Patient subjective questionnaires demonstrated improved naturalness of sound and functional hearing that are similar to their baseline hearing aids.
Prospective multicenter study
Tringali et al. 2010 France
III III-2 7 adults
24 montth
s
AC and BC pure tone thresholds, Functional gain, Speech recognition in quiet, Quality of life
MET seems to be a suitable and successful treatmentoption resulting in significant improvement in speechcomprehension, especially after 6 months, in patients with severe sensorineural hearing loss. During the 24-month follow-up of this study, the MET has been a safe and effective treatment for severe hearing loss
Prospective, longitudional study
Partially implantable device: SOUNDTECHough et al. 2002
USAIII III-2 103
adults4-5
months
AC and BC pure tone thresholds, Functional gain,Speech recognition in quiet and noise, Quality of life,Adverse events
significant improvement in outcomesProspective, multicenter trial
51
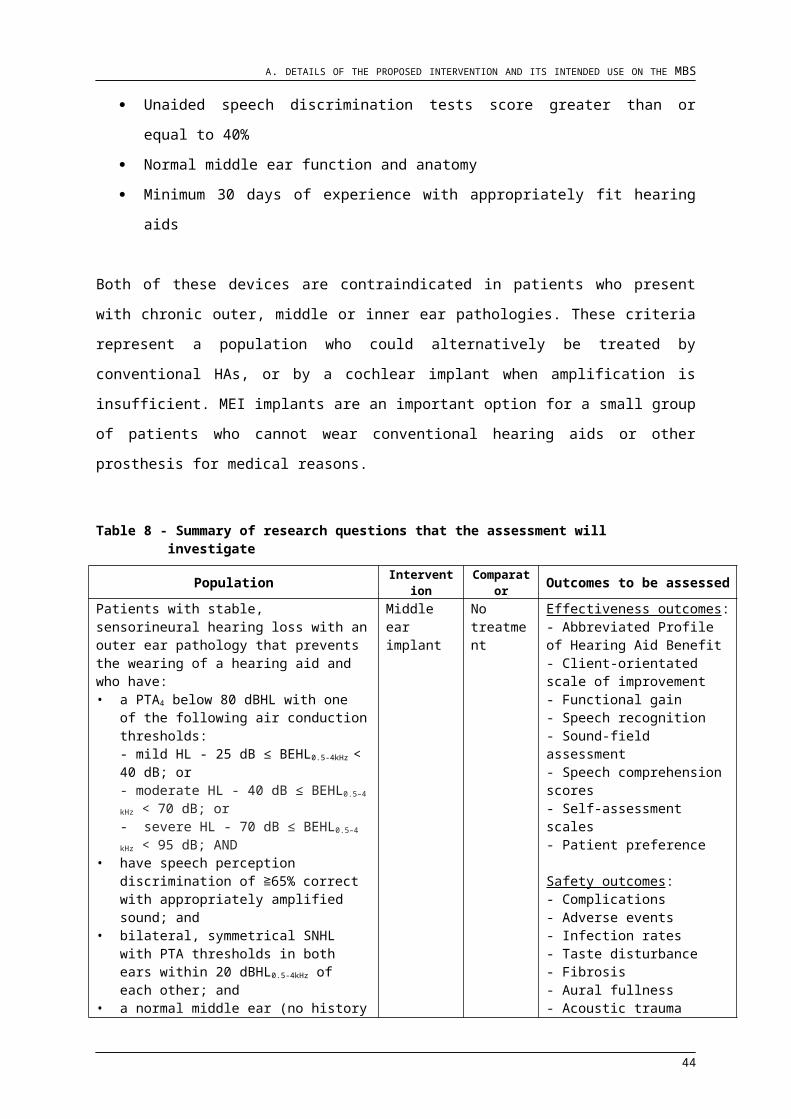
B. SYSTEMATIC EVALUATION OF THE EVIDENCE FOR THE PROPOSED MEDICAL DEVICE
Study
level of evidence
n Follow-up Outcomes Conclusion
Oxf
ord
ebM
NH
MR
C
Roland et al. 2001 USA III III-3 23
adults6
monthsAC pure tone threshold,Functional gain,Quality of life
increased high-frequency gain without feedback. Patient satisfactionProspective,
pre/post studySilverstein et al.
2005 USA III III-3 64 adults
3 months
AC and BC pure tone thresholds, Functional gain,Speech recognition in quiet.Quality of life
well tolerated in the majority of patients, with a significant increase in functional gain over conventional hearing aids and reduces occlusion effect and feedback. Magnet instability and noise were the most frequent complaints.
Retrospective, pre/post study
Table 13 - Summary of Vibrant Soundbridge study characteristics included in the evaluation
Study
level of evidence
n Follow-up/Testing interval Outcomes Conclusions
Oxf
ord
EbM
NH
MR
C
Partially implantable device: VIBRANT SOUNDBRIDGE
Boeheim et al. 2010 Austria IV III-3 10 adults 5-56 months
Unaided and aided sound field thresholds, Speech recognition in quiet and noise
Significant improvementProspective, with/withoutBöheim et al. 2007 Austria
IV III-3 9 adults 6 months
Unaided and aided PTA4 , Speech recognition in quiet and noise
Significant ImprovementRetrospective pre/post study
52
B. SYSTEMATIC EVALUATION OF THE EVIDENCE FOR THE PROPOSED MEDICAL DEVICE
Study
level of evidence
n Follow-up/Testing interval Outcomes Conclusions
Oxf
ord
EbM
NH
MR
C
Fisch et al. 2001 Europe
III III-2 47 adults 3 months
Unaided pure tone audiometry, Subjective impressions of sound quality - not reported
Safety of the surgical procedure was demonstratedProspective, single
arm trial
Fraysse et al. 2001 France
IV III-2 25 adults 22 months
Unaided and aided sound field thresholds (PTA4), Speech recognition, Subjective outcomes using the APHAB
Measurable benefit from the VBS in comparison with HA (superior amplification,greater ease in communication in noise)
Prospective, pre/post study
Garin et al. 2005 Belgium
III III-2 11 adults 9-24 months Speech intelligibility in noise (55 dB) Improvement in Outcomes
Retrospective, with/without
Labassi et al 2005 France IV IV 1100 adults 7 years Adverse events
during/after surgery Reliable middle ear implantRetrospective study
Lenarz et 2001 Germany
IV III-3 34 adults 6 months
Unaided and aided sound field audiometry, Speech intelligibility in quiet and noise, Subjective outcomes using the PHAB questionnaire
Significant improvementRetrospective, pre/post study
Luetje et al 2002 USA III III-2 53 adults 18 weeks Unaided and aided
pure tone audiometry, Safe and effective treatment
53
B. SYSTEMATIC EVALUATION OF THE EVIDENCE FOR THE PROPOSED MEDICAL DEVICE
Study
level of evidence
n Follow-up/Testing interval Outcomes Conclusions
Oxf
ord
EbM
NH
MR
C
Tympanometry and acoustic reflex measurement, Speech reception in quiet and noise, Subjective outcomes using APHAB, HDSS and SHACQ
Prospective, single arm trial
Luetje et al. 2010 USA
III III-3 31 adults 1-11 years
Unaided and aided pure tone audiometry, Degree of device use using a questionnaire
Sustained gainRetrospective, pre/post study
Mosnier et al 2008 France
III III-2 100 adults 5-8 years
Unaided and aided sound field audiometry, Speech intelligibility in quiet (65 dB), Subjective outcomes using Vibrant Questionnaire and GBI, Adverse events
Safe and effective treatmentProspective, single arm trial
Pok et al. 2010 Austria
IV III-3 54 adults not stated
Unaided and aided pure tone audiometry, unaided and aided sound field audiometry, Speech intelligibility in quiet (65 dB, 80 dB)
In cases of SNHL with unsatisfying benefit from conventional HAs, the VSB system offers an attractive and effective hearing solutionRetrospective,
with/without
54
B. SYSTEMATIC EVALUATION OF THE EVIDENCE FOR THE PROPOSED MEDICAL DEVICE
Study
level of evidence
n Follow-up/Testing interval Outcomes Conclusions
Oxf
ord
EbM
NH
MR
C
Saliba et al. 2005 Canada and France
III III-3 8 adults 5-8 weeks
Unaided and aided pure tone audiometry, unaided and aided sound field audiometry, Speech intelligibility in quiet and noise les at various levels with constant noise (65 dB), Subjective outcomes using APHAB
Improvement in Outcomes
Prospective, with/without
Schmuziger et al. 2006 Switzerland
IV III-3 20 adults not stated
Pre and post op pure tone thresholds, Speech intelligibility in quiet using Freiburger monosyllables at 65 dB, Speech intelligibility in noise (70 dB) SPL, Subjective outcomes using the IOI-HA and GBI and a not validated questionnaire
VSB was not superior to conventional hearing aids in audiologic terms, but should be considered for patients were HA are contraindicated
Retrospective chart review
Snik et al. 2006 Netherlands
IV III-1 13 adults 6-24 months
Direct cost of the middle ear implant, Patients satisfaction, Quality adjusted life years, Cost per QALY
Based on the cost per QALY, middle-ear implantation proved to be a cost-effective and justified health care intervention in the Netherlands
Prospective, cost utility study
55
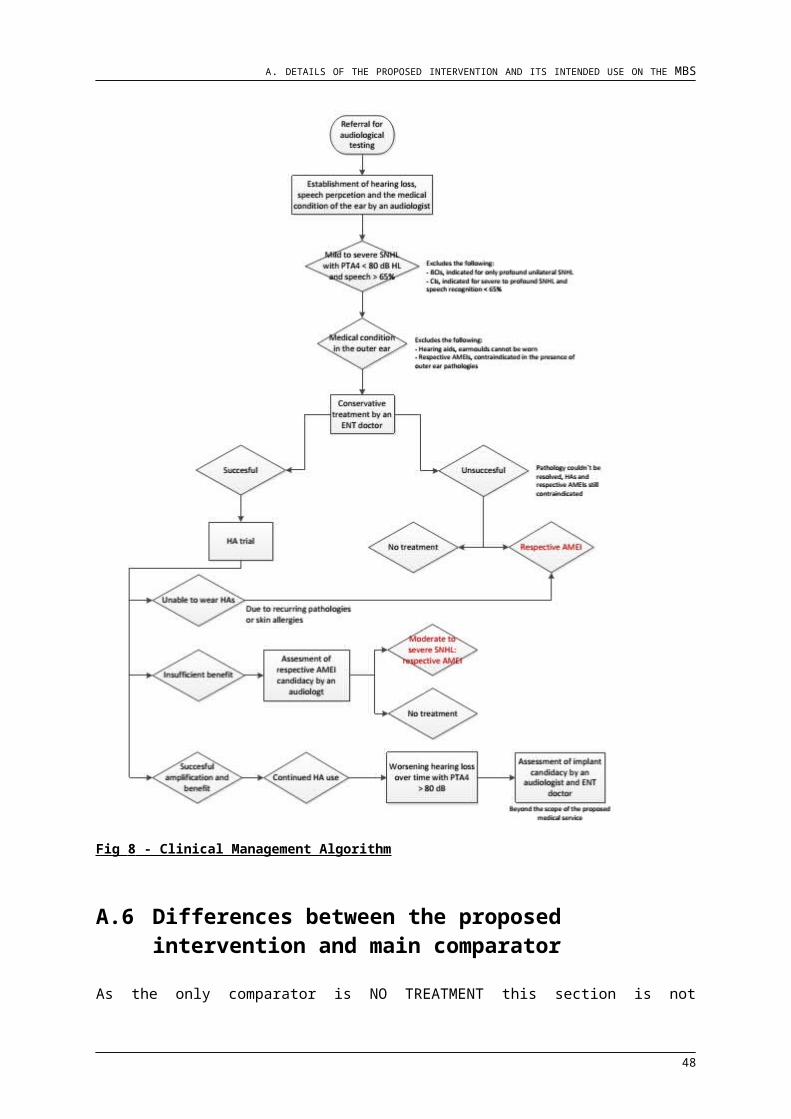
B. SYSTEMATIC EVALUATION OF THE EVIDENCE FOR THE PROPOSED MEDICAL DEVICE
Study
level of evidence
n Follow-up/Testing interval Outcomes Conclusions
Oxf
ord
EbM
NH
MR
C
Snik et al. 2001 Europe
IV III-3 63 adults 7 months
Unaided and aided pure tone audiometry, unaided and aided sound-field speech testing in noise and quite
overall benefit from VSB treatment, but subpopulation with no benefit remainsRetrospective,
multicenter study
Snik et al. 2001 Netherlands IV III-2 14 adults 7 months
Aided and unaided warble tone thresholds, Speech recognition tests
Most of patients benefit from VSB treatment but subgroup presented with low gain
ProspectiveSterkers 2003 France
IV III-2 125 adults 4 years
Unaided and aided, pre and post surgery pure tone thresholds, Sound Field Warble tone to determine functional gain, Speech intelligibility in quiet, Subjective outcomes using the GBI and a Vibrant benefit not validated questionnaire
significant improvement, high level of satisfaction with the VSB
Retrospective survey
Sziklai et al. 2011 Hungary
III III-2 7 adults not statedWarble tone functional gain, Speech recognition scores
no significant difference
Self control prospective study
56

B. SYSTEMATIC EVALUATION OF THE EVIDENCE FOR THE PROPOSED MEDICAL DEVICE
Study
level of evidence
n Follow-up/Testing interval Outcomes Conclusions
Oxf
ord
EbM
NH
MR
C
Todt et al. 2005 Germany
IV III-3 23 adults 5 years
unaided and aided thresholds pre - post implantation, Speech discrimination in quiet and noise, Subjective outcomes using an open Questionnaire
Improvement in Outcomes
Retrospective, with/without
Todt et al. 2002 Germany
IV III-3 5 adults 1 year
Unaided and aided pure tone thresholds under headphones and BC, pre- post implantation, Speech discrimination in quiet (Freiburger monosyllables test), Speech discrimination in noise, Subjective outcomes using the APHAB Questionnaire
The Symphonix Soundbridge device can improve the hearing benefit of moderately to severely hearing handicapped patients—particularly in those with a high-frequency hearing loss—when compared with the conventional hearing aids
Prospective within-subjects
Uziel et al. 2003 France
IV III-2 6 adults 6 months
Warble tone thresholds, Speech comprehension in quiet and noise, Subjective outcomes using the APHAB and HDSS Questionnaire
Suitable treatment option offering advantages over conventional amplification to the hearing-impaired person with a high-frequency hearing loss
Prospective, cross-sectional within-subjects
Vincent et al. 2004 France
IV III-2 39 adults 2- 24 months
Unaided and aided pure tone thresholds, Residual hearing pre- and post implantation
Significant Improvement
Retrospective, with/without
57

B. SYSTEMATIC EVALUATION OF THE EVIDENCE FOR THE PROPOSED MEDICAL DEVICE
Study
level of evidence
n Follow-up/Testing interval Outcomes Conclusions
Oxf
ord
EbM
NH
MR
C
Ihler et al 2014 Germany
IV III-2 22 adults 3-6 months
Pure tone audiometry, Speech Audiometry in quiet and in noise, Subjective outcomes using Quality of life assessment questionnaire GBI
Improvement in Outcomes compared to HA
Retrospective study
58
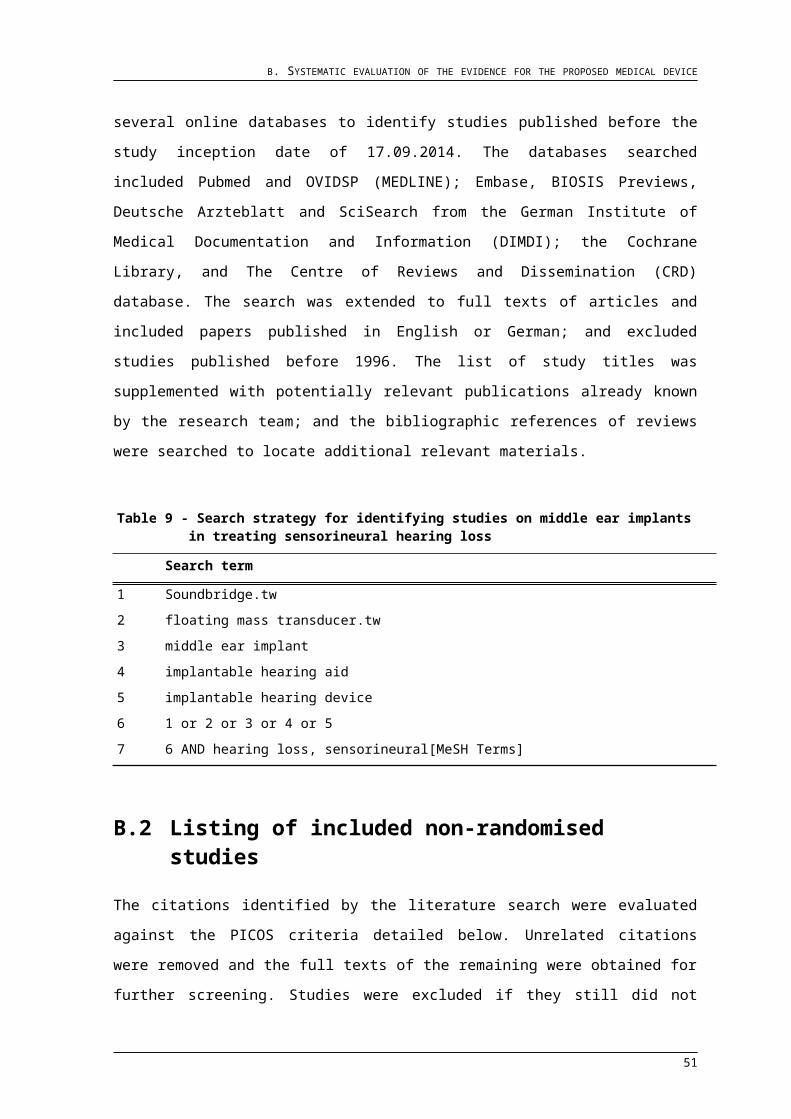
B. SYSTEMATIC EVALUATION OF THE EVIDENCE FOR THE PROPOSED MEDICAL DEVICE
B.4 Characteristics of the non-randomised studies
B4.1 Eligibility criteria
Eligibility for inclusion in a non-randomised trial depended on the candidacy criteria defined
by the manufacturers. The candidacy criteria are presented in Table 14 : Accordingly, adults
aged 18 years and above were included in the studies. Inclusion was not restricted by age,
gender or other demographic variable. Some studies selected patients who were implanted
with a middle ear implant within a specified time frame in their clinic.
Table 14 - Eligibility criteriaEligibility criteria Exclusion criteria
VIB
RA
NT
SOU
ND
BR
IDG
E
stable bilateral symmetric sensorineural hearing loss with mild to severe hearing levels; air-bone gap at 500, 1000, 2000, and 4000 Hz was to be no greater than 10 dB at2 or more frequencies; air conduction pure tone average at 500, 1000, 2000 and 4000 Hz between 25 and 80 dB HL; speech understanding of at least 65% for word lists with appropriately amplified sound; normal middle ear with: no history of middle ear surgery; no history of post-adolescent, chronic middle ear infections; and no history of other inner ear disorders such as Meniere’s disease.
Pure unilateral hearing loss; conductive, retrocochlear, or central auditory disorders; hearing loss fluctuating more than 15 dB in either direction within a period of 2 years; physical, psychological, or emotional disorders that would interfere with subjects` ability to undergo testing or surgery; subjects who were mentally retarded or had organic brain disorders
SOUN
DTEC
Dire
ct D
rive
bilateral symmetric sensorineural hearing loss with moderate to moderately severe sensorineural hearing impairment; bone conduction thresholds within 10 dB of air thresholds, high-frequency pure tone average of 1000, 2000, and 4000 Hz between 35 and 70 dB hearing level (HL), discrimination scores greater than or equal to 60% for NU-6 words, duration of hearing loss of at least 2 years without fluctuation, at least 6 months of recent hearing aid experience, use of an optimally fit NAL-R compliant hearing aid for at least 45 days in the ear to be implanted, age 21 to 80 years, sufficient cognitive skills and motivation to participate, adequate ear canal size to accommodate the deep ear mold coil assembly, dissatisfaction with conventional hearing aids, and absence of otitis externa, otitis media, and retrocochlear pathology
Exclusion criteria included a malformed or inflamed ear, perforated tympanic membrane, acute otitis media, otosclerosis, previous middle ear surgery, and disabling tinnitus.
59
B. SYSTEMATIC EVALUATION OF THE EVIDENCE FOR THE PROPOSED MEDICAL DEVICE
Eligibility criteria Exclusion criteriaES
TEEM
mild to severe sensorineural hearing loss between 500 and 4000 Hz in the ear implanted that is equal to or worse than the nonimplanted ear, air conduction pure tone average of 500, 1000, 2000, 3000 and 4000 Hz between 38 and 85 dB HL, previous use of a properly functioning hearing aid for at least 4 hours per day in the ear to be implanted for at least 3 months, healthy middle ear with normal middle ear anatomy, normal-functioning eustachian tube, adequate space for the Envoy System via fine cut CT scan, speech discrimination (unaided, in the ear to be implanted) of at least 60% or better with recorded delivery at 80 dB, psychological and emotional stability, with realistic expectations of the benefits and limitations of the device
Subjects with vestibular or osteodegenerative disorders, middle ear pathology, a history of recurrent otitis media, conductive or mixed hearing loss, nonorganic hearing loss, retrocochlear hearing loss, central auditory nervous system disorder, and prelinguistic onset of hearing loss
CA
RIN
A
bilaterally symmetric sensorineural hearing loss with moderate to moderately severe sensorineural hearing impairment;(within 20 dB) hearing, pure-tone or high-frequency pure-tone average between 40 and 80 dB hearing level (HL), and NU-6 scores greater than 40% at 80 dB HL or 40 dB sensation level in the ear to be implanted
Subjects with vestibular or osteodegenerative disorders, middle ear pathology, a history of recurrent otitis media, conductive or mixed hearing loss, nonorganic hearing loss, retrocochlear hearing loss, central auditory nervous system disorder, and prelinguistic onset of hearing loss were excluded from the study.
B4.2 Patient baseline characteristics
Patient baseline characteristics provided by most studies included age and gender. Some
also specified the use of pre-operatively worn hearing aids. Eight studies did not however
provide gender information. One longitudinal study on post-operative hearing thresholds by
Vincent (2004) and a study by Labassi (2005), which was a conference proceeding, did not
specify any patient baseline characteristics. The baseline characteristics can be seen in
Table 15.
Age
Patients` age ranged from 18 up to 86 years.
Gender
The distribution of males to females across all studies was balanced (52% males and 48%
females).
60
B. SYSTEMATIC EVALUATION OF THE EVIDENCE FOR THE PROPOSED MEDICAL DEVICE
Table 15 - Characteristics of study participants and duration of follow-up compared in trials
Study n Age (yrs) Sex Follow-up
VIBRANT SOUNDBRIDGEBoeheim et al. (2010) 10 59 (44-73) not stated 5-56 monthsBöheim et al. (2007) 30 52 (30-75) 16 male,14 female 6 monthsFisch et al. (2001) 47 48.4 (19-80) 23 male,24 female 8 -12 weeksFraysse et al. (2001) 25 49.3 (20-73) 8 male,17 female 6-22 monthsGarin et al. (2005) 11 59 (37-69) 7 male,4 female 9-24 monthsGarin et al. (2003) 9 63 (37-72) 4 male,5 female 9-24 monthsLabassi et al. (2005) 1450 not stated not stated not statedLenarz et al. (2001) 34 47.2 (18.9-80.3) 16 male,18 female 6 monthsLuetje et al. (2002) 53 58.8 (28 - 86) 26 male,27 female 18 weeksLuetje et al. (2010) 31 56 (28-74) 19 male,12 female 1-11 yrs.Mosnier et al. (2008) 100 51 (19-79) not stated 5-8 yrs.Pok et al. (2010) 54 52.3 (30-75) 29 male,25 female not statedSaliba et al. (2005) 8 58 (45-68) 3 male,5 female 5-8 weeksSchmuziger et al. (2006) 20 59 (37-75) 16 male,4 female 24 monthSnik et al. (2006) 13 52.4 ± 13.9 (18-79) 9 male,12 female not statedSnik et al. (2001) 14 33-67 not stated not statedSterkers et al. (2003) 95 56 ± 13 (24-81) 45 male, 50 female not statedSziklai et al. (2011) 7 21-62 not stated not statedTodt et al. (2005) 23 54-69 not stated not statedTodt et al. (2002) 5 54-69 not stated not statedUziel et al. (2003) 6 56 (32-67) 4 male,2 female not statedVincent et al. (2004) 39 not stated not stated not stated
ESTEEMBarbara et al. (2011) 18 not stated not stated 1.5-2 monthsBarbara et al. (2014) 34 not stated 23 men, 11 females 3 monthsChen et al. (2004) 7 64.4 (42 -88 ) 5 men, 2 women 4 monthsGerard et al. (2012) 13 21-64 4 males, 9 females not statedMonini et al. (2013) 15 18 - 74 7 male, 8 female 3 monthsMemari et al. (2011) 10 32.7+/-12.9 3 male, 7 female 19-40 monthsKraus et al. (2011) 57 52.9 (18-77) 38 male, 19 female 12 months
CARINABruschini et al. (2010) 8 46.4 (34-66) 7 males, 1 female 12-21 monthsJenkins et al. (2008) 20 62.8 (31.6-82) 10 male, 10 female 12 monthsTringali et al. (2010) 7 65 (53-77) 5 male, 2 female 24 months
SOUNDTEC DIRECT DRIVEHough et al. (2002) 103 65.1 68 male, 35 feamle 4-5monthsRoland et al. (2001) 23 67.1 +/-11.4 10 male, 13 female 6 monthsSilverstein et al. (2005) 64 40-86 19 male, 18 female 3 months
B4.3 Interventions in the non-randomised studies
In addition to the Vibrant Soundbridge, three comparable middle ear implant systems were
included in the systematic review. All MEI were activated, or the sound processor was fitted
within 4-8 weeks after the implantation. Audiological testing was carried out on initial fitting
and then at regular intervals. The amount follow-up specified by each study is presented in
Table 15.
61
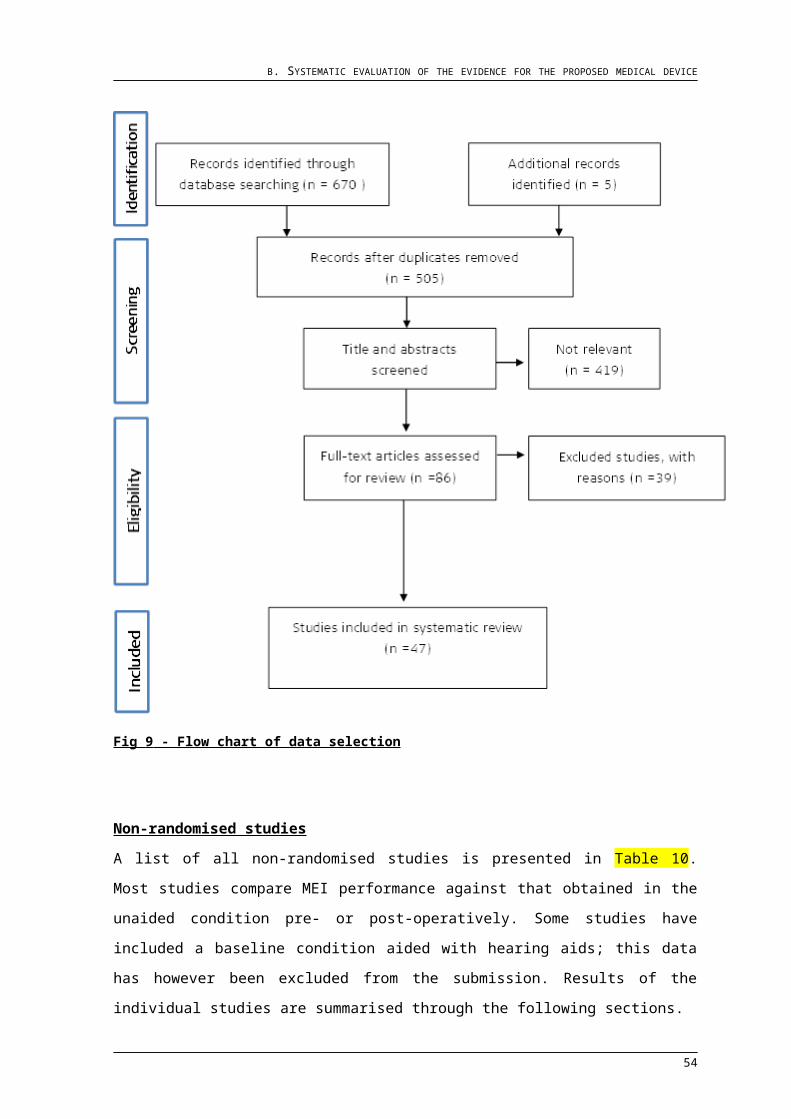
B. SYSTEMATIC EVALUATION OF THE EVIDENCE FOR THE PROPOSED MEDICAL DEVICE
B.5 Outcome measures and analysis of the literature
A range of outcomes have been identified as relevant to the research questions: The category
of outcomes required to address the research questions proposed in the DAP are:
Is the partially implantable MEI superior in effectiveness compared to no treatment?
Is the partially implantable MEI as safe as no treatment?
Because there are no head-to-head comparisons between partially implantable active middle
ear implants and no treatment a comparison between partially implanted devices was
conducted. We have been seeking data on patient-oriented outcomes, including: effectiveness,
e.g., the subject perspective determined by questionnaires, patient-oriented scale of
improvement, functional gain, speech recognition, real ear insertion gain, sound-field
assessment and speech comprehension scores as well as satisfaction with communication
and data related to quality of life (QALY, ICER). Safety-oriented outcomes included
complication/adverse event rates, damage to the middle ear / inner ear revision
surgery/explant rate/device failure and mortality. For measurements of safety and
effectiveness as well as quality of life related outcomes, systematic reviews and clinical studies
including randomized and nonrandomized comparative studies, Case-control studies,
controlled/not controlled before-and-after studies (CBAs and nCBAs) and interrupted time
series (ITS) analyses) have been included in the analysis. Non-systematic reviews, case
reports, letters, editorials, and animal, in-vitro and laboratory studies have been excluded. A
summary of the PICOS is presented in Table 7. Although non-randomized studies may be
more prone to bias, randomized trials may not always be possible or practical. For example, it
seemed unlikely that randomized controlled trials (RCT) have been conducted and therefore
RCTs were not available for inclusion.
As agreed by the Protocol Advisory Subcommittee (PASC) of MSAC in their advice and final
DAP (August 2014) the following outcomes are presented in the submission to address the
review questions:
Effectiveness outcomes:
SUBJECTIVE: (patient outcomes)
Abbreviated Profile of Hearing Aid Benefit (APHAB)quantifies the disability caused by hearing loss, and the reduction of that disability
achieved with hearing aids. The APHAB uses 24 items covering 4 subscales: ease of
communication, reverberation, background noise, and aversiveness to sounds. The
62
B. SYSTEMATIC EVALUATION OF THE EVIDENCE FOR THE PROPOSED MEDICAL DEVICE
APHAB has been normed on 128 elderly adults with mild to moderate hearing loss. The
APHAB can be downloaded from the University of Memphis Hearing Aid Research Lab
(HARL) web site (www.ausp.memphis.edu/harl/applications.html).
Client-orientated scale of improvement (COSI)is an open-ended scale in which the patient targets up to five listening situations for
improvement with amplification. The patient is able to choose up to 5 listening situation
from a list of 16. The COSI was normed on 1770 adults with hearing loss in Australia.
The goal of the COSI is for the patient to target up to five specific listening situations and
report the degree of benefit obtained compared to that expected for the population in
similar listening situations. Many hearing aid manufacturers now include the COSI in their
fitting software. The COSI can be downloaded for free from the NAL web site
(http://www.nal.gov.au/nal_products front page.htm).
Glasgow Hearing Aid Benefit Profile (GHABP) examines six dimensions of outcome including disability, handicap, hearing aid use,
benefit, satisfaction, and residual disability. The GHABP consists of four predetermined
and four patient-nominated items. The GHABP was normed on 293 adults. Based on the
normative findings, it is an appropriate instrument for clinicians who want to use self-
report data to measure improvement in audibility. The Hearing Aid Benefit Interview, a
completely open-ended questionnaire, is the precursor to the GHABP.
Glasgow Benefit Inventory (GBI) measures the change in health status produced by surgical interventions (here, "health
status" is the general perception of well-being, including total psychological, social, and
physical well being). The GBI is generic and *not* limited to audiological or ENT use. The
GBI is a post-intervention questionnaire which assesses the interventions effects on the
health status of the patients. The questionnaire contains 18 questions which can be
completed either in an interview or filled-in by the patient.
Profile of Hearing Aid Performance (PHAP)consists of 66 items measuring two aspects of hearing aid performance: 1) speech
communication in a variety of everyday listening situations, and 2) reactions to loudness
or quality of environmental sounds in seven subscales. The goal of the PHAP is to
measure aided performance rather than benefit. Normative data for test-retest reliability
were completed on 30 subjects.
63
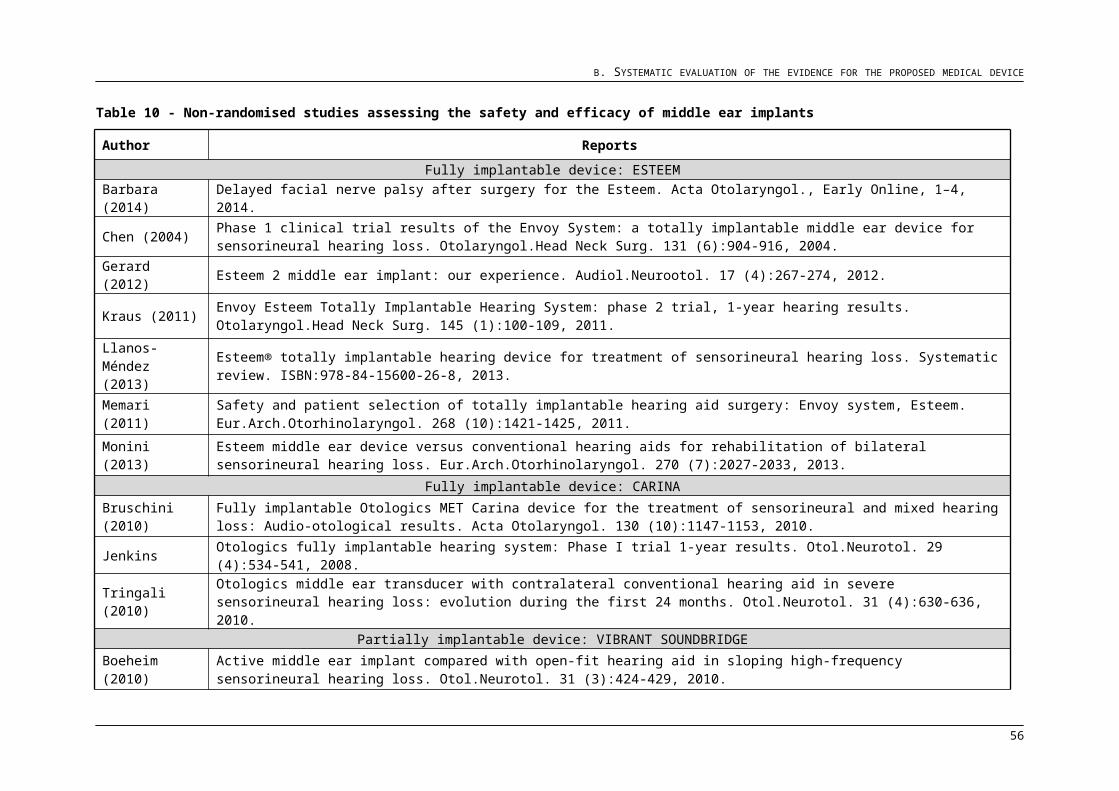
B. SYSTEMATIC EVALUATION OF THE EVIDENCE FOR THE PROPOSED MEDICAL DEVICE
Profile of Hearing Aid Benefit (PHAB)consists of 66 items in seven subscales including familiar talkers, ease of communication,
reverberation, reduced cues, background noise, aversiveness of sounds, and distortion of
sounds. The goal of the PHAB is to measure hearing-aid benefit (unaided vs. aided)
across those seven dimensions. The PHAB has been normed on 42 hearing aid users.
Patient preference
Self-assessment scales (not indicated in the DAP)
AUDIOLOGICAL:
Functional gain
Is defined as the difference in sound field thresholds (AC) from unaided to aided
listening conditions and is an indicator of functional benefit from an amplification
device (measurements performed at different frequencies).
Speech audiometry (ie Speech recognition, Speech comprehension scores, SPR
treshold).
Is often carried out in free field. The most accepted measures for speech thresholds
are the Speech Recognition Threshold (SRT) and the Speech Detection Threshold
(SDT). The most common materials for speech recognition testing are the
monosyllabic words, the Central Institute of the Deaf W-22 (CID W-22) and the
Northwestern University-6 (NU-6) word list. There are other materials available for
speech testing, ie nonsense material and sentence material. The two sentence
procedures that are popular are the Hearing In Noise Test (HINT) and the QuickSIN.
Other sentence tests that are available that have particular applications are the
Synthetic Sentence Identification test (SSI), the Speech Perception and Noise test
(SPIN), and the Connected Speech test. Quiet vs. Noise testing in speech
recognition testing is another important factor to be measured. The effects of
sensorineural hearing loss beyond the threshold loss, such as impaired frequency
resolution or impaired temporal resolution, makes speech recognition performance in
quiet a poor predictor for how those individuals will perform in noise. Speech
recognition in noise is being promoted by a number of experts because adding noise
improves the sensitivity of the test and the validity of the test. Giving the test at
several levels will provide for a better separation between people who have hearing
loss and those who have normal hearing. Individuals with hearing loss have a lot
more difficulty with speech recognition in noise than those with normal hearing, and
64
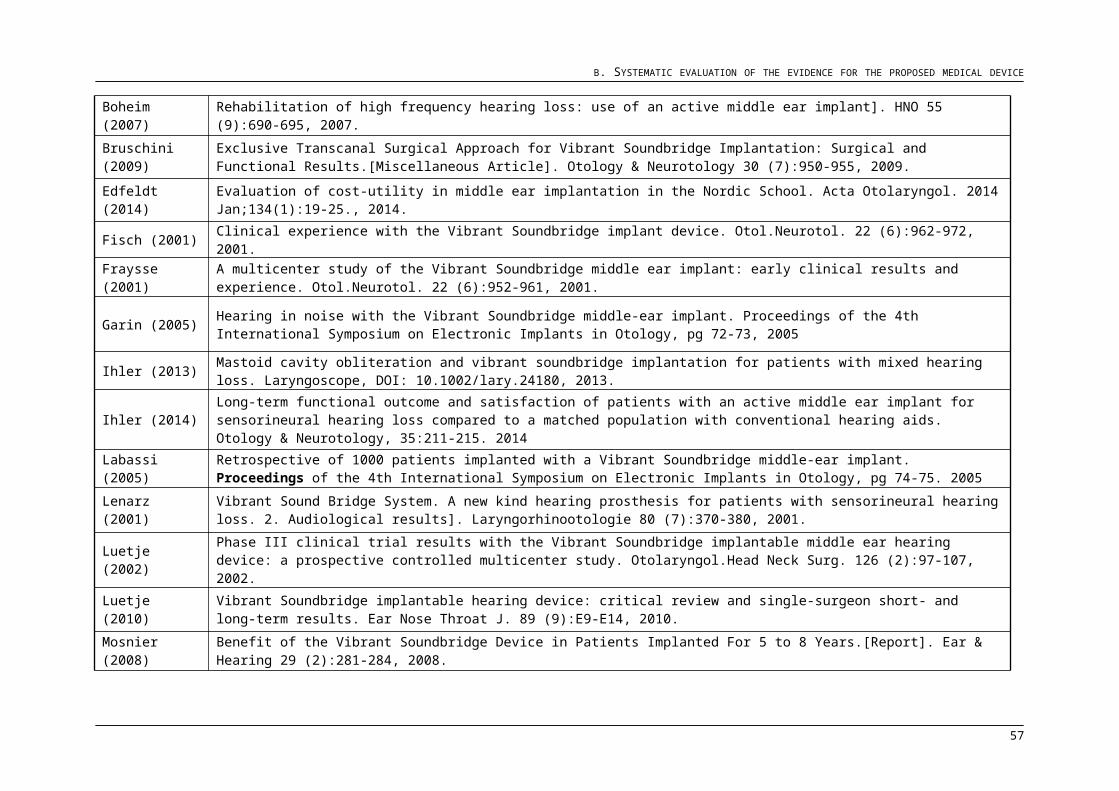
B. SYSTEMATIC EVALUATION OF THE EVIDENCE FOR THE PROPOSED MEDICAL DEVICE
that those with sensorineural hearing loss often require a much greater signal-to-
noise ratio (SNR), 10 to 15 better, than normal hearers.
Sound-field assessment
Stimuli are presented through loudspeakers and the testing is described as being
performed “in (the) soundfield.” The soundfield can compromise different settings: ie
free sound field, diffuse sound field or quasi-free sound field. It is important to
recognize that soundfield audiometric testing is not ear-specific. That is, thresholds
obtained by presenting the stimulus via loudspeakers will be heard by the better-
hearing ear, should one ear hear better than the other. For example, an individual
may have normal hearing in one ear and a mild to moderate hearing loss in the other
ear. When tested in soundfield this individual will hear and respond to pure tones
presented at 20 dB HL or lower. A unilateral hearing loss cannot be assessed using
soundfield testing.
Safety outcomes:- Complications
- Adverse events
- Infection rates
- Taste disturbance
- Fibrosis
- Aural fullness
- Acoustic trauma
- Dizziness
- Damage to the middle ear
- Revision surgery
- Explant rate
- Device failure
- Mortality
65
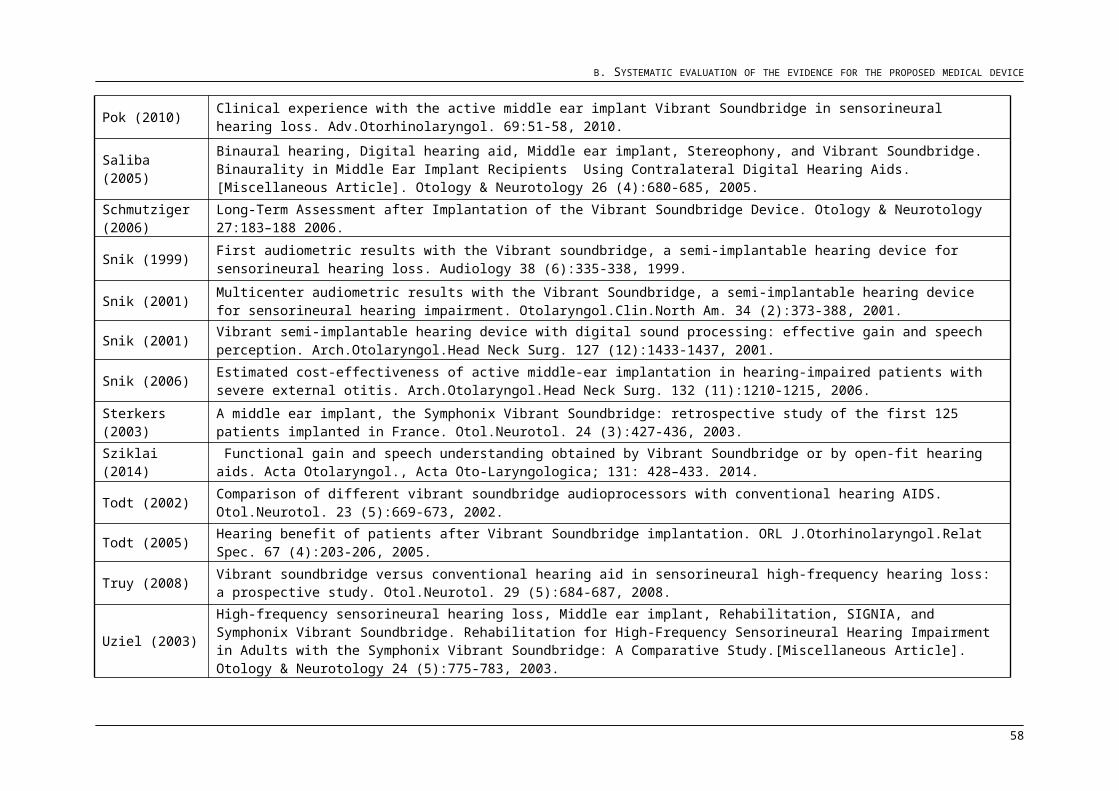
B. SYSTEMATIC EVALUATION OF THE EVIDENCE FOR THE PROPOSED MEDICAL DEVICE
B.6 Systematic overview of the results of the non-randomised studies
B.6.1 Efficacy outcomes
This section presents the evidence for the effectiveness of partially-implantable MEI in
treating patients with sensorineural hearing loss and a medical condition in the outer ear
preventing the use of conventional hearing aids. This will be followed by the evidence for
comparable MEI in treating patients with a sensorineural hearing loss only.
Functional gain16 studies measured the functional gain of the Vibrant Soundbridge in a total of 377 adult
patients. Functional gain was calculated using the hearing thresholds at 0.5, 1, 2 and 4 kHz;
and the mean gain measured by individual studies ranged from 9.5 dB to 33.4 dB. The
pooled average was 24,04 dB (SD 6,51 dB). Considering a difference of 10 dB or more
indicating a clinically significant shift in hearing thresholds, it can be said that the VSB leads
to significantly better hearing compared to unaided hearing. The results of individual studies
is presented in Table 16 - Functional gain VSB.
Table 16 - Functional gain VSB
author n follow up
PTA calculation
unaided Thresholds Device Thresholds
Functional Gain (unaidedmean -
devicemean)
mean [dB] sd mean
[dB] sd range
sd
mean [dB] sd p
Böheim 2010
10
5-56 months
no information 45.6 - 32.75 - - - 12.85 - -
Böheim 2007 9 6 months PTA4 - - - - - - 26 - -
Fraysse 2001
25
6-22 months PTA4 - - - - - - 27 12-15 -
Ihler2013
10
1.3–37.5 months PTA4 - - 37.6 13.
9 - - 9.5 10.6 -
Ihler2014
10
6.5 - 60 months
no information - - 29.9 8.7 - - 25.2 8.6 -
Lenarz 2001
12 6 months PTA4 - - - - - - 32 - -
Luetje 2002
53
18 weeks PTA3 - - - - - - 33.4 - -
Mosnier 2008
77 1-11 yrs. PTA4 - - - - - - 26 - -
Pok2010
54
not stated
PTA (all freq.) - - - - - - 25.3 - -
66
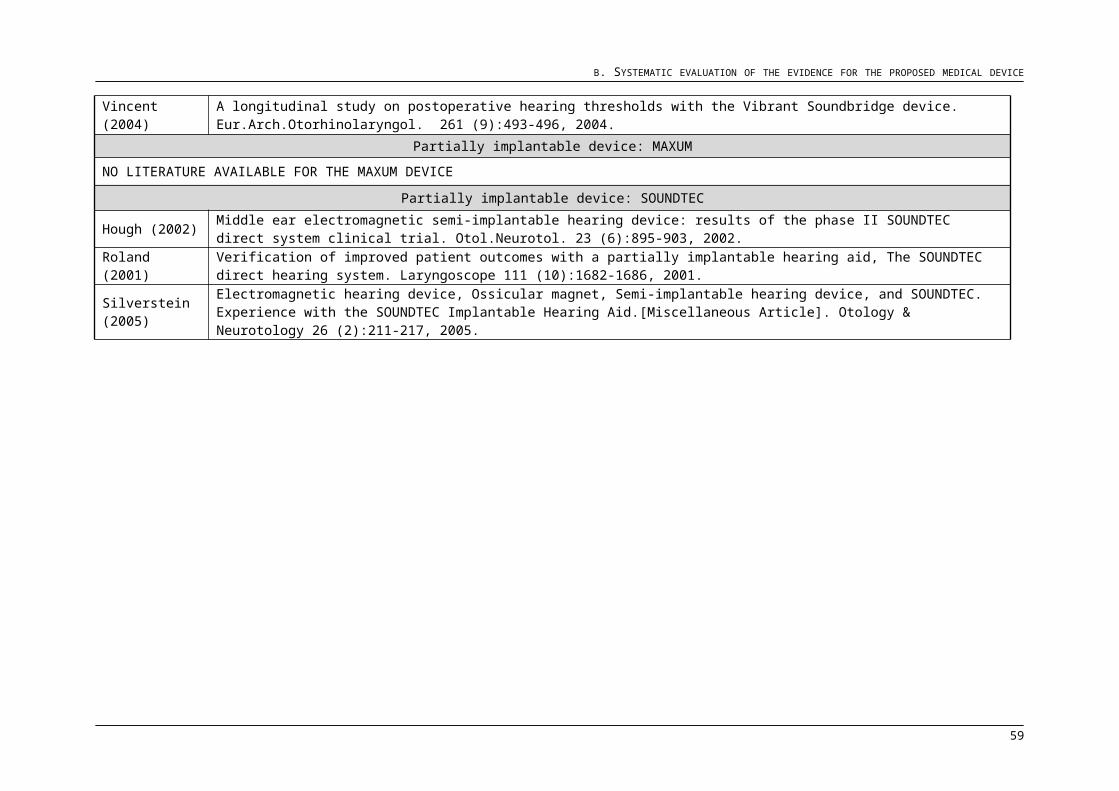
B. SYSTEMATIC EVALUATION OF THE EVIDENCE FOR THE PROPOSED MEDICAL DEVICE
Saliba 2005 8 5-8
weeks PTA4 - - - - - - 18 9.7 -
Sterkers 2003
75
not stated PTA4 - - - - - - 27 12-16 -
Todt2005
7 not stated PTA4 - -
- - - - 22.8 6.5 -16 - - - - 29.8 2.9 -
Todt 2002 5 not
statedPTA (all freq.) - - - - - - 24.3 -
Uziel 2003 6 not
stated PTA4 54.75 29.1 33.25 20.3 21.5 6.9 -
3 studies measured the functional gain of the SOUNDTEC, partially implantable MEI
including 182 adults. The functional gain was measured using the SF thresholds at 0.5,1,2,
and 3 kHz and one study (Silverstein 2005) measured at 0.25 kHz – 6 kHz. Neither unaided
nor aided threshold were reported. The reported mean functional gain was presented in
graphs ranging from 24.25dB – 40.25dB resulting in a mean of 28.74 dB (SD 7.71dB). The
results of individual studies is presented in Table 17.
In total 9 publications for fully implantable devices could be deducted from literature. 3 are
Esteem system and 6 Carina device related studies. In 7 studies the functional gain of the
fully implantable middle ear implants in a total of 127 adult patients was measured.
Functional gain was calculated using different hearing thresholds (0.5, 1, 2 and 4 kHz; 0.5, 1,
2 and 3 kHz; 0.5, 1, 2 kHz; 0.25 – 8 kHz) and the mean gain measured by individual studies
ranged from 11.2 dB to 40.25 dB. The pooled average was 24.94 dB (SD 9.65 dB). The
results of individual studies is presented in Table 17.
67
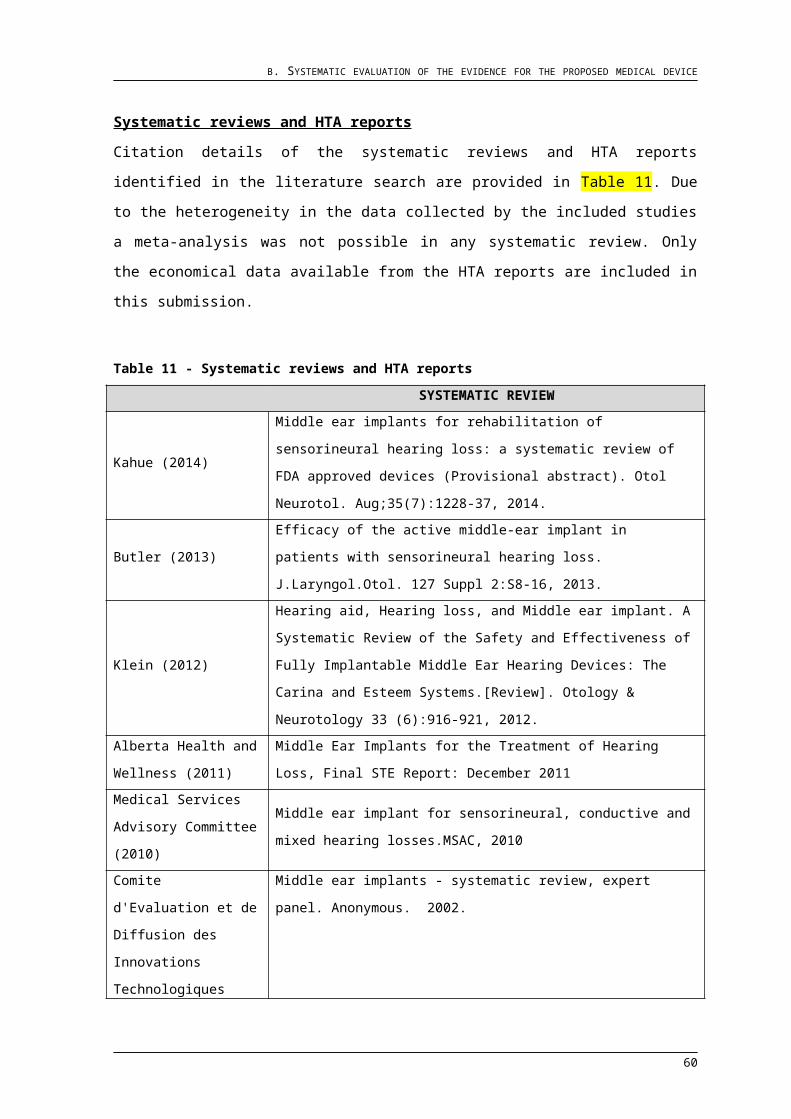
B. SYSTEMATIC EVALUATION OF THE EVIDENCE FOR THE PROPOSED MEDICAL DEVICE
Table 17 - Functional gain comparator
author n follow up PTA calculation
unaided Thresholds Device Thresholds
Functional Gain (unaidedmean -
devicemean)
mean [dB] sd mean
[dB] sd range sd mean [dB] sd p
Chen2004, Esteem 5 4 months SF .5-1-2-3 kHz 62.25 - 54.25 - - - 14.75 - -
Gerard2012*, Esteem 13 not stated PT ,25 to 8 kHz 66.84 - 41.77 - - - 25 11 -
Monini2013, Esteem 15 3 months SF,125-8 kHz - - - - - - 30 -
Memari2011, Esteem 10 19-40 months SF 0,25-0,5-1-2-4
kHz - - - - - - 11.2 9.61 -
Kraus2011, Esteem 48 12 months SF .5-1-2 - - - - - - 27 -
Bruschini2010, Carina 7 12-21 months SF .5-1-2-3 kHz 62.18 6.26 35.78 4.28 11.25-36.25 8.49 26.4 8.49 p < ,05
Jenkins2008, Carina 12 months NO DATA REPORTED
Tringali2013* , Carina 7 24 months SF .5-1-2-3 kHz - - - - - - 40.25 -
Hough2002*, SOUNDTEC 95 4-5 months SF .5-1-2-3 kHz - - - - - - 24.45 -
Roland2001*, SOUNDTEC 23 6 months SF .5-1-2-3 kHz - - - - - - 24.25 -
Silverstein2005, SOUNDTEC 64 3 months SF 0.25 - 6 kHz - - - - - - 26 -
* estimated from figuresSF: Sound field PT:Pure tone
68
B. SYSTEMATIC EVALUATION OF THE EVIDENCE FOR THE PROPOSED MEDICAL DEVICE
Speech recognition/comprehension scores16 studies measured speech recognition in quiet using several different speech tests; with
the most frequently used ones being Freiburger monosyllabic word lists and French Fournier
disyllabic word lists presented at 65 dB SPL. 11 studies covering 192 patients assessed the
word recognition score (WRS) when aided with the VSB and indicated a mean WRS of 57%
to 89%. The pooled average across studies was 73.6% (SD 12%). A meta-analysis was
possible for seven studies that provided full dataset for aided and unaided performance. The
results and the forest plot are given in Fig 10 - Meta-analysis VSB. A random-effects model
was chosen due to the test of heterogeneity showing significant results. The mean
improvement in the WRS was 35.69% (95% CI levels, 29.23 - 42.15) demonstrating an
overall significant of the VSB. Please see Table 18 - Speech in quiet VSB
Fig 10 - Meta-analysis VSB
Table 18 - Speech in quiet VSB
speech in quiet Baseline unaided Initial testing/activation
WRS Test unaided aided
author mean [dB] sd n mean [dB] sd n
Boeheim 2010 Freiburger mono 26,3 27,4 10 63 17,2 10
Boeheim 2007 Freiburger mono 32,5 26,5 9 58 20 9
Ihler2013 Freiburger mono 47,9 26,9 10 83,6 6,3 10
Ihler2014 Freiburger mono 26 21,7 10 66 23,2 10
69
B. SYSTEMATIC EVALUATION OF THE EVIDENCE FOR THE PROPOSED MEDICAL DEVICE
Lenarz 2001 Freiburger mono 28 - 7 63 - 7
Pok2010 Freiburger mono 30 - 54 57 - 54
Todt2005 Freiburger mono - -
7 75 10,4 7
16 73 8 16Todt2002 Freiburger mono 56 7,8 5 86 4 5
Mosnier 2008 Freiburger mono 37 7,1 27 81 5,3 27
Sterkers 2003 Freiburger mono 56 6,5 37 89 4 37
SRT Test unaided aided
author mean [dB] sd n mean [dB] sd n
Uziel 2003 French fournier - - 6 32,5 - 6
Saliba 2005 French fournier 58 6,8 8 44 8,2 8
Fraysse 2001 French fournier 62 - 25 50 - 25
WRS outcomes in quiet for SOUNDTEC, partially implantable MEI including were reported in
2 studies using NU-6 word testing (n=159 Patients). Baseline/unaided and 3 months
outcomes were reported with a mean of 43,9 dB (SD 51.05; 7.8 -80) and a mean of 78.05 dB
(SD 5.73; 82.1 – 74). Please see Table 19 - WRS; Speech in quiet comparator.
8 studies measured word recognition score (WRS) in quiet using several different speech
tests (CID W-22 word list at 50 dB; Lafon bisyllabic words at 50 dB; disyllabic words at 65
dB; Italian disyllables at 65 dB; Fournier word lists; CNC words); with the most frequently
used ones being Lafon bisyllabic words lists and CID W-22 word list, presented at 60 dB SPL
and 50 dB SPL respectively. One study (Barbara 2011) did not give any details regarding
test used. 51 patients assessed with the WRS when aided with the Device (Carina or
Esteem) resulted in a mean WRS of 77.75% (SD 11.15). The unaided score for 92 patients
resulted in a mean WRS of 23.72 % (SD 10.46). Resulting in a mean improvement in the
WRS of 54.03%. Data summarized in Table 19 - WRS; Speech in quiet comparator.
The 50% speech recognition threshold (SRT) was also investigated in three studies using the
French Fournier disyllabic word lists. Fraysse et al. (2001) and Saliba et al. (2005) measured
the SRT in the unaided and aided conditions and demonstrated an improvement of 14 dB
and 12 dB, respectively. With the VSB switched on, patients achieved an SRT of 44 dB and
50 dB. Statistical testing indicated that the differences observed was significant. In another
70
B. SYSTEMATIC EVALUATION OF THE EVIDENCE FOR THE PROPOSED MEDICAL DEVICE
study, Uziel et al. (2003) measured an aided SRT of 32.5 dB in six subjects, but did not
compare the results to unaided values. Details in Table 18 - Speech in quiet VSB
No SRT measurements in quiet for the SOUNDTEC device were performed.
The 50% speech recognition threshold (SRT) in quiet was also investigated in three studies
using CID W-22 word lists and Fournier word lists. The unaided mean SRT was 69.47 dB
(SD 15.69) and with the devices switched on, patients achieved a mean SRT of 43.7 dB (SD
11.03). In the study by Tringali et al. (2013) the measured an aided SRT was 57 dB at the
initial testing and 44 six months post-op in seven subjects, but did not compare the results to
unaided values. Please see Table 20 - SRT, speech in quiet comparator
71
B. SYSTEMATIC EVALUATION OF THE EVIDENCE FOR THE PROPOSED MEDICAL DEVICE
Table 19 - WRS; Speech in quiet comparator
72
speech in quiet Baseline unaided Initial testing/activation 3 months post-op /
1month post-act
4 months post-op / 2 month
post-act3 months post-act 6 months post-op 12 months post-
op
WRSTest
unaided aided aided aided aided aided aided
authormean [dB] sd n mean
[dB] sd n mean [dB] sd n mean
[dB] sd n mean [dB] sd n mean
[dB] sd n mean [dB] sd n
Barbara et al. 2011 unknown 36 - 18 76 18
no in
form
atio
n
no in
form
atio
n
no in
form
atio
n
no in
form
atio
n
Chen et al. 2004 CID W-22 21 - 5 56 5 47 5
Gerard et al. 2012
Lafon bisyllabic 64 33 13
Lafon bisyllabic 91 11 13
Monini et al. 2013 bisyllbic 18.7 21.7 8 66.2 22,6 8
Kraus et al.2011 CID W-22 10.4 54 69.1 54 68.9 54
Bruschini 2010
Italian disyllables 32.5 7 68.75 7
Jenkins et al. 2008
CNC words 77 20 77 18 78 10
Tringali et al. 2013
Fournier words 80 7 86 7
Hough et al. 2002
NU-6 words
7.8 16.6 82.1 95
Silverstein et al. 2005
NU-6 words
80 3.6CI 64 74 5.4CI 64
B. SYSTEMATIC EVALUATION OF THE EVIDENCE FOR THE PROPOSED MEDICAL DEVICE
Table 20 - SRT, speech in quiet comparator
speech in quite Baseline unaided
Initial testing/activation
3 months post-op / 1month
post-act
4 months post-op / 2 month
post-act3 months post-
act6 months post-
op12 months
post-op
SRTTest
unaided aided aided aided aided aided aided
author
mean
[dB]sd n
mean
[dB]sd n
mean
[dB]sd
n
mean
[dB]sd
n
mean
[dB] sd n
mean
[dB]sd
n
mean
[dB]sd
nChen et al. 2004 CID W-22 62 5
no in
form
atio
n 43
no in
form
atio
n 5 45
no in
form
atio
n 5
no in
form
atio
n
no in
form
atio
n
Kraus et al.2011 CID W-22 58.9 54 30.6 54 29.4 54Monini et al. 2013
bisyllbic words 87.5
13.1 8 56.9 11,6 8
Tringali et al. 2013
Fournier words 57 7 44 7
73
B. SYSTEMATIC EVALUATION OF THE EVIDENCE FOR THE PROPOSED MEDICAL DEVICE
Speech recognition in noise was assessed by ten studies in a total of 140 patients. Several
different speech tests were implemented at different signal-to-noise ratios (SNR), making it
difficult to summarise the results. The full list of outcome is presented in Table 21 - Table
speech in noise VSB. Studies comparing unaided and aided performance demonstrate a
clinically significant improvement in the WRS and SRT with the VSB.
74

B. SYSTEMATIC EVALUATION OF THE EVIDENCE FOR THE PROPOSED MEDICAL DEVICE
Table 21 - Table speech in noise VSB
Speech in noise n Test Speech
levelNoise level SNR Outcome
measure
aided unaided mean changeauthor mean [dB] sd mean [dB] sd
Boeheim 2010 10 OLSA
sentences adaptive 60 dB various SRT dB -1,5 1,4 4,8 5,3 6,3
Böheim 2007 9 Döring
sentence test
80 dB 60 dB 20% word score
63,3 - 35,6 - 27,7
65 dB 60 dB 5 27,8 - 9,4 - 18,4
Garin2005 9 Fournier french
words
50 dB 55 dB 5
% word score
86 18 62 28 24
55 dB 55 dB 0 69 27 37 26 32
60 dB 55 dB -5 40 28 15 26 25Lenarz2001 7 Göttinger
sentences 65 dB 55 dB 10 % word score 62 - 28 - 34Luetje2002 53 R-SPIN - - 8 % word score NS - - - -
Saliba2005 8 Fournier french
words adaptive 65 dB various SRT dB 54 5,8 61 7,5 7Schmuziger 2006 10 Basler
sentences 70 dB adaptive various dB SNR for SRT50 5 - 6,2 - 1,2
Todt2005
7 Freiburger monosyllables 65 dB 60 dB 5 % word score
59,3 11,5 - - -
16 65,7 10,1 - - -Todt2002 5 Freiburger
monosyllables 65 dB 60 dB 5 % word score 74 9 - - -Uziel2003 6 Fournier french
words adaptive 60 dB various % word score NS - - - -NS: not stated
75
B. SYSTEMATIC EVALUATION OF THE EVIDENCE FOR THE PROPOSED MEDICAL DEVICE
One study measured speech recognition in noise for the SOUNDTEC device (Hough 2002).
The test used was the Speech Perception and Noise test (SPIN) under monaural listening
condition. In total 95 patients participated, but only a gain of 0.1 was reported, no further
details stated.
Speech recognition in noise for the fully implantable devices, Carina and Esteem was
assessed in 3 studies, with a total of 48 patients. Several different speech tests were
implemented at different signal-to-noise ratios (SNR), making it difficult to summarise the
results for the Esteem and Carina outcomes. The full list of outcome is presented in Table 22
- Speech in noise comparator. Furthermore there is no unaided performance measurement,
making it difficult to draw assumptions regarding improvement of speech in noise.
76
B. SYSTEMATIC EVALUATION OF THE EVIDENCE FOR THE PROPOSED MEDICAL DEVICE
Table 22 - Speech in noise comparator
disyllables in noise Listening condition un-aided
3 - 4 months 6 months 12 monthsauthor Test mean [dB] sd n mean [dB] sd n mean [dB] sd n
Chen 2004Esteem HINT
S0N0
no in
form
atio
n
only one remaining patient for HINT test, series of 5 graphs as statet in text not availableS0NRS0NL
Gerhard 2012Esteem
Lafon bisyllabic
SNR +10 85 14
no in
form
atio
n
no in
form
atio
n
SNR +0 71 19SNR -5 64 30
Jenkins 2008Esteem
HINT S0N05,2 20 9,3 18 3,6 10
Hough 2002 SOUNDTEC
SPIN monaural n = 95 , only reported a gain of 0.1
77
B. SYSTEMATIC EVALUATION OF THE EVIDENCE FOR THE PROPOSED MEDICAL DEVICE
Self-assessment scales/patient preferenceTwelve studies were identified that assessed the subjective benefit of the VSB in a total of
398 patients. Most studies implemented only one self-assessment scale, while three studies
implemented several. Six different scales were used by the different studies, the most
common ones being the (Abbreviated) Profile of Hearing Aid Benefit ((A)PHAB) and Glasgow
Benefit Inventory (GBI). In all studies, patients were asked to fill in these questionnaires at
one time point post-operatively. Other tests included the Hearing Device Satisfaction Scale
(HDSS) and the Soundbridge Hearing Aid Comparison Questionnaire (SHACQ) which are
designed for comparing two different hearing devices. Summary of the data is shown in
Table 23 - Subjective outcomes VSB.
APHAB: Six studies covering 130 patients reported on the outcomes of the APHAB. One of
these studies by Luetje (2002) reported on the number of individuals indicating an
improvement on the different subscales of the PHAB, therefore this study was excluded from
data synthesis. The data from the remaining five studies were pooled together and are
presented in Table 24 - Subjective outcomes VSB pooled. The summary data demonstrate
that patients` experienced more difficulty in understanding speech in background noise and
less difficulty in the ease of communication.
78
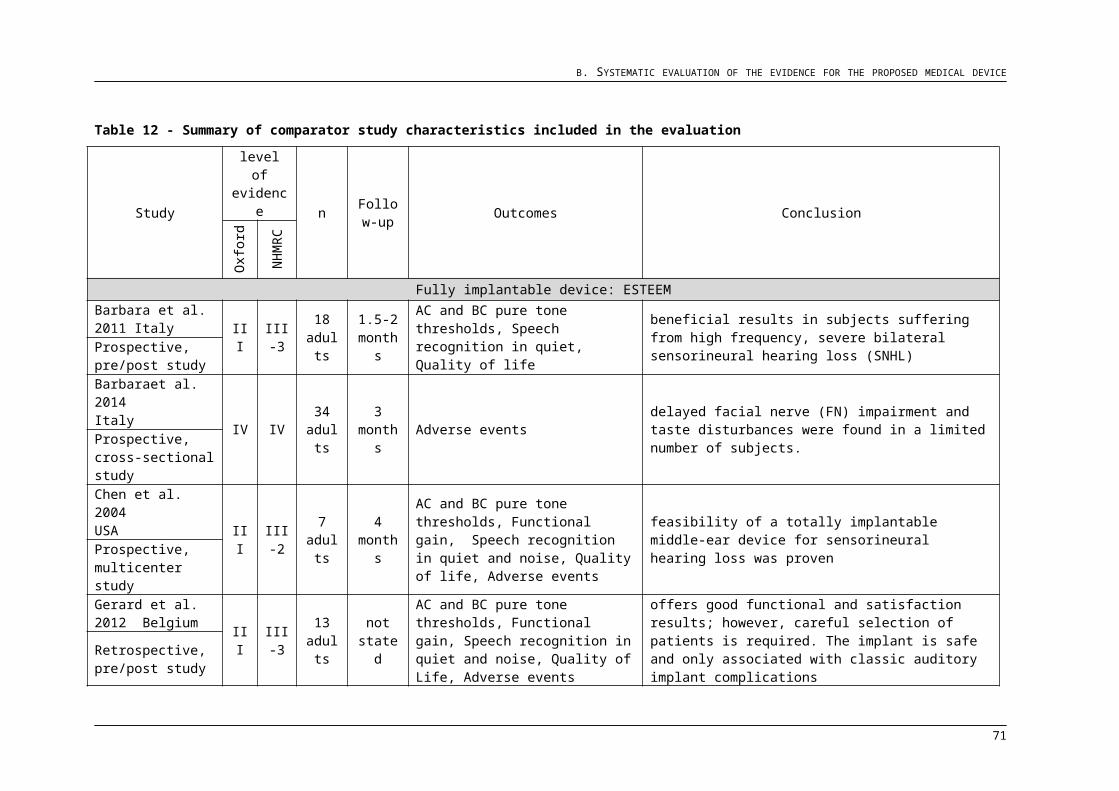
B. SYSTEMATIC EVALUATION OF THE EVIDENCE FOR THE PROPOSED MEDICAL DEVICE
Table 23 - Subjective outcomes VSB
authors n Tests used(A)PHAB for VSB GBI for VSB GHABP
BN RV EC AS Total General Social PhysicalUnaided Aided
mean sd mean sdFraysse2001 25 APHAB 39 35 22 21
Lenarz2001 34 PHAB 47 45 28 29
Luetje2002 53
PHAB, HDSS, SHACQ
Mosnier2008 77 GBI 17.8 22.8 14.1 1.7
Saliba2005 8 APHAB 48 47 33 33
Schmutziger 2006 20 GBI 14.7 22.1 5 -5
Snik2006 21 GBI, NCIQ,
SF-36 33.9 41.5 15.7 17.6
Sterkers 2003 125 GBI 18 20 18 2
Todt2002 5 APHAB 25 25 11 26
Uziel2003 5 APHAB,
HDSS 38 21 18 35
Edfeldt2014 15 GHABP 25.7 18,6 96.1 15
Ihler2014 10 GBI 38.3 47.1 11.7 18.4
79
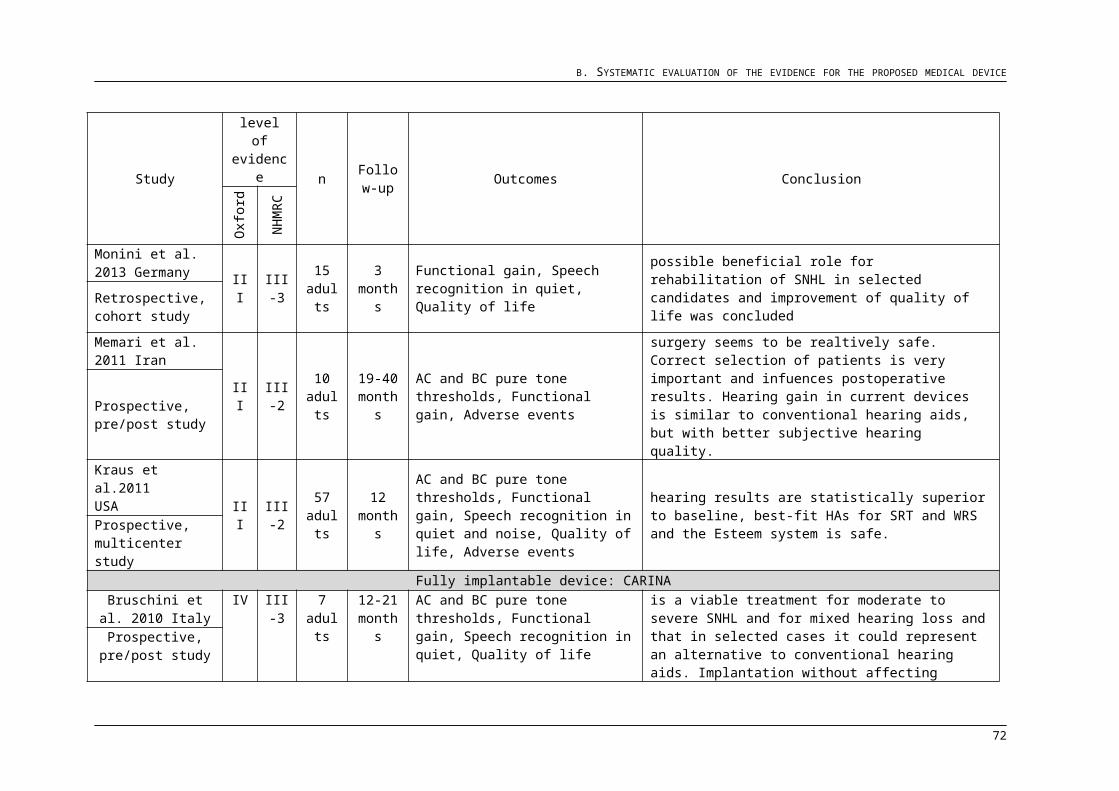
B. SYSTEMATIC EVALUATION OF THE EVIDENCE FOR THE PROPOSED MEDICAL DEVICE
Five studies covering 25 patients reported on the outcomes of the APHAB. The data from
these five studies were pooled together and are presented in Table 23. The summary data
demonstrate that patients` experienced more difficulty in understanding speech in
background noise and less difficulty in the ease of communication.
Table 24 - Subjective outcomes VSB pooled
POOLED VSB DATA
Outcome measure Subscale range mean sd across studies
(A)PHAB
BN 25 to 48 39,4 9,24RV 21 to 47 34,6 11,6EC 11 to 33 22,4 8,56AV 21 to 35 28,8 5,59
GBI
Total 14,7 to 38,3 24,5 10,8General 20 to 47,1 30,7 12,6Social 5 to 15,7 12,9 4,98
Physical -5 to 17,4 6,94 10,48
Three studies (SOUNDTEC) analyses subjective questionnaires such as the APHAB and a
set of custom questions about sound quality, overall satisfaction and recommend to others.
In total 94 patients were investigated for subjective outcomes with partially implantable
SOUNDTEC device. Hough 2002 reported mean improvement of the APHAB questionnaire
outcomes compared to baseline aided scores, but no data was given.
Seven studies were identified that assessed the subjective benefit of fully implantable middle
ear implants (Carina and Esteem), in a total of 51 patients. All studies implemented only one
self-assessment scale, with the most frequently used being the Profile of Hearing Aid Benefit
((A)PHAB). In all studies, patients were asked to fill in these questionnaires at one time point
post-operatively, only one study (Bruschini 2010) provided unaided/ baseline data. Other
tests included the Client-orientated scale of improvement (COSI) and the Glasgow Benefit
Inventory (GBI). Data is summarized in Table 25 - Subjective outcomes comparator
80
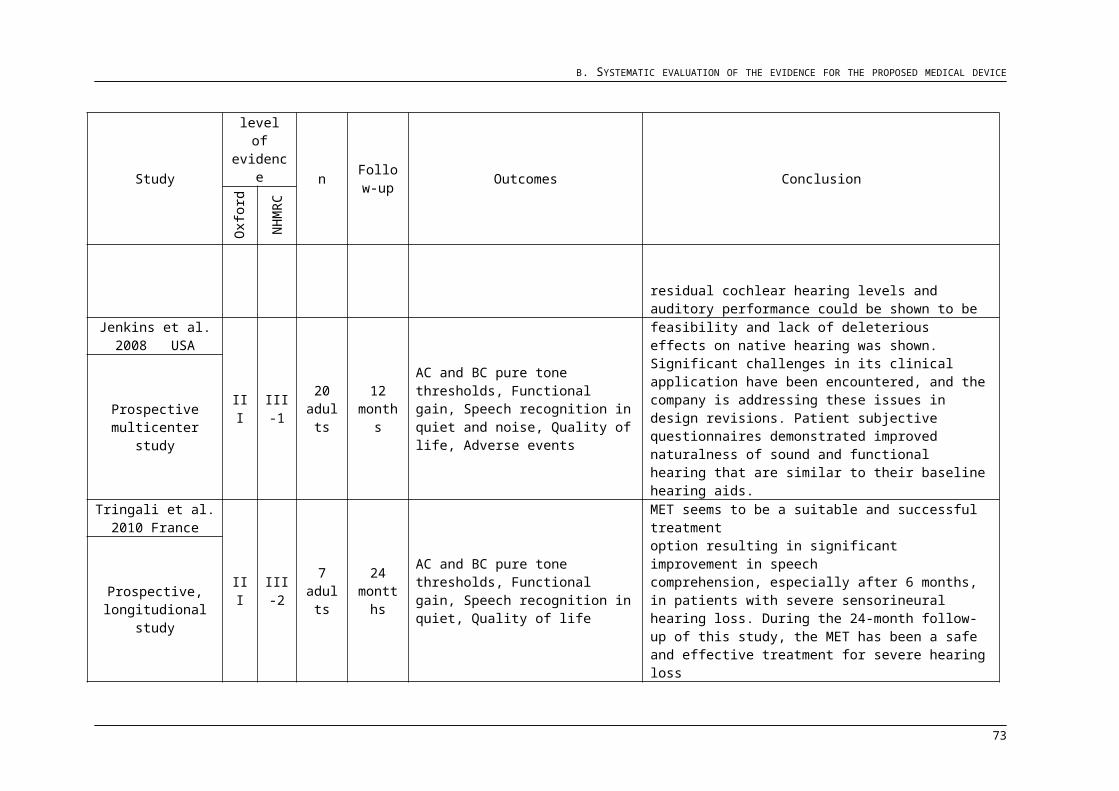
B. SYSTEMATIC EVALUATION OF THE EVIDENCE FOR THE PROPOSED MEDICAL DEVICE
Table 25 - Subjective outcomes comparator
author n (A)PHAB unaided/baseline (A)PHAB for Device 20 weeks to 12 monthsBN sd RV sd EC sd AV sd BN sd RV sd EC sd AV sd Total
Chen2004 5
NO DATA REPORTED 22 - 32 - 25 - -12 - -22# - 32# - 25# - -12# - 28#
Gerard 2012 13
NO DATA REPORTED - - - - - - - - -
Kraus2001
reporting mean improvment compared to baseline aided scores, NO DATA REPORTED
- - - - - - - - -
Bruschini 2010 7
66.08 0.12 78.33 0.11 54.08 0.19 4.33 0.06 19.33* 0.12* 19.83* 0.1* 10.33* 0.09* 2* 0.02* -
Jenkins2008 EXTRACTED FROM GRAPH 38 - 35 - 22 - -32 - -
47# - 40# - 23# - -29# - -Tringali2013 aided with contra HAs compared to unaided - - - - - - - - -
Hough2002 95 34.5 18 36.2 17 33.4 14.2 34.7 12.5 38.8 23.7 44.5 21.7 44.0 21.0 42.4 19.4 -
Roland2001 23 NO DATA REPORTED 41 26 34.8 29 38.2 25.1 28.9
# 12 months and aboveBackground Noise (BN), Reverberation (RV); Ease of Communication (EC), Aversiveness to Sound (AV)
author n GBI score COSI custom questionnairetotal in itinere final score soundquality overall satisfaction recommend to others
Barbara2011 18 8.98 - - - - - - - - - -
- 17.9 19.4 - - - - - - - -Monini2013 8 - - 22.7 - - - - - - - -
Silverstein2006 68 - - - - - - - 2.9/3.3 2.9/3.3 3.0/3.5
Data(SI/AI): Silverstein Institute [SI] and Atkins Institute [AI])
81
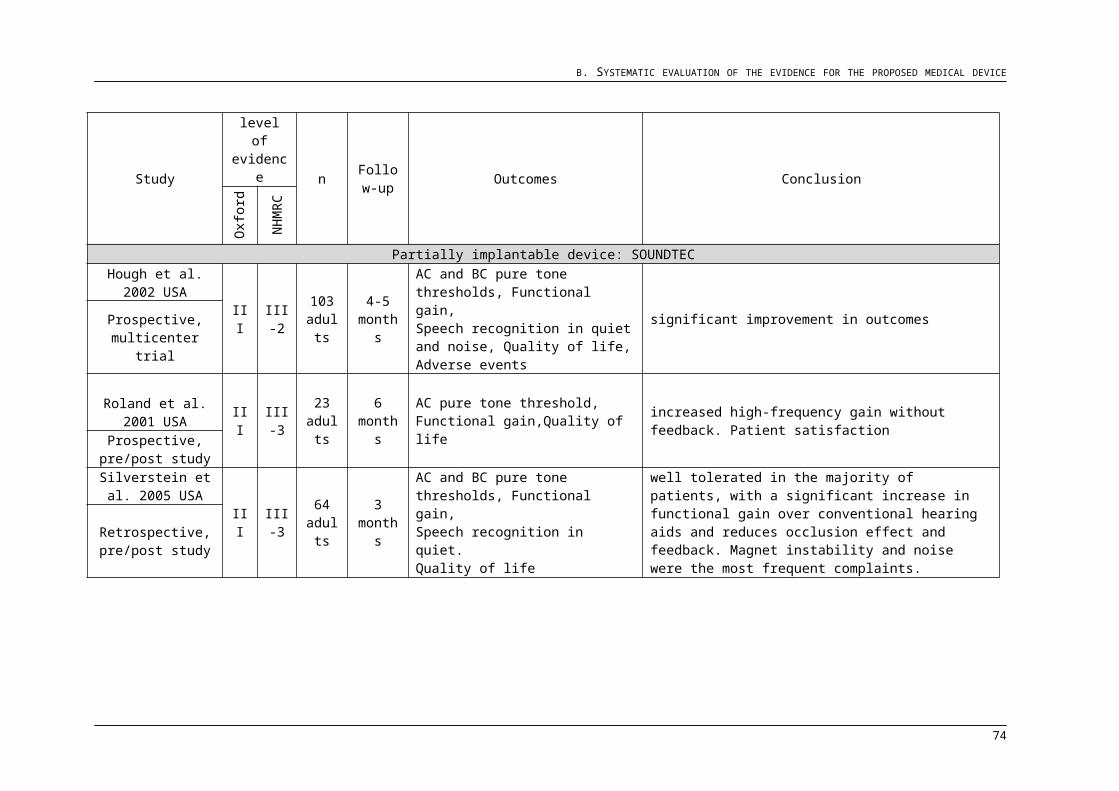
B. SYSTEMATIC EVALUATION OF THE EVIDENCE FOR THE PROPOSED MEDICAL DEVICE
GBI: Five studies covering 253 patients reported on the outcomes of the GBI. The pooled
data across all studies is presented in Table 23 - Subjective outcomes VSB. Results indicate
a significant positive impact of aided hearing on general health. The same, however, cannot
be said for physical and social health where patients report almost no change in health
status.
The GBI score for the SOUNDTEC, given by Barbara 2011 was 8.98. Data is summarized in
Table 25 - Subjective outcomes comparator.
Only one study, reporting on 18 patients presented GBI outcomes (total score of 8.98). The
data had to be extrapolated from the graph and only showed a total score which does not
give any information whether beneficial for the patient or not. The data is presented in Table
25 - Subjective outcomes comparator.
Client-orientated scale of improvement (COSI) : No studies were identified implementing the
COSI in VSB recipients. In comparison, COSI sclaes were used in two studies evaluating the
subjective benefit of fully-implant MEI. Ina group of 18 patients Barbara (2011) measured an
in itinere and final scores of 17,9 and 19,4; indicating an improvement with aided hearing.
Another study by Monini (2013) also found high degree of improvement reaching a final
score of 22.7.
The COSI outcomes for 2 studies (partially implantable SOUNDTEC device) (n=26) for one
itinere timepoint (some time after surgery, not specified) and a final score were 17.9 and
19.4/22.7 respectively.
Two studies were identified implementing the COSI in fully implantable middle ear implant
recipients. In a group of 18 patients Barbara (2011) measured an in itinere and final scores of
17,9 and 19,4; indicating an improvement with aided hearing. Another study by Monini (2013)
also found high degree of improvement reaching a final score of 22.7. Please see Table 25 -
Subjective outcomes comparator
B.6.2 Safety Outcomes
Seven studies covering a total of 1398 patients reported on complications following VSB
implantation. The overall rate of complications is given below, followed by the incidence rate
of the different adverse events. The full list of complications reported in the literature is
presented in Table 26 - Adverse events VSB and Table 27 - Adverse events comparator.
82
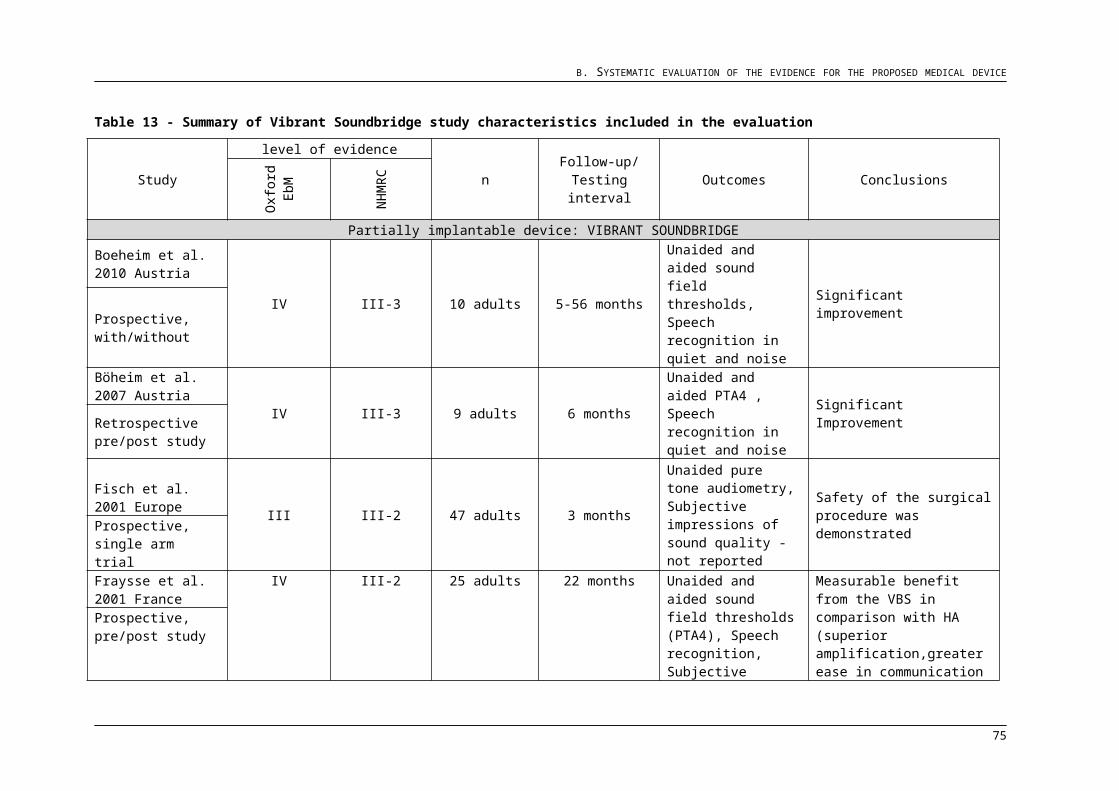
B. SYSTEMATIC EVALUATION OF THE EVIDENCE FOR THE PROPOSED MEDICAL DEVICE
Table 26 - Adverse events VSB
83
Adverse Events VSB reported
Fisch 2001
Fraysse 2001
Labassi 2005
Mosnier 2008
Luetje 2010
Schmuz-iger, 2006
Sterkers 2003
n studies
Total n of subjects n cases
incidence when
reported
incidence across all studies
taste disturbances 6 6 3 7 4 239 26 10,9 1,86middle ear effusion 0 1 95 0 0,00 0,00pain 3 1 2 120 4 3,33 0,29vertigo / dizziness 0 1 95 0 0,00 0,00tinnitus 1 2 1 3 162 4 2,47 0,29facial palsy 0 1 2 3 1172 7 0,60 0,50limited benefit 3 1 95 3 3,16 0,21headaches 2 0 2 115 2 1,74 0,14revision surgery 1 16 12 4 3 5 1278 38 2,97 2,72skin flap problems 9 9 2 1177 18 1,53 1,29implant failure 27 7 2 1177 27 2,29 1,93aural fullnes 21 1 77 21 27,3 1,50complications 8 4 54 55 4 10 12 7 1398 147 10,5 10,52TOTAL EVENTS 47 25 1100 77 34 20 95 1398
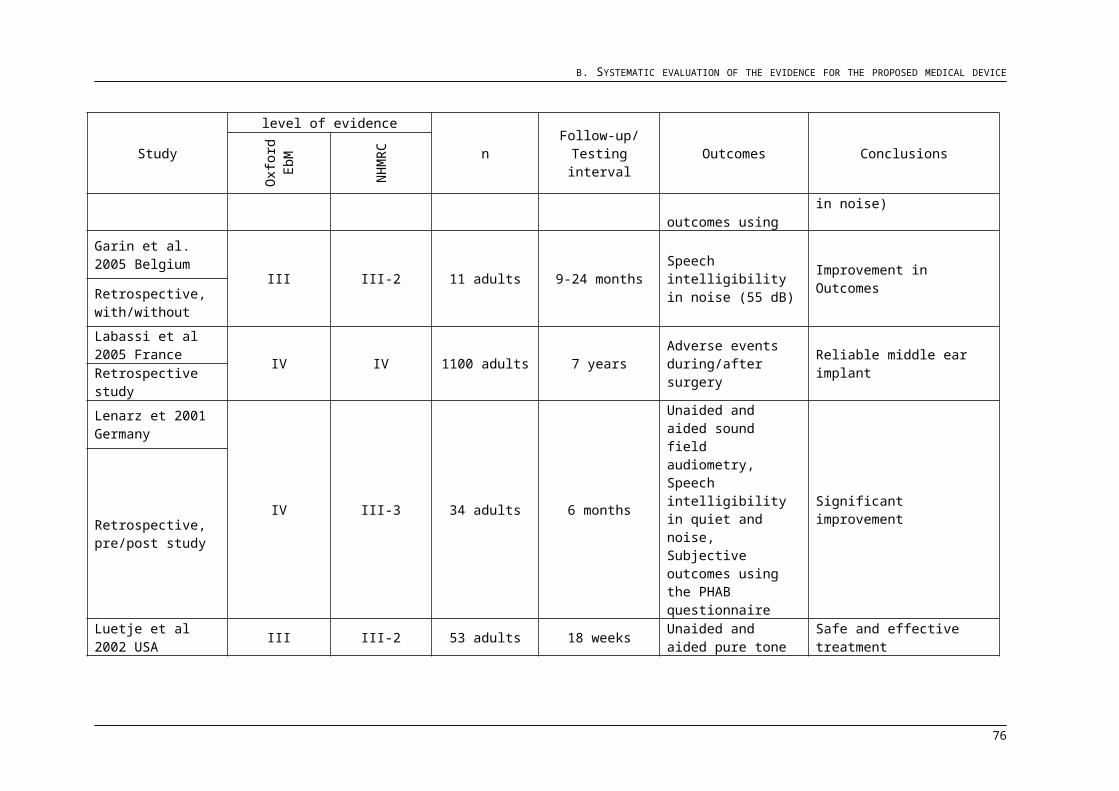
B. SYSTEMATIC EVALUATION OF THE EVIDENCE FOR THE PROPOSED MEDICAL DEVICE
Table 27 - Adverse events comparator
Adverse Events Comparator reported
Barbara 2014
Chen 2004
Gerard 2012
Memari 2011
Kraus 2011 n
studies
Total n subject
s
n subject
s
incidence when reported
incidence in
literature
Jenkins 2008 incidenc
e
Hough 2002 incidenc
eEsteem Esteem
Esteem
Esteem
Esteem Carina SOUNDTE
C
taste disturbances 10 0 1 24 4 111 39 35,1 22,2 2 1,941748
middle ear effusion 18 1 57 18 31,6 10,2 3 15 1
pain 6 12 2 64 18 28,1 10,2 2
vertigo / dizziness 0 11 2 67 11 16,4 6,25 1 5 2 1,941748
tinnitus 1 0 10 3 74 14 18,9 7,95 1 1
nausea 1
facial palsy/facial nerve damage 3 1 2 4 4 111 14 12,6 7,95
limited benefit 5 2 4 3 74 14 18,9 7,95
headaches 1 3 2 67 4 5,97 2,27
skin flap problems 2 1,941748
aural fullnes 2 1 0,970874
wound infection 1 3 0 3 27 7 25,9 3,98
TM perforation 1
external otitis 4 1 7 4 57,1 2,27 1
deterioration in hearing 3 1 10 3 30,0 1,70
miscellaneous 30 1 57 30 52,6 17,0
partial device extrusion 3
implant malfunction/failure 2 1 2 17 3 17,6 1,7 9 45
revision surgery 4 1 2 20 5 25,0 2,84 1 0,970874
explantation 2 1 2 20 3 15,0 1,70 6
TOTAL EVENTS 13 17 8 5 133 5 14 14
N AFFECTED 13 7 8 4 52 84 14 14 13,5922
84
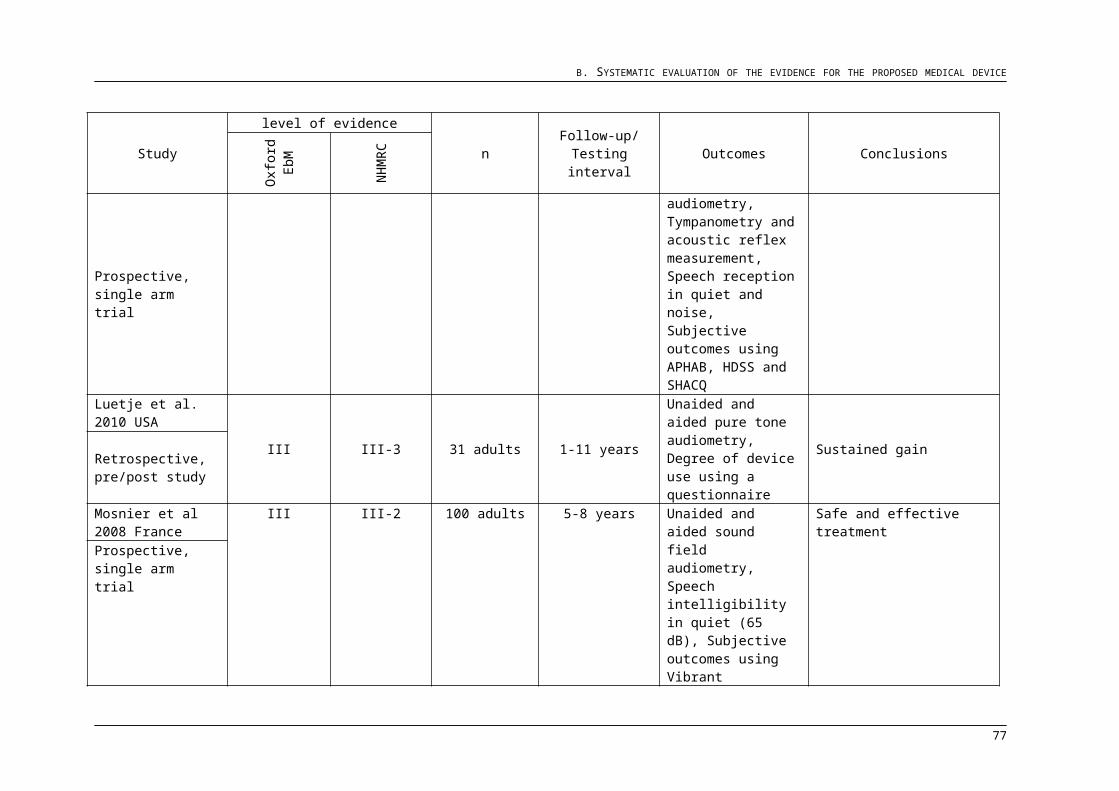
B. SYSTEMATIC EVALUATION OF THE EVIDENCE FOR THE PROPOSED MEDICAL DEVICE
3N SAMPLE 34 7 10 10 57 118 20 103
85

B. SYSTEMATIC EVALUATION OF THE EVIDENCE FOR THE PROPOSED MEDICAL DEVICE
Complications/Adverse events: Complications were observed in 142 patients who
received a VSB, which is equivalent to 10.5% of the overall sample. The incidence of
complications observed for comparable devices were: 71.2% for the Esteem, 70% for the
Carina, and 13.6% for the SOUNDTEC Direct Drive.
Infection rates: Wound infections were not observed with any partially implantable MEI;
but were observed with the Esteem, in which the incidence rate was 3.98%
Taste disturbance: Taste disturbances were reported by 26 patients in four studies,
indicating an incidence of 1.86% in the literature. In comparable devices the incidence
rates were; 22.2% for the Esteem, 0% for the Carina and 1.94% for the SOUNDTEC
Fibrosis: No studies reported on the presence of fibrosis. A few skin flap problems were
observed in two studies, indicating an incidence rate of 1.29% in the literature for the
VSB. The SOUNDTEC partially implantable MEI also lead to skin flap problems in 1.94%
of cases.
Aural fullness: Aural fullness was reported by 21 patients in a single study, resulting in an
incidence of 27.3%. Across all included studies this rate dropped to 1.5%. The incidence
rate for comparable devices were: 0% with the Esteem, 10% with the Carina, and 0.9%
with the SOUNDTEC.
Acoustic trauma: Defined as a damage to the inner ear, acoustic trauma can be
demonstrated by a shift in bone conduction pure tone thresholds. Twelve studies were
found reporting on BC thresholds following VSB implantation. All except one
demonstrated a threshold shift of less than 5 dB. The remaining study demonstrated a
mean shift of 8 dB two years after implantation. A change of 10 dB or less is said to be
clinically not significant. A threshold shift less than 5 dB was also observed in
comparable partially and fully implantable MEI.
Dizziness: Dizziness and/or vertigo was addressed as a potential adverse event by
Sterkers (2003), and was not observed in any of the included 95 patients. Dizziness was
reported following MEI implantation at a rate of 6.25% with Esteem, 5% with the Carina,
and 1.94% with the SOUNDTEC.
Damage to the middle ear: Damage to the middle ear could be demonstrated by an
occurring pathology in the middle ear, or by a shift in air conduction pure tone thresholds.
The occurrence of middle ear effusion was rated by Sterkers (2003), and was not
observed in any of their patients. Pure tone AC thresholds were not examined by any
VSB studies. The incidence of ME effusion observed following comparable devices were:
10.2% with the Esteem, 15% with the Carina, and 0.97% with the SOUNDTEC.
Revision surgery: The rate of revision surgery was mentioned in five studies covering a
total of 1278 patients. Revision surgery was required in 2.72% of cases in the literature,
86
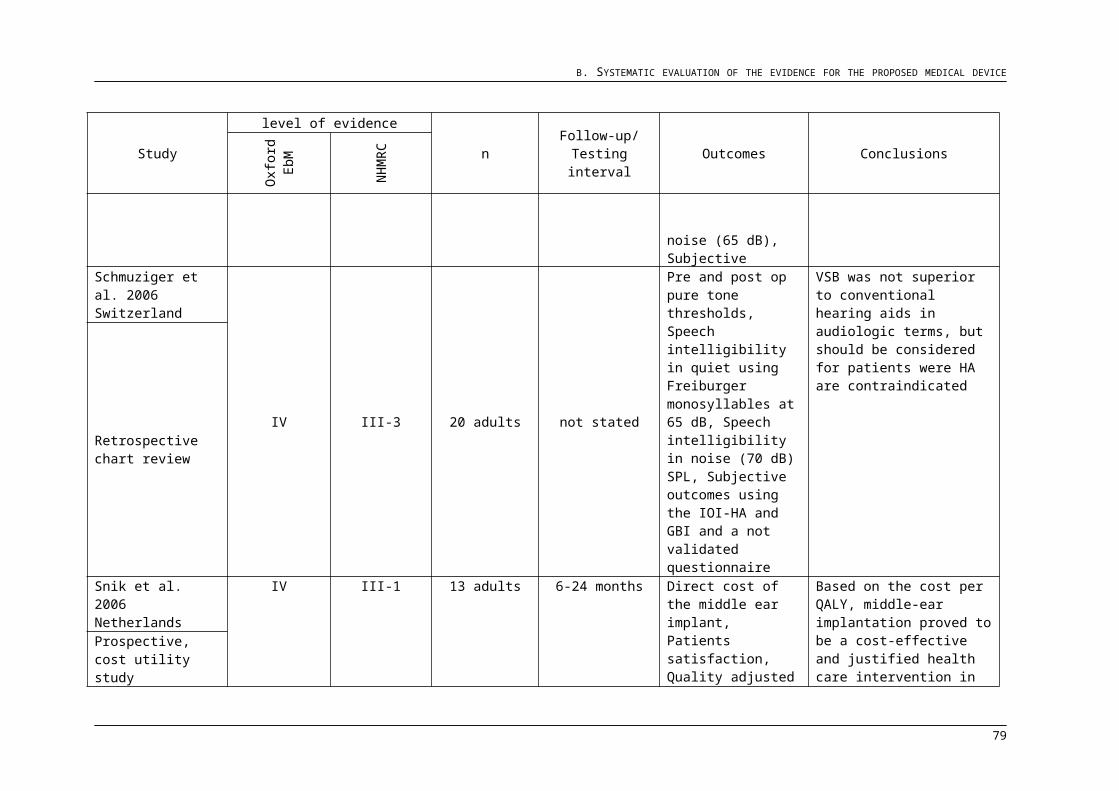
B. SYSTEMATIC EVALUATION OF THE EVIDENCE FOR THE PROPOSED MEDICAL DEVICE
and was mostly due to implant failure. Following implantation of comparable devices
revision surgery occurred at a rate of 2.84% with Esteem and 0.94% with SOUNDTEC.
Device failure and explantation: The rate of device failure and explantation as reported in
two studies was 1.93%. in 1177 patients. In these two studies, Labassi (2005) and
Sterkers (2003) indicated device malfunctions or failures of the first generation models of
the Vibrant Soundbridge, and that very few were observed with second generation
models since 1999. Labassi (2005) further reported a 0.3% failure rate of the new
devices. The incidence of device failure or malfunction for comparable fully implantable
devices were 1.7% for the Esteem and 45% for the Carina. None have been so far
observed with the SOUNDTEC.
Mortality: There was no report of mortality associated with the devices or procedures in
the literature of partially or fully implantable middle ear implants.
B.7 Extended assessment of comparative harms
A comprehensive search strategy was used to identify all studies on MEI, and the
citations found were complemented by a manual search of the study bibliographies.
Bibliographies available from manufacturer websites were also used in this process to
identify any publications that were not found by the online database search. Therefore, it
can be said all relevant publications were included in this submission and no reports on
device safety including patients were missed.
All adverse events associated with the Vibrant Soundbridge have been presented in
section B6. The non-randomized trials included in this section present complications
observed within a short and long-term follow-up after implantation, and have reported on
all complications occurring within the specified time frame. This means that any delayed
adverse event, if occurring, would have been reported. No further complications are
anticipated to occur in association with receiving a MEI.
87
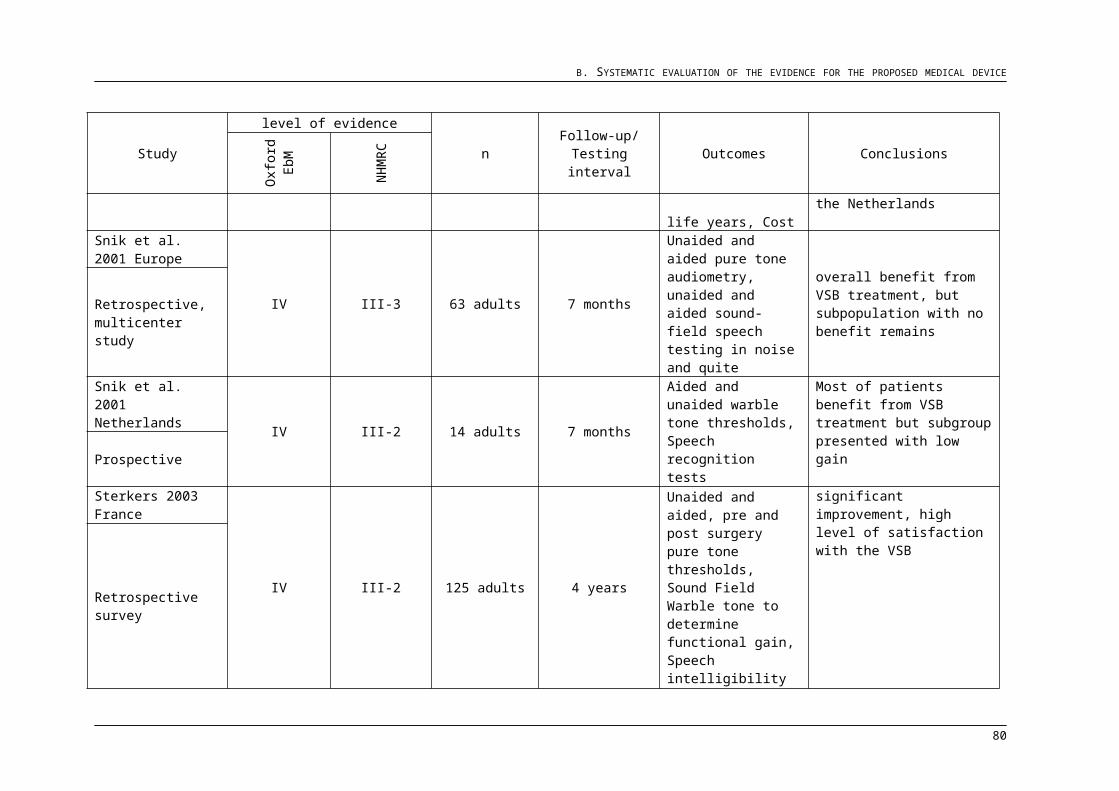
B. SYSTEMATIC EVALUATION OF THE EVIDENCE FOR THE PROPOSED MEDICAL DEVICE
B.8 Interpretation of the clinical evidence
The present review relies on best available evidence on Middle Ear Implants to draw
conclusions about their relative effectiveness and safety.
Overall, an assessment of the study characteristics that could potentially influence test
validity showed that the following studies demonstrated notable characteristics that
differed from all studies:
Memari (Memari et al., 2011) is unique in that it represents a different geographical
location (Iran) and may reflect differences in the provision of health care.
In three studies, Pok et al. (2010), Sziklai et al. (2011) and Gerard et al. (2012), the
length of follow-up was not specified. The first two studies are of prospective
design and it could be assumed that data was collected at initial fitting. The latter is
a retrospective study where a longer follow-up could be assumed (Gerard et al.,
2012;Pok et al., 2010;Sziklai I, 2011).
Keeping these studies in mind, the literature available on middle ear implants
demonstrates that implantation of the VSB:
Results in a significant improvement in sound-field hearing thresholds
Results in significantly better speech recognition/comprehension in quiet and noisy
situations
Leads to few difficulties in understanding speech in relatively easy listening
conditions, as compared to noisy conditions; and improves health in general
Is a safe procedure with minor adverse events resolving on their own or with local
treatment
Assessment of VSB outcomes at a long-term follow-up demonstrate:
A small but non-significant shift in bone conduction thresholds over time
Constant functional gain
Slight decrease in recognition/comprehension over time, yet still significantly better
outcomes than baseline
Sustained subjective benefit
In the field of middle ear implants it can be concluded that the VSB is;
At least as effective as other partially or fully implantable MEI
At least as safe as other partially implantable MEI
Superior in terms of safety in regard to fully-implantable MEI
The evidence base used to reach the conclusions above are summarised in Table 28
with respect to important features of the evidence outlined in Section B.8 of the PBAC
88

B. SYSTEMATIC EVALUATION OF THE EVIDENCE FOR THE PROPOSED MEDICAL DEVICE
Guidelines.
89
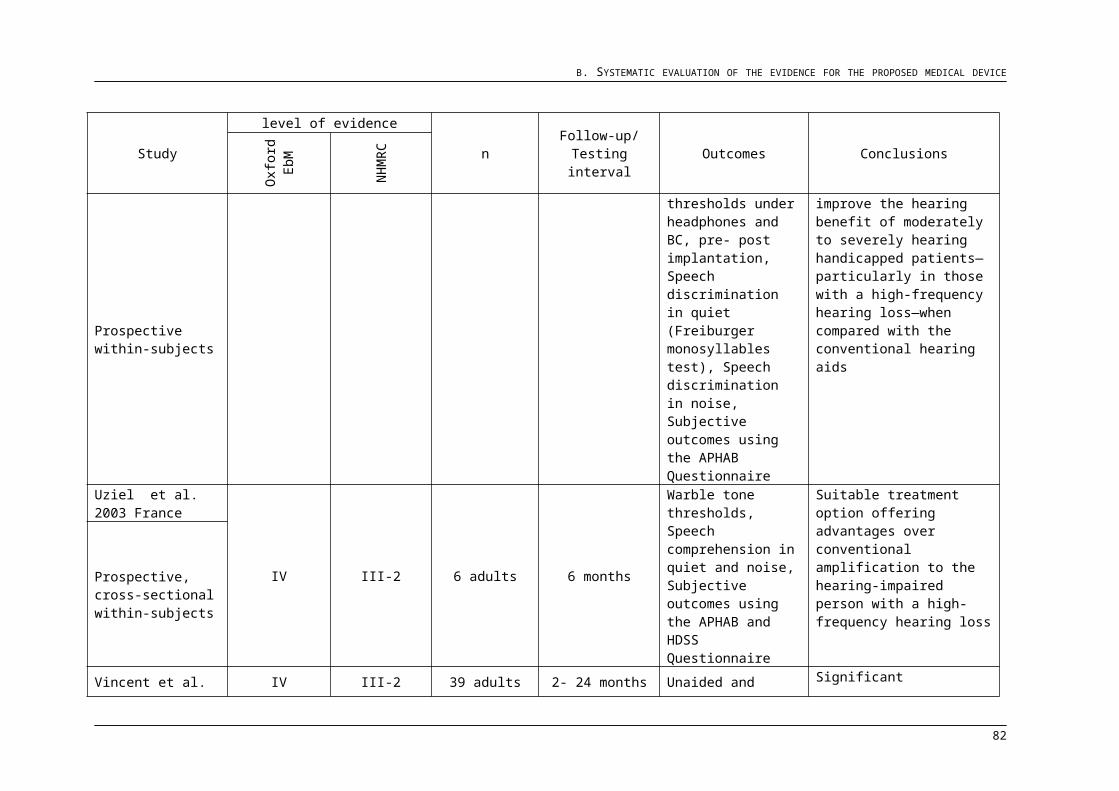
B. SYSTEMATIC EVALUATION OF THE EVIDENCE FOR THE PROPOSED MEDICAL DEVICE
Table 28 - Summary of the evidence base supporting the therapeutic claims
90
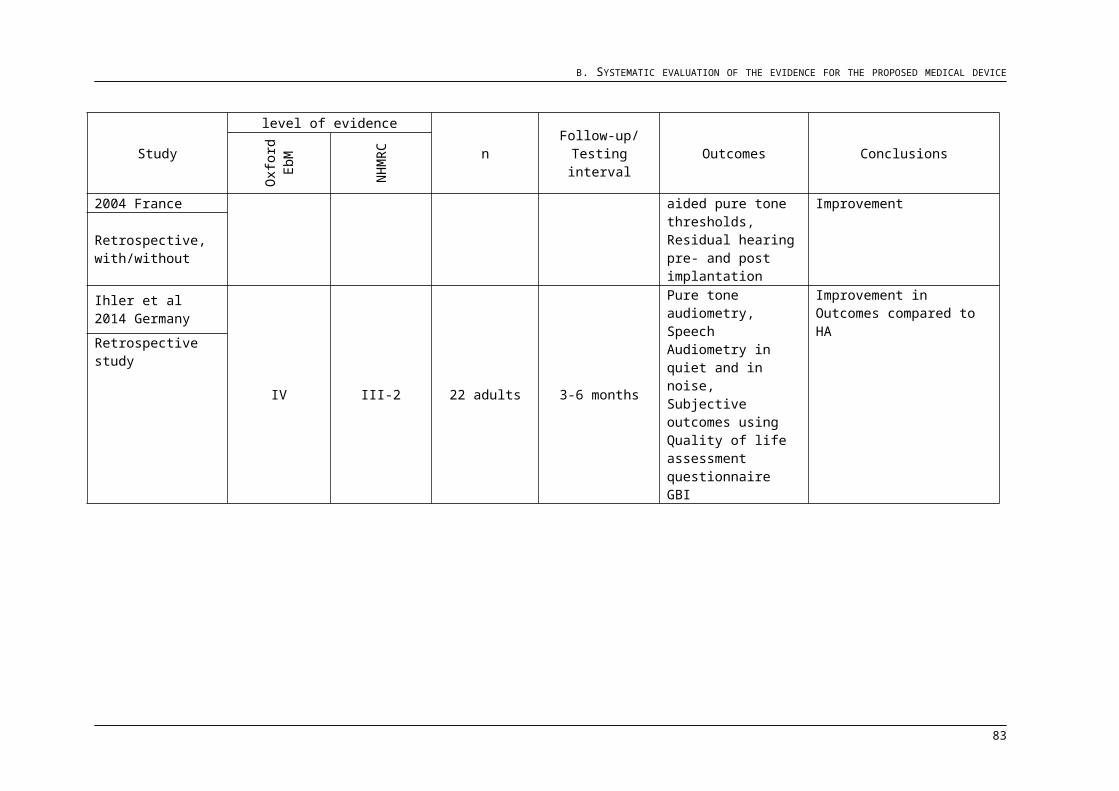
B. SYSTEMATIC EVALUATION OF THE EVIDENCE FOR THE PROPOSED MEDICAL DEVICE
Comparison Therapeutic claim The level and quality of the evidence
Statistical precision and size of the effect
Consistency of the results over the trials presented
Partially implantable MEI for patients with SNHL+medical condition vs. no treatment
Significant improvement in sound-field hearing thresholds
Level III to Level IV evidence from non-randomised pre-post or with/without studies. Reference standard in audiology is dedicated clinical follow-up.
Based on clinical significance defined as a shift in threshold > 10 dB HL
Demonstrated in 15/16 studies covering 377 patients
Significantly better speech recognition/comprehension in quiet
Meta-analysis: mean improvement of 35.69% (95% CI levels, 29.23 - 42.15), Z = 10.83 (P< 0.00001) (see Table18)
Improvement in speech comprehension scores in all seven included studies
Significantly better speech recognition/comprehension in noisy situations
Based on clinical significance defined as a mean change of 10% (see Table 21)
Consistent improvement seen in three studies
Few difficulties in understanding speech in relatively easy listening conditions, as compared to noisy conditions; and improves health in general
No unaided comparison available, statistical analysis not applicable (see Table 21)
Comparable values across included studies
Is a safe procedure with minor adverse events resolving on their own or with local treatment
Statistical analysis not applicable (see Table 26 )
Not applicable
Small but non-significant shift in bone conduction thresholds over time
Based on clinical significance defined as a shift in threshold < 10 dB HL
Demonstrated in 5 studies at a long-term follow-up
Constant functional gain over time Long-term mean FG:26 dBShort-term mean FG: 27 dB
Single study by Mosnier (2008)
Slight decrease in recognition/ comprehension over time, yet still significantly better outcomes than baseline
Mean WRS at long-term: 81 +/-5.3%; at short-term: 89 +/- 4.0% (N=27, paired t-test, p 0.05)
Single study by Mosnier (2008)
Sustained subjective benefit Device satisfaction at: long- Single study by Mosnier
91
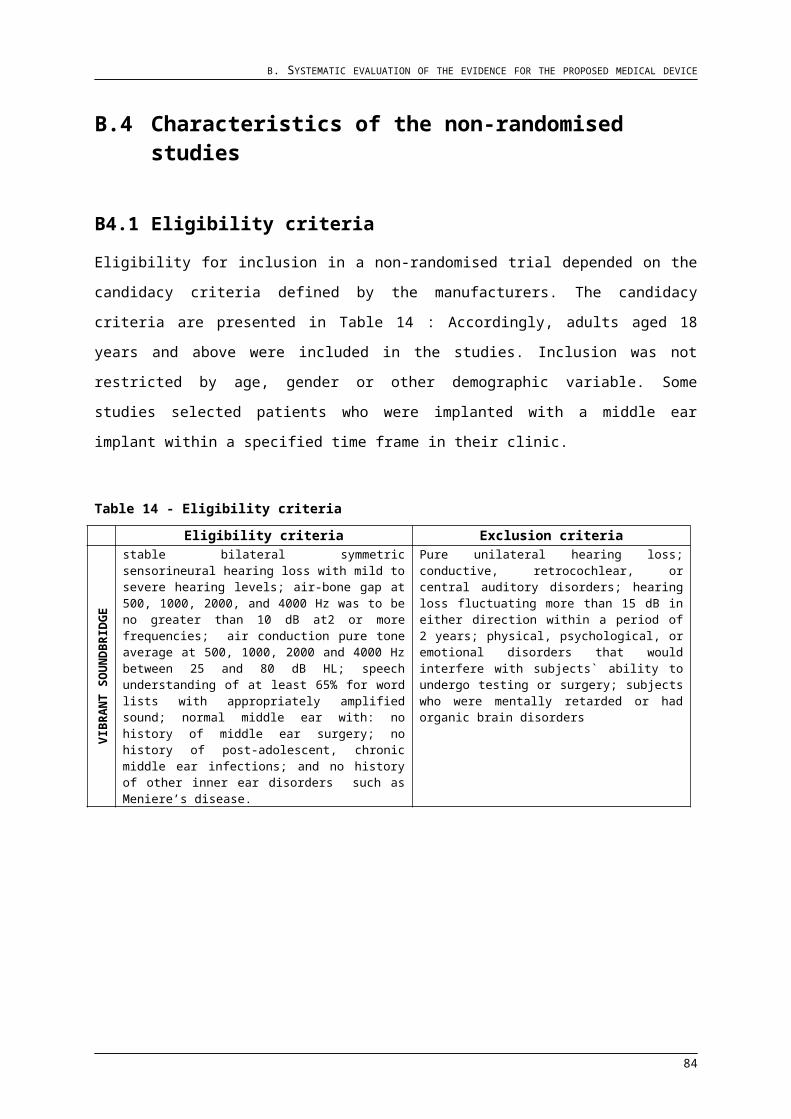
B. SYSTEMATIC EVALUATION OF THE EVIDENCE FOR THE PROPOSED MEDICAL DEVICE
Comparison Therapeutic claim The level and quality of the evidence
Statistical precision and size of the effect
Consistency of the results over the trials presented
term: 77%); short term: 80%.GBI total score at short-term:15.4 +/-1.68; long-term: 17.8 +/- 2.78
(2008)
92
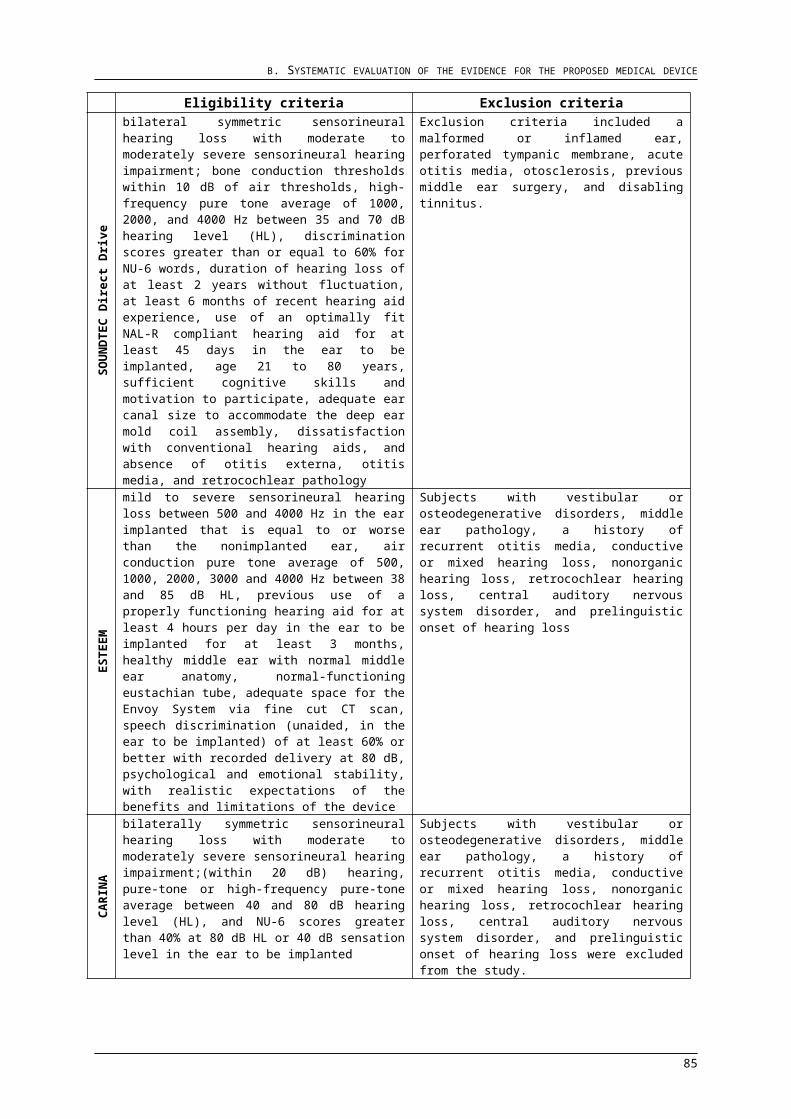
C. TRANSLATING THE CLINICAL EVALUATION TO THE LISTING REQUESTED FOR THE INCLUSION IN THE ECONOMIC EVALUATION
Form of economic evaluationAs the main comparator is No Treatment, hearing-related outcome measures for No
Treatment are very limited. As such, a cost-effectiveness analysis which incorporates the
costs of the partially implantable Middle Ear Implants and the cost for No Treatment
(opportunity costs for the society) should be sufficient to determine the cost-effectiveness
of insertion of a partially implantable Middle Ear implant relative to No Treatment and to
each.
93

C. TRANSLATING THE CLINICAL EVALUATION TO THE LISTING REQUESTED FOR THE INCLUSION IN THE ECONOMIC EVALUATION
C. Translating the clinical evaluation to the listing requested for inclusion in the economic evaluation
Section C is provided to show that the conclusion of superior effectiveness and equal
safety justifies a cost-effectiveness analysis after issues of applicability are addressed.
Strangely enough only few papers follow a coherent presentation of data which reduces
the amount of extractable papers from 86 (which met the PICO criteria) to 47 (which
finally could be used for data analysis) clearly documenting the missing of generally valid
standards of how to describe data in order to make outcomes comparable. We are well
aware of the fact that the evidence presented in part B is far away from the quality of
randomized controlled trials (RCT), an evidence level that is normally applied in drug
applications. To our knowledge, no evidence of higher level than that used in part B is
available. Especially RCTs cannot be performed with medical devices of high risk
classes or products that require surgery, because any kind of sham surgery is forbidden
for aspects of ethics.
Nevertheless, the evidence obtained from systematic literature searches provides a
plausible rationale supporting our claims.
Cost-Effectiveness Analysis (CEA) is the evaluation of the costs and consequences of
alternative interventions using clinical outcomes in “natural units.” The natural units can
include a range of clinical end points such as, life years gained, functional gain,
complications avoided, or speech understanding in different conditions. The goal of CEA
is to maximize societal health benefits while functioning within a constrained budget.
Although there are several advantages of CEA, the major disadvantage is the inability to
provide interdisease comparisons; therefore, it cannot measure the opportunity cost of
implementing one intervention over another choice. Due to the inherent scarcity of health
care resources, the “opportunity cost” refers to the loss of health benefits that would have
been created if the resources were used in another health care sector. Another
disadvantage of CEA is defining the most important effectiveness end point to report.
The appropriate measure should reflect the objective of performing the analysis, and it
should consider units that would improve policy decision-making. The quality of
effectiveness data is imperative to a strong economic evaluation. The quality of
effectiveness study design can be graded based on the NHMRC levels of evidence
94
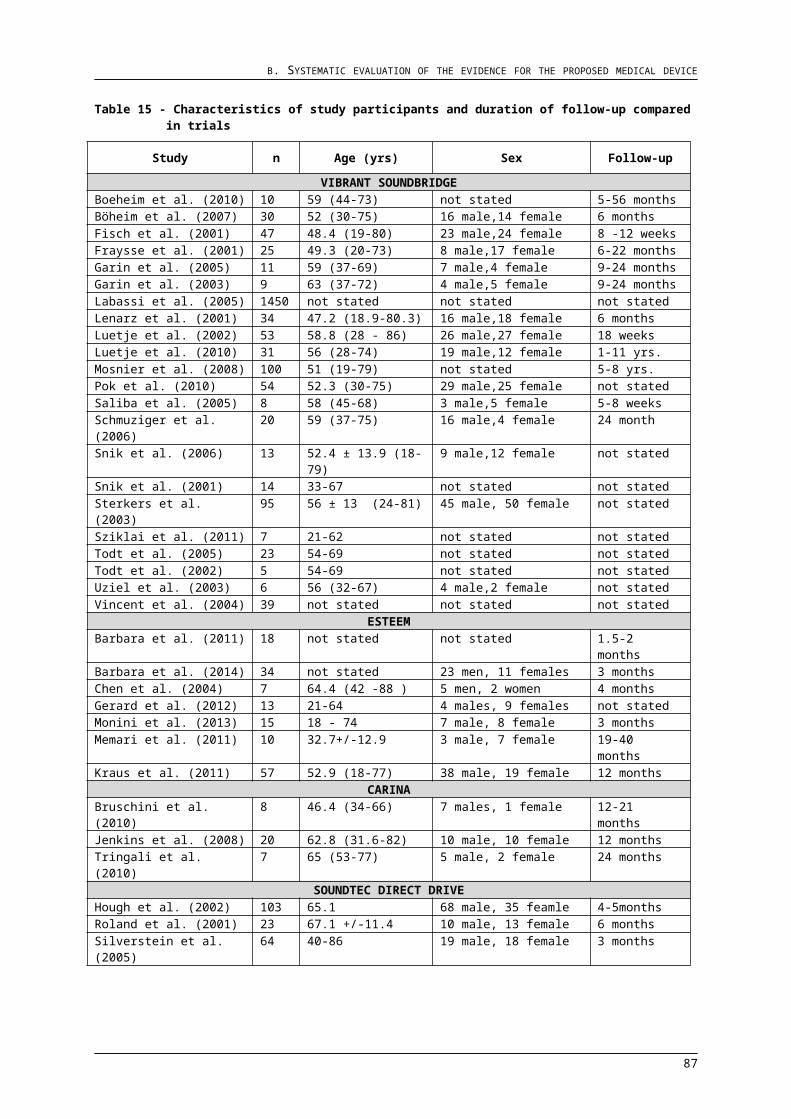
C. TRANSLATING THE CLINICAL EVALUATION TO THE LISTING REQUESTED FOR THE INCLUSION IN THE ECONOMIC EVALUATION
(https://www.nhmrc.gov.au/). There will always be a certain amount of uncertainty
associated with both cost and consequent data collection.
Section B.8 (Discussion) of this submission concluded that partially implantable MEI for
SNHL+medical condition (Vibrant Soundbridge) are, when compared to no treatment,
superior in terms of effectiveness and non-inferior in terms of safety outcomes; and when
compared to other partially implantable MEI is non-inferior/at least as safe and effective.
These conclusions are derived from the indirect comparison of non-randomised trials.
Due to the nature of the studies and the consequent uncertainty, the economic
evaluation of choice for either comparison is a cost-effectiveness model which is
presented in Section D.
This section is provided to show that the therapeutic standpoints of the proposed medical
device in comparison to no treatment and other partially implantable MEI and the choice
of a cost-effectiveness model in either case is valid after issues in the translation of the
evidence is considered.
C.1.1 Applicability of outcome comparisons
The clinical setting for the studies included in this submission reflects a population that is
intended to be treated with a partially implantable active middle ear implant for
sensorineural hearing loss due to the inability to wear or benefit from hearing aids. The
degree of hearing loss varied from mild to severe, and the type of an existing outer ear
medical condition varied. Therefore, overall the study participants are representative of
the target population in Australia.
The age of the study participants ranged from 18 to 86 years; and there were slightly
more males than females with the percentages of 53.9 % and 46.1 %. The most
informative study of the target population comes from Wilson et al. (1999) who provided
prevalence values for different types of hearing loss by age group. This study covered
individuals with any type of hearing loss who were aged 15 up to 70+ years, including
55 % males (510) and 45 % females (416). These demographic data may be an
overestimation of the target population with sensorineural hearing loss. Nevertheless,
there appears to be a good overlap between the study and target populations.
Overall, no issues were seen in the applicability of the study population to the target
Australian population.
95

C. TRANSLATING THE CLINICAL EVALUATION TO THE LISTING REQUESTED FOR THE INCLUSION IN THE ECONOMIC EVALUATION
C.1.2 Circumstances of use
The circumstances of use for a middle ear implant are not expected to change between
the studies and the target population due to the following:
There are universal standards for audiological equipment
Candidacy assessment is based upon guidelines that are recognized worldwide,
and the procedure is thus carried out similarly in different countries
The decision for providing MEI implantation is made after an individual is
assessed against candidacy criteria which are determined by the manufacturer
MEI implantation is delivered under general anaesthesia by a trained surgeon
It is anticipated that the surgical procedure taken may differ between clinics. This is
determined by patient anatomy and surgeon`s preference. Effectiveness outcomes
remain unaffected by this variety while safety outcomes may slightly, but not significantly,
vary between the different approaches. The same variety seen in the literature is
expected to be seen in the target population.
C.1.3 Extrapolation issues
All identified studies reported the exact number or proportion of events occurring over a
single follow-up period; and as given in Table 15, these periods ranged from a few
months up to 11 years. In addition, almost none of the studies reported time-to-event
data that would allow the calculation of event rates. In order to use the available
information in a base-case cost-effectiveness analysis, the observed probability of events
were transformed into time-based probabilities. To reduce uncertainty, studies reporting
outcomes at a timeframe shorter than 6 months were excluded from the economic
evaluation unless they were the only source of information. The methods implemented
and the estimated base-case values are described in Section D.4. No other extrapolation
issues were identified.
C.1.4 Transformation issues
Studies investigating outcomes with the Vibrant Soundbridge AMEI reported final
outcomes, while those investigating the Maxum/SOUNDTEC AMEI did not report final
quality of life outcomes. Instead of measuring utility weights, the proportion of difficulties
96
C. TRANSLATING THE CLINICAL EVALUATION TO THE LISTING REQUESTED FOR THE INCLUSION IN THE ECONOMIC EVALUATION
in everyday life was measured using the APHAB. It was not possible to transform these
outcomes into utility weights and the outcomes were used directly in the economic model
comparing the different AMEI.
97
D. ECONOMIC EVALUATION FOR THE MAIN INDICATION
D. Economic evaluation for the main indication
A US study, published in 2000, on the costs of severe-to-profound hearing loss
concluded that direct and indirect costs (including medical, non-medical, educational and
lost productivity costs) amounted to an average lifetime cost per individual of US
$297,000. Total costs varied depending on when the hearing loss began. Costs for
individuals with prelingual onset of hearing loss exceeded US $1 million, whereas costs
for those with severe-to profound hearing loss acquired later in life averaged US $43,000
(Mohr et al., 2000). A more recent US study, on age-related hearing loss, estimated
direct medical costs and lost productivity costs using national, state and city data for
2002 and projected costs for 2030. In 2002, lost productivity costs due to age-related
hearing loss were approximately $1.4 billion at the national level; this was estimated to
reach $9 billion by the year 2030. Medical costs associated with the first year of
treatment for Americans with hearing loss aged 65 and older were estimated at $1,292
per person, or $8.2 billion nationally (Stucky et al., 2010).
The requested MBS fee amount represents a cost-effectiveness fee for the Vibrant
Soundbridge (VSB, MED-EL Australasia) implantation compared with the Ototronix
MAXUM/SOUNDTEC and both compared to No Treatment. This reflects the clinical
evidence demonstrating that Middle Ear implantation is superior in terms of clinical
effectiveness and the treatment is as safe as comparable surgical treatment options
(Section B).
D.1 Decision model
The systematic review of the literature presented in Section B has shown that partially
implantable MEI for SNHL+medical condition (Vibrant Soundbridge) are, when compared
to no treatment, superior in terms of effectiveness and non-inferior in terms of safety
outcomes. Using the grid provided in Table 29 the appropriate economic evaluation is a
cost-effectiveness or cost-utility analysis. Considering that the underlying data come from
non-randomised studies, a modelling approach was taken.
98
D. ECONOMIC EVALUATION FOR THE MAIN INDICATION
Table 29 - Classification of an intervention for determination of economic evaluation to be presented
Comparative effectiveness versus comparatorSuperior Non-inferior Inferior
Com
para
tive
safe
ty
vers
us c
ompa
rato
r Superior CEA/CUA CEA/CUA
Net clinical benefit CEA/CUA
Neutral benefit CEA/CUANet harms None
Non-inferior CEA/CUA CEA/CUA None
Inferior
Net clinical benefit CEA/CUA
None NoneNeutral benefit CEA/CUANet harms None
An economic evaluation of the proposed medical service against other MEI is also
carried out in this submission. The evidence from Section B shows the partially
implantable MEI for SNHL+medical condition (Vibrant Soundbridge) to be non-inferior
to/at least as safe and effective as other partially implantable MEI (Maxum). This
conclusion is limited to the small number of non-randomised studies available for the
comparator, however covering a large number of participants. The decision is also
conservative as the number of adverse events is slightly higher and subjective outcomes
relatively worse with the comparator.
Using the classification grid a cost-minimization analysis is the most appropriate for this
comparison. However, discrepancies in the design of the two MEI systems lead to
differences in the surgical procedure, the amount of follow-up required and in the
everyday handling and use of the device. It is believed that the differences between the
two systems cannot be reduced to a simple comparison of costs. The economic
evaluation of choice is a modelled cost-effectiveness (CE) analysis.
D.2 Population and circumstances of use reflected in the economic evaluation
D.2.1 Baseline population
The baseline population for both base-case analyses includes adults with sensorineural
hearing loss who cannot wear or benefit from hearing aids due to several reasons. Adults
are considered being 18 years of age and above. The age and sex distribution of the
included studies, when reported, reflect the general population. The study demographics
99

D. ECONOMIC EVALUATION FOR THE MAIN INDICATION
of each CE model are compared to the target population in Table 30. Values for the
target population are those estimated from Wilson et al. (1999) and described previously
in section C.1.1.
A start age of 53 was used for both models. This is the mean age at implantation from
which health utility values were obtained from. This study was identified in the systematic
review carried out for the following section D.3.
D.2.2 Circumstances of use
According to the clinical management algorithm presented in Section A.5, the proposed
medical service can be offered as first- or second-line treatment to individuals who have
mild-to-severe sensorineural hearing loss and a recurring/persistent medical condition in
the outer ear. The line of treatment depends on whether the identified medical condition
could be eradicated by conservative interventions and whether a hearing aid could be
trialled. Hearing aid use has been proven to exacerbate individuals` conditions. Current
treatment options for such patients include no treatment or treatment with an active
middle ear implant.
Another partially implantable MEI intended for individuals with sensorineural hearing loss
is the Maxum. According to the candidacy criteria, this implant system can only be
provided as second-line treatment to those who have trialled a hearing aid but are not
satisfied with their experience.
The provision of either MEI is on a one-off basis after assessing individuals against
candidacy criteria that are determined by the manufacturer. The criteria for the two AMEI
systems can be seen in sections A.2 and A.4 respectively. Candidacy assessment is
carried out by audiologists using calibrated diagnostic devices and validated language-
specific speech material.
Implantation with either device is carried out by a trained surgeon under local or general
anaesthesia. After a healing process of 4-10 weeks patients are invited to the
clinic/hospital to activate the device. They are then followed-up on a regular basis to
assess device functionality and outcomes. Throughout their lifetime users of partially
implantable AMEI are contraindicated to undergo MRI without removing their magnet.
Differences in circumstances of use for each CE model are tabulated against the target
population in Table 30.
100
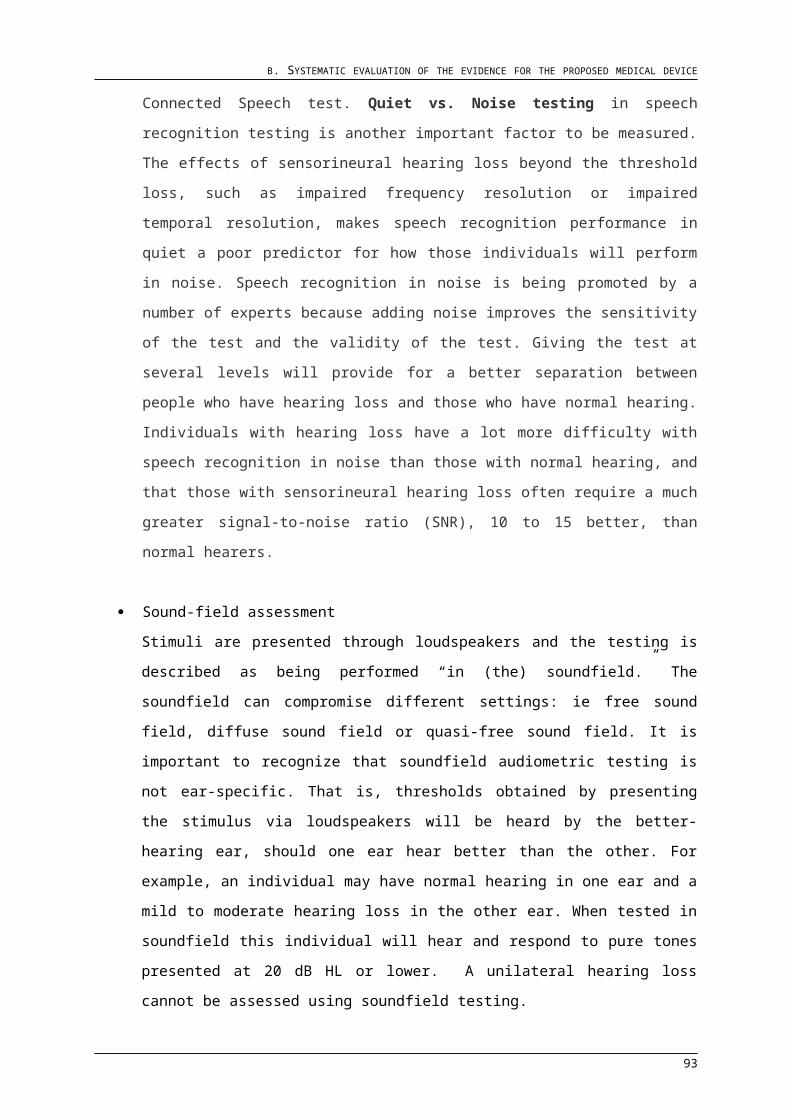
D. ECONOMIC EVALUATION FOR THE MAIN INDICATION
Table 30 – Comparison of baseline populations and circumstances of use
Population and circumstance
Studies for CE model AMEI vs no
treatment
Studies for CE model AMEI vs AMEI Target Wider
Medical condition Mild to severe SNHL with/without outer ear medical condition
Mild to severe SNHL with/without outer ear medical condition
Mild to severe SNHL with outer ear medicel condition
Mild to severe SNHL with outer ear medicel condition
Age 18-86 18-86 adults and children adults and children
51,8% male 53% male 55% male 55% male
48,32% female 47% female 45% female 45% female
Position in management algorithm
fisrt- or second-line treatment
first- or second-line treatment
first-line treatment first-line and some second-line treatment
stable bilateral symmetrical SNHL
stable bilateral symmetrical SNHL
stable bilateral symmetrical SNHL
stable bilateral symmetrical SNHL
ABG ≤ 10 dB HL ABG ≤ 10 dB HL ABG ≤ 10 dB HL ABG ≤ 10 dB HLPTA (,5-1-2-4 kHz) of 25-80 dB HL
PTA (,5-1-2-4 kHz) of 25-80 dB HL
PTA (,5-1-2-4 kHz) of 25-80 dB HL
PTA (,5-1-2-4 kHz) of 25-80 dB HL
WRS ≥ 65% in the best aided condition
WRS ≥ 60% in the best aided condition
WRS ≥ 65% in the best aided condition
WRS ≥ 65% in the best aided condition
Unable to wear or benefit from HAs due to medical reasons
Unable to wear or benefit from HAs due to medical reasons; or dissatisfied with HAs
Unable to wear or benefit from HAs due to medical reasons
Unable to wear or benefit from HAs due to medical reasons
normal middle ear with no previous middle ear surgery
normal middle ear with no previous middle ear surgery
normal middle ear with no previous middle ear surgery
no history of post-adolescent, chronic middle ear infections or inner ear disorders
no history of post-adolescent, chronic middle ear infections or inner ear disorders
no history of post-adolescent, chronic middle ear infections or inner ear disorders
Inclusion criteria for the proposed medical service were extended in 2009 to include children. All studies identified were completed before this date and thus children were excluded from data collection.
The sex composition of the study population may be an underestimate as not all studies reported this information. As for the target population the sex composition is desvriptive for individuals with any type of hearing loss. There is no data available for those with only sensorineural hearing loss. Hearing loss may be more common in males, but it does not alter the outcomes of implantation.
no otitis externa, otitis media, and retrocochlear pathology
Comment
Sex
Comment
Indication criteria
101
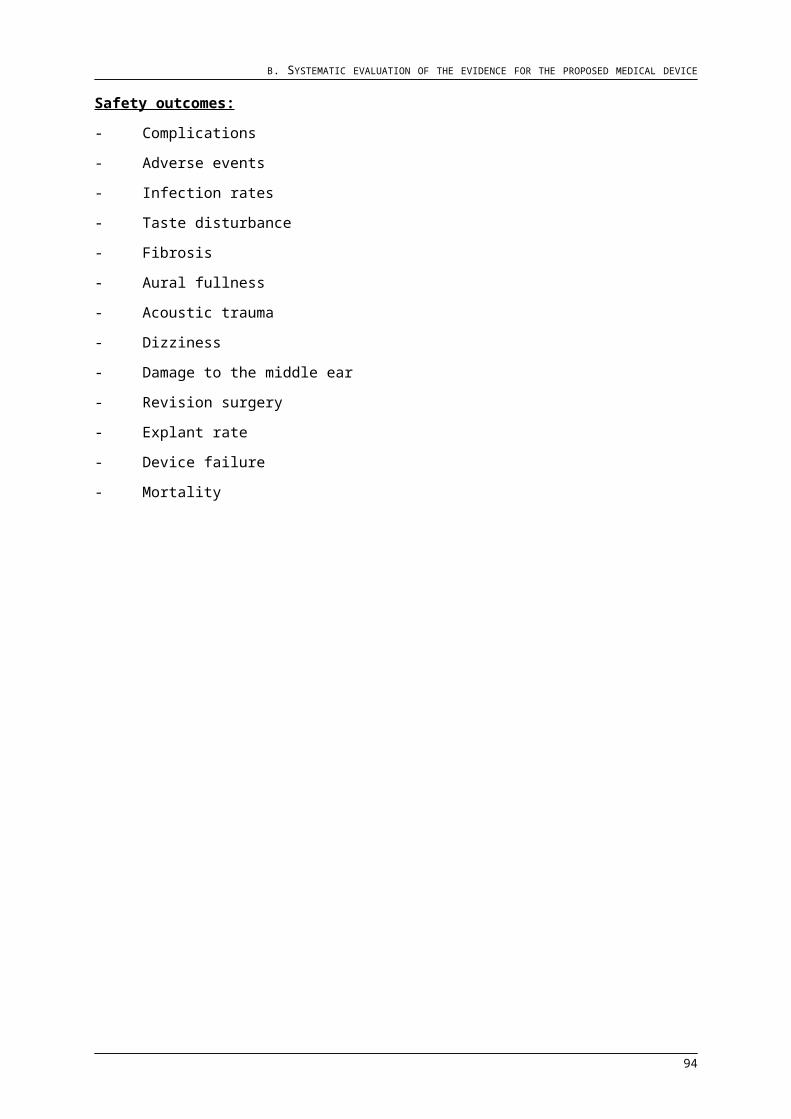
D. ECONOMIC EVALUATION FOR THE MAIN INDICATION
D.3 Structure and rationale of the economic evaluations
D.3.1 Systematic literature review
As part of the systematic review carried out for section B, studies carrying out economic
evaluations or assessing costs or quality of life of partially implantable active middle ear
implants were also identified. Details of the search strategy and inclusion/exclusion
criteria can be found in the respective parts of this section.
Of the 47 studies included in the systematic review, 5 had carried out an economic
evaluation. Three of these were health technology assessment reviews, and two were
primary research. These studies are described in Table 31.
The HTA reviews identified have been previously described in Section B.2. The analyses
carried out in these reports included an economic decision model by Alberta Health and
Wellness (2011), a cost analysis by CEDIT (2002) and a cost minimisation analysis by
the MSAC (2010). In all of these publications the costs of different MEI were pooled
together and consequently could not be used in the current model.
The decision model developed by AHW was developed for the application of MEI in
moderate to severe sensorineural, conductive and mixed hearing loss. The application of
the proposed medical service (of this submission) in sensorineural hearing loss only
covered a small part of the overall decision model and appeared to over-simplify the
treatment pathway: Individuals were successful or not successful after determining MEI
candidacy, and if not successful required device revision or no further intervention. The
decision model was hence not used for informing the cost effectiveness models
developed for this submission.
The two primary research papers consisted of a cost-effectiveness analysis of two
different types of MEI in individuals with sensorineural hearing loss and severe external
otitis (Snik et al. 2006), and a cost-utility analysis of the Vibrant Soundbridge in
individuals with sensorineural or conductive/mixed hearing loss (Edfeldt et al. 2014).
Both studies had a prospective case series design with data collection before and after
implantation.
102
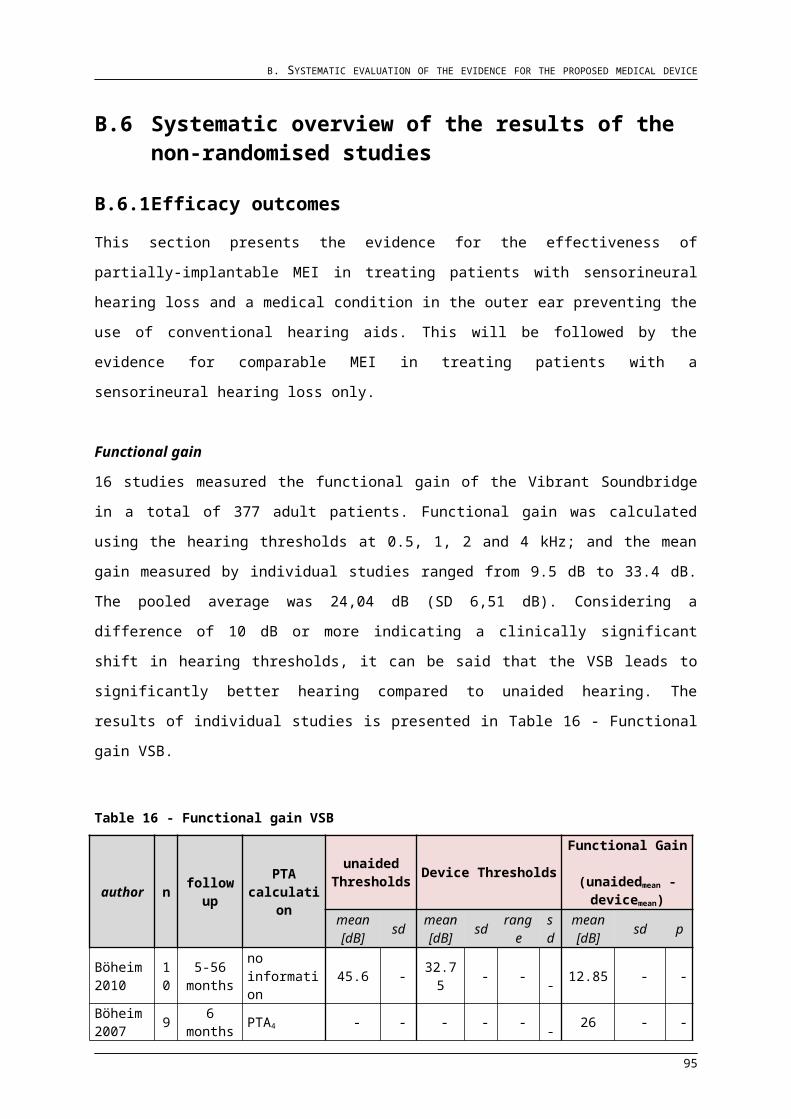
D. ECONOMIC EVALUATION FOR THE MAIN INDICATION
Table 31 – Overview of economic evaluations identified in the literature
Publication Country Study design Intervention Comparators Perspective for analysis Outcome Comments
Edfeldt et al. 2014 Sweden and Norway
Cost-utility analysis
VSB None Hospital Utility gain: 0,09 Cost/QALY: € 7.260
Utility values obtained before and after implantation rather than from a comparator group.
Snik et al. 2006 The Netherlands
Cost-effectiveness analysis
MEI (VSB, Otologics MET)
None Healthcare system/payer
Utility gain: 0,05 Cost/QALY: € 16.085
Utility values obtained before and after implantation rather than from a comparator group. Outcomes obtained for each MEI are pooled together.
Alberta Health and Wellness (2011)
Canada Decision model MEI (VSB, Esteem, Carina)
HA, BAHA, CI Healthcare system/payer
Total costof MEI over 5 years: $2`677.497
The cost was calculated as anaverage of the inflated cost (5%) over 5 years.
Medical Services Advisory Committee (2010)
Australia Cost-minimisation analysis
MEI (VSB, Otologics MET, Esteem, Rion , SOUNDTEC, TICA MEIs)
BAHA, CI limited societal Average cost ofMEI: $23.873
All implants deemed as being equally effective on primary outcome.
Comite d'Evaluation et de Diffusion des Innovations Technologiques (2002)
France Cost analysis per case
MEI (VSB, Otologics MET, SOUNDTEC)
None Hospital $19.173/case Information based on executive summary, full text not available in English.
103

D. ECONOMIC EVALUATION FOR THE MAIN INDICATION
The study by Snik et al. evaluated individuals who received a MEI within a 4-year period
at a single clinic in Nijmegen, the Netherlands. 13 patients received the Vibrant
Soundbridge with the 404 audio processor and 8 patients received the Otologics MET
device with the standard button audio processor. Quality of life was measured using the
SF-36 prior to middle ear implant (MEI) surgery and 6 and 12 months after device
activation. Costs included in analysis were the direct costs related to the selection phase,
implantation procedure (ENT specialist, surgical nurse, anaesthesia, surgical
assistance), hospital-stay of 2 days, follow-up care (ENT specialist, audiologist,
assistant), and consumables (including the device itself). QALYs were calculated by
multiplying the health utility gain scores with the number of profitable years a MEI can be
worn. Individual profitable usage periods in years were calculated by subtracting the
average hearing loss from the maximum hearing loss (3 frequency PTA of 70 dB HL for
the Vibrant Soundbridge and 80-dB HL for the Otologics MET) and dividing this by an
assumed deterioration of 1 dB per year (average at 0.5, 1.0, and 2.0 kHz). The cost per
QALY for MEI was thus calculated to be € 16.085 (AUD 25.647). It was concluded that
middle-ear implantation proved to be a cost-effective and justified health care
intervention.
Several limitations to this study were noted. Due to the unavailability of other QOL and
cost-effectiveness data on middle-ear implantation, comparisons were made with studies
on cochlear implants. It must be noted that the target populations for the two hearing
devices are not equal: The middle-ear implant is used in subjects with mild-to-severe
sensorineural hearing loss, while the cochlear implant is offered to deaf subjects. Next
and most importantly, the two different types of MEI devices (Vibrant Soundbridge and
Otologics MET) were combined in the analysis because of small patient numbers in each
group. No conclusions could, therefore, be drawn about the relative cost-effectiveness of
the independent devices. MEI was also not compared to any other treatment modality.
Furthermore, the use of a generic (as opposed to disease specific) quality of life
instrument in this patient population may not be appropriate. Last but not least, a
sensitivity analysis was not performed.
This study provides a lot of information for the target population; however, particularly
because of the data from the two devices being pooled together the results could not be
used in the current submission.
The second study by Edfeldt et al. evaluated individuals who received a Vibrant
Soundbridge over a period of 2.5 years in six different centres in Norway and Sweden.
After trialling hearing aids, 24 patients with sensorineural (SNHL), conductive (CHL), or
mixed hearing loss (MHL) were implanted due to medical reasons and received the
104
D. ECONOMIC EVALUATION FOR THE MAIN INDICATION
Amadé audio processor. Quality of life was measured using the mark 2 and 3 of the
Health Utilities Index (HUI) prior to middle ear implant (MEI) surgery and 6 months after
device activation. Costs included in analysis were the direct costs related to preoperative
assessment, implantation procedure (ENT specialist, surgical nurse, anaesthesia,
surgical assistance, hospital stay), follow-up care (ENT specialist, three clinical visits),
and device costs. QALYs were again calculated by multiplying the health utility gain
scores with the number of profitable years. The estimation of profitable years was this
time based upon hearing levels at 0.5, 1.0, 2.0 and 4.0 kHz. Using the HUI-3, the
cost/QALY for patients with SNHL was estimated at € 7`260 (AUD 10.454). An
estimation of utility gain with the two versions of the HUI (Mark 2 and 3) can be
considered as a sensitivity analysis. The authors concluded that “hearing restoration
using an active middle ear implant (AMEI) is a highly cost-effective treatment for a
selected group of patients with no other possibilities for auditory rehabilitation”.
One of the major limitations of this study is in the collection and utilization of costs data.
This information was obtained not at the individual level but from two centres (Uppsala
and Oslo) thought to be representative of the respective countries, and then the cheaper
costs were entered into analysis. Another limitation is that utility data from individuals
with different types of hearing loss were pooled together. This means that both cost and
utility data are not representative of the target population.
Considering that this study is the only economic evaluation that has really investigated
generic QOL outcomes with the proposed medical service, the authors were contacted to
gain access to individual level utility data for use in this submission. Cost data were
disregarded and not included in the models.
Overall, there were no studies identified in the literature that could inform the structure of
a new cost-effectiveness model; and only one study that could supply the model with
QOL data. The CE models for this submission were developed in TreeAge Pro
(Williamstown, MA, USA) together with professionals in the field to determine a
representative model of implant use and follow-up care.
D.3.2 Structure of the economic model and its justification
A state-transition model was developed to represent the pathways by which a person
might or might not receive an active middle ear implant and the clinical events that might
occur following their decision. The model was evaluated first to compare partially-
implantable middle ear implants (the Vibrant Soundbridge) against no intervention, and
then for comparing different MEI (Vibrant Soundbridge and SOUNDTEC/MAXUM)
105
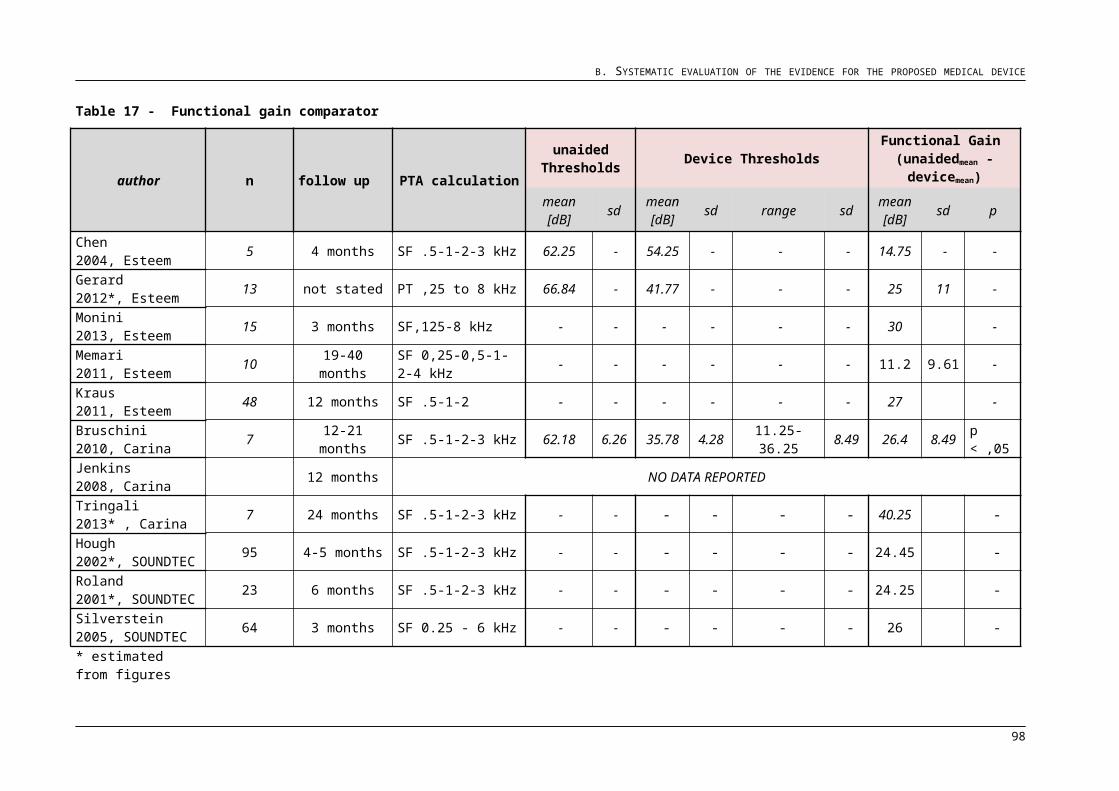
D. ECONOMIC EVALUATION FOR THE MAIN INDICATION
against each other while omitting the no intervention arm. The clinical events in the
model are defined as events that can affect the costs and course of treatment in the
short or long-term. Results from the systematic review in Section B highlighted the
occurrence of adverse events in the post-operative period, including device failure, which
resolved on their own; remained unresolved over time; or required revision surgery, ex-
plantation or re-implantation. Therefore, the main economic model included the following
main health states:
Successful
Successful with complications
MEI failure
A description of all the health states can be found inTable 32.
Table 32 – The main Markov states included in the main economic evaluation
Model state Definition
Successful Individuals achieve an audiological and subjective benefit of wearing a MEI without experiencing any complications
Successful with complications
Individuals experience a complication that may resolve on it`s own or require surgical revision
MEI failure The occurrence of device failure that requires explantation and possibly re-implantation with a new device
Cease MEI Individuals voluntarily decide to stop wearing their device at any point during the model
Death All-cause mortality
A person in the `successful` state may not experience any adverse events at all and
remain successfully aided; they may experience an adverse event and move on to the
`successful with complications` state; or experience problems in device function and
move on to the `MEI failure` state.
Individuals in the `successful with complications` state may, as a result of their condition
resolving on its` own or with a surgical revision, move on to the `successful` state; or
remain affected over the long-term and decide to keep using their device despite of
complications and remain in the `successful with complications` state or stop using their
device and move on to the `cease MEI` state.
Individuals in the `MEI failure` state may choose to undergo surgery to remove the
internal components and move into the `cease MEI` state; or choose to undergo
implantation to receive a new device, with the possible outcomes of being successful,
106

D. ECONOMIC EVALUATION FOR THE MAIN INDICATION
successful with complications, having a MEI failure or discontinuing treatment.
Individuals enter the model after being screened for implant candidacy by a
multidisciplinary team. In the economic model depicted in Fig 11, those who are not
candidates or decide against receiving AMEI follow the branch No Intervention and are
assigned the costs of candidacy assessment. These individuals are at risk of recurring
pathologies that require medical treatment at any point in their life. The probability of
recurring pathologies is estimated from the literature. The successful or unsuccessful
outcome of such treatments should not affect the quality of life or health state of
individuals, but is expected to incur higher costs if unsuccessful and requiring further
treatment. Individuals who decide to receive an AMEI follow the branch MEI Implantation
and are assigned all the costs related to candidacy assessment, surgery and short-term
follow-up. The MEI Implantation node is associated with three main health states
(successful, successful with complications, MEI failure) and two absorbing states, cease
MEI and death. This does not imply that individuals stop using their implant straight away
after device activation, or that MEI implantation leads to death. As there is no evidence of
this happening in the literature, the dead state is included to take account for all-cause
mortality over time in the population that is being modelled. People undergoing the
implantation procedure are allocated to potential short-term outcomes (success, success
with complications, MEI failure) on the basis of probabilities calculated from the literature.
In each cycle of the model, individuals who are successful after surgery are further at risk
of developing adverse events; and those starting off in the `successful with
complications` and `MEI failure` states are at risk of encountering another adverse event
or failure. The safety outcomes of the systematic review carried out in Section B were
used for populating the model and the costs associated with the management of each
clinical event was sought from the Australian population. Effectiveness outcomes in the
unaided (before implantation) and aided (after implantation) situations were also sought
from the literature. All assumptions underlying the model structure are summarized in
Table 33.
107
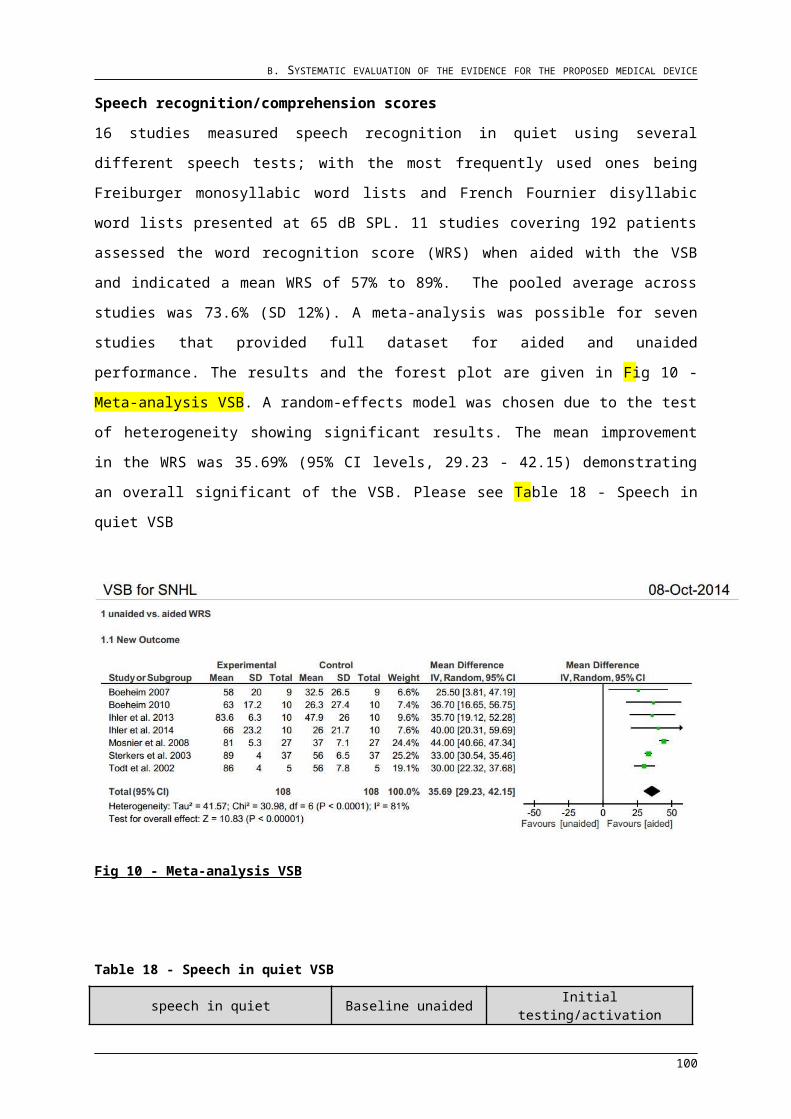
D. ECONOMIC EVALUATION FOR THE MAIN INDICATION
Fig 11 – Structure of the economic model
108
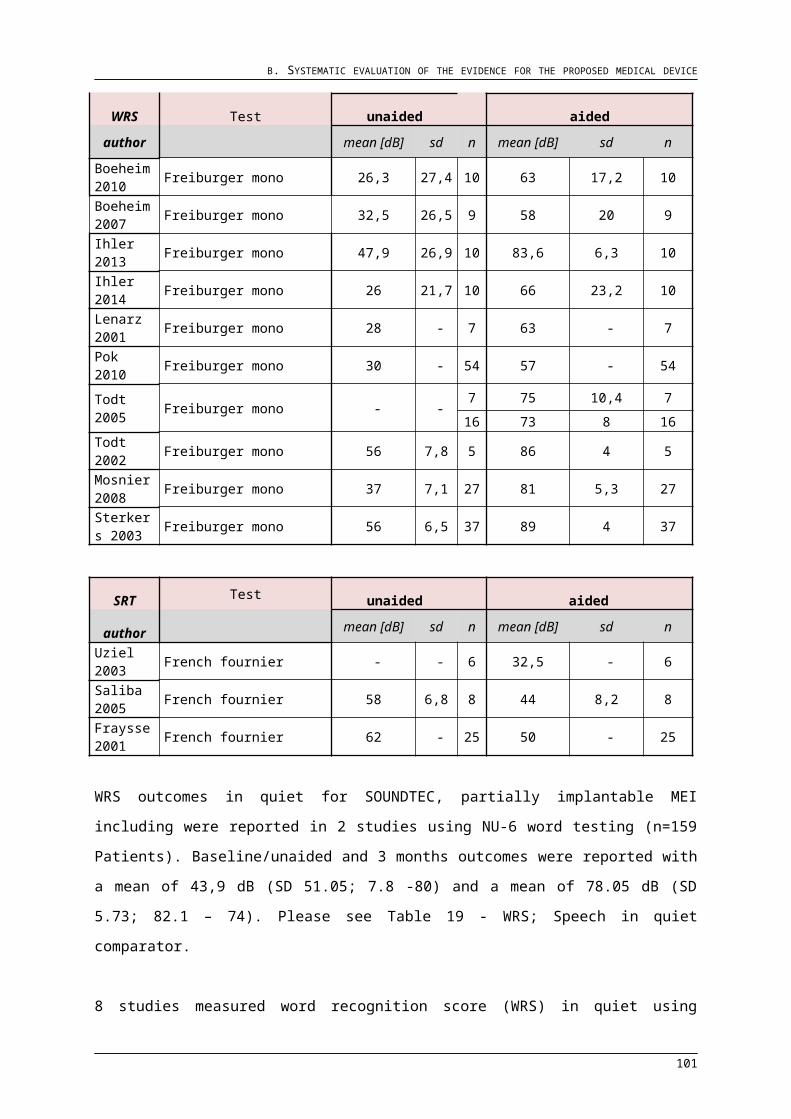
D. ECONOMIC EVALUATION FOR THE MAIN INDICATION
For evaluating the different middle ear implant systems against each other, the MEI
implantation branch of the model was cloned and the Markov states were named
according to the respective devices. Individuals with mild-to-severe sensorineural
hearing loss enter the model after candidacy assessment and then follow the VSB or
MAXUM implantation arm of the model depending on the clinical decision. The new
Markov model was populated using data from the literature.
Table 33 – Base case model assumptions
Assumption Comment
Individuals who remain unaided are at constant risk of experiencing a recurring pathology in the same ear.
It is unknown whether repeated treatment decreases the chance of an outer ear pathology to reoccur.
Conservative treatment of recurring pathologies, whether succesful or not, does not alter the quality of life of individuals receiving no intervention.
The succesful erradication of an outer ear condition may positivtely affect QOL, however minimum, as the pathology may reoccur.
Individuals who are successfully aided do not cease to use their device.
Studies demonstrate patients to stop using their device after various complications. Unsatisfactory benefit due to decreased gain or hearing loss can also be categorized as an adverse event.
Surgical revision provides a full resolution of adverse events. This reflects general clinical practice.
Re-implantation with a new implant ocurrs in the same ear from which a failed device is explanted from.
This reflects general clinical practice.
The rate of device failure and reimplantation does not vary significantly between partially implantable MEI.
Differences in design and surgical application of partially implantable MEI is not large.
Individuals wear their device for at least six months before potentially deciding to stop using their device.
Individuals that do not experience a device failure try out their device for a few months before making a decision to stop using their device.
All-cause mortality in the hearing impaired population is equal to that in the general population.
Hearing loss or implantation with a partially implantable MEI does not impact mortality.
109
D. ECONOMIC EVALUATION FOR THE MAIN INDICATION
D.3.3 Time horizon and outcomes used in the economic evaluation
The time horizon for the economic models was 10 years. This is shorter than the time
horizon proposed in the Decision Analytic Protocol; however, it is long enough for
differences between interventions to become apparent and to avoid extrapolating too far
beyond the available data. Outcomes with the Maxum/Soundtec were only available at 3
and 12 months of device use.
The cycle length was set to 6 months. In clinical practice, adverse events usually occur
immediately or soon after surgery and are resolved at most within a few months.
Additionally, in the case of revision surgery or re-implantation, six-months allows for a
waiting period and delivery of surgical tools if needed. Hence, a half-cycle correction was
not applied.
Outcomes included in the models are the direct costs related to pre-operative
assessment, surgery, hospital stay, follow-up and consumables (including battery and
device costs). The primary effectiveness outcome is the ICER based upon utility values
for the main economic evaluation. For the evaluation comparing different MEI, patient
perceived benefit was the preferred outcome as no utility measures were available with
Maxum/Soundtec implants.
D.3.4 Discounting
All costs and outcomes were discounted using a 5 % discount rate as recommended by
the Medical Services Advisory Committee.
D.3.5 Methods used to generate the results
Cost-effectiveness analyses were carried out using cohort (expected value) analysis
using results from the literature. To test the robustness of the results, deterministic
sensitivity analyses was carried out on all probability and cost estimates by applying
ranges around the point estimates used in the base-case analysis. A Poisson distribution
was assigned to all probability estimates except VSB device failure to calculate
confidence intervals. For VSB device failure the minimum and maximum values based
upon the CSR were used. Cost estimates were varied by ±25 %.
Variables found to be sensitive in DSA were entered into probabilistic sensitivity analysis.
Probability distributions were assigned to the point-estimates used in the base-case
110

D. ECONOMIC EVALUATION FOR THE MAIN INDICATION
analyses. Beta distributions were assigned to transition probabilities, Gamma
distributions were assigned to cost variables and Gaussian distributions were assigned
to utility measures. The variables included in PSA, the sampling distributions and the
parameterisations of the sampling distributions are reported in Appendix D.
D.4 Variables in the economic evaluation
D.4.1 Transition probabilities
Most of the transition probabilities were based upon information from studies identified in
the literature. As previously reported in Section C.1.3., the studies reported outcomes
from differential follow-up periods and only very few provided time-to-event data. In order
to be consistent in our methods and for transition probabilities to be comparable,
observed event probabilities were transformed into instantaneous 6 month rates using
the declining exponential approximation to life expectancy (DEALE) method (Beck et al.
1982), which assumes a constant risk over time. These calculations were based upon
the mean duration of follow-up unless the study timeframe was same for all participants.
The instantaneous rates were then converted back into 6-month probabilities using the
equation 1-(1-r)^1/t for obtaining base-case values. The value of instantaneous rates
was limited to a maximum of 1 for inclusion in analyses. A summary of all parameters
input into economic evaluation are provided in Appendix D.
Recurring pathologies
The three most common outer ear pathologies are otitis externa, EAC exostoses and
excessive cerumen. A literature search was carried out to identify studies reporting
epidemiological values on these conditions. Only few studies were found that
investigated the number of recurring or chronic cases. The observed probability of
recurring pathologies in the identified studies was respectively 25 %, 2.4 % and 3.2 %.
The high prevalence of otitis externa could be due to the much smaller sample size and
much shorter study timeframe. This study is however accepted worldwide as a significant
resource.
Table 34 lists the study demographics used for estimating the 6-month probability of
each variable. Assuming that individuals are constantly at risk of a recurring pathology,
the estimated base-case values were kept constant in the model.
111
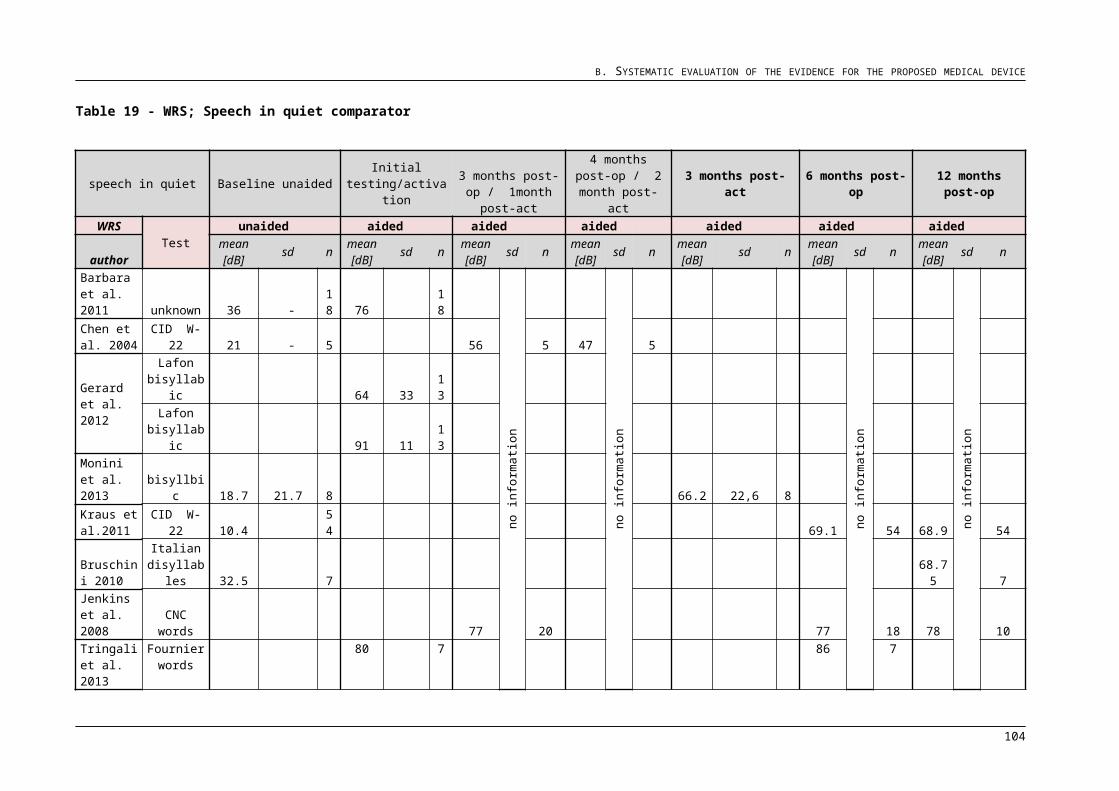
D. ECONOMIC EVALUATION FOR THE MAIN INDICATION
Table 34 – The estimated rate of recurring pathologies
Source Pathology n Event count
Time interval
Observed probability
Instantaneous rate
Agius 1992 Otitis externa 48 13 2 w 0,27083 1
House 2008 EAC exostosis 91 8 2 (1-15)
yrs 0,08791 0,023
Ahmed 2009
Excessive cerumen 500 16 up to 2
yrs 0,03200 0,0081
Adverse events
In the scope of the economic evaluation an adverse event refers to minor events that are
not related to a device failure and can resolve on their own or with surgical treatment. Of
the eight studies identified in Section B.6.2 that reported on safety outcomes with AMEI,
four provided sufficient information over a long enough study timeframe for the Vibrant
Soundbridge and Maxum/Soundtec. These studies were re-evaluated to obtain values
for all possible outcomes of having an adverse event. The study characteristics and
derived estimates are given in Table 35. For the VSB the weighted mean (based on
sample size) of the instantaneous rates were used to derive the 6-month probability of
the respective variables. Considering that individuals are at constant risk at developing
an adverse event, estimated probabilities were kept constant in the model.
112
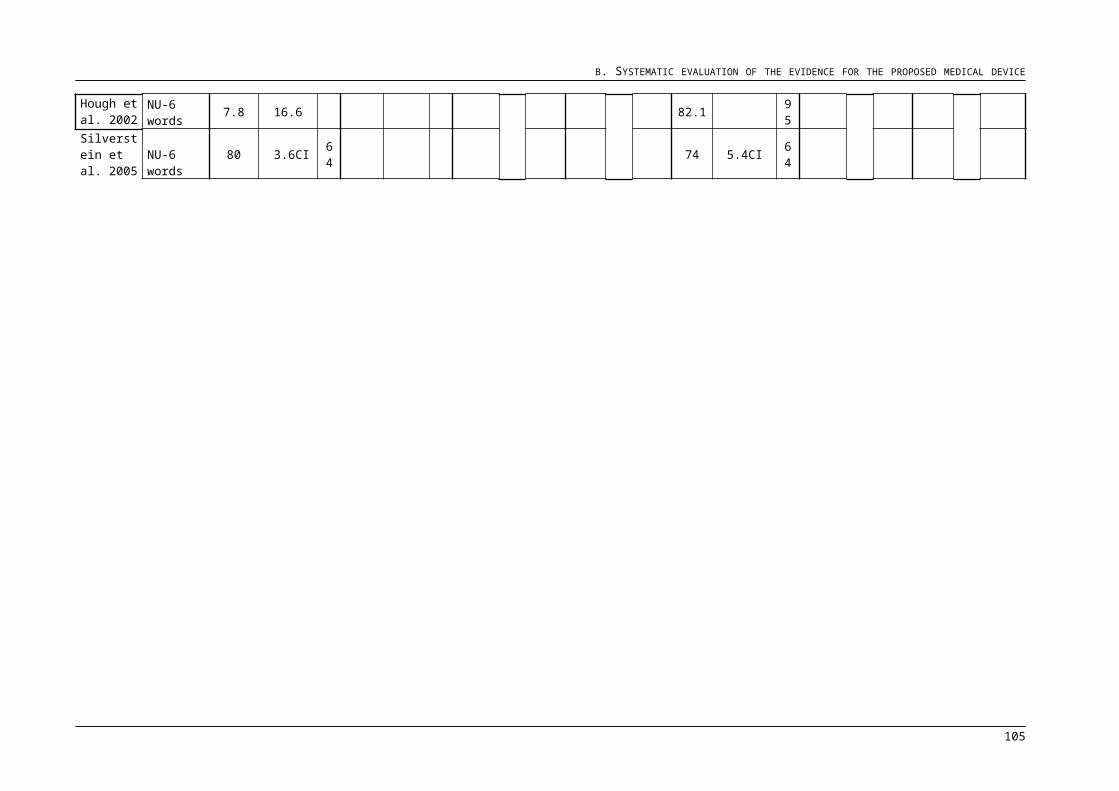
D. ECONOMIC EVALUATION FOR THE MAIN INDICATION
Table 35 - Estimated rate of adverse events in individual studies
All adverse events Unresolved AE Surgical revision
SourceTime
interval (months)
Event count
instantaneous rate
Event count
instantaneous rate
Event count
instantaneous rate
Vibrant SoundbridgeFraysse 2001 11 (6-22) 4 in
25 0,09528 0 in 4 0 0 in 4 0,0000
Schmuziger 2006 42 (26-55) 9 in
20a 0,08540 4 in 9 0,08397 2 in 9 0,0359
Sterkers 2003 17 (2-47) 20 in
95b 0,08353 20 in 59b 0,14785 -
Maxum/SOUNDTEC
Hough 2002 12 14 in 103 0,07305 2 in
14 0,07708 1 in 14 0,0371
a: In Section B 10 compications were identified in this study, including one device failure, which is excluded the calculations here.
b: Re-evaluating the study it was found that in addition to the 12 adverse events previously reported there were 11 complaints of aural fullness.All these were reported over a long-term follow-up. In the short-term there was a total of 59 complaints. The 3 instances of limited benefit were excluded from analysis.
113
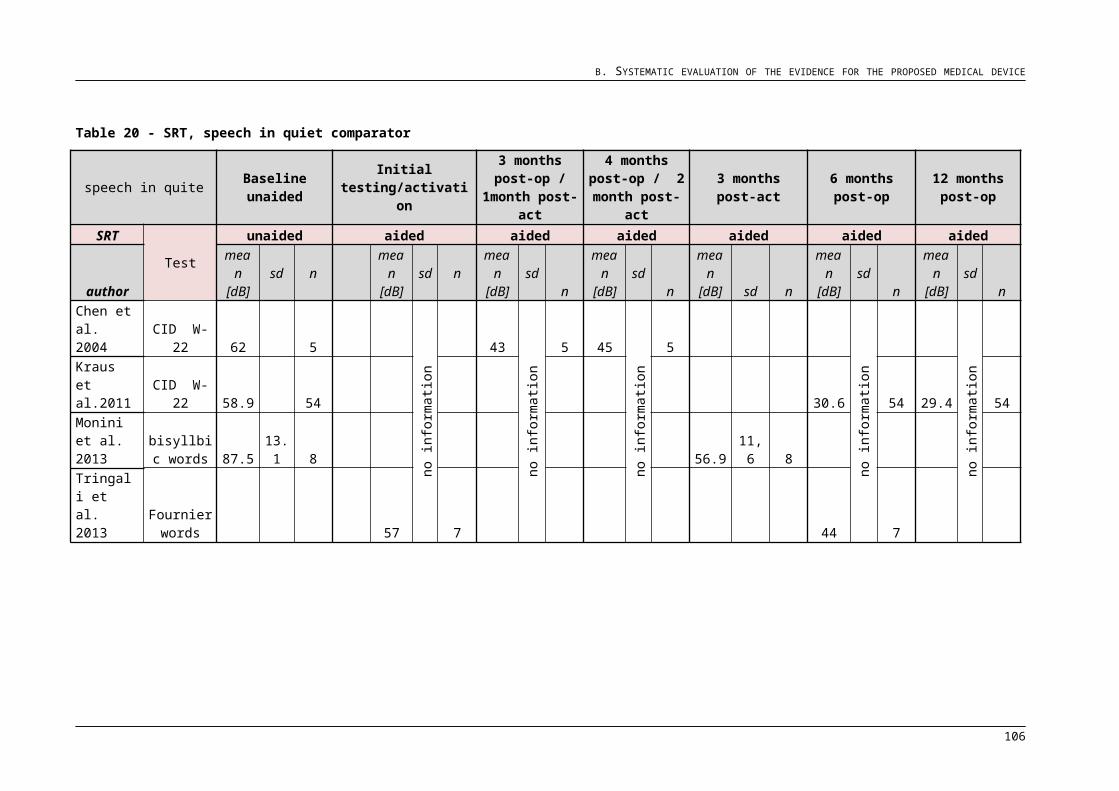
D. ECONOMIC EVALUATION FOR THE MAIN INDICATION
MEI failure
For the Vibrant Soundbridge. Information on device failure for the Vibrant Soundbridge
system was obtained using the cumulative survival curve calculated over a period of 11.3
years. This is only 9 month shorter than the product life cycle, this data was however not
considered due to the reduced number of implants entering the late interval. The CSR
(cumulative survival rate) was calculated using life tables based upon the scheme
specified by the Pacemaker standard ISO 5841-2:-2014. Only device- and accident-
related failures as well as unknown failures were accounted for in the device-related
CSRs which are used in the calculation of device failure rate. As the data available was
reported in intervals of three months, a six-month failure rate was estimated from the
reported cumulative proportion surviving at the end of each 6-month interval using the d
DEALE method. The estimated device failure rate averaged 0.186 % and at the end of
11.3 years was equal to 0.148 % .
Applying a constant failure rate of 0.186 % (average device failure rate) shows very good
agreement between the cumulative survival rate and the line of fit using the DEALE
method in the first eight years of device use, but may heavily underestimate the failure
rate in the longer term. With a constant failure rate of 0.148 % (based on the cumulative
proportion surviving of 0,96582 at 11.3 years), the agreement between the cumulative
survival and line of fit is more consistent with the estimated CSRs being nearly always
within the 95 % confidence intervals of the original data. This constant rate was preferred
in the base-case analysis.
Figure redacted
Fig 12 – Goodness of fit between the true cumulative survival rate and estimated 6-month values (derived using the DEALE method) for the VSB
The rate of reimplantation following device failure was reported in three studies (Luetje
2010; Mosnier 2008; Schmuziger 2006), however mostly for the previous generation of
the Vibrant Soundbridge implant. In a total of 16 device failures 12 were known to be
reimplanted, resulting in a probability of 75 %. Assuming that a device-related failure is
the only complication in these cases, this rate can be used for the current generation of
implants in the economic analysis. The calculated probability can also be applied as a
constant value as in clinical practice re-operation always occurs within 6 months after
device failure.
114
D. ECONOMIC EVALUATION FOR THE MAIN INDICATION
For the Maxum/SOUNDTEC. In the clinical trial of the SOUNDTEC Direct Drive system
there were no reported device failures over a period of 12 months. A rate of 0 events is
however not realistic for extrapolating to a 10 year time frame. It can be assumed that
the device-related survival is similar to the VSB as both systems employ a transducer
coupled to the ossicles and can be damaged for example by trauma to the head. Hence,
to provide a comparison of costs, the device failure and explantation rates estimated for
the VSB were also applied for the Maxum/Soundtec.
Cease MEI
Two studies in the literature provided information on voluntary non-use of the Vibrant
Soundbridge and a third study provided information on the Maxum/Soundtec. Reasons
for non-use were various, including explantation of the internal device without re-
implantation. The study characteristics and derived estimates are listed in Table 36. For
the VSB, the weighted mean (based on sample size) of the instantaneous rates were
used to derive the 6-month probability. The rates for ceasing to use either MEI were
assumed to remain constant over time and were used directly in base-case analysis.
There was no information in the identified studies on the proportion of people with
unresolved adverse events ceasing to use their device, hence it was accepted to be 0 for
both MEI. The proportion of non-use in patients who are reimplanted following a device
failure is equivalent to the probability of voluntary non-use in the whole population, which
is described above.
115
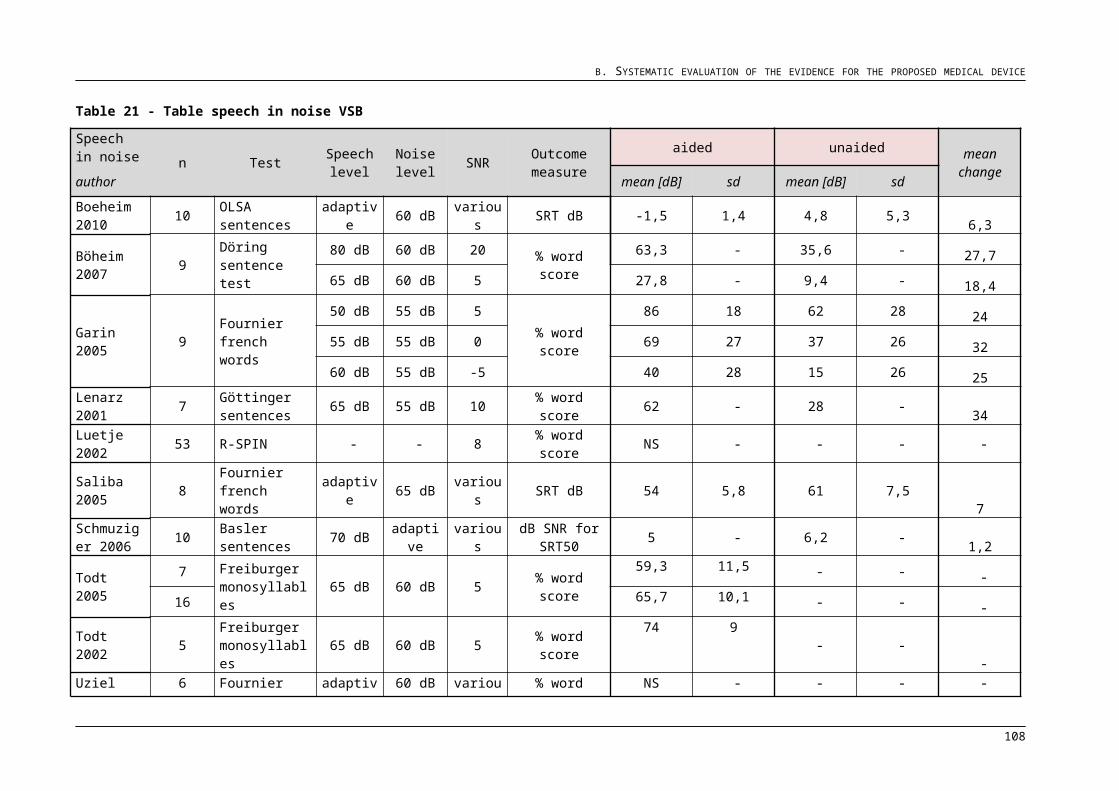
D. ECONOMIC EVALUATION FOR THE MAIN INDICATION
Table 36 - Estimated rate of voluntary non-use of the Vibrant Soundbridge
SourceTime
interval
n Event count
Observed probabilit
yInstantaneous
rate
Vibrant Soundbridge
Mosnier 2008 6 (5-8) yrs
100 15 0,15 0,01354
Luetje 2010 7,3 (1-11) yrs 34 9 0,26471 0,02106
SOUNDTECSilverstein 2005 3 mo 64 4 0,0625 0,129077042
All-cause mortality
The most recent life tables made available by the Australian Bureau of Statistics (ABS)
were used in the model to estimate the number of people dependent on age that dies in
each cycle of the model. Gender-dependent mortality rates were combined and linear
interpolation was implemented in the TreeAge table to generate values for each cycle.
D.4.2 Direct health-care resources
The costs associated with the Vibrant Soundbridge implant system were sought directly
from the manufacturer (MED-EL Australasia). Costs for the VSB middle ear implant can
be divided into the implant and processor costs which sum to AUD 13.970, and the
procedural costs which can be further separated into pre-operational, operational and
post-operational costs for the Australian population were retrieved mostly from the
Medicare Benefits Schedule. All costs and resources are described in detail below.
Pre-operational costs
Individuals suspected of having a hearing loss are referred for a full audiometric
evaluation of their hearing by an audiologist. This includes an examination of the outer
and middle ear (impedance audiometry), determination of the type and degree of hearing
loss (pure tone audiometry) and speech perception. There may also be an assessment
of potential hearing aid use. The cost of audiological assessment according to the
identified MBS items is in total AUD 84,75.
Those found to have a mild-to-severe sensorineural hearing loss and a pathology in the
outer ear are referred on to an ENT surgeon for conservative treatment. In the case this
116
D. ECONOMIC EVALUATION FOR THE MAIN INDICATION
is unsuccessful patients are consulted by the ENT surgeon on surgical options, namely
AMEI implantation. The costs for the procedure carried out by the surgeon equal to AUD
256,65.
Candidates are counselled and a mental assessment is made by a clinical
psychologist/counsellor to understand the risks of middle ear surgery and establish
realistic expectations with the implant system. The cost of AUD 126,75 was obtained
from the Department of Veteran Affairs (DVA) fee schedule for allied health practitioners.
A good candidate is referred on to an anaesthetist for preparation for surgery at a cost of
AUD 43. All pre-operational resources together ad up to AUD 511,15.
Operational costs
It is recommended to obtain a CT scan (AUD 290) before surgery to examine patient
anatomy and determine the surgical approach; and to carry out facial nerve monitoring
(AUD 149,90) throughout the procedure to avoid surgical trauma. The anaesthetics can
then be initiated and be monitored by an anaesthetist throughout the surgery. Total costs
for this service equals AUD 455,40. The implantation procedure overall incurs a cost of
AUD 1.876,95 together with surgical assistance of AUD 375,39. The average per diem
cost of AUD 591,00 for hospitalisation was derived from the AR-DRG information for
DRG D01Z (version 5.1 round 12 – Private and Public) for CI assuming that a one-night
hospital stay would be necessary for the VSB. All operational resources together cost
AUD 3.738,64.
Post-operational costsUpon completion of surgery, auditory brainstem response (ABR) measurement is carried
out at a cost of AUD 153,95 to ensure that the middle ear is not damaged. Eight weeks
after surgery, the patient returns for medical clearance and initial activation of the Audio
Processor. At activation, the audio processor settings are adjusted in accordance with
audiometry results and user`s perception. This process is repeated at 3 months post-
activation to make any necessary changes to AP settings as people adapt to their
implant system. Individuals continually wearing their AP will further be required to pay for
batteries. Battery life for each of the devices depends on the individual usage. It was
assumed that MEI batteries would last for seven days with a price of AUD 1,00 per
battery. All post-operational costs occurring within the first cycle of the model are listed in
Table 37 alongside the pre-operational and operational costs.
117

D. ECONOMIC EVALUATION FOR THE MAIN INDICATION
Table 37 - Total costs per patient for successful VSB implantation in the first 6 months
VSB Source of unit cost Units Unit cost TotalConsumablesImplant Manufacturer 1 AUD 7.470,00 AUD 7.470,00Processor Manufacturer 1 AUD 6.500,00 AUD 6.500,00Pre operationalENT specialist MBS item 104 2 AUD 85,55 AUD 171,10Anaesthesia prep MBS item 17610 1 AUD 43,00 AUD 43,00Audiogram (ENT) MBS item 11315 1 AUD 49,20 AUD 49,20Impedance audiogram (ENT) MBS item 11327 1 AUD 19,75 AUD 19,75Impedance additional to audiogram (Audiologist) MBS item 82327 1 AUD 15,80 AUD 15,80Surgery consultation MSB item 17615 1 AUD 85,55 AUD 85,55Counselling & mental assessment (US03) DVA fee schedule item US03 1 AUD 126,75 AUD 126,75
subtotal AUD 425,60 AUD 511,15OperationalCT Scan MBS item 56016 1 AUD 290,00 AUD 290,00Facial nerve monitoring MBS item 11015 1 AUD 149,90 AUD 149,90Implant procedure (ENT) - proposed service MBS item 41554 1 AUD 1.876,95 AUD 1.876,95Assistance MBS item 51303 1 AUD 375,39 AUD 375,39Anaesthesia, initiation MBS item 20225 1 AUD 237,60 AUD 237,60Anesthesia, time-based attendance MBS item 23111 1 AUD 217,80 AUD 217,80Hospital stay AR-DRG (Vers 5.1 round 12 – Private & Public) 1 AUD 591,00 AUD 591,00
subtotal AUD 3.738,64 AUD 3.738,64Post operationalBrain stem evoked audiometry MBS item 82300 1 AUD 153,95 AUD 153,95(ENT/Audiologist) follow up consultation MBS item 10952 2 AUD 62,25 AUD 124,50Battery cost Modeller assumption 26 AUD 1,00 AUD 26,00ENT specialist MBS item 104 1 AUD 85,55 AUD 85,55
subtotal AUD 302,75 AUD 390,00Total consumables AUD 13.970,00Total direct costs AUD 4.639,79Total cost of VSB implantation AUD 18.609,79
MBS: Medical Benefits Schedule. DVA: Department of Veteran Affairs. AR-DRG: Australian Refined Diagnosis Related Group.
118
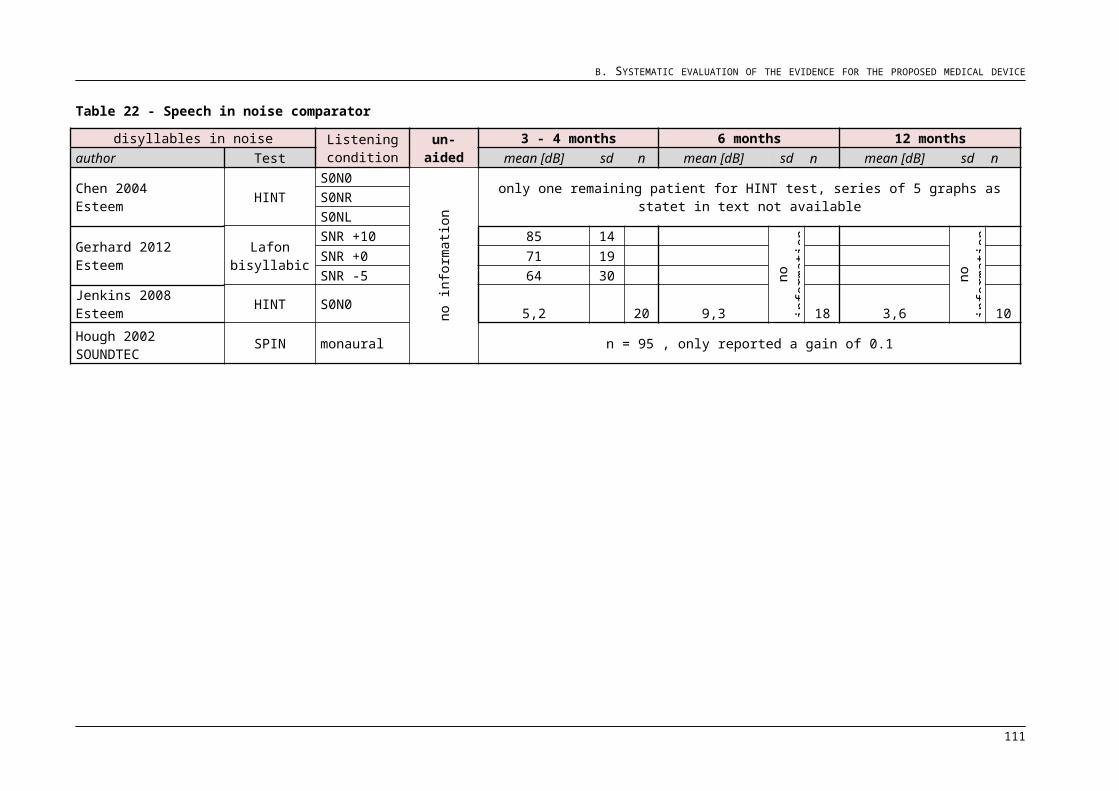
D. ECONOMIC EVALUATION FOR THE MAIN INDICATION
After the first cycle of the model, patients are followed up once again in the second cycle
and then every year. Throughout this process continuous users will carry on purchasing
batteries for their audio processors. In the long-term it is anticipated that for each person
who continues to use their implant system the external audio processor will be replaced
every 5 years. The cost associated with a new AP is assumed to be the same as the
existing one at AUD 6.500. Fitting of a new processor occurs during the regular clinical
follow-up visits where a full audiological assessment with the new device is carried out.
Long-term costs associated with VSB use are listed in Table 38.
Table 38 - Long-term costs of VSB use
Consumables MBS Item No. Units Unit cost Total(ENT/Audiologist) follow up consultation 10952 1 AUD 62,25 AUD 62,25
Battery cost 26 AUD 1,00 AUD 26,00subtotal AUD 63,25 AUD 88,25
Costs of adverse events and device failure
Studies identified in the literature that reported on safety outcomes with the VSB
indicated that for some adverse events it may be required to carry out revision surgery.
Surgery may involve correcting the position of the implanted magnet or transducer and is
most like a mastoidectomy procedure. The costs associated with revision mastoidectomy
was obtained from the MBS and was equal to AUD 1.089,90.
The occurrence of a device failure requires a more difficult procedure where the
implanted components need to be removed from the middle ear and in most cases
replaced. The explantation procedure was costed as the reference cost for the original
operation, excluding surgical consumables, at AUD 3.738,64. The re-implantation
procedure was assumed to be equal to the total costs of implantation excluding audio
processor costs, that`s AUD 12.109,79. The breakdown of costs for treating adverse
events and device failure are summarised in Table 39.
119
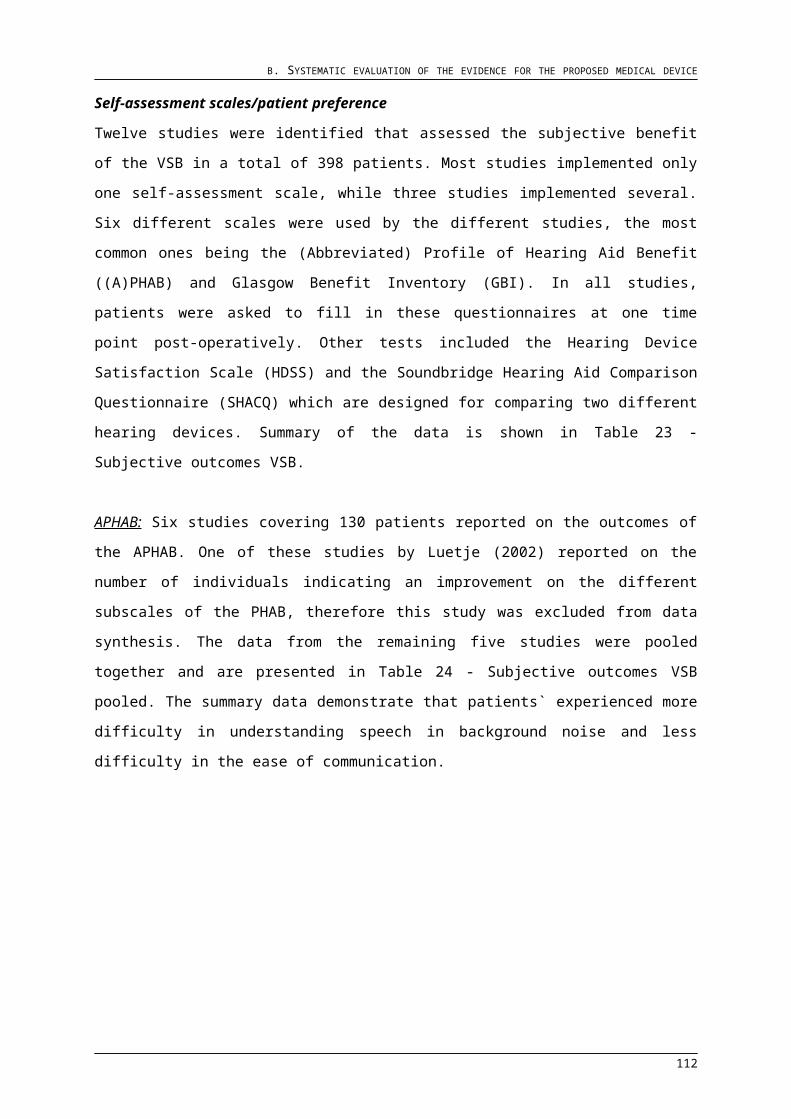
D. ECONOMIC EVALUATION FOR THE MAIN INDICATION
Table 39 - Costs associated with adverse events and device failure for the Vibrant Soundbridge system
Complication Procedure Reference Total cost
Adverse events Revision surgery MBS item 41566 AUD 1.089,90Device failure Explantation Operational costs AUD 3.738,64
Re-implantation Internal device costs AUD 7.470,00Pre-operational costs AUD 511,15Operational costs AUD 3.738,64Post-operational costs AUD 390,00Total cost of re-implantation AUD 12.109,79
Costs associated with comparator pathways
No intervention. Individuals who have received audiological assessment, ENT
consultation and counselling for AMEI may be found not to be a good candidate or the
patient themselves may decide against implantation. In either case patients incur all the
pre-operational costs described for the VSB except anaesthesia preparation. In addition
to this, there is a chance of their existing/treated outer ear pathology to reoccur over
time. The interventional costs associated with either type of pathology were sought from
the Medicare Benefits Schedule. The total cost for all pathologies together was estimated
to be AUD 131,55 as seen in Table 40.
Table 40 - Total costs per patient associated with recurring outer ear pathologies
Procedure MBS Item No. Units Unit cost TotalEar toilet 41647 1 AUD 109,90 AUD 109,90Removal of exostoses 41518 1 AUD 928,00 AUD 928,00Syringing (with GP assisstance) 23 1 AUD 37,05 AUD 37,05
Recurring otitis externa 1 AUD 109,90 AUD 109,90Recurring exostoses 0,023005 AUD 21,35 AUD 21,35Recurring earwax 0,008131 AUD 0,30 AUD 0,30
Total cost of recurring pathologies AUD 131,55 AUD 131,55
MAXUM. Health care resources required for MAXUM provision were sought from the
literature and a further identified publication by Pelosi (2014). The costs of the MAXUM
implant system were divided into the implant and processor costs of AUD 6848,44 which
was provided by the MSAC; and the procedural costs which can be further separated
into pre-operational, operational and post-operational costs. All procedural costs are
listed in Table 41.
120
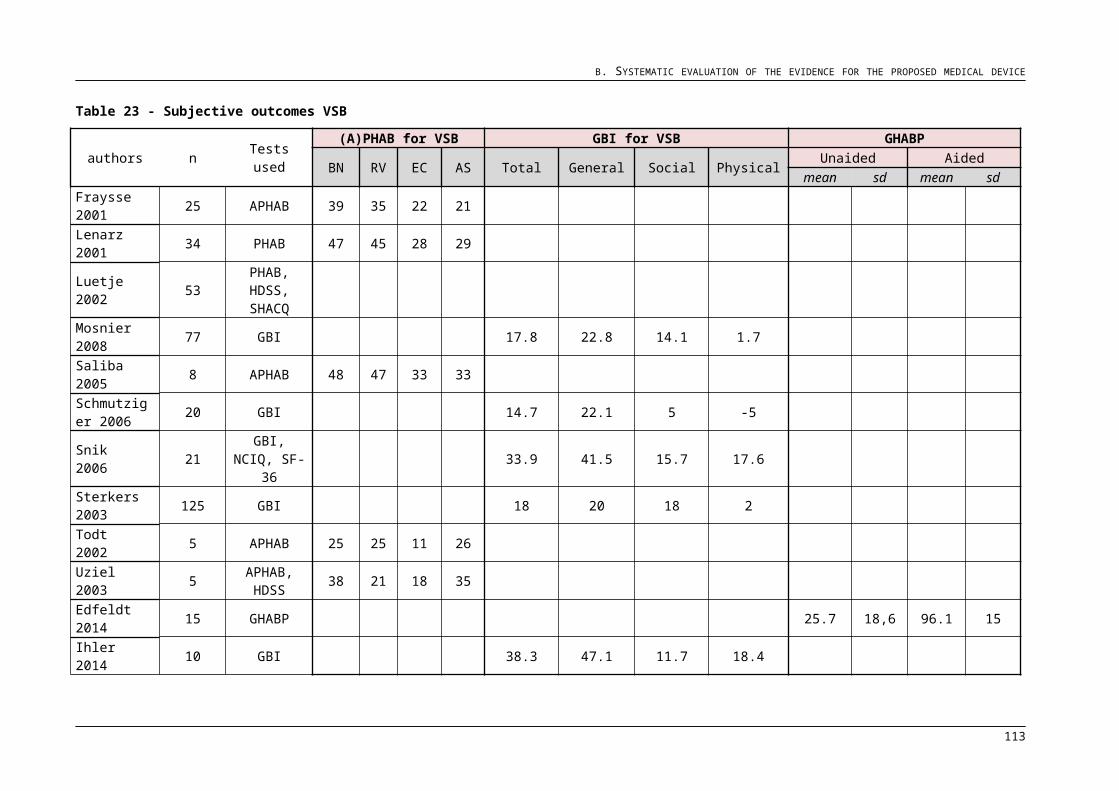
D. ECONOMIC EVALUATION FOR THE MAIN INDICATION
Pre-operational costs cover the costs of a full audiological assessment (including pure
tone and impedance audiometry by an audiologist), surgical consultation with an ENT
surgeon including the ear mould impression and counselling by a clinical
psychologist/counsellor to understand the risks of middle ear surgery and establish
realistic expectations with the implant system. All items except the last were sought from
the MBS and the latter was obtained from the Department of Veteran Affairs (DVA) fee
schedule for allied health practitioners. A good candidate is then referred on to an
anaesthetist for preparation for surgery. All pre-operational costs sum up to a total of
AUD 425,60.
Similar to the VSB implantation procedure, it is recommended by Pelosi (2014) to obtain
a CT scan before surgery and carry out facial nerve monitoring throughout the
procedure. The anaesthetics can then be initiated and be monitored by an anaesthetist
throughout the surgery. Together with surgical assistance the implantation procedure
incurs a total cost of AUD 2.989,24. No over-night hospitalisation is required after
surgery.
About three weeks after surgery, the patient returns for medical clearance and fitting of
the integrated processor and coil (PC). During fitting, small adjustments in the shape of
the IPC can be undertaken to optimize its alignment with the implanted magnet. A 10-
week accommodation period follows the sound processor fitting in which further
adjustments of the IPC and sound processor settings may be made. Typically 1-3
postoperative visits are required for this process. Audiological assessment is carried out
at the 20 weeks postoperative follow-up. Individuals continually wearing their IPC will
further be required to pay for batteries which are expected to last for seven days. All
post-operational costs occurring within the first cycle add up to a total of AUD 469,40.
After the first cycle of the model, patients are followed up once again in the second cycle
and then every year. Throughout this process continuous users will carry on purchasing
batteries for their audio processors. In the long-term it is anticipated that for each person
who continues to use their implant system the external IPC will be replaced every 5
years. The cost associated with a new AP is assumed to be the half of the implant
system costs which would equal to AUD 3.424,22. Fitting of a new processor occurs
during the regular clinical follow-up visits where a full audiological assessment with the
new device is carried out.
121

D. ECONOMIC EVALUATION FOR THE MAIN INDICATION
Table 41 - Total costs per patient for successful MAXUM/Soundtec implantation in the first 6 monthsMaxum/Soundtec Source of unit cost Units Unit cost TotalConsumablesImplant MSAC 1Processor MSAC 1Pre operationalENT specialist MBS item 104 1 85,55AUD 85,55AUD Anaesthesia prep MBS item 17610 1 43,00AUD 43,00AUD Audiogram (ENT) MBS item 11315 1 49,20AUD 49,20AUD Impedance audiogram (ENT) MBS item 11327 1 19,75AUD 19,75AUD Impedance additional to audiogram (Audiologist) MBS item 82327 1 15,80AUD 15,80AUD Surgery consultation (pre-OP Ear Canal Impressions)MBS item 17615 1 85,55AUD 85,55AUD Counselling & mental assessment (US03) DVA fee schedule
item US031 126,75AUD 126,75AUD
subtotal 425,60AUD 425,60AUD OperationalCT Scan MBS item 56016 1 290,00AUD 290,00AUD Facial stem monitoring MBS item 11015 1 149,90AUD 149,90AUD Procedure (ENT) - Operating room & recovery Room FeesMBS item 41554 1 1.876,95AUD 1.876,95AUD Assistance (Surgeon fee) MBS item 51303 1 375,39AUD 375,39AUD Anaesthesia initiation MBS item 20225 1 237,60AUD 237,60AUD Anesthesia, time-based attendance MBS item 23033 1 59,40AUD 59,40AUD
subtotal 2.989,24AUD 2.989,24AUD Post operational(ENT/Audiologist) follow up consultation MBS item 10952 3 62,25AUD 186,75AUD Battery cost Modeller assumption 26 1,00AUD 26,00AUD ENT specialist MBS item 104 3 85,55AUD 256,65AUD
subtotal 148,80AUD 469,40AUD Total consumables 6.848,44AUD Total direct costs 3.884,24AUD Total cost of MAXUM implantation 10732,68
6.848,44AUD 6.848,44AUD
MSAC: Medical Services Advisory Committee. MBS: Medical Benefits Schedule. AR-DRG: Australian Refined Diagnosis Related Group.
122
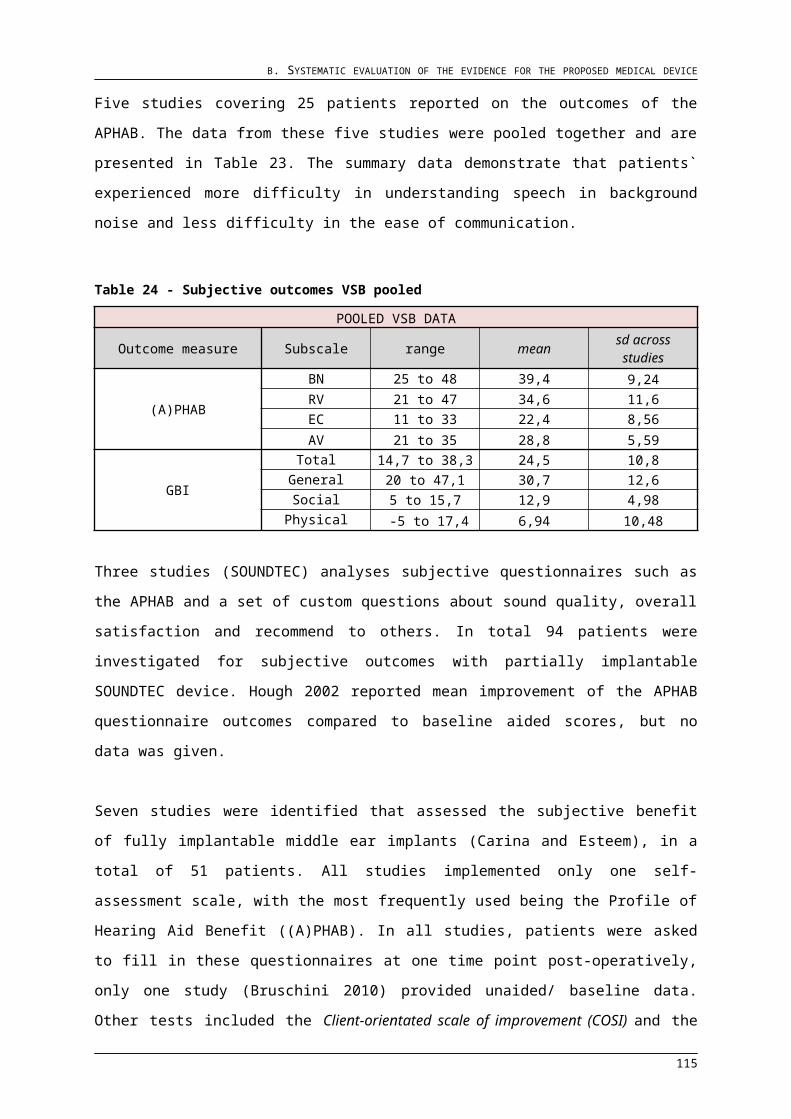
D. ECONOMIC EVALUATION FOR THE MAIN INDICATION
Long-term costs associated with MAXUM use are listed in Table 42.
The clinical trial of the SOUNDTEC Direct Drive system indicated the need for revision
surgery in a single case. Surgery may involve checking the status of the tympanic
membrane or the positioning of the transducer on the stapes bone and is most like a
transcanal stapedectomy procedure.
Table 42 - Long-term costs of Maxum/Soundtec use
Consumables MBS Item No. Units Unit cost Total(ENT/Audiologist) follow up consultation 10952 1 AUD 62,25 AUD 62,25
Battery cost 26 AUD 1,00 AUD 26,00subtotal AUD 63,25 AUD 88,25
The costs for stapedectomy obtained from the MBS were AUD 1089.90. In the case of a
device failure the implanted components need to be removed from the middle ear and in
most cases replaced. The explantation procedure was costed as the reference cost for
the original operation, excluding surgical consumables, at AUD 2.989.24. The re-
implantation procedure was assumed to be equal to the total costs of implantation
excluding the estimated audio processor costs, that`s AUD 7.308,46. The breakdown of
costs for treating adverse events and device failure are summarised in Table 43.
Table 43 - Costs associated with adverse events and device failure for the Maxum/Soundtec system.
Complication Procedure Reference Total cost
Adverse events Revision surgery MBS item 41608 AUD 1.089,90Device failure Explantation Opeartional costs AUD 2.989,24
Re-implantation Internal device costs AUD 3.424,22Pre-operational costs AUD 425,60Opeartional costs AUD 2.989,24Post-operational costs AUD 469,40Total cost of re-implantation AUD 7.308,46
D.4.3 Health outcomes
For the main evaluationIn the main economic evaluation the health outcome of interest was generic quality of life
measured with the HUI-3. The HUI-3 has been used in other economic evaluations of
hearing implants (Bond 2009; Colquitt 2011) and case series of QOL before and after
hearing implant provision (Bichey 2002; Monksfield 2011). Such data were reported for
123
D. ECONOMIC EVALUATION FOR THE MAIN INDICATION
the Vibrant Soundbridge in the study by Edfeldt (2014) which was identified in the
systematic review described in section D.3.1. As part of this study patients responded to
the HUI mark 2&3 before implantation and 6 months after AP activation.
Inidividual-level data which were not reported in the publication was sought through
personal communication with the author. The data from 15 patients with sensorineural
hearing loss was bootstrapped using 1000 samples. The mean utility weight measured in
the unaided situation which is implemented in the No intervention arm of the model is
0,57514, and the mean utility weight measured with the VSB and implemented in the
MEI implantation arm of the model is 0,66868. The confidence levels The mean utility
weights included in the No intervention and MEI implantation arms of the model are
depicted in Table 44.
Table 44 - Health outcome values used in the main economic evaluation
Treatment mean utility 95%CINo intervention 0,57514 0,46031-0,68997
MEI implantation 0,66868 0,55261-0,78474
As hearing deteriorates with age, it is expected that health utility weights will also
decrease. However there were no identified studies that reported quality of life over a
long time of device use, or as a measure dependent on age. HUI reference scores from
the Australian population were obtained from the HUInc. website to use a as a reference
for calculating age-dependent utility values. As the starting age of the economic model
was 53, the reference score for the 50-59 age range was accepted as the baseline value.
For each age range a scaling factor was calculated using the formula:
Scaling factor=age group utility/baseline utility
The scaling factor was then multiplied by the mean utility value entered in to the model.
The resulting age-dependent utility values for the unaided and aided conditions are given
in Table 45. Linear interpolation was enabled in TreeAge tables to enable the calculation
of utility values for each cycle.
124
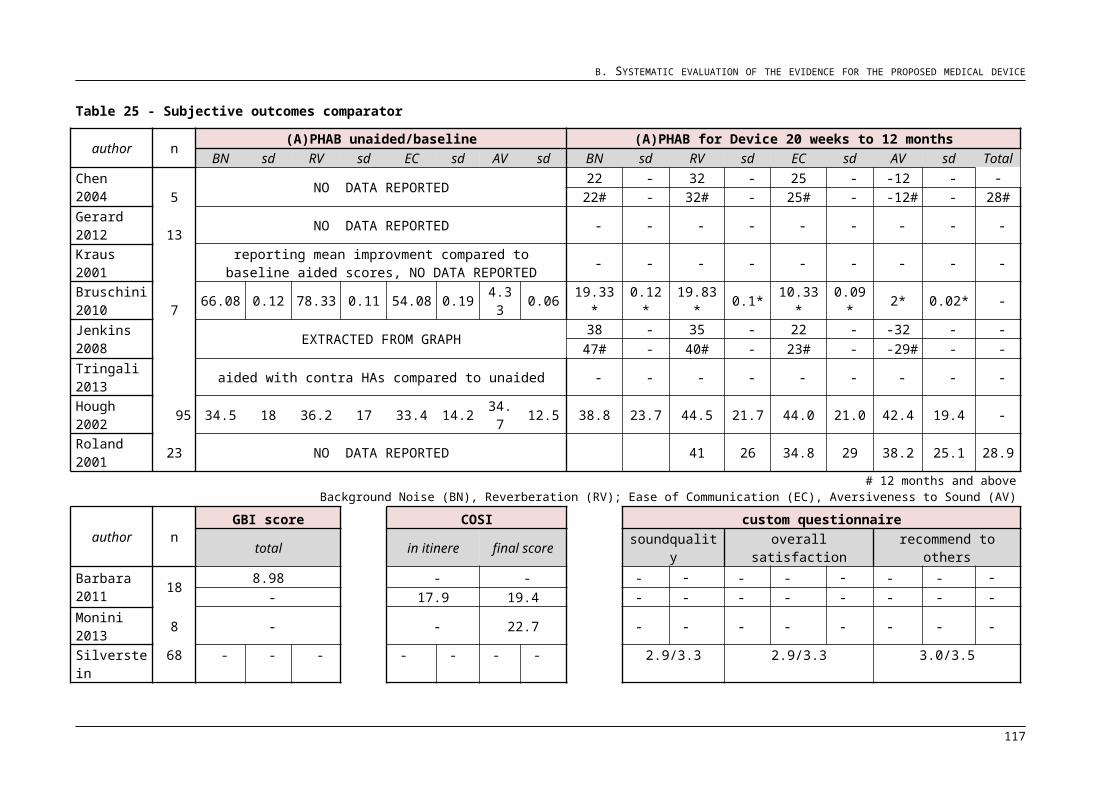
D. ECONOMIC EVALUATION FOR THE MAIN INDICATION
Table 45 - Age-dependent values used to model incremental utility in the main economic evaluation.
Age range15-19 20-29 30-39 40-49 50-59 60-69 70-79 80+
Scaling factor 112,99% 115,58% 112,99% 110,39% 100,00% 100,00% 93,51% 83,12%
Unaided utilty 0,64968 0,66461 0,64968 0,63474 0,57514 0,57514 0,53766 0,47792
Aided utility 0,75475 0,77210 0,75475 0,73740 0,66868 0,66868 0,62462 0,55522
For comparing MEI
When comparing the different partially implantable AMEI against each other, the health
outcome of choice was patient perceived benefit. This is due to no utility measures being
carried out in the studies investigating outcomes with the SOUNDTEC Direct Drive
system. These studies implemented the Abbreviated Profile of Hearing Aid Benefit
(APHAB) which is a common measure used in studies of the Vibrant Soundbridge
implant system. This questionnaire documents the amount of difficulty experienced by
implant users and higher numbers represent poorer outcomes.
Three of the six identified studies on the VSB and one of the two identified studies on the
SOUNDTEC reported outcomes on all subscales of the APHAB within the first six
months of device use. For the VSB, the weighted mean of the estimated global scores
was used as the initial effectiveness reward while single study data for the SOUNDTEC
was used directly in the model. None of these studies reported results measured in the
unaided situation before implantation. The study by Cox and Alexander (1995) describing
the development of the APHAB was used for estimating values in the unaided
population. The study demographics and the values entered into the model are
described in Table 46.
Table 46 - Health outcome values used for comparing partially implantable MEI.
Source n Global score Sd
Unaided Cox & Alexander 1995100 65,7 -
Aided with VSB Todt 2002 5 20,3 -Uziel 2003 5 25,9 10,5Saliba 2005 8 42,7 -
weighted mean 18 31,8 -Aided with MXM Hough 2002 93 42,4 19,4
As with utility values, it is expected that patient perceived benefit decreases over time.
One of the studies identified in the systematic literature search but not included in
125
D. ECONOMIC EVALUATION FOR THE MAIN INDICATION
analysis reported long-term outcome on the APHAB with different MEI. The reason for
exclusion was due to data from different implant systems being pooled together. This
study is still useful to get an impression about how APHAB outcomes vary over time.
Looking at the results of this paper it was observed that outcomes at 6 and 12 months
were similar (43.6 vs. 46.6), but substantially decreased over a period of 7.5 years
(55.6). After the first year of device use, average scores dropped by 9 units over a period
of 6.5 years. Assuming a constant decrease over time, a rate of 0.7 dB change every 6
months can be estimated. Incremental effectiveness was thus kept constant in the
second cycle and then reduced by 0.7 every cycle.
D.5 Results of the main economic evaluation
Base-case results produced by the state-transition model for a cohort of individuals with
sensorineural hearing loss with/without medical condition entering the model at age 53
are depicted in Table 47 and Table 48. Compared to no intervention, the provision of the
Vibrant Soundbridge AMEI results in an improvement of 1,41 QALYs at a cost of AUD
21.927 per patient over a 10 year timeframe.
Table 47 - Base-case results produced by the state-transition model comparing VSB vs. No intervention.
Strategy No intervention
Incremental cost QALY Incremental
QALY ICER ($/QALY)
No intervention AUD 2.541 AU - 8,86 0,00 -
VSB implantation
AUD 24.468 AUD 21.927 10,27 1,41 AUD 15.575
Table 48 - Base-case results produced by the state-transition model comparing VSB vs. Maxum/Soundtec intervention.
Strategy No intervention
Incremental cost Effectiveness
Incremental effectivenes
sICER
($/effectiveness)
MXM implantation AUD 13.850
-791,79 -
-VSB implantation AUD 24.468 AUD 10.619 592,38 199,41 AUD 53,25
126
D. ECONOMIC EVALUATION FOR THE MAIN INDICATION
The Vibrant Soundbridge is more costly than the MAXUM implant system with an
increment of AUD 10.619 and also proves to be more beneficial for the patient with
effectiveness improved by 199.4 units over a 10 year period. This demonstrates that
VSB users experience substantially fewer difficulties in hearing than Maxum/Soundtec
users.
The costs accumulated over a period of 10 years are shown in Table 49. Here it can be
seen that most of the costs are accrued within the first six months due to implantation.
Long-term expenses account for up to 24 % of VSB costs and 22.6 % of MAXUM costs,
which can be mostly attributed to the renewal of the audio processor in the tenth cycle of
the model.
Table 49 - Costs accumulated over a period of 10 years for all interventions as depicted by the model.
Model cycle VSB No intervention MAXUM
0 AUD 18.587 AUD 641 AUD 10.723
1 AUD 18.688 AUD 768 AUD 10.808
2 AUD 18.786 AUD 893 AUD 10.890
3 AUD 18.826 AUD 1.013 AUD 10.921
4 AUD 18.918 AUD 1.131 AUD 10.999
5 AUD 18.955 AUD 1.245 AUD 11.028
6 AUD 19.043 AUD 1.356 AUD 11.102
7 AUD 19.078 AUD 1.464 AUD 11.129
8 AUD 19.161 AUD 1.569 AUD 11.198
9 AUD 19.194 AUD 1.671 AUD 11.224
10 AUD 24.071 AUD 1.770 AUD 13.522
11 AUD 24.102 AUD 1.866 AUD 13.546
12 AUD 24.175 AUD 1.959 AUD 13.608
13 AUD 24.205 AUD 2.050 AUD 13.631
14 AUD 24.274 AUD 2.138 AUD 13.689
15 AUD 24.301 AUD 2.224 AUD 13.711
16 AUD 24.367 AUD 2.307 AUD 13.765
17 AUD 24.393 AUD 2.387 AUD 13.786
18 AUD 24.454 AUD 2.465 AUD 13.837
19 AUD 24.468 AUD 2.541 AUD 13.850
It is possible to compare the cost impact of each health state and the respective
effectiveness outcomes of the two MEI systems. The outcomes tabulated below in
demonstrate that individuals in the successful health state contribute the most to the
incremental cost and effectiveness. Individuals who are in the `successful with
complications` state pose slightly higher costs when using the VSB while demonstrating
127
D. ECONOMIC EVALUATION FOR THE MAIN INDICATION
similar effectiveness outcomes as Maxum/Soundtec users. Those in the MEI failure state
contribute the least to costs and as while they remain unaided cannot benefit. The costs
associated with voluntary non-use of middle ear implants are much less in those who
were initially implanted with the Vibrant Soundbridge, and the effectiveness outcomes
are better too. This could be explained by the lower probability of ceasing VSB use.
All of these results are derived from non-randomised studies and are subject to
uncertainty. Randomisation in medical device research is not always plausible due to the
invasiveness of interventions. To reduce uncertainty one-way deterministic sensitivity
analysis was carried out on all variables in the model. Those variables found to be
influential on model outcomes were then entered into probabilistic sensitivity analysis.
128
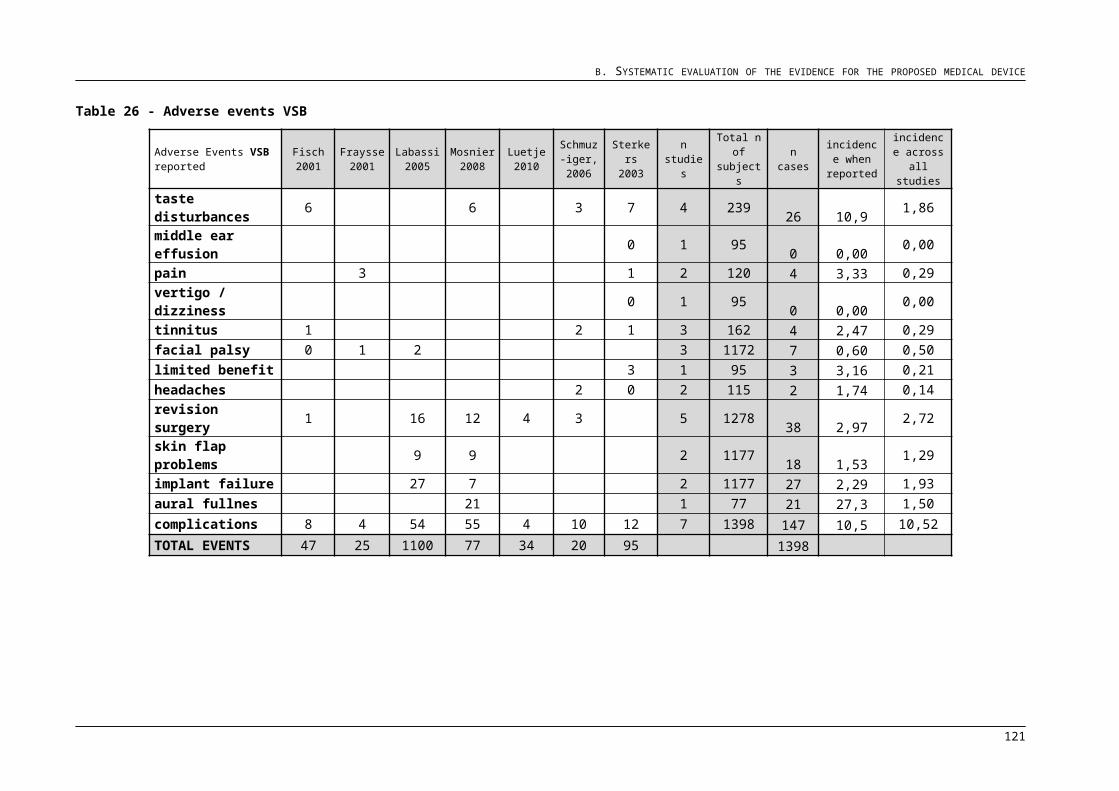
D. ECONOMIC EVALUATION FOR THE MAIN INDICATION
Table 50 - List of health states and summary of cost impacts and health outcomes included in the economic evaluation.
Health state Cost of VSB Cost of MAXUM
Incremental cost Effectiveness of VSB
Effectiveness of MAXUM
Incremental effectiveness
count % count %
Successful AUD 22.437 AUD 11.608 AUD 10.830 101,99% 561,3 639,3 78 39,14%
Successful with
complications AUD 1.691 AUD 811 AUD 880 8,29% 10,2 7,1 -3,1 -1,56%
MEI failure AUD 28 AUD 16 AUD 12 0,11% 0,1 0,1 0 0,00%
Cease MEI AUD 312 AUD 1.415 -AUD 1.103 -10,39% 20,8 145,2 124,4 62,42%
Total AUD 24.468 AUD 13.850 AUD 10.619 100,00% 592,4 791,7 199,3 100,00%
129
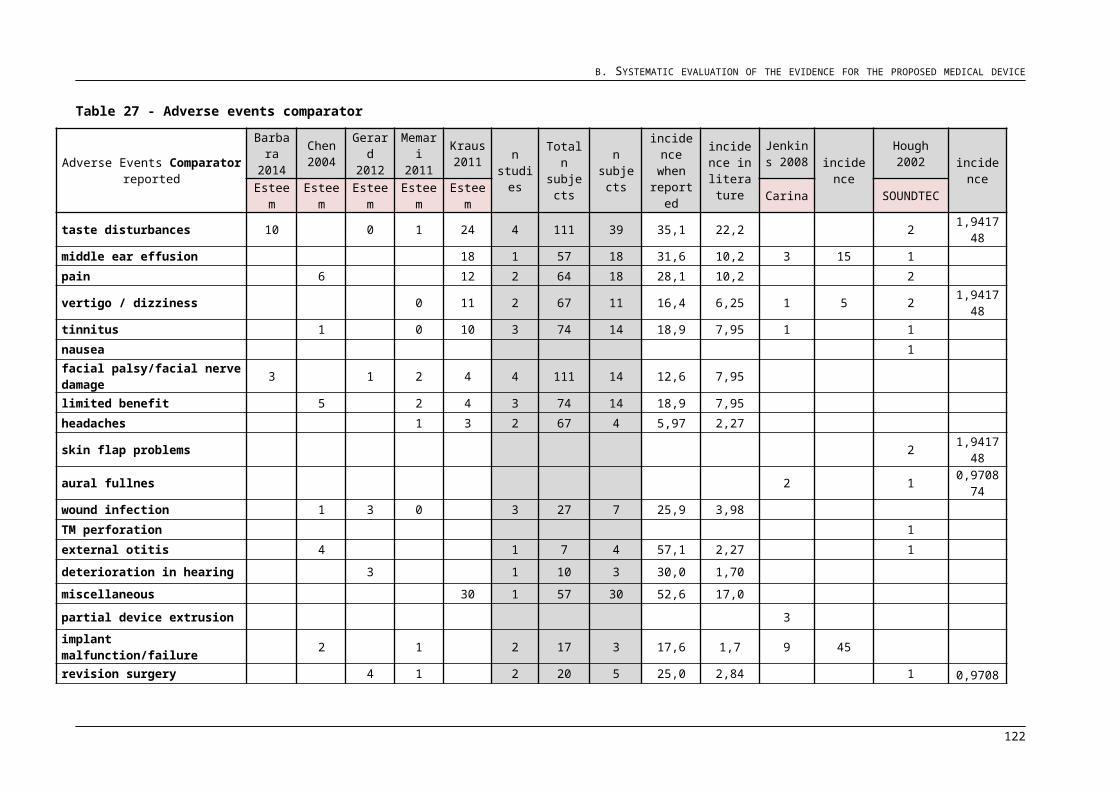
D. ECONOMIC EVALUATION FOR THE MAIN INDICATION
D.6. Sensitivity analysis
D.6.1. Deterministic sensitivity analysis
A series of one-way deterministic sensitivity analyses were conducted where each
parameter was varied one at a time from its base-case value while all other variables
were kept the same. This kind of analysis helps to identify and quantify any uncertainty in
the cost-effectiveness outcomes. Probability parameters except device failure were
varied between their 95% confidence intervals which were estimated using exact
confidence intervals for Poisson distributions. The probability of device failure was varied
between the minimum and maximum values estimated at each 6 month interval of the
cumulative survival curve. In the absence of appropriate measures of variability in the
MBS reference costs, cost parameters were varied by 25% above and below the base-
case values.
Table 51 reports the results of the DSA for the main economic evaluation. The input
parameters for each analysis, the lower and upper limits of variability, are shown in the
second column of the table. The results obtained at each limit are summarised in two
rows: The first row reports the results at the lower limit and the second row reports those
at the upper limit.
The DSA show the probability of exostoses followed and the cost and probability of otitis
externa to be the most influential on the costs of receiving no implantation. The cost of
candidacy assessment was found to have a smaller but noticeable influence on
outcomes. The cost results of middle ear implantation are generally robust to variation in
the value of input parameters. The outcomes are most sensitive to the total cost of
MEI(VSB) provision, and to a lesser extent to the probability of revision surgery and
ceasing to use MEI. Effectiveness outcomes were also impacted: An increased
probability of ceasing to use MEI slightly decreased the QALY value. This is an expected
outcome as individuals in this state are no longer receiving aided benefit. Changing the
input parameters of the utility variables demonstrated that the model is significantly
decreasing the outcomes in accordance with the inputted values.
reports the results of DSA for the economic evaluation comparing the two partially
implantable MEI. The cost and effectiveness results are generally robust to variation in
the value of input parameters. The cost outcomes are most sensitive to the costs of VSB
and MAXUM provision, and then to a lesser extent to the probability of ceasing to use
MAXUM and VSB, and revision surgery following implantation with either
130
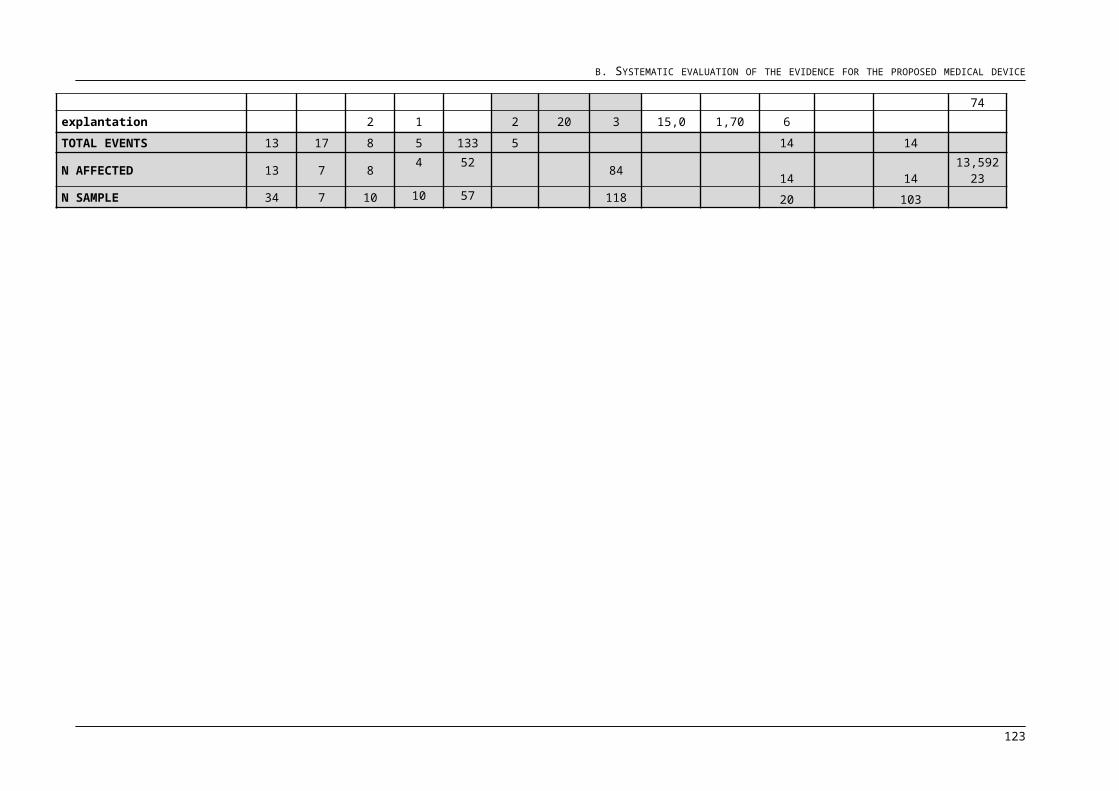
D. ECONOMIC EVALUATION FOR THE MAIN INDICATION
Table 51 – Deterministic sensitivity analysis for the main economic evaluation (all monetary outcomes in AUD)
131
D. ECONOMIC EVALUATION FOR THE MAIN INDICATION
VariableInput value Cost of no
interventionCost of
VSBIncremental
costQALY for no intervention
QALY for VSB Incremental utility
Cost of treating otitis externa 82,43 2116,84 24468,43 22351,60 8,86 10,27 1,41137,38 2965,47 24468,43 24502,96 8,86 10,27 1,41
Cost of treating exostosis 696,00 2458,75 24468,43 22009,69 8,86 10,27 1,411160,00 2623,56 24468,43 21844,87 8,86 10,27 1,41
Cost of treating impacted cerumen
27,79 2539,99 24468,43 21928,44 8,86 10,27 1,4146,31 2542,32 24468,43 21926,12 8,86 10,27 1,41
Probability of recurring otitis externa
0,73732 2095,32 24468,43 22373,12 8,86 10,27 1,411 2541,16 24468,43 21927,28 8,86 10,27 1,41
Probability of recurring exostosis
0,00266 2249,65 24468,43 22218,79 8,86 10,27 1,410,07939 3349,33 24468,43 21119,11 8,86 10,27 1,41
Probability of recurring cerumen 0,00218 2537,75 24468,43 21930,68 8,86 10,27 1,410,02048 2548,22 24468,43 21920,21 8,86 10,27 1,41
Cost of candidacy assessment 383,36 2413,75 24468,43 22054,68 8,86 10,27 1,41638,94 2668,56 24468,43 21799,88 8,86 10,27 1,41
Cost of MEI provision 13957,34 2541,16 19830,04 17288,88 8,86 10,27 1,4123262,24 2541,16 29106,83 26565,68 8,86 10,27 1,41
Cost of revision surgery 817,43 2541,16 24458,15 21917,00 8,86 10,27 1,411362,38 2541,16 24478,72 21937,56 8,86 10,27 1,41
Cost of reimplantation 9082,34 2541,16 24416,35 21875,20 8,86 10,27 1,4115137,24 2541,16 24520,52 21979,36 8,86 10,27 1,41
Cost of MEI explantation 2803,98 2541,16 24463,07 21921,92 8,86 10,27 1,414673,30 2541,16 24473,79 21932,64 8,86 10,27 1,41
Probability of adverse events 0,4429 2541,16 24448,76 21907,61 8,86 10,27 1,410,14973 2541,16 24498,53 21957,38 8,86 10,27 1,41
Variable Input value Cost of no Cost of Incremental QALY for no QALY for VSB Incremental
132
D. ECONOMIC EVALUATION FOR THE MAIN INDICATION
intervention VSB cost intervention utilityProbability of device failure 0,00136 2541,16 24451,77 21910,61 8,86 10,27 1,41
0,00226 2541,16 24576,59 22035,44 8,86 10,27 1,41Probability of ceasing to use MEI
0,00181 2541,16 24551,39 22010,24 8,86 10,29 1,430,05391 2541,16 24234,65 21693,49 8,86 10,22 1,36
Probability of unresolved adverse events
0,06101 2541,16 24465,96 21924,80 8,86 10,27 1,410,21301 2541,16 24472,68 21931,52 8,86 10,27 1,41
Probability of revision surgery 0,00004 2541,16 24427,37 21886,21 8,86 10,27 1,410,33386 2541,16 24979,69 22438,53 8,86 10,27 1,41
Probability of reimplantation 0,38735 2541,16 24365,72 21824,57 8,86 10,26 1,401 2541,16 24539,77 21998,61 8,86 10,28 1,42
Uitlity of receiving no intervention
0,55261 2541,16 24468,43 21927,28 8,75 10,27 1,520,78474 2541,16 24468,43 21927,28 8,98 10,27 1,29
Utility after receiving MEI 0,46030 2541,16 24468,43 21927,28 8,86 10,15 1,290,68996 2541,16 24468,43 21927,28 8,86 10,39 1,53
133
D. ECONOMIC EVALUATION FOR THE MAIN INDICATION
Table 52 – Deterministic sensitivity analysis for comparing partially implantable MEI (all monetary outcomes in AUD)
Variable Input value Cost of MAXUM
Cost of VSB
Incremental cost
Effectiveness of MAXUM
Effectiveness of VSB
Incremental effectiveness
Cost of MXM explantation 2196,18 13845,82 25167,89 11322,07 791,80 592,40 199,403536,55 13852,66 25167,89 11315,23 791,80 592,40 199,40
Cost of MXM provision 8049,51 11174,80 25167,89 13993,09 791,80 592,40 199,4013415,85 16524,93 25167,89 8642,96 791,80 592,40 199,40
Cost of MXM reimplantation 5481,35 13821,86 25167,89 11346,03 791,80 592,40 199,409135,58 13877,88 25167,89 11290,01 791,80 592,40 199,40
Cost of VSB explantation 2803,98 13849,87 25161,53 11311,66 791,80 592,40 199,404673,30 13849,87 25173,25 11323,38 791,80 592,40 199,40
Cost of VSB provision 13957,34 13849,87 20529,50 6679,63 791,80 592,40 199,4023262,24 13849,87 29806,29 15956,42 791,80 592,40 199,40
Cost of VSB reimplantation 8354,84 13849,87 25119,98 11270,11 791,80 592,40 199,4013924,74 13849,87 25215,80 11365,93 791,80 592,40 199,40
Cost of revision surgery 817,43 13838,88 25157,61 11318,73 791,80 592,40 199,401362,38 13860,85 25178,18 11317,33 791,80 592,40 199,40
Probability of AE - MXM 0,0304 13824,37 25167,89 11343,52 791,80 592,40 199,400,14656 13893,93 25167,89 11273,96 791,80 592,40 199,40
Probability of ceasing MXM 0,05397 14124,56 25167,89 11043,33 766,20 592,40 173,800,21630 13422,04 25167,89 11745,85 831,60 592,40 239,20
Probability of revision surgery –MXM
0,00003 13805,95 25167,89 11361,94 791,80 592,40 199,400,31160 14175,54 25167,89 10992,35 791,80 592,40 199,40
Probability of unresolved AE – MXM
0,00169 13846,89 25167,89 11321,00 791,80 592,40 199,400,37143 13865,73 25167,89 11302,16 791,80 592,40 199,40
Probability of AE - VSB 0,44290 13849,87 25148,20 11298,33 791,80 592,40 199,400,14973 13849,87 25198,03 11348,16 791,80 592,40 199,40
Variable Input value Cost of Cost of Incremental Effectiveness Effectiveness Incremental
134
D. ECONOMIC EVALUATION FOR THE MAIN INDICATION
MAXUM VSB cost of MAXUM of VSB effectiveness
Probability of ceasing VSB 0,00181 13849,87 25260,71 11410,84 791,80 585,60 206,200,05391 13849,87 24966,33 11116,46 791,80 611,40 180,40
Probability of revision surgery – VSB
0,00004 13849,87 25126,82 11276,95 791,80 592,40 199,400,33386 13849,87 25679,15 11829,28 791,80 592,40 199,40
Probability of unresolved AE – VSB
0,06101 13849,87 25165,38 11315,51 791,80 592,40 199,400,21301 13849,87 25172,24 11322,37 791,80 592,40 199,40
Probability of device failure 0,00136 13840,95 25152,83 11311,88 791,70 592,20 199,500,00226 13907,66 25265,68 11358,02 792,60 593,40 199,20
Probability of reimplantation 0,38735 13802,31 25069,14 11266,83 793,20 594,90 198,301,00000 13882,84 25236,46 11353,62 790,80 590,60 200,20
APHAB global scores-MXM 38,46 13849,87 25167,89 11318,02 738,5 592,4 146,1046,34 13849,87 25167,89 11318,02 845 592,4 252,60
APHAB global scores-VSB 20,30 13849,87 25167,89 11318,02 791,8 418 373,8042,70 13849,87 25167,89 11318,02 791,8 757,7 34,10
APHAB global scores-unaided 61,40 13849,87 25167,89 11318,02 783,5 591,2 192,3069,90 13849,87 25167,89 11318,02 799,9 593,6 206,30
135
D. ECONOMIC EVALUATION FOR THE MAIN INDICATION
device. The probability of reimplantation plays a smalle role in the model and impacts
VSB costs slightly more than MAXUM costs. Effectiveness outcomes were substantially
impacted again by the probability of ceasing to use MEI. The probability of device failure
and reimplantation varied these outcomes slightly, this is however not significant.
Changing the input parameters of the effectiveness variables demonstrated that the
model is significantly decreasing the outcomes in accordance with the inputted values.
D.6.2. Probability sensitivity analysis
The variables found to be effective in DSA were entered into a probabilistic sensitivity
analysis. For the main economic evaluation the following variables were sampled
probabilistically: the probability of exostosis, the cost and probability of otitis externa, the
cost of candidacy; the cost of MEI(VSB) provision, the probabilities of revision surgery
and ceasing to use MEI; and the utility of being unaided or aided with MEI. The
parameterisation of these variables is described in Appendix E. For the purpose of being
able to repeat the outcomes, random number seeding was used with an initial seed set
to 1.
The results of PSA tabulated in Table 53 show the cost and effectiveness outcomes to
be similar to those reported for the base-case analysis (see Table 47) Providing a
partially implantable MEI, namely the Vibrant Soundbridge, is associated with increased
QALY ranging from 1,19 to 1,52 but also increased costs ranging from AUD 21.881,48 to
AUD 22.265,86, when compared to receiving no intervention. The results are visualized
in Figure 13.
Fig 13 – Cost-effectiveness scatterplot of the Vibrant Soundbridge against no intervention
Table 53 –Probabilistic sensitivity analysis for the main economic evaluation
136
D. ECONOMIC EVALUATION FOR THE MAIN INDICATION
Strategy Cost (95%CI)Incremental
cost EffectivenessIncremental
effectivenessNo intervention 2469,08 - 8,9 -
(453,44 to 8339,73) (5,09 to 12,49)VSB implantation
24542,75 22073,67 10,26 1,36(21545,92 to
28010,05)(21881,48 to
22265,86) (6,64 to 13,77) (1,19 to 1,52)
A second PSA was carried out for comparing the two partially implantable middle ear
implants. The variables sampled probabilistically included the total costs of VSB and
MAXUM provision, the probabilities of revision surgery and voluntary non-use for each
implant, the probability of reimplantation, the effectiveness variables for each implant
system and the unaided situation. The parameterisation of these variables is also
described in Appendix E. For the purpose of being able to repeat the outcomes, random
number seeding was used with an initial seed set to 1.
provides the outcomes for each middle ear implant system. The cost and effectiveness
results are found similar to those reported for the base-case analysis (see Table 48)
Providing the Vibrant Soundbridge is associated with increased effectiveness ranging
from 176 to 211.9 but also increased costs ranging from AUD 10,505.87 to AUD
10,745.28, when compared to receiving the MAXUM. The comparison of the outcomes
for the different MEI are visualized in figure 14.
Fig 14 – Cost-effectiveness scatterplot of the Vibrant Soundbridge against the MAXUM
Table 54 – Probabilistic sensitivity analysis for comparing different partially implantable middle ear implants
137
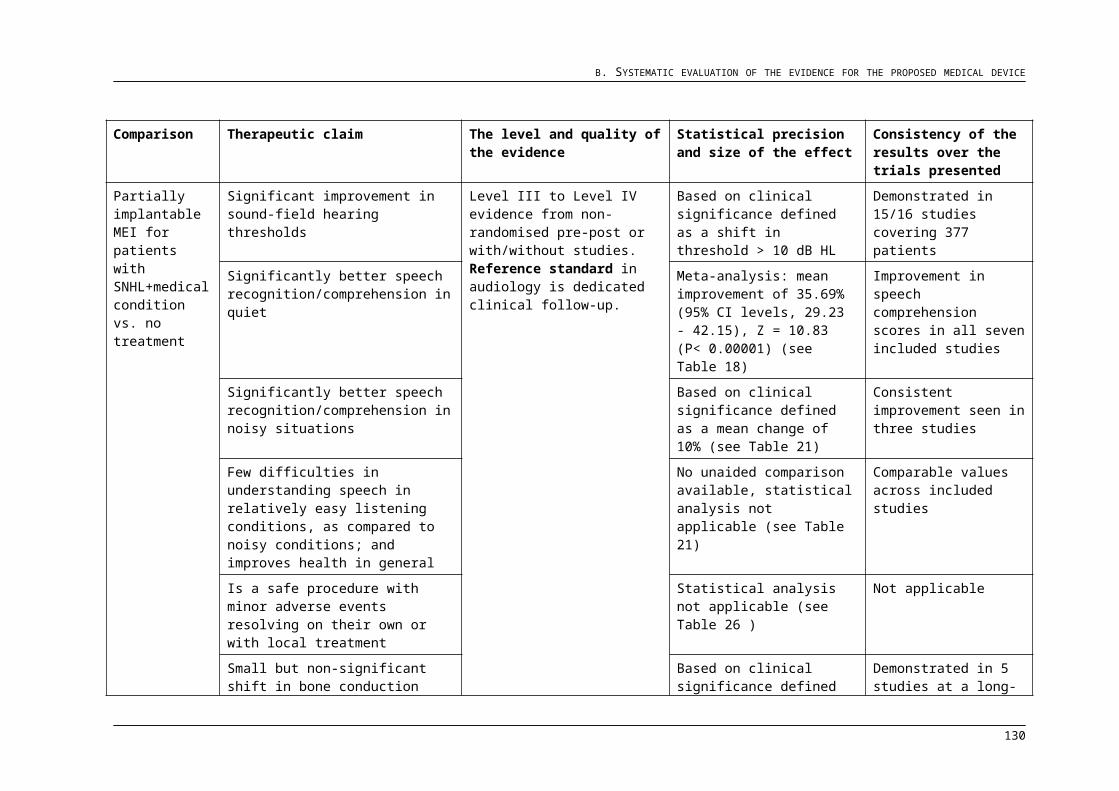
D. ECONOMIC EVALUATION FOR THE MAIN INDICATION
Strategy Cost (95%CI) Incremental cost Effectiveness Incremental
effectivenessMAXUM implantation
13879,8 - 786,6 -(12099,7 to
15874)(235,6 to 1301,5)
VSB implantation
24505,5 10625,7 592,6 194(21541,2 to
27916,3)(10505,87 to
10745,28) (427,6 to 751,6) (176 to 211,9)
D.6.3. Sensitivity of the results to changes in the modelled economic evaluation
Base-case analysis as well as sensitivity analysis was conducted on an economic model
discounted at a 5% rate over a 10 year time period. As a further measure of uncertainty
the model was re-evaluated to assess differences in outcomes when both cost and
effectiveness measures were undiscounted, and then again with the time horizon
extended to 20 years.
Results for the main economic evaluation shown in and Table 56 indicate that
discounting over a 10-year time period does not influence incremental costs too much
while effectiveness outcomes are significantly decreased. Comparing the discounted
costs at the 10 and 20 year periods show marked differences between the costs of
interventions and in the effectiveness outcomes. The incremental QALY outcomes are
substantially better with the VSB over the longer time horizon.
A similar trend was observed in the cost effectiveness outcomes of the model comparing
different MEI. The results summarized in and Table 58 show not too much of a
difference in costs while incremental effectiveness is significantly reduced when
discounted. Over a 20-year time horizon differences in the cost and effectiveness of the
two interventions become more apparent with incremental effectiveness (patient
perceived difficulty) being substantially better for the Vibrant Soundbridge middle ear
implant system.
138
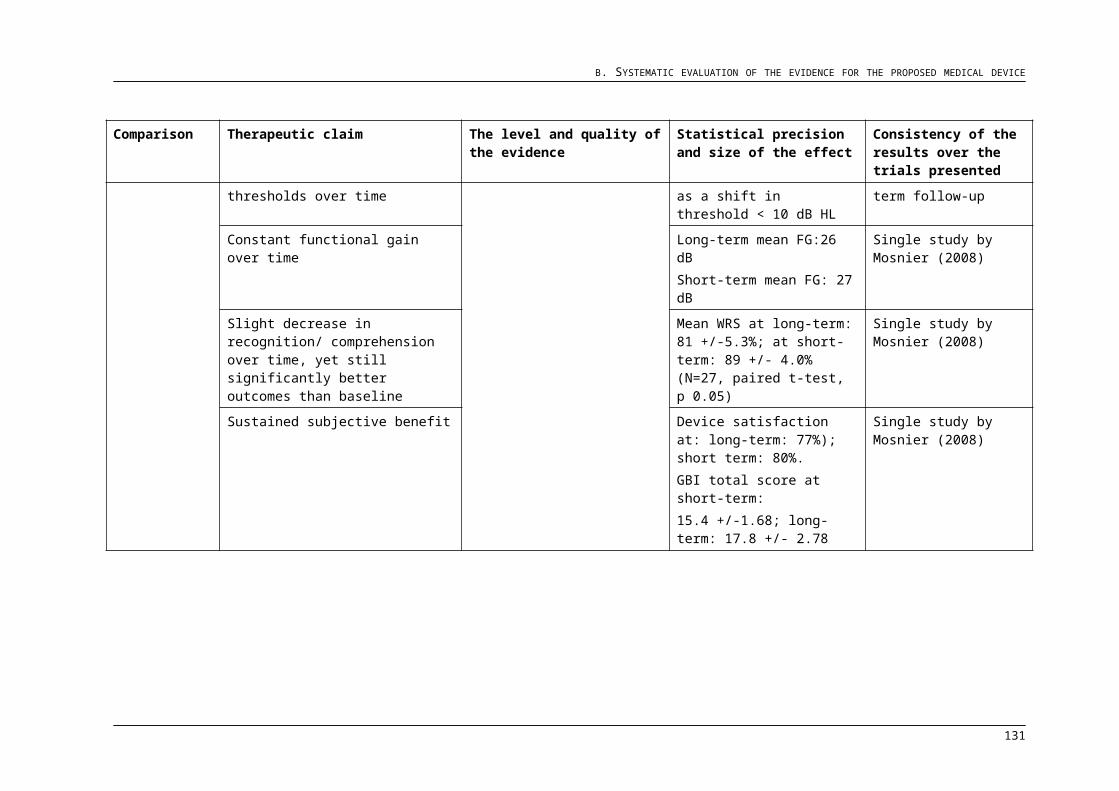
D. ECONOMIC EVALUATION FOR THE MAIN INDICATION
Table 55 – The effect of different discount rates on the main economic model
Strategy Cost Incremental cost QALY Incremental
QALYICER
($/QALY)
10 year undiscounted
No interventionAUD 3.036,76 - 11,02 - -
VSB implantationAUD 26.059,55 AUD 23.022,79 12,77 1,75 13160,06
10 year discounted
No intervention AUD 2.541,16 - 8,86 - -
VSB implantationAUD 24.468,43 AUD 21.927,28 10,27 1,41 15.575,26
Table 56 – The effect of different time horizons on the main economic model
Strategy Cost Incremental cost QALY Incremental
QALYICER
($/QALY)10 year discountedNo intervention AUD 2.541,16 - 8,86 - -
VSB implantationAUD 24.468,43 AUD 21.927,28 10,27 1,41 15.575,26
20 year discounted
No interventionAUD 3.626,74 - 13,38 - -
VSB implantationAUD 31.149,79 AUD 27.523,06 15,50 2,12 12986,73
Table 57 – The effect of different discount rates on the model comparing partially implantable MEI
Strategy Cost Incremental cost
Effective-ness
Incremental effectiveness ICER
10 year undiscountedMXM implantation
AUD 14.685,71 - 996,78 - -
VSB implantation
AUD 26.059,55 AUD 11.373,84 748,17 248,61 45,75
10-year discountedMXM implantation
AUD 13.849,87 - 791,79 - -
VSB implantation
AUD 24.468,43 AUD 10.618,57 592,38 199,41 53,25
139
D. ECONOMIC EVALUATION FOR THE MAIN INDICATION
Table 58 –The effect of different time horizons on the model comparing partially implantable MEI
Strategy Cost Incremental cost
Effective-ness
Incremental effectiveness ICER
10-year discountedMXM implantation
AUD 13.849,87 - 791,79 - -
VSB implantation
AUD 24.468,43 AUD 10.618,57 592,38 199,41 53,25
20 year discountedMXM implantation
AUD 17.168,10 - 1332,85 - -
VSB implantation
AUD 31.149,79 AUD 13.981,69 1026,00 306,85 45,57
140
E. ESTIMATED EXTENT OF USE AND FINANCIAL IMPLICATIONS
E. Estimated extent of use and financial implications
The purpose of this section is to generate the most likely utilisation and financial
estimates by requesting a set of budget impact analyses. These analyses will inform the
deliberations of MSAC about its recommendation to the Australian Government
concerning the outcome of the application. A budget impact analysis (BIA) is an
economic assessment that estimates the financial consequences of adopting a new
intervention for local, regional and national budgets. A BIA is performed in addition to a
cost-effectiveness analysis in order to provide a comprehensive economic assessment of
a new health care intervention. The BIA is assessed from the payer's perspective, and
uses a short-term time horizon, therefore does not use discounting or long term
modeling.
A BIA identifies the size of the population affected by the intervention, and the effect of
implementation on costs over the short-term. The BIA focuses is on the direct costs of
specific resources needed to put the intervention into effect.
The suggested impacts presented below assume change to the ENT treatment options.
These comments are presented to illustrate the potential impact of MBS listing of
insertion of a partially implantable Middle Ear Implant under current conditions whilst
recognising that DoHA decision making will ultimately determine the extent of use and
hence financial impact.
The proposed listing will offer an additional treatment to the MBS listing. This means that
given the cost-effectiveness benefit amount requested for implantation of a partially
implantable Middle Ear Implant in this submission, any use of the new treatment on the
MBS will be accompanied by substitution effect of opportunity costs to the society as a
whole, thereby generating cost savings to the MBS on the long term and thus offsetting
the costs of insertion of a partially implantable Middle Ear Implant.
Given the data in Section B, an epidemiological approach is considered to inform
decision making rather than a market share approach. When compared with No
treatment, implantation of a partially implantable active middle ear implant has been
shown to improve the quality of life of the patient derived by QALY measures,
enhancement of functional gain, speech perception in quiet and in noise and subjective
benefits for the patients. This means that a specific niche population of patients that is
currently left untreated can be provided with a solution to restore their hearing to a close
to a normal level. The costs associated with an implant life span of approximately 20
141
E. ESTIMATED EXTENT OF USE AND FINANCIAL IMPLICATIONS
years are also considered in this analysis.
Section E.1 describes data sources that are selected to inform the current analysis.
Section E.2 estimates the likely extent of use for insertion of a partially implantable active
middle ear implant over the next five years. The projected use of implantation of a
partially implantable active middle ear implant is determined on the basis of the
estimated Australian population growth of 1.7 % per year (available online:
http://www.ausstats.abs.gov.au/ausstats/subscriber.nsf/0/13D196FB0DBECC3BCA257C
2E00173FAD/$File/32220_2012%20(base)%20to%202101.pdf; downloaded 2015-09-
23), which will influence the increase of number of patients per year. Besides the overall
usage the financial implications associated with the expected usage are quantified.
Section E.3 provides an estimation of changes in use and cost of other medical services.
Section E.4 determines the estimated net financial implications of the proposed
treatment for the MBS in each year over the next five years. Section E5 provides a
detailed sensitivity analysis of the parameters used in the economic model addressing
possible sources of uncertainty. An electronic spread sheet with calculations contained in
section E is provided in Attachment F.
E.1 Justification of the selection of sources of data
A literature search, though not systematic, was carried out using the search terms
“incidence OR prevalence OR epidemiology” together with common outer ear pathology
terms “otitis externa OR (ear) exostosis OR earwax OR cerumen” to identify
epidemiological research. The best available evidence was used to conduct the
estimation of the use of the proposed listing.
E.1.1 Prevalence of hearing loss in Australia according to DAP
According to the decision analytical protocol provided by PASC, in Australia SNHL is the
most common form of hearing loss. The overall prevalence of hearing loss ≧25 dBHTL2
in adults is 20.2 % for SNHL, 0.4 % for CHL and 1.6 % for MHL (Table 59). In adults,
SNHL is largely caused by ageing, with most people aged over 50 years. Sensorineural
hearing loss may also be caused by congenital malformation and exposure to noise or
ototoxic substances. There are more adult males with hearing loss than females (26.3 %
males vs. 17.1 % females). In adults, 66 % have mild hearing loss; 23 % have moderate
2 BHTL = decibels hearing threshold level.
142
E. ESTIMATED EXTENT OF USE AND FINANCIAL IMPLICATIONS
hearing loss and 11 % have severe to profound hearing loss.
Table 59 - Overall prevalence of hearing impairment, South Australian population
≧ 25dBHTL ≧ 21dBHTLAge yr SNHL CHL MHL SNHL CHL MHL
15-50 4.0 (0.0-8.3) 0.5 (0.2-0.7) 0.8 (0.0-2.0) 5.5 (0.9-10.2) 1.0 (0.0-3.2) 0.8 (0.1-1.5)
51-60 25.5 (10.8-40.3) 0.4 (0.0-1.1) 2.4 (0.6-4.1) 28.5 (13.6-43.4) 0.4 (0.0-1.1) 1.6 (0.2-3.0)
61-70 55.5 (37.4-73.6) 0.5 (0.0-1.2) 2.7 (1.2-4.3) 64.2 (45.7-82.7) 0.5 (0.0-1.2) 3.6 (1.9-5.3)
>70 68.5 (41.3-95.7) 0.0 5.0 (0.0-11.8)
77.7 (51.4-100.0)
4.8 (0.0-11.5) 4.1 (0.0-10.6)
Total 20.2 (14.9-25.4) 0.4 (0.1-0.7) 1.6 (0.7-2.5) 23.6 (18.3-29.0) 1.3 (0.0-2.9) 1.5 (0.9-2.1)
Data deriving from (Wilson et al., 1999)
The overall prevalence of hearing loss in children (<15 years) is 2.5 in 1,000. Of these, it
is estimated that 36.7 % have mild hearing loss; 38.3 % have moderate hearing loss,
13.3 % have severe hearing loss and 11.7 % have profound hearing loss. Sensorineural
hearing loss in children may be caused by genetics, maternal infection, birthing issues or
childhood infections such as meningitis. Certain population groups such as communities
of Aboriginal or Torres Strait Islander people have a significantly higher prevalence of ear
disease and hearing loss. For example, the rate of hearing loss in Aboriginal children is
estimated at between 10 % and 41 %.
In Table 60 all data sources used for the financial estimations are summarized.
143

E. ESTIMATED EXTENT OF USE AND FINANCIAL IMPLICATIONS
Table 60 - Data sources used for the financial estimates
Data retrieved Source of data Justification
Australian adult population ABS Used as the basis for the Australian epidemiological estimates.
Proportion of Australian adults with SNHL: 20.2%
Wilson et al (1999) Used to estimate the number of eligible patients for insertion of partially implantable MEIs. Used in the Protocol provided by PASC.
Proportion of SNHL patients that would be possible candidates for MEI based on audiograms: 0.76%
Junker et al (2002) Used to estimate the number of eligible patients for insertion of partially implantable MEIs. A stated in Section C1.1, a quite good overlap of the population cited in Junker et al. and the Australian population is given:
Age range between 18 and 70 years. No history of chronic otitis, Menière’s
disease, otosclerosis, central or retrocochlear lesions, systemic disease, psychiatric problems, or malignant tumors.
Symmetrical SNHL..Proportion of the Australian population affected by outer ear pathology (chronic otitis externa, ear canal stenosis/exostosis, excessive cerumen): 2.95%
Combined estimate, based on Agius et al (1992), DiBartolomeo et al (1979), Karlsmose et al (2001) and Ahmed et al (2009)
Used to estimate the number of eligible patients for insertion of partially implantable MEIs under the proposed MBS listing.
Proposed MBS item Schedule fee
Section A.2 As per proposed MBS item descriptor and fee in Section A.2. Used in the economic evaluation. The Assessment Report did not disaggregate the total cost of the procedure in the financial estimates. The Critique shows the breakdown of costs to the MBS.
Associated MBS items for service
Section D.4 Used in the economic evaluation
Associated non-MBS items for service
Section D.4.1 and Section D.4.2
Used in the economic evaluation. The societal costs were revised during the Critique.
E.1.2 Prevalence of hearing loss according to the application
Prevalence of hearing loss in the better ear (Hearing thresholds ≥25 dB) in Australia was
reported in a study of Wilson (Wilson et al., 1999) to be on the overall population 22.2 %.
The prevalence of SNHL was increasing with age. No evidence indicating a considerable
patient demand for MEI was identified in the published literature. The authors also
observed that their patients’ main concerns were audiological, rather than cosmetic or
financial (Junker et al., 2002).
Using the prevalence data reported in Appendix F, sheet ‘prevalence of pathologies’ we
conservatively estimate that up to 2,95 % of the Australian population (687’922) could be
affected by an outer ear pathology. We would like to point out there may be an overlap
between ear pathologies and that this number is conservative. The probability of a
person having both a sensorineural hearing loss within our candidacy criteria, and having
an outer ear pathology can thus be calculated using basic probability functions. With the
numbers given above, it is estimated that 4.4 in 10`000 (2.95/100 x 0.15/100) may be
affected. This would estimate 1`032 potential candidates in Australia. This number is a
144
E. ESTIMATED EXTENT OF USE AND FINANCIAL IMPLICATIONS
projection of how many could be implanted over a 10-15 year period. This would provide
an average of 69-103 cases per year.Alternatively in 2012 according to the German OPS codes used in the G-DRG system
(available from http://www.g-drg.de/cms/Datenveroeffentlichung_gem._21_KHEntgG),
0.57 % of the ENT population (approx. 75`454) received a partially implantable active
MEI, for sensorineural or conductive/mixed hearing loss. This equals to 431 cases of
implantation. Considering that Germany has a population of approximately 82`000`000,
the prevalence to the whole population would be 0.052 in 10`000. According to these
estimations, 121 cases per year of implantation for either type of hearing loss can be
estimated for Australia. In Germany, 27.3 % of all cases can be assigned to SNHL, 41 %
to MHL and 27 % to CHL indications. Approximately 4 % of the cases cannot be
assigned based on the ICD-10 codes. Applying this information to Australia it can be
estimated that 33 cases of insertion of a partially implantable Middle Ear Implant are to
be expected per year immediately after introduction of the procedure.
The use of the insertion of partially implantable Middle Ear Implants over the next five
years to 2021 is estimated based on a combination of these information. This is shown in
Section E.2.1.
E.2 Estimation of use and costs of the proposed listing
E.2.1 Historical and projected use of insertion of a partially implantable MEI
The service numbers associated with the insertion of partially implantable Middle Ear
Implants in 2017–2021 are estimated. Taking prevalence data from German data
sources into account, the numbers of possible usage of the procedure can be estimated.
As the proposed service is new to the MBS listing no historical data can be presented.
Based on the prevalence data provided in Section E.1, Table 61 presents the method for
determining the patient population eligible to receive the proposed intervention over the
first five years of an MBS listing and the maximum, minimum and average number of
procedures to be expected in each year. The insertion of partially implantable MEI is
likely to take place in both the private and public setting, although the extent to which
procedures will be done in public hospitals is unknown so far. Table 61 accounts for a
population growth of about 1.7 % per year starting in 2016, as the listing is expected for
145
E. ESTIMATED EXTENT OF USE AND FINANCIAL IMPLICATIONS
2016 this year is chosen as the base year.
In addition, it can be assumed that in addition to the estimated number of patients eligible
for implantation in the first year, new patients with SNHL and external ear pathology will
enter the pool of candidates each year. No increase in the rate of SNHL over time is
taken into account.
Table 61.- Estimated eligible population of patients 3
Description Method current (2016) 2017 2018 2019 2020 2021
A Australian population ABS 24359761 24781121 25201317 25619895 26037356 26479991
B Number of Australian adults ABS 18871777 19201809 19529153 19853831 20173593 20516544
CPrevalence of SNHL in the adult population (%)
Wilson et al., (1999) 20,20% 20,20% 20,20% 20,20% 20,20% 20,20%
DEstimated number of Australian adults with SNHL
B x C 3812099 3878765 3944889 4010474 4075066 4144342
EProportion of patients as possible candidate for a MEI
Junker et al., (2002) 0,76% 0,76% 0,76% 0,76% 0,76% 0,76%
FNumber of Australian adults with SNHL and candidates of a MEI
D x E 28972 29479 29981 30480 30970 31497
GPrevalence of external ear pathology in the Australian population (%)
see Table34 2,95% 2,95% 2,95% 2,95% 2,95% 2,95%
HEstimated number of Australian adults eligible for implantation
F x G 855 870 884 899 914 929
I Minimum number of services per year H / 15 57 58 59 60 61 62
J Maximum number of services per year H / 10 85 87 88 90 91 93
K Mean number of services per year
Average of I & J 71 72 74 75 76 77
As stated in the critique of the assessment report, still the calculation of number of
services each year is based on the assumption that the existing pool of eligible patients
could be implanted over a 10 to 15 year period, with 10 years representing a minimum
3 Reproduced from the critique of the assessment report
146
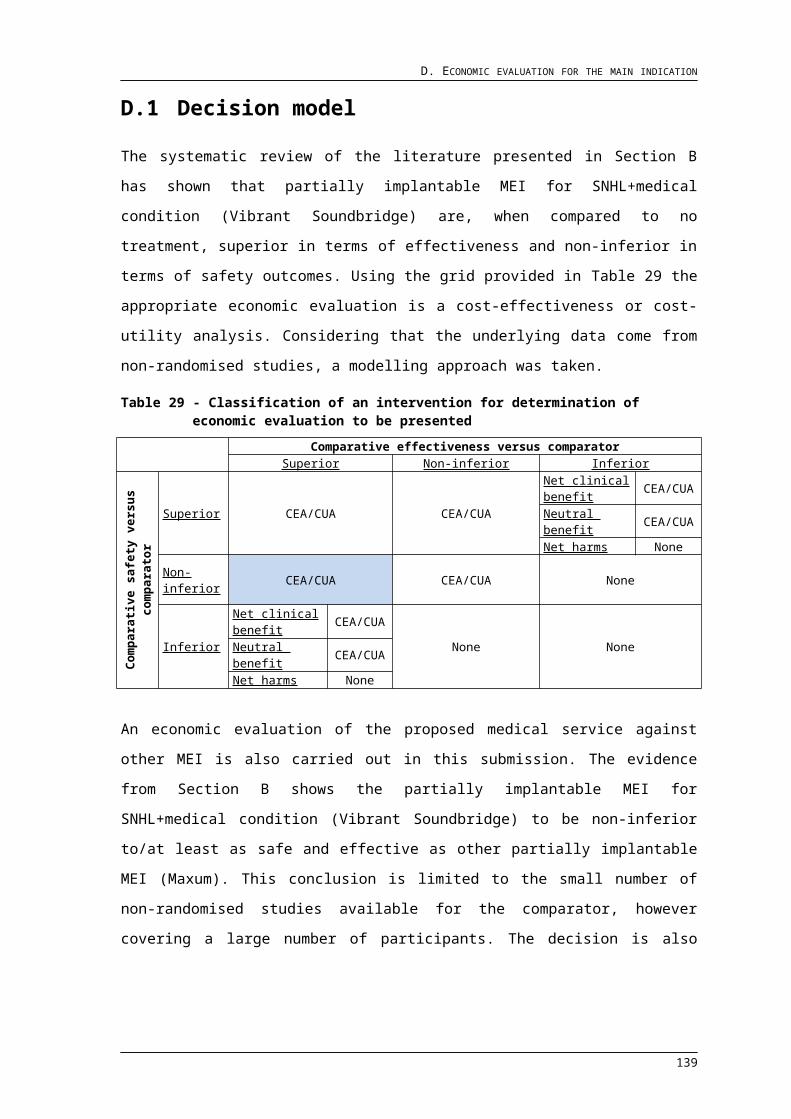
E. ESTIMATED EXTENT OF USE AND FINANCIAL IMPLICATIONS
and 15 years representing a maximum number of services per year. Of course this
assumption may be influenced by patients’ preferences, their willingness to undergo a
surgical procedure and their ability to pay out-of-pocket for additional services or non-
covered device costs. “Therefore, assuming that the eligibility criteria in the proposed
MBS item descriptor are adhered to, there is a potential for the number of services to be
less than the estimate” given in Table 61.
Taking into consideration that patients with the medical condition (i.e., candidates for the
insertion of partially implantable Middle Ear Implant) are properly examined before the
implantation the number of patients that are eligible for the requested intervention equals
the number of patients who are candidates not taking service restrictions into accaount
(e.g., hospitals/surgeons are not trained to offer the service).
E.2.2 Estimated costs of insertion of partially implantable MEIs on the MBS
Table 62 presents the estimated budget impact to the MBS. Costs for the proposed MBS
fee for the insertion of partially implantable MEIs are taken from section A.2. Costs from
section D.4. will be used to determine the financial implications of the service for the first
five years of MBS listing. Again, these cost estimates reflect a full uptake assumption,
thereby offering a conservative estimate from the perspective of the MBS. Cost offsets
associated with substitution effects are determined in Section E.3.
Table 62 - Estimated cost of proposed MBS item
Description Method current
(2016) 2017 2018 2019 2020 2021
LEstimated number of services per year
Table 61, row K
71 72 74 75 76 77
MCost to MBS of the proposed item
L x AUD 1,876.95
AUD 133.263
AUD 135.140 AUD 138.894 AUD 140.771 AUD 142.648 AUD 144.525
147
E. ESTIMATED EXTENT OF USE AND FINANCIAL IMPLICATIONS
E.3 Estimation of changes in use and cost of other medical services
Other MBS-funded medical services that are likely to be affected by listing the proposed
medical service could not be identified. The devices are mutually exclusive to the CI and
the BAHA, as was identified by the PASC committee. The proposed listing is an
extension of the current treatment options for patients who suffer from a SNHL plus
medical condition, as defined in Section A.
Other MBS costs associated with the insertion of the VSB include the cost of a CT scan,
assistance with surgery, and anaesthetist services (pre-anaesthesia consultation,
anaesthesia initiation, anaesthetist attendance for 2-2.5 hours). In addition, there are pre-
operational and post-operational MBS items associated with the procedure (accounted
for in details in Table 63 to Table 65. Issues relating to the cost of the implantation
procedure are addressed in relation to Section D.4 Unit costs for Maxum/Soundtec were
derived from appropriate MBS unit costs.
Table 63 presents the cost of other MBS items co-administered with the proposed MBS
service, over the first five years of the proposed listing. Other costs associated with the
implantation procedure (theatre/admission, equipment, hospital stay) are largely worn by
hospital budgets, private health fund ex-gratia payments, and occasionally self-funded by
patients. Although the Maxum/Soundtec system is not indicated in patients with external
ear pathology (see Section A.4), the costs associated with the insertion of the
Maxum/Soundtec are shown in Table 63 for comparison.
Costs of MBS items of pre-operational services are shown in again for the first 5 years
of listing.
Table 65 presents the cost of MBS items associated with post-operational services, over
the first five years of the proposed listing.
In cost to the MBS of re-implantation over the first five years of listing are presented. As
discussed in Section A.2, the protocol proposed a separate MBS item for explantation or
revision surgery for the MEIs. Data for revision surgery were already provided in Table
26 und Table 27 for VSB and Maxum/Soundtec, respectively, and account for 2.72 % for
VSB and 1 % for Maxum/Soundtec. These percentages were used in the estimation of
re-implantations costs to the MBS in the first five years of listing.
Error: Reference source not found presents the total cost of associated items to the MBS
for both devices.
148
E. ESTIMATED EXTENT OF USE AND FINANCIAL IMPLICATIONS
Table 63 - Estimated cost to the MBS of co-administered items
Description Method current (2016) 2017 2018 2019 2020 2021
VSB
N Cost of CT scan Table 61, row K x AUD 290,00 AUD 20.590 AUD 20.880 AUD 21.460 AUD 21.750 AUD 22.040 AUD 22.330
OCost of anaesthesia (initiation & perfusion; MBS items 20225 & 23101)
Table 61, row K x AUD 435,60 AUD 30.928 AUD 31.363 AUD 32.234 AUD 32.670 AUD 33.106 AUD 33.541
P Cost of assistance Table 61, row K x AUD 375,39 AUD 26.653 AUD 27.028 AUD 27.779 AUD 28.154 AUD 28.530 AUD 28.905
Q Total cost to MBS of associated items
N + O + P AUD 78.170 AUD 79.271 AUD 81.473 AUD 82.574 AUD 83.675 AUD 84.776
Maxum/Soundtec
RCost of anaesthesia (initiation & perfusion; MBS items 20225 & 23032)
Table 61, row K x AUD 297,00 AUD 21.087 AUD 21.384 AUD 21.978 AUD 22.275 AUD 22.572 AUD 22.869
S Cost of assistance Table 61, row K x AUD 375,39 AUD 26.653 AUD 27.028 AUD 27.779 AUD 28.154 AUD 28.530 AUD 28.905
T Cost to MBS of the proposed item
R + S AUD 47.740 AUD 48.412 AUD 49.757 AUD 50.429 AUD 51.102 AUD 51.774
149

E. ESTIMATED EXTENT OF USE AND FINANCIAL IMPLICATIONS
Table 64 – Estimated cost to the MBS of associated pre-operational items
Description Method current (2016) 2017 2018 2019 2020 2021
VSB
U Cost of ENT specialist (2 visits) Table 61, row K x AUD 85,55 x 2 AUD 12.148 AUD 12.319 AUD 12.661 AUD 12.833 AUD 13.004 AUD 13.175
V Cost of facial stem monitoring Table 61, row K x AUD 149,90 AUD 10.643 AUD 10.793 AUD 11.093 AUD 11.243 AUD 11.392 AUD 11.542
W Cost of pre-anaesthesia consult Table 61, row K x AUD 43 AUD 3.053 AUD 3.096 AUD 3.182 AUD 3.225 AUD 3.268 AUD 3.311
X Cost of audiogram Table 61, row K x AUD 49,20 AUD 3.493 AUD 3.542 AUD 3.641 AUD 3.690 AUD 3.739 AUD 3.788
Y Cost of impedance audiogram Table 61, row K x AUD 19,75 AUD 1.402 AUD 1.422 AUD 1.462 AUD 1.481 AUD 1.501 AUD 1.521
Z Cost of impedance additional to audiogram
Table 61, row K x AUD 15,80 AUD 1.122 AUD 1.138 AUD 1.169 AUD 1.185 AUD 1.201 AUD 1.217
AA Cost of surgery consultation Table 61, row K x
AUD 85,55 AUD 6.074 AUD 6.160 AUD 6.331 AUD 6.416 AUD 6.502 AUD 6.587
AB
Total cost to MBS of associated items
U + V + W + X + Y + Z + AA + AB AUD 37.935 AUD 38.470 AUD 39.538 AUD 40.073 AUD 40.607 AUD 41.141
Maxum/SoundtecAC Cost of ENT specialist Table 61, row K x
AUD 85,55 AUD 6.074 AUD 6.160 AUD 6.331 AUD 6.416 AUD 6.502 AUD 6.587
AD Cost of audiogram Table 61, row K x
AUD 49,20 AUD 3.493 AUD 3.542 AUD 3.641 AUD 3.690 AUD 3.739 AUD 3.788
AE Cost of surgery consultation Table 61, row K x AUD 85,55 AUD 6.074 AUD 6.160 AUD 6.331 AUD 6.416 AUD 6.502 AUD 6.587
AF Total cost to MBS of associated items
AC + AD + AE AUD 15.641 AUD 15.862 AUD 16.302 AUD 16.523 AUD 16.743 AUD 16.963
150
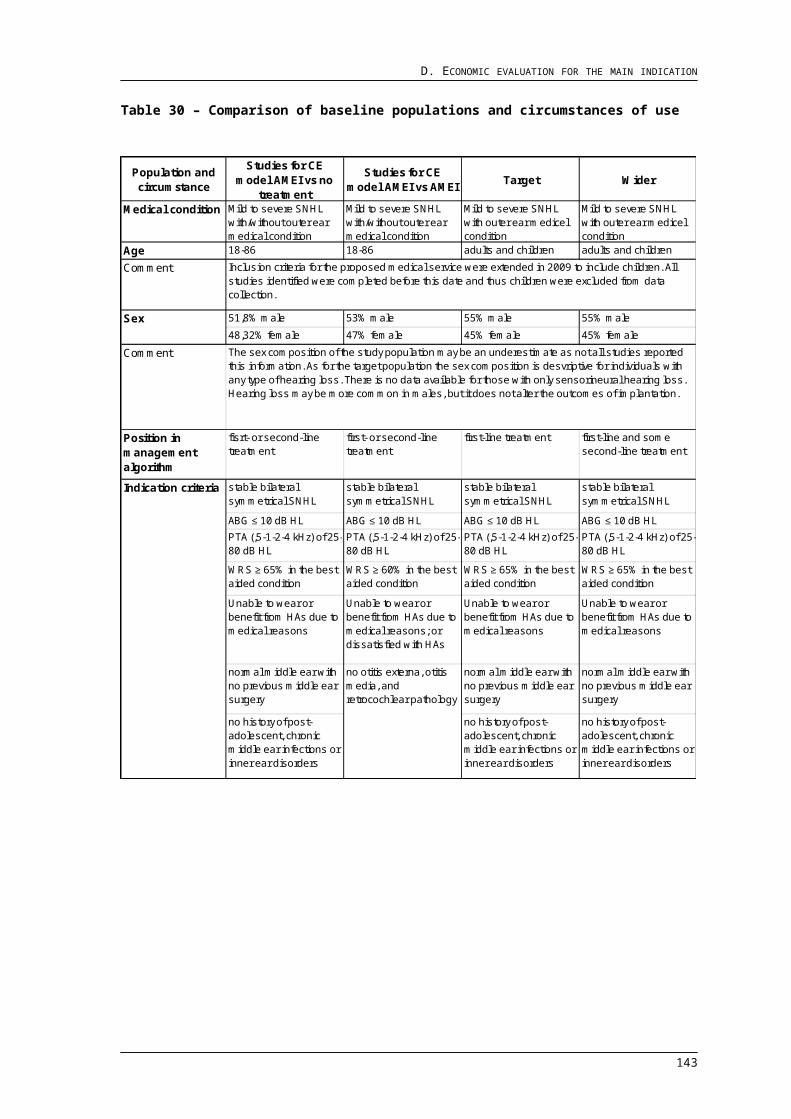
E. ESTIMATED EXTENT OF USE AND FINANCIAL IMPLICATIONS
Table 65 – Estimated cost to the MBS of associated post-operational services
Description Method current (2016) 2017 2018 2019 2020 2021
VSB
AG Cost of brain stem evoked audiometry
Table 61, row K x AUD 153,95 AUD 10.930 AUD 11.084 AUD 11.392 AUD 11.546 AUD 11.700 AUD 11.854
AH Cost of follow-up conultation (ENT/audiologist)
Table 61, row K x AUD 62,25 AUD 4.420 AUD 4.482 AUD 4.607 AUD 4.669 AUD 4.731 AUD 4.793
AI Cost of ENT specialist Table 61, row K x AUD 85,55 AUD 6.074 AUD 6.160 AUD 6.331 AUD 6.416 AUD 6.502 AUD 6.587
AJ Total cost to MBS of associated items
AG + AH + AI AUD 21.424 AUD 21.726 AUD 22.330 AUD 22.631 AUD 22.933 AUD 23.235
Maxum/SoundtecAK Cost of ENT specialist (6 visits) Table 61, row K x
AUD 85,55 * 6 AUD 36.444 AUD 36.958 AUD 37.984 AUD 38.498 AUD 39.011 AUD 39.524
AL Cost of follow-up conultation (ENT/audiologist; 3 visits)
Table 61, row K x AUD 62,25 * 3 AUD 13.259 AUD 13.446 AUD 13.820 AUD 14.006 AUD 14.193 AUD 14.380
AM Total cost to MBS of associated items
AC + AD + AE AUD 49.704 AUD 50.404 AUD 51.804 AUD 52.504 AUD 53.204 AUD 53.904
151
E. ESTIMATED EXTENT OF USE AND FINANCIAL IMPLICATIONS
Table 66 – Estimated cost to the MBS of re-implantation
Description Method current (2016) 2017 2018 2019 2020 2021
VSBAN Cost to MBS of re-implantation Table 62, row M
*0,0272 AUD 3.625 AUD 3.676 AUD 3.778 AUD 3.829 AUD 3.880 AUD 3.931
AO Operational Table 63, row Q x 0,0272 AUD 2.126 AUD 2.156 AUD 2.216 AUD 2.246 AUD 2.276 AUD 2.306
AP Pre-operational , row AB x 0,0272 AUD 1.032 AUD 1.046 AUD 1.075 AUD 1.090 AUD 1.105 AUD 1.119
AQ Post-operational Table 65, row AJ x 0,0272 AUD 583 AUD 591 AUD 607 AUD 616 AUD 624 AUD 632
AR Total cost to MBS of re-implantation
AN + AO + AP + AQ AUD 7.366 AUD 7.469 AUD 7.677 AUD 7.781 AUD 7.884 AUD 7.988
Maxum/SoundtecAS Cost to MBS of re-implantation Table 62, row M x
0,01 AUD 1.333 AUD 1.351 AUD 1.389 AUD 1.408 AUD 1.426 AUD 1.445
AT Operational Table 63, row T x 0,01 AUD 477 AUD 484 AUD 498 AUD 504 AUD 511 AUD 518
AU Pre-operational , row AF x 0,01 AUD 156 AUD 159 AUD 163 AUD 165 AUD 167 AUD 170
AV Post-operational Table 65, row AM x 0,01 AUD 497 AUD 504 AUD 518 AUD 525 AUD 532 AUD 539
AW Total cost to MBS of re-implantation
AS + AT + AU + AV AUD 2.463 AUD 2.498 AUD 2.568 AUD 2.602 AUD 2.637 AUD 2.672
152

E. ESTIMATED EXTENT OF USE AND FINANCIAL IMPLICATIONS
Table 67 – Estimated total cost of associated items to the MBS
Description Method current (2016) 2017 2018 2019 2020 2021
VSB
AX
Total cost to MBS of associated items
Table 63, row Q + , row AB + Table 65, row AJ + , row AR
AUD 144.895 AUD 146.936 AUD 151.018 AUD 153.059 AUD 155.099 AUD 157.140
Maxum/Soundtec
AY
Total cost to MBS of associated items
Table 63, row T + , row AF + Table 65, row AM + , row AW
AUD 115.548 AUD 117.175 AUD 120.430 AUD 122.058 AUD 123.685 AUD 125.313
153
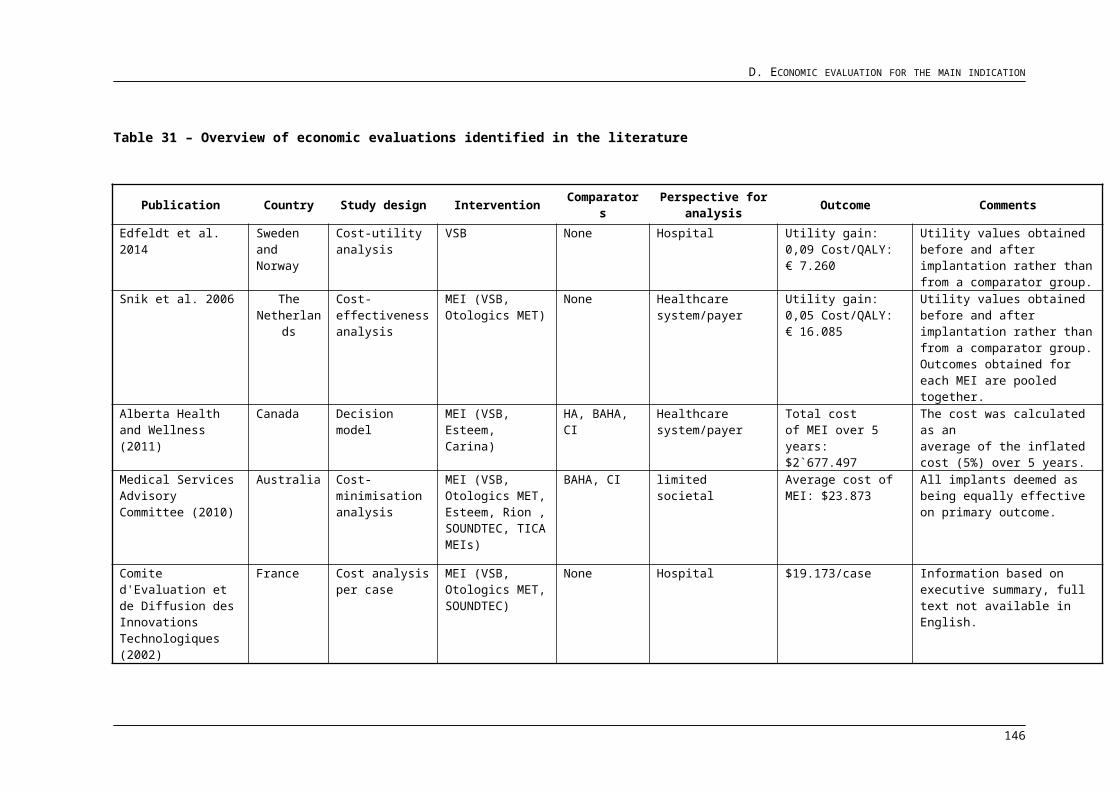
E. ESTIMATED EXTENT OF USE AND FINANCIAL IMPLICATIONS
E.4 Net financial implications to the MBS
Total non-MBS cost associated with the proposed intervention are calculated using the
costs for hospital stay, counselling, batteries as well as the implant and processor,
although these may be covered by the patient itself or private insurances. Table 68 gives
an overview for the VSB and the Maxum/Soundtec over the first 5 years of listing.
The estimated overall net financial impact to the MBS of the proposed listing, including
associated items, is shown in Table 69 for both devices.
154
E. ESTIMATED EXTENT OF USE AND FINANCIAL IMPLICATIONS
Table 68 – Estimated total non- MBS costs for both devices
Description Method current (2016) 2017 2018 2019 2020 2021
VSB
AZ Cost of hospital stay
Table 62, row L x AUD 591,00 AUD 41.961 AUD 42.552 AUD 43.734 AUD 44.325 AUD 44.916 AUD 45.507
BA Cost of counselling Table 62, row L x AUD 126,75 AUD 8.999 AUD 9.126 AUD 9.380 AUD 9.506 AUD 9.633 AUD 9.760
BB Cost of batteries Table 62, row L x AUD 52 AUD 3.692 AUD 3.744 AUD 3.848 AUD 3.900 AUD 3.952 AUD 4.004
BCCost of re-implantation - other services
(AZ + BA + BB)*0,0272 AUD 1.487 AUD 1.507 AUD 1.549 AUD 1.570 AUD 1.591 AUD 1.612
BD Cost of VSB Table 62, row L x AUD 13970 AUD 991.870 AUD 1.005.840 AUD 1.033.780 AUD 1.047.750 AUD 1.061.720 AUD 1.075.690
BE Cost of VSB – reimplantation
(BD - Table 62, row L x AP cost AUD 6500) x 0,0272
AUD 14.426 AUD 14.629 AUD 15.036 AUD 15.239 AUD 15.442 AUD 15.645
BF Total cost of non-MBS services
AZ + BA + BB + BC + BD + BE AUD 1.062.435 AUD 1.077.399 AUD 1.107.326 AUD 1.122.290 AUD 1.137.254 AUD 1.152.218
Maxum/Soundtec
BG Cost of batteries Table 62, row L x AUD 43 AUD 3.692 AUD 3.744 AUD 3.848 AUD 3.900 AUD 3.952 AUD 4.004
BHCost of re-implantation - other services
BG x 0,01 AUD 37 AUD 37 AUD 38 AUD 39 AUD 40 AUD 40
BI Cost of Maxum/Soundtec
Table 62, row L x AUD 6848,44 AUD 486.239 AUD 493.088 AUD 506.785 AUD 513.633 AUD 520.481 AUD 527.330
BJ Cost of MAXUM – reimplantation
BI x 0,01 AUD 4.862 AUD 4.931 AUD 5.068 AUD 5.136 AUD 5.205 AUD 5.273
BK Total cost of non-MBS services
BG + BH + BI + BJ AUD 494.831 AUD 501.800 AUD 515.739 AUD 522.708 AUD 529.678 AUD 536.647
155
E. ESTIMATED EXTENT OF USE AND FINANCIAL IMPLICATIONS
Table 69 – Estimated total costs for both devices to the MBS
Description Method current (2016) 2017 2018 2019 2020 2021
VSB
BL Cost to MBS of the proposed itema
Table 62, row M AUD 133.263 AUD 135.140 AUD 138.894 AUD 140.771 AUD 142.648 AUD 144.525
BM Cost to the MBS of associated itemsb
Error: Reference source not found, row AX
AUD 144.895 AUD 146.936 AUD 151.018 AUD 153.059 AUD 155.099 AUD 157.140
BO Total costs to the MBS BL + BM AUD 278.159 AUD 282.077 AUD 289.912 AUD 293.830 AUD 297.748 AUD 301.665
BP Total non-MBS costs Table 68, row BF AUD 1.062.435 AUD 1.077.399 AUD 1.107.326 AUD 1.122.290 AUD 1.137.254 AUD 1.152.218
BQOverall total costs of the proposed intervention
BL + BM AUD 1.340.594 AUD 1.359.475 AUD 1.397.239 AUD 1.416.120 AUD 1.435.002 AUD 1.453.883
Maxum/Soundtec
BR Cost to MBS of the proposed item
Table 62, row M AUD 133.263 AUD 135.140 AUD 138.894 AUD 140.771 AUD 142.648 AUD 144.525
BS Cost to the MBS of associated items
Error: Reference source not found, row AY
AUD 115.548 AUD 117.175 AUD 120.430 AUD 122.058 AUD 123.685 AUD 125.313
BT Total costs to the MBS BR + BS AUD 248.811 AUD 252.316 AUD 259.325 AUD 262.829 AUD 266.333 AUD 269.838
BU Total non-MBS costs Table 68, row BK AUD 494.831 AUD 501.800 AUD 515.739 AUD 522.708 AUD 529.678 AUD 536.647
BVOverall total costs of the proposed intervention
BU + BT AUD 743.642 AUD 754.116 AUD 775.064 AUD 785.537 AUD 796.011 AUD 806.485
Source: Calculated by MSAC during the Critique based largely on the approach used in the Assessment Report, including corrections.a: Includes co-administered services, pre-operational services, post-operational services, and MBS costs associated with re-implantation (assuming that 2.72% of implants will require re-implantation).
156
E. ESTIMATED EXTENT OF USE AND FINANCIAL IMPLICATIONS
b: Includes cost of the VSB implant, processor, batteries, counselling, hospital stay, and non-MBS costs associated with re-implantation, which are met by hospital budgets, private health funds and patient self-pay.
157
E. ESTIMATED EXTENT OF USE AND FINANCIAL IMPLICATIONS
E.5 Identification, estimation and reduction of uncertainty
As demonstrated in Section D and E.2, the proposed listing of insertion of a partially
implantable Middle Ear Implant can only be achieved with additional costs to the MBS.
The current analysis conservatively assumed a mean number of procedures based on
epidemiological data from Australia, best available evidence research on outer ear
pathologies and comparable, highly developed health care markets like Germany. As a
form of sensitivity analysis, alternative scenarios (minimum and maximum numbers of
procedures) were also explored.
As stated before, the estimated number of individuals affected by an outer ear pathology
in the Australian population is conservative. The calculations do not account for an
overlap of the medical conditions and hence may represent an underestimate of the real
number of affected individuals. It is expected that the occurrence of overlapping medical
conditions is rare and the impact on BIA would be minimal.
Another uncertainty is whether the recent observations regarding the German market
reflect the fundamental changes to the utilisation of the MBS items. The maximum
expected usage may differ from expectations but experience from countries where the
service is started shows that especially during the first years the maximum number of
procedures done is far beyond the estimations (overestimation of usage). The reasons
for that are market development (surgeons and audiologists that have to be trained,
clinics have to be convinced of the procedure, awareness has to be intensified) and
especially patient awareness and knowledge has to be built up.
In general, the extent of partially implantable middle ear implant use in the target
population is expected to be a good estimate. The uptake of such devices is controlled
by health care practitioners and individuals need to match the candidacy criteria to
receive a middle ear implant. It might happen that indiviauls diagnosed with mild to
severe SNHL but without an outer ear medical condition are interested in receiving the
proposed medical service. The provision of the service would depend on clinical opinion
and individuals’ willingness to fund theirselves. Taking this into consideration, the derived
estimates of VSB implantation may be an underestimate however the potential impact on
the MBS is anticipated to be minimal.
To assess whether the above specified factors affect the budget impact analysis
outcomes, deterministic sensitivity analysis was carried out. The number of candidates
determined by Junker (2002) for the German market was varied from its base-case value
between its 95% lower and upper confidence intervals. Secondly, the probability of
158
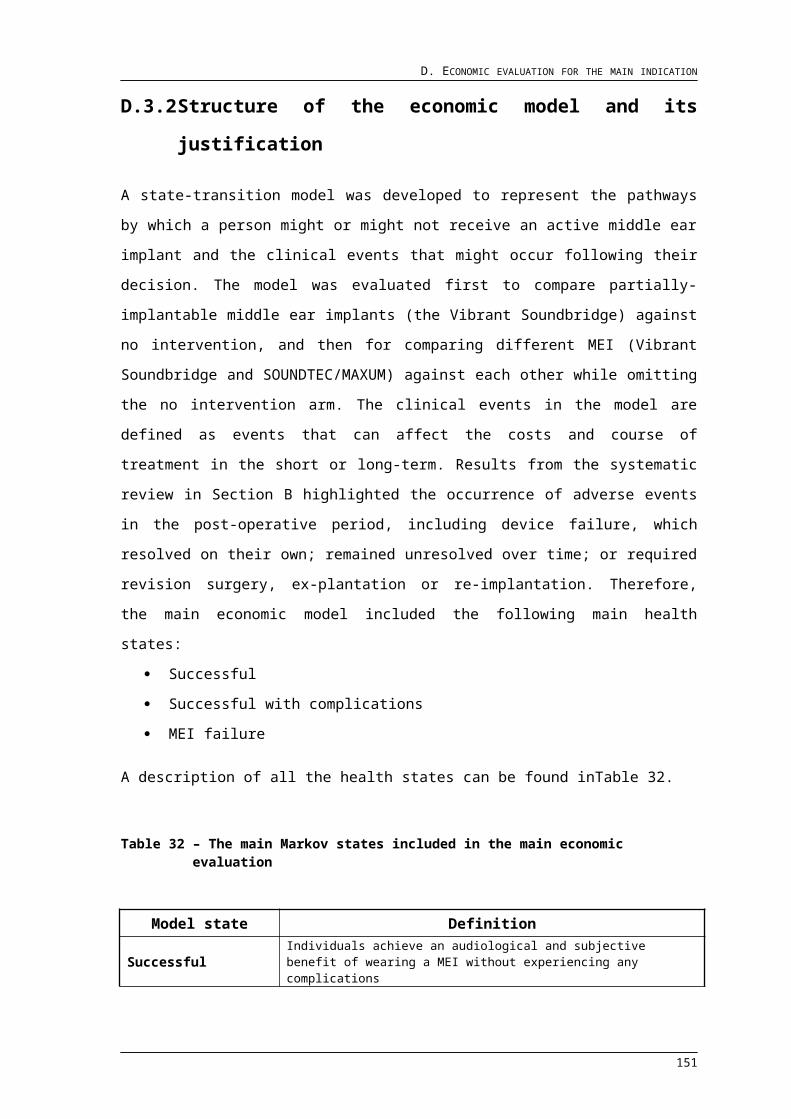
E. ESTIMATED EXTENT OF USE AND FINANCIAL IMPLICATIONS
overlapping outer ear pathologies was identified from the literature and added on to the
previous estimate. Based on the estimated number of affected people, the 95% lower
and upper confidence intrevals were calculated. All confidence intervals were calculated
by applying exact binomial confidence intervals.The procedure taken is summarized in
Table 70.
Table 70.- Calculated confidence intervals for the deterministic sensitivity analysis
Probability
CI* lower
CI upper Description Source/Method
Step 1 a 0,0076 0,0069 0,0085 VSB candidates depending on their audiogram Junker 2002
Step 2
b 0,0060 0,0050 0,0080 Individuals in the general population who have exostosis DiBartolomeo 1979
c 0,4190 0,3649 0,4745 Individuals with exostosis who also have otorrhea House 2008
d 0,0025 0,0018 0,0038 Individuals in the general population who have exostoses and otorrhea Step 2 b x Step 2 c
e 0,0320 0,0300 0,0341Individuals with an outer ear pathology in the general population (including overlap
in conditions)
CI levels calculated depending on the
estimated number of affected people in
Australia
*CIs calculated as exact binomial CI
E.5.1 Deterministic Sensitivity Analysis on the proportion of candidates
As the proposed service is new to the MBS listing no historical data can be presented.
Instead, epidemiological data from Germany was used to calculate the estimated use of
the porposed medical service in Australia.
Based on the prevalence data provided in Section E.1 and Table 70, Table 71 to Table
74 present the the patient population eligible for receiving the proposed intervention over
the first five years of an MBS listing and the minimum and maximum number of
procedures to be expected in each year. As described in the previous sections, the
population growth is held constant at 1.7 % starting from the base year of 2016. No
increase in the rate of SNHL over time is taken into account.
159
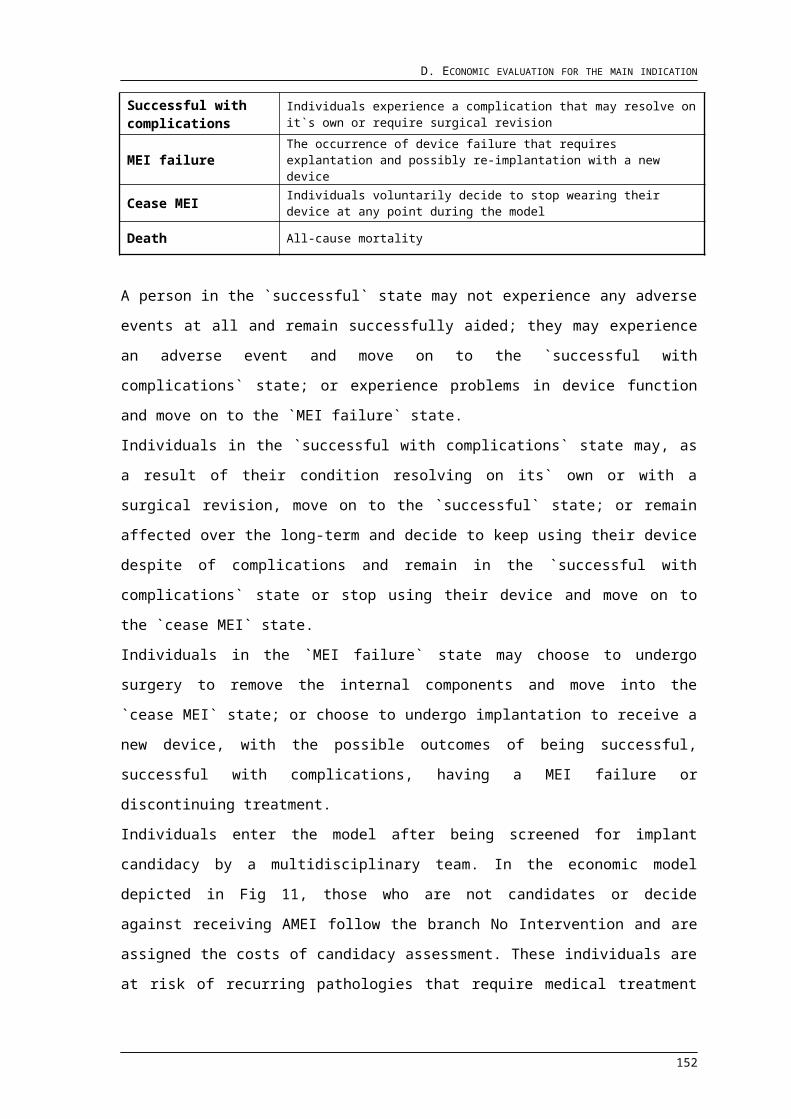
E. ESTIMATED EXTENT OF USE AND FINANCIAL IMPLICATIONS
Table 71.- Estimated minimum number of MEI candidates based on lower CI of proportion of candidates according to Junker et al, 2002
Description Method current (2016) 2017 2018 2019 2020 2021
Australian population ABS 24359761 24781121 25201317 25619895 2603735
62647999
1
Number of Australian adults ABS 18871777 19201809 19529153 19853831 2017359
32051654
4
Prevalence of SNHL in the adult population (%)
Wilson et al.,
(1999)20,20% 20,20% 20,20% 20,20% 20,20% 20,20%
Estimated number of Australian adults with SNHL B x C 3812099 3878765 3944889 4010474 4075066 4144342
Minimum Proportion of patients as possible candidate for a MEI
Junker et al.,
(2002)0,69% 0,69% 0,69% 0,69% 0,69% 0,69%
Number of Australian adults with SNHL and candidates of a MEI D x E 26303 26763 27220 27672 28118 28596
Prevalence of external ear pathology in the Australian population (%)
see Table 34 2,95% 2,95% 2,95% 2,95% 2,95% 2,95%
Estimated number of Australian adults eligible for implantation F x G 776 790 803 816 829 844
Minimum number of services per year H / 15 52 53 54 54 55 56
Maximum number of services per year H / 10 78 79 80 82 83 84
Mean number of services per year Average of I & J 65 66 67 68 69 70
The estimated difference in the mean number of services per year will affect the overall
costs for the proposed intervention as can be seen from the calculations in Appendix G,
and Table 72.
160
E. ESTIMATED EXTENT OF USE AND FINANCIAL IMPLICATIONS
Table 72.- Overall total costs of the intervention based on estimated minimum number of MEI candidates (lower CI of possible candidates)
Description Method current (2016) 2017 2018 2019 2020 2021
VSB
BL Cost to MBS of the proposed item
Row M AUD 121.369 AUD 123.491 AUD 125.596 AUD 127.685 AUD 129.741 AUD 131.947
BM Cost to the MBS of associated items
Row AX AUD 131.962 AUD 134.270 AUD 136.559 AUD 138.830 AUD 141.065 AUD 143.464
BO Total costs to the MBS BL + BM AUD 253.331 AUD 257.761 AUD 262.156 AUD 266.514 AUD 270.806 AUD 275.410
BP Total non-MBS costs Row BF AUD 967.605 AUD 984.526 AUD 1.001.310 AUD 1.017.957 AUD 1.034.352 AUD 1.051.936
BQOverall total costs of the proposed intervention
BL + BM AUD 1.220.936 AUD 1.242.288 AUD 1.263.466 AUD 1.284.471 AUD 1.305.159 AUD 1.327.346
Maxum/Soundtec
BR Cost to MBS of the proposed item
Row M AUD 121.369 AUD 123.491 AUD 125.596 AUD 127.685 AUD 129.741 AUD 131.947
BS Cost to the MBS of associated items
Row AY AUD 105.235 AUD 107.075 AUD 108.900 AUD 110.711 AUD 112.494 AUD 114.406
BT Total costs to the MBS BR + BS AUD 226.603 AUD 230.566 AUD 234.497 AUD 238.395 AUD 242.235 AUD 246.353
BU Total non-MBS costs Row BK AUD 450.663 AUD 458.545 AUD 466.362 AUD 474.115 AUD 481.751 AUD 489.941
BVOverall total costs of the proposed intervention
BU + BT AUD 677.267 AUD 689.111 AUD 700.858 AUD 712.510 AUD 723.986 AUD 736.294
161
E. ESTIMATED EXTENT OF USE AND FINANCIAL IMPLICATIONS
Table 73 desribes the changes to the number of procedures per year taking into account
the higher CI calculated for Junker et al, 2002.
Table 73.- Estimated maximum number of MEI candidates based on lower CI of proportion of candidates according to Junker et al, 2002
Description Method current (2016) 2017 2018 2019 2020 2021
Australian population ABS 24359761 24781121 25201317 25619895 2603735
62647999
1
Number of Australian adults ABS 18871777 19201809 19529153 19853831 2017359
32051654
4
Prevalence of SNHL in the adult population (%)
Wilson et al.,
(1999)20,20% 20,20% 20,20% 20,20% 20,20% 20,20%
Estimated number of Australian adults with SNHL B x C 3812099 3878765 3944889 4010474 4075066 4144342
Maximum Proportion of patients as possible candidate for a MEI
Junker et al.,
(2002)0,85% 0,85% 0,85% 0,85% 0,85% 0,85%
Number of Australian adults with SNHL and candidates of a MEI D x E 32403 32970 33532 34089 34638 35227
Prevalence of external ear pathology in the Australian population (%)
see Table 34 2,95% 2,95% 2,95% 2,95% 2,95% 2,95%
Estimated number of Australian adults eligible for implantation F x G 956 973 989 1006 1022 1039
Minimum number of services per year H / 15 64 65 66 67 68 69
Maximum number of services per year H / 10 96 97 99 101 102 104
Mean number of services per year Average of I & J 80 81 82 84 85 87
The estimated difference in the mean number of services per year will affect the overall
costs for the proposed intervention as can be seen from the calculations in Appendix G,
and Table 74.
162
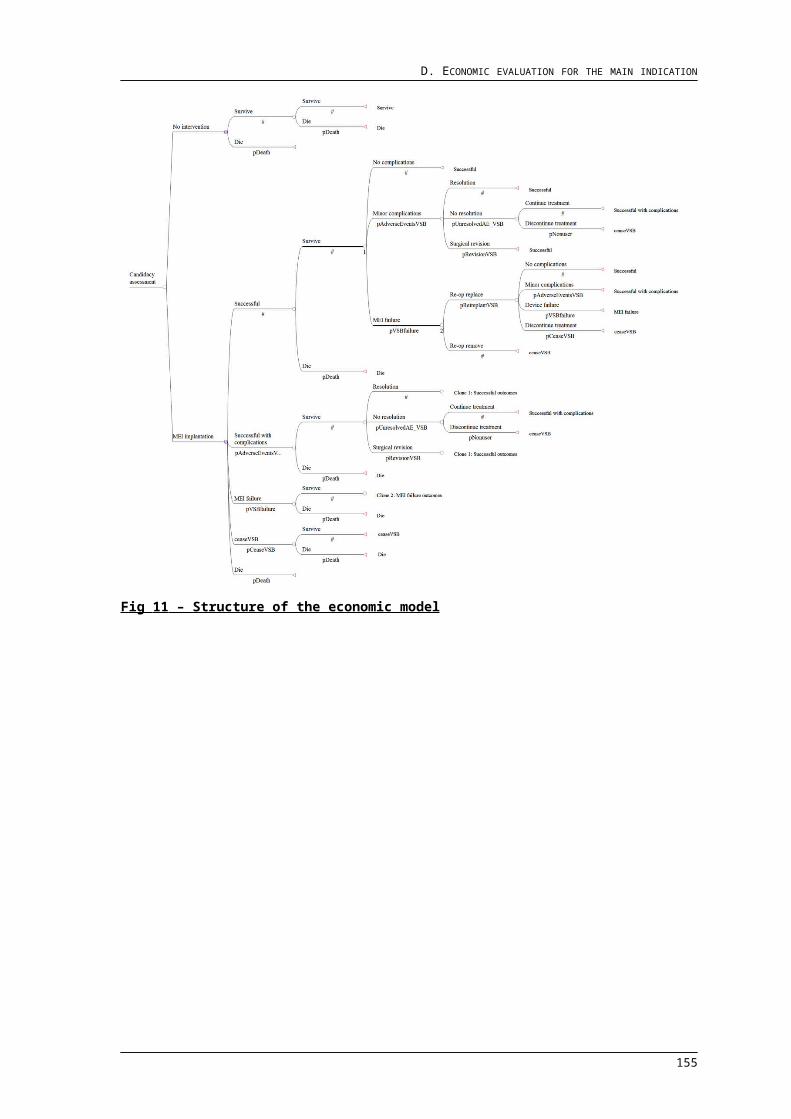
E. ESTIMATED EXTENT OF USE AND FINANCIAL IMPLICATIONS
Table 74.- Overall total costs of the intervention based on estimated maximum number of MEI candidates (higher CI of possible candidates)
Description Method current (2016) 2017 2018 2019 2020 2021
VSB
BL Cost to MBS of the proposed item
Row M AUD 149.512 AUD 152.127 AUD 154.720 AUD 157.293 AUD 159.826 AUD 162.543
BM Cost to the MBS of associated items
Row AX AUD 162.562 AUD 165.405 AUD 168.225 AUD 171.022 AUD 173.776 AUD 176.731
BO Total costs to the MBS BL + BM AUD 312.075 AUD 317.532 AUD 322.945 AUD 328.314 AUD 333.602 AUD 339.273
BP Total non-MBS costs Row BF AUD 1.191.977 AUD 1.212.822 AUD 1.233.498 AUD 1.254.005 AUD 1.274.202 AUD 1.295.863
BQOverall total costs of the proposed intervention
BL + BM AUD 1.504.051 AUD 1.530.354 AUD 1.556.443 AUD 1.582.320 AUD 1.607.804 AUD 1.635.137
Maxum/Soundtec
BR Cost to MBS of the proposed item
Row M AUD 149.512 AUD 152.127 AUD 154.720 AUD 157.293 AUD 159.826 AUD 162.543
BS Cost to the MBS of associated items
Row AY AUD 129.637 AUD 131.904 AUD 134.152 AUD 136.383 AUD 138.579 AUD 140.935
BT Total costs to the MBS BR + BS AUD 279.149 AUD 284.031 AUD 288.873 AUD 293.675 AUD 298.405 AUD 303.478
BU Total non-MBS costs Row BK AUD 555.165 AUD 564.874 AUD 574.503 AUD 584.055 AUD 593.461 AUD 603.550
BVOverall total costs of the proposed intervention
BU + BT AUD 834.314 AUD 848.904 AUD 863.376 AUD 877.730 AUD 891.867 AUD 907.028
163
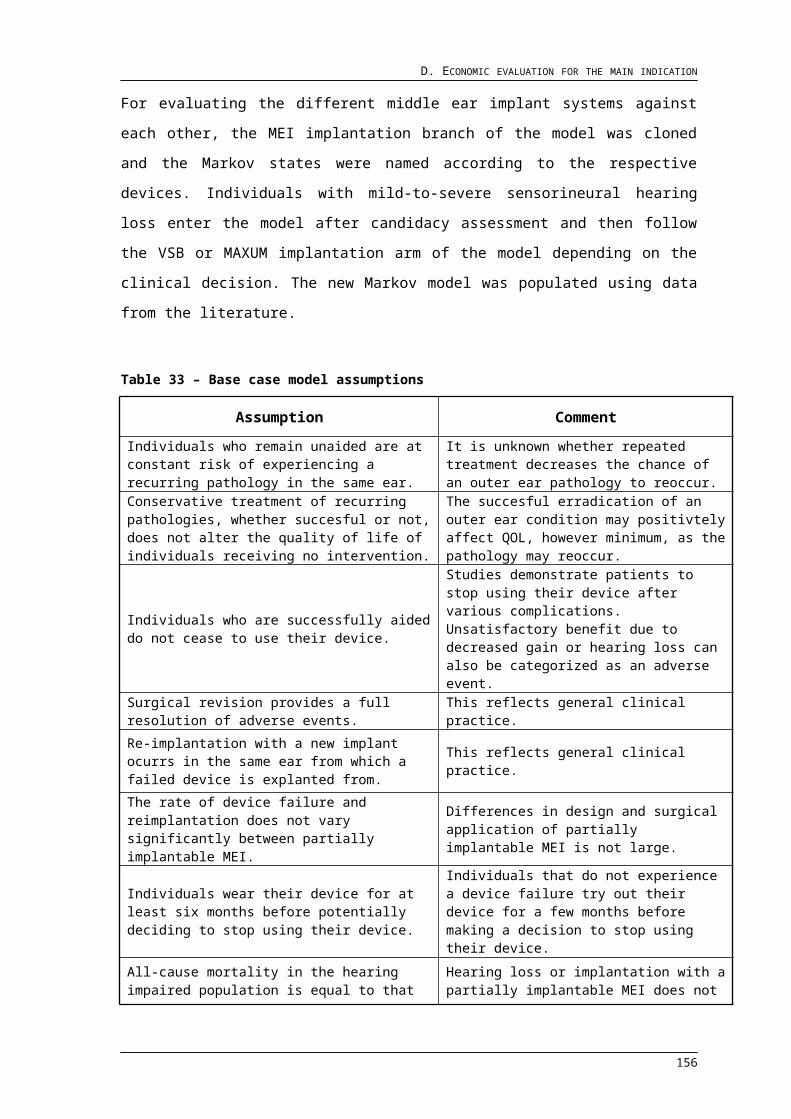
E. ESTIMATED EXTENT OF USE AND FINANCIAL IMPLICATIONS
E.5.2 Deterministic Sensitivity Analysis on external ear pathologies
A second deterministic analysis was calculated by varying the prevalence of external ear
pathologies (EEP) in the Australian population. An estimate of the overlap between the
medical conditions was included in the analysis and confidence intervals were applied to
this estimate (see Table 70 for details). Table 75 and Table 76 report the results appyling
the lower CI; and Table 77 and Table 78 report the results applying the upper CI.
Table 75.- Estimated minimum number of MEI candidates based on lower CI of external ear pathologies
Description Method current (2016) 2017 2018 2019 2020 2021
Australian population ABS 24359761 24781121 25201317 25619895 2603735
62647999
1
Number of Australian adults ABS 18871777 19201809 19529153 19853831 2017359
32051654
4
Prevalence of SNHL in the adult population (%)
Wilson et al., (1999) 20,20% 20,20% 20,20% 20,20% 20,20% 20,20%
Estimated number of Australian adults with SNHL B x C 3812099 3878765 3944889 4010474 4075066 4144342
Minimum Proportion of patients as possible candidate for a MEI
Junker et al., (2002) 0,76% 0,76% 0,76% 0,76% 0,76% 0,76%
Number of Australian adults with SNHL and candidates of a MEI D x E 28972 29479 29981 30480 30970 31497
Prevalence of external ear pathology in the Australian population (%)
Calculated
Minimum3,00% 3,00% 3,00% 3,00% 3,00% 3,00%
Estimated number of Australian adults eligible for implantation F x G 869 884 899 914 929 945
Minimum number of services per year H / 15 58 59 60 61 62 63
Maximum number of services per year H / 10 87 88 90 91 93 94
Mean number of services per year Average of I & J 72 74 75 76 77 79
164

E. ESTIMATED EXTENT OF USE AND FINANCIAL IMPLICATIONS
The estimated difference in the mean number of services per year will affect the overall
costs for the proposed intervention as can be seen from the calculations in Appendix G,
and Table 76Table 72.
165
E. ESTIMATED EXTENT OF USE AND FINANCIAL IMPLICATIONS
Table 76.- Overall total costs of the intervention based on estimated minimum prevalence (lower CI of EEP)
Description Method current (2016) 2017 2018 2019 2020 2021
VSB
BL Cost to MBS of the proposed item
Row M AUD 135.947 AUD 138.325 AUD 140.683 AUD 143.022 AUD 145.325 AUD 147.796
BM Cost to the MBS of associated items
Row AX AUD 147.813 AUD 150.398 AUD 152.962 AUD 155.505 AUD 158.010 AUD 160.696
BO Total costs to the MBS BL + BM AUD 283.761 AUD 288.723 AUD 293.645 AUD 298.527 AUD 303.335 AUD 308.492
BP Total non-MBS costs Row BF AUD 1.083.831 AUD 1.102.786 AUD 1.121.585 AUD 1.140.232 AUD 1.158.596 AUD 1.178.293
BQOverall total costs of the proposed intervention
BL + BM AUD 1.367.592 AUD 1.391.509 AUD 1.415.231 AUD 1.438.759 AUD 1.461.932 AUD 1.486.784
Maxum/Soundtec
BR Cost to MBS of the proposed item
Row M AUD 135.947 AUD 138.325 AUD 140.683 AUD 143.022 AUD 145.325 AUD 147.796
BS Cost to the MBS of associated items
Row AY AUD 117.875 AUD 119.936 AUD 121.981 AUD 124.009 AUD 126.006 AUD 128.148
BT Total costs to the MBS BR + BS AUD 253.822 AUD 258.261 AUD 262.664 AUD 267.031 AUD 271.332 AUD 275.944
BU Total non-MBS costs Row BK AUD 504.796 AUD 513.624 AUD 522.380 AUD 531.065 AUD 539.618 AUD 548.791
BVOverall total costs of the proposed intervention
BU + BT AUD 758.618 AUD 771.885 AUD 785.044 AUD 798.096 AUD 810.949 AUD 824.736
166
E. ESTIMATED EXTENT OF USE AND FINANCIAL IMPLICATIONS
Table 77 indicates the number of procedures to be expected applying the higher CI value
of external ear pathologies.
Table 77.- Estimated minimum number of MEI candidates based on higher CI of external ear pathologies
Description Method current (2016) 2017 2018 2019 2020 2021
Australian population ABS 24359761 24781121 25201317 25619895 2603735
62647999
1
Number of Australian adults ABS 18871777 19201809 19529153 19853831 2017359
32051654
4
Prevalence of SNHL in the adult population (%)
Wilson et al., (1999) 20,20% 20,20% 20,20% 20,20% 20,20% 20,20%
Estimated number of Australian adults with SNHL B x C 3812099 3878765 3944889 4010474 4075066 4144342
Minimum Proportion of patients as possible candidate for a MEI
Junker et al., (2002) 0,76% 0,76% 0,76% 0,76% 0,76% 0,76%
Number of Australian adults with SNHL and candidates of a MEI D x E 28972 29479 29981 30480 30970 31497
Prevalence of external ear pathology in the Australian population (%)
Calculated
Maximum3,41% 3,41% 3,41% 3,41% 3,41% 3,41%
Estimated number of Australian adults eligible for implantation F x G 988 1005 1022 1039 1056 1074
Minimum number of services per year H / 15 66 67 68 69 70 72
Maximum number of services per year H / 10 99 101 102 104 106 107
Mean number of services per year Average of I & J 82 84 85 87 88 90
The estimated difference in the mean number of services per year will again affect the
overall costs for the proposed intervention as can be seen from the calculations in
Appendix G, and Table 78. Results of the deterministic sensitivity analysis for the base
year of 2016 are summarized in Table 79.
167
E. ESTIMATED EXTENT OF USE AND FINANCIAL IMPLICATIONS
Table 78.- Overall total costs of the intervention based on estimated minimum prevalence (lower CI of EEP)
Description Method current (2016) 2017 2018 2019 2020 2021
VSB
BL Cost to MBS of the proposed item
Row M AUD 154.527 AUD 157.229 AUD 159.909 AUD 162.568 AUD 165.186 AUD 167.994
BM Cost to the MBS of associated items
Row AX AUD 168.015 AUD 170.953 AUD 173.867 AUD 176.758 AUD 179.605 AUD 182.658
BO Total costs to the MBS BL + BM AUD 322.541 AUD 328.182 AUD 333.777 AUD 339.326 AUD 344.791 AUD 350.652
BP Total non-MBS costs Row BF AUD 1.231.955 AUD 1.253.500 AUD 1.274.869 AUD 1.296.064 AUD 1.316.938 AUD 1.339.326
BQOverall total costs of the proposed intervention
BL + BM AUD 1.554.496 AUD 1.581.682 AUD 1.608.645 AUD 1.635.390 AUD 1.661.729 AUD 1.689.978
Maxum/Soundtec
BR Cost to MBS of the proposed item
Row M AUD 154.527 AUD 157.229 AUD 159.909 AUD 162.568 AUD 165.186 AUD 167.994
BS Cost to the MBS of associated items
Row AY AUD 133.985 AUD 136.328 AUD 138.652 AUD 140.957 AUD 143.227 AUD 145.662
BT Total costs to the MBS BR + BS AUD 288.511 AUD 293.557 AUD 298.561 AUD 303.525 AUD 308.414 AUD 313.657
BU Total non-MBS costs Row BK AUD 573.785 AUD 583.819 AUD 593.772 AUD 603.644 AUD 613.366 AUD 623.793
BVOverall total costs of the proposed intervention
BU + BT AUD 862.296 AUD 877.376 AUD 892.333 AUD 907.169 AUD 921.779 AUD 937.449
168
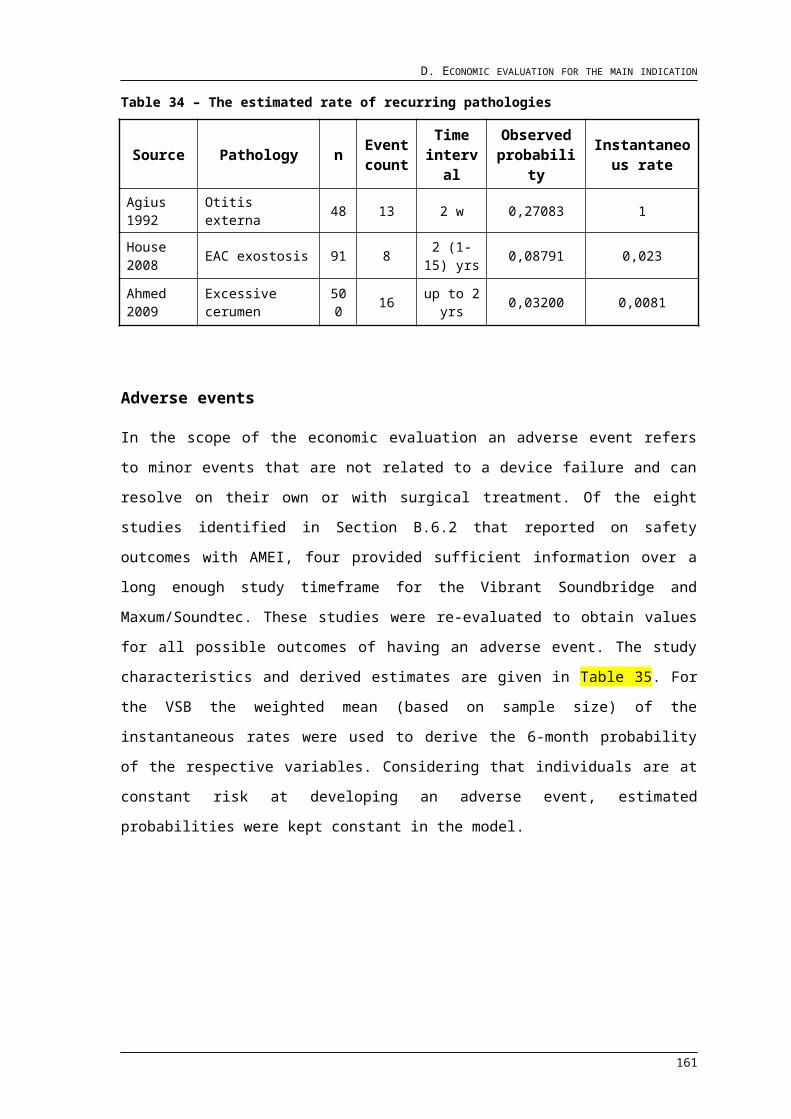
E. ESTIMATED EXTENT OF USE AND FINANCIAL IMPLICATIONS
Table 79.- Summary of the deterministic sensitivity analysis of the BIA
Variable Input value
Number of Australian adults with SNHL and
candidates of a MEI
Prevalence of external ear
pathology in the Australian
population (%)
Estimated number of Australian
adults eligible for implantation
Minimum number of
services per year
Maximum number of
services per year
Total costs to the MBS
Overall total costs of the proposed intervention
Proportion of patients0,69% 26303 2,95% 776 52 78 AUD 253.331 AUD 1.220.936
0,85% 32403 2,95% 956 64 96 AUD 312.075 AUD 1.504.051
Prevalence of external ear pathology
3,00% - - 869 58 87 AUD 283.761 AUD 1.367.592
3,41% - - 988 66 99 AUD 322.541 AUD 1.554.496
169
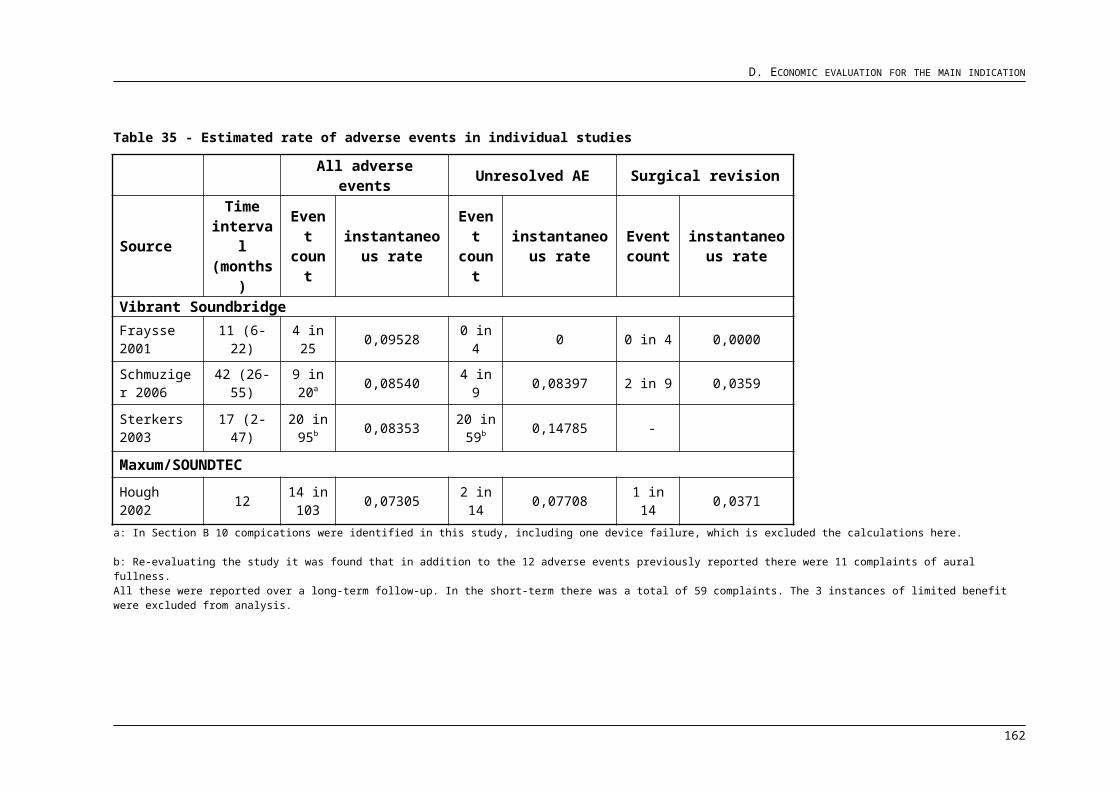
E. ESTIMATED EXTENT OF USE AND FINANCIAL IMPLICATIONS
References Alberta Health and Wellness Report. 2011. STE Report: Middle Ear Implants for the Treatment of Hearing Loss
Australian Bureau of Statistics. Life Tables, States, Territories and Australia, 2011-2013. Accessed 23 rd July, 2015 from http://www.abs.gov.au/ausstats/[email protected]/mf/3302.0.55.001
Australian Institute for Health and Wellness. Australian refined diagnosis-related groups (AR-DRG) Version 5.1. Accessed .. from https://reporting.aihw.gov.au/Reports/openRVUrl.do
Beck JR, Pauker SG, Gottlieb JE, Klein K, Kassirer JP. 1982. A convenient approximation of life expectancy (the "DEALE"). II. Use in medical decision-making. Am J Med. 73(6):889-97
Beltrame AM. 2009. Coupling the Vibrant Soundbridge to Cochlea Round Window: Auditory Results in Patients With Mixed Hearing Loss. Otology & Neurotology, v. 30, no. 2, p. 194-201
Bichey BG, Hoversland JM, Wynne MK, Miyamoto RT. 2002. Changes in quality of life and the cost-utility associated with cochlear implantation in patients with large vestibular aqueduct syndrome. Otol. Neurotol. 23(3): 323-327
Blamey P. 1997. Are spiral ganglion cell numbers important for speech perception with a cochlear implant?. Am.J.Otol., v. 18, no. 6 Suppl, p. S11-S12
Blamey P, Artieres F, Başkent D, Bergeron F, Beynon A, Burke E, Dillier N, Dowell R, Fraysse B, Gallégo S, Govaerts PJ, Green K, Huber AM, Kleine-Punte A, Maat B, Marx M, Mawman D, Mosnier I, O'Connor AF, O'Leary S, Rousset A, Schauwers K, Skarzynski H, Skarzynski PH, Sterkers O, Terranti A, Truy E, Van de Heyning P, Venail F, Vincent C, Lazard DS. 2013. Factors affecting auditory performance of postlinguistically deaf adults using cochlear implants: an update with 2251 patients: Audiol.Neurootol., v. 18, no. 1, p. 36-47
Bond M, Mealing S, Anderson R, Elston J, Weiner G, Taylor RS, Hoyle M, Liu Z, Price A, Stein K. 2009. The effectiveness and cost-effectiveness of cochlear implants for severe to profound deafness in children and adults: a systematic review and economic model. Health Technol Assess, 13(44), p. 1-330
Borg EG, Edquist AC, Reinholdson A, Risberg, and B McAllister. 2007. Speech and language development in a population of Swedish hearing-impaired pre-school children, a cross-sectional study. Int.J.Pediatr.Otorhinolaryngol., v. 71, no. 7, p. 1061-1077
Brennan S, Gombac I, Leightholm M. 2009. Facts on hearing limitations. Participation and Activity Limitation Survey 2006; No.1 Ottawa: Statistics Canada
170
E. ESTIMATED EXTENT OF USE AND FINANCIAL IMPLICATIONS
Butler CL, Thavaneswaran P, and Lee IH. 2013. Efficacy of the active middle-ear implant in patients with sensorineural hearing loss. J.Laryngol.Otol., v. 127 Suppl 2, p. S8-16
Carney AE, and Moeller MP. 1998. Treatment efficacy: hearing loss in children. J.Speech Lang Hear.Res., v. 41, no. 1, p. S61-S84
CEDIT. Comite d'Evaluation et de Diffusion des Innovations Technologiques. 2002
Chisolm TH, Johnson CE, Danhauer JL, Portz LJ, Abrams HB, Lesner S, McCarthy PA, and Newman CW. 2007. A systematic review of health-related quality of life and hearing aids: final report of the American Academy of Audiology Task Force On the Health-Related Quality of Life Benefits of Amplification in Adults: J.Am.Acad.Audiol., v. 18, no. 2, p. 151-183
Claros P, and Pujol MC. 2013. Active middle ear implants: Vibroplasty in children and adolescents with acquired or congenital middle ear disorders. Acta Otolaryngol., v. 133, no. 6, p. 612-619
Colletti L, Mandala M, and Colletti V. 2013. Long-term outcome of round window Vibrant SoundBridge implantation in extensive ossicular chain defects. Otolaryngol.Head Neck Surg., v. 149, no. 1, p. 134-141
Colletti V, Carner M, and Colletti L. 2009. TORP vs round window implant for hearing restoration of patients with extensive ossicular chain defect. Acta Otolaryngol., v. 129, no. 4, p. 449-452
Colletti V, Soli SD, Carner M, and Colletti L. 2006. Treatment of mixed hearing losses via implantation of a vibratory transducer on the round window. Int.J.Audiol., v. 45, no. 10, p. 600-608
Colquitt JL, Jones J, Harris P, Loveman E, Bird A, Clegg AJ, Baguley DM, Proops DW, Mitchell TE, Sheehan PZ, Welch K. 2011. Bone-anchored hearing aids (BAHAs) for people who are bilaterally deaf: a systematic review and economic evaluation. Health Technol.Assess., v. 15, no. 26, p. 1-iv
Cremers CW, O'Connor AF, Helms J, Roberson J, Clarós P, Frenzel H, Profant M, Schmerber S, Streitberger C, Baumgartner WD, Orfila D, Pringle M, Cenjor C, Giarbini N, Jiang D, Snik AF. 2010. International consensus on Vibrant Soundbridge(R) implantation in children and adolescents: Int.J.Pediatr.Otorhinolaryngol., v. 74, no. 11, p. 1267-1269
Cruickshanks KJ, Wiley TL, Tweed TS, Klein BE, Klein R, Mares-Perlman JA, and Nondahl DM. 1998. Prevalence of hearing loss in older adults in Beaver Dam, Wisconsin. The Epidemiology of Hearing Loss Study: Am.J.Epidemiol., v. 148, no. 9, p. 879-886.
Drummond MF, Sculpher MJ, Torrance GW, O'Brien BJ, Stoddart GL. 2005. Methods for the economic evalution of health care programmes. 3rd ed. New York: Oxford University Press
Dubno JR, Dirks DD, and Morgan DE. 1984. Effects of age and mild hearing loss on speech recognition in noise. J.Acoust.Soc.Am., v. 76, no. 1, p. 87-96
171
E. ESTIMATED EXTENT OF USE AND FINANCIAL IMPLICATIONS
Edfeldt L, Stromback K, Grendin J, Bunne M, Harder H, Peebo M, Eeg-Olofsson M, Petersson CM, and Konradsson K. 2014. Evaluation of cost-utility in middle ear implantation in the 'Nordic School': a multicenter study in Sweden and Norway: Acta Otolaryngol., v. 134, no. 1, p. 19-25
Fellinger J, Holzinger D, Gerich J, and Goldberg D. 2007. Mental distress and quality of life in the hard of hearing. Acta Psychiatr.Scand., v. 115, no. 3, p. 243-245
Fisch U, Cremers CW, Lenarz T, Weber B, Babighian G, Uziel AS, Proops DW, O'Connor AF, Charachon R, Helms J, Fraysse B. 2001. Clinical experience with the Vibrant Soundbridge implant device. Otol.Neurotol., v. 22, no. 6, p. 962-972
Frenzel H, Hanke F, Beltrame M, and Wollenberg B. 2010. Application of the Vibrant Soundbridge in bilateral congenital atresia in toddlers. Acta Otolaryngol., v. 130, no. 8, p. 966-970
Gerard JM, Thill MP, Chantrain G, Gersdorff M, and Deggouj N. 2012. Esteem 2 middle ear implant: our experience. Audiol.Neurootol., v. 17, no. 4, p. 267-274
Hallberg LR, Hallberg U, and Kramer SR. 2008. Self-reported hearing difficulties, communication strategies and psychological general well-being (quality of life) in patients with acquired hearing impairment. Disabil.Rehabil., v. 30, no. 3, p. 203-212
Health Utilities Incorporated. Summary statistics for HUI reference scores of health-related Quality of Life. Accessed 23 rd July, 2015 from http://www.healthutilities.com/
Hough JV, Matthews P, Wood MW, and Dyer RK Jr. 2002. Middle ear electromagnetic semi-implantable hearing device. results of the phase II SOUNDTEC direct system clinical trial. Otol.Neurotol., v. 23, no. 6, p. 895-903
Huttenbrink KB, Zahnert T, Bornitz M, Beutner D. 2008. TORP-Vibroplasty: A New Alternative for the Chronically Disabled Middle Ear. Otology & Neurotology, v. 29, no. 7, p. 965-971
ISO 5841-2:1986 Implants for surgery -- Cardiac pacemakers -- Part 2: Reporting of the clinical performance of populations of pulse generators
Junker R, Gross M, Todt I, and A. Ernst A. 2002. Functional gain of already implanted hearing devices in patients with sensorineural hearing loss of varied origin and extent: Berlin experience: Otol.Neurotol., v. 23, no. 4, p. 452-456
Kahue CN, Carlson ML, Daugherty JA, Haynes DS, Glasscock ME 3rd. 2014. Middle Ear Implants for Rehabilitation of Sensorineural Hearing Loss: A Systematic Review of FDA Approved Devices. Otology & Neurotology, v. 35, no. 7, p. 1228-1237
Karpa MJ, Gopinath B, Beath K, Rochtchina E, Cumming RG, Wang JJ, and Mitchell P. 2010. Associations between hearing impairment and mortality risk in older persons: the Blue Mountains Hearing Study. Ann.Epidemiol., v. 20, no. 6, p. 452-459
172
E. ESTIMATED EXTENT OF USE AND FINANCIAL IMPLICATIONS
Kiefer J, Arnold W, and Staudenmaier R. 2006. Round window stimulation with an implantable hearing aid (Soundbridge) combined with autogenous reconstruction of the auricle - a new approach. ORL J.Otorhinolaryngol.Relat Spec., v. 68, no. 6, p. 378-385
Klein K, Nerdelli A, Stafinski T. 2013. A systemaic review of the safety and effectiveness of the Vibrant Soundbridge. Journal of Otology & Rhinology, 2(3), 2013, p. 1-6
Kochkin S. 2010. Quantifying the obvious: The impact of hearing aids on quality of life
Leake PA, Hradek GT, and Snyder RL. 1999. Chronic electrical stimulation by a cochlear implant promotes survival of spiral ganglion neurons after neonatal deafness. J.Comp Neurol., v. 412, no. 4, p. 543-562
Leake PA, Stakhovskaya O, Hradek GT, and Hetherington AM. 2008. Factors influencing neurotrophic effects of electrical stimulation in the deafened developing auditory system: Hear.Res., v. 242, no. 1-2, p. 86-99
Lin FR, Niparko JK, and Ferrucci L. 2011. Hearing loss prevalence in the United States: Arch.Intern.Med., v. 171, no. 20, p. 1851-1852
Luetje CM, Brackman D, Balkany TJ, Maw J, Baker RS, Kelsall D, Backous D, Miyamoto R, Parisier S, Arts A. 2002, Phase III clinical trial results with the Vibrant Soundbridge implantable middle ear hearing device: a prospective controlled multicenter study: Otolaryngol.Head Neck Surg., v. 126, no. 2, p. 97-107
Mandala M, Colletti L, and Colletti V. 2011. Treatment of the atretic ear with round window vibrant soundbridge implantation in infants and children: electrocochleography and audiologic outcomes. Otol.Neurotol., v. 32, no. 8, p. 1250-1255
Meinzen-Derr J, Wiley S, Grether S, and Choo DI. 2011. Children with cochlear implants and developmental disabilities: a language skills study with developmentally matched hearing peers. Res.Dev.Disabil., v. 32, no. 2, p. 757-767
Memari F, Asghari A, Daneshi A, and Jalali A. 2011. Safety and patient selection of totally implantable hearing aid surgery. Envoy system, Esteem: Eur.Arch.Otorhinolaryngol., v. 268, no. 10, p. 1421-1425
Moeller MP, Tomblin JB, Yoshinaga-Itano C, Connor CM, and Jerger S. 2007. Current state of knowledge: language and literacy of children with hearing impairment: Ear Hear., v. 28, no. 6, p. 740-753
Mohr PE, Feldman JJ, and Dunbar JL. 2000. The societal costs of severe to profound hearing loss in the United States: Policy Anal.Brief.H.Ser., v. 2, no. 1, p. 1-4
Monksfield P, Jowett S, Reid A, Proops D. 2011. Cost-effectiveness analysis of the bone-anchored hearing device. Otol. Neurotol. 32(8):1192-1197
173

E. ESTIMATED EXTENT OF USE AND FINANCIAL IMPLICATIONS
MSAC. Department of Health and Ageing. Medical Services Advisory Committee. 2010
Oberg M, Marcusson J, Nagga K, and Wressle E. 2012. Hearing difficulties, uptake, and outcomes of hearing aids in people 85 years of age. Int.J.Audiol., v. 51, no. 2, p. 108-115
Pelosi S, Carlson ML, Glasscock ME. 2014. Implantable Hearing Devices: The Ototronix MAXUM System. Otolaryngol Clin North Am. 47(6), 953-965
Phelps CE, and Mushlin AI. 1991. On the (near) equivalence of cost-effectiveness and cost-benefit analyses. Int.J.Technol.Assess.Health Care, v. 7, no. 1, p. 12-21
Pok SM, Schlogel M, and Boheim K. 2010. Clinical experience with the active middle ear implant Vibrant Soundbridge in sensorineural hearing loss. Adv.Otorhinolaryngol., v. 69, p. 51-58
Roman S, Denoyelle F, Farinetti A, Garabedian EN, and Triglia JM. 2012. Middle ear implant in conductive and mixed congenital hearing loss in children. Int.J.Pediatr.Otorhinolaryngol., v. 76, no. 12, p. 1775-1778
Roth TN, Hanebuth D, and Probst R. 2011. Prevalence of age-related hearing loss in Europe: a review. Eur.Arch.Otorhinolaryngol., v. 268, no. 8, p. 1101-1107
Shargorodsky J, Curhan SG, Curhan GC, and Eavey R. 2010. Change in prevalence of hearing loss in US adolescents. JAMA, v. 304, no. 7, p. 772-778
Shohet JA, Kraus EM, and Catalano PJ. 2011. Profound high-frequency sensorineural hearing loss treatment with a totally implantable hearing system. Otol.Neurotol., v. 32, no. 9, p. 1428-1431
Sia KJ, Chai CK, Tang IP, Prepageran N. 2012. Vibrant Soundbridge: A new implantable alternative to conventional hearing aids in children. Med J Malaysia, Dec;67(6):625-6
Saliba I, Calmels MN, Wanna G, Iversenc G, James C, Deguine O, and Fraysse B. 2005. Binaurality in Middle Ear Implant Recipients Using Contralateral Digital Hearing Aids. Otology & Neurotology v. 26, p.680–685
Silverstein H, Atkins J, Thompson JH Jr, Gilman N. 2005. Experience with the SOUNDTEC Implantable Hearing Aid. Otology & Neurotology, v. 26, no. 2, p. 211-217
Snik A, Verhaegen V, Mulder J, and Cremers C. 2010. Cost-effectiveness of implantable middle ear hearing devices. Adv.Otorhinolaryngol., v. 69, p. 14-19
174
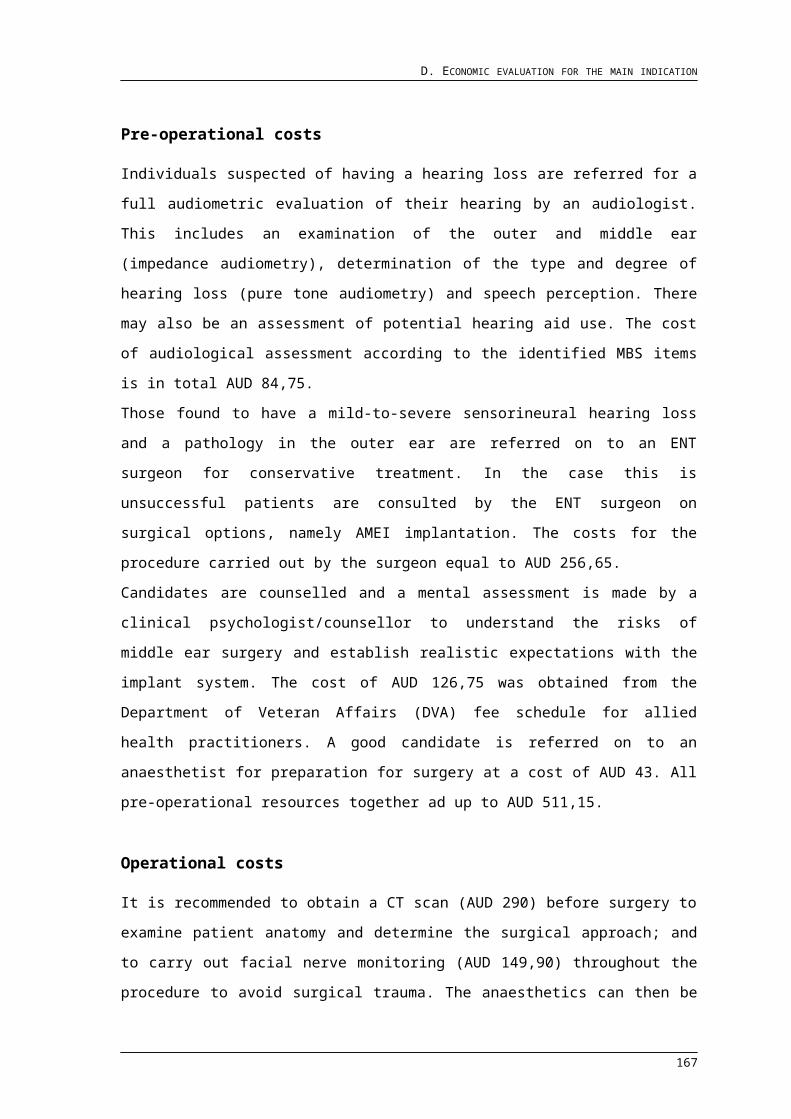
E. ESTIMATED EXTENT OF USE AND FINANCIAL IMPLICATIONS
Snik AF, Mylanus EA, Cremers CW, Dillier N, Fisch U, Gnadeberg D, Lenarz T, Mazolli M, Babighian G, Uziel AS, Cooper HR, O'Connor AF, Fraysse B, Charachon R, Shehata-Dieler WE. 2001. Multicenter audiometric results with the Vibrant Soundbridge, a semi-implantable hearing device for sensorineural hearing impairment. Otolaryngol.Clin.North Am., v. 34, no. 2, p. 373-388
Snik AF, Van Duijnhoven NT, Mylanus EA, and Cremers CW. 2006. Estimated cost-effectiveness of active middle-ear implantation in hearing-impaired patients with severe external otitis. Arch.Otolaryngol.Head Neck Surg., v. 132, no. 11, p. 1210-1215
Stevenson J, McCann D, Watkin P, Worsfold S, and Kennedy C. 2010. The relationship between language development and behaviour problems in children with hearing loss. J.Child Psychol.Psychiatry, v. 51, no. 1, p. 77-83
Stinnett AA, and Mullahy J. 1998. Net health benefits: a new framework for the analysis of uncertainty in cost-effectiveness analysis. Med.Decis.Making, v. 18, no. 2 Suppl, p. S68-S80
Stucky SR, Wolf KE, and Kuo T. 2010. The economic effect of age-related hearing loss: national, state, and local estimates, 2002 and 2030.2010. J.Am.Geriatr.Soc., v. 58, no. 3, p. 618-619
Sziklai I, Szilvássy J. 2011. Functional gain and speech understanding obtained by Vibrant Soundbridge or by open-fit hearing aid. Acta Otolaryngol, 131, v. 4, p.428-33
Todt I, Ottis Seidl R, Gross M, Ernst A. 2002. Comparison of different Vibrant Soundbridge audioprocessors with conventional hearing aids. Otol Neurotol, 23, p. 699-673
Uziel A, Mondain M, Hagen P, Dejean F, and Doucet G. 2003. Rehabilitation for High-Frequency Sensorineural Hearing Impairment in Adults with the Symphonix Vibrant Soundbridge: A Comparative Study. Otology & Neurotology v.24, p.775–783
Wagner F, Todt I, Wagner J, and Ernst A. 2010. Indications and candidacy for active middle ear implants. Adv.Otorhinolaryngol., v. 69, p. 20-26
Wilson DH, Walsh PG, Sanchez L, Davis AC, Taylor AW, Tucker G, and Meagher I. 1999. The epidemiology of hearing impairment in an Australian adult population. Int.J.Epidemiol., v. 28, no. 2, p. 247-252
Zernotti ME, Gregorio MF, and Sarasty AC. 2012. Middle ear implants: functional gain in mixed hearing loss. Braz.J.Otorhinolaryngol., v. 78, no. 1, p. 109-112
175
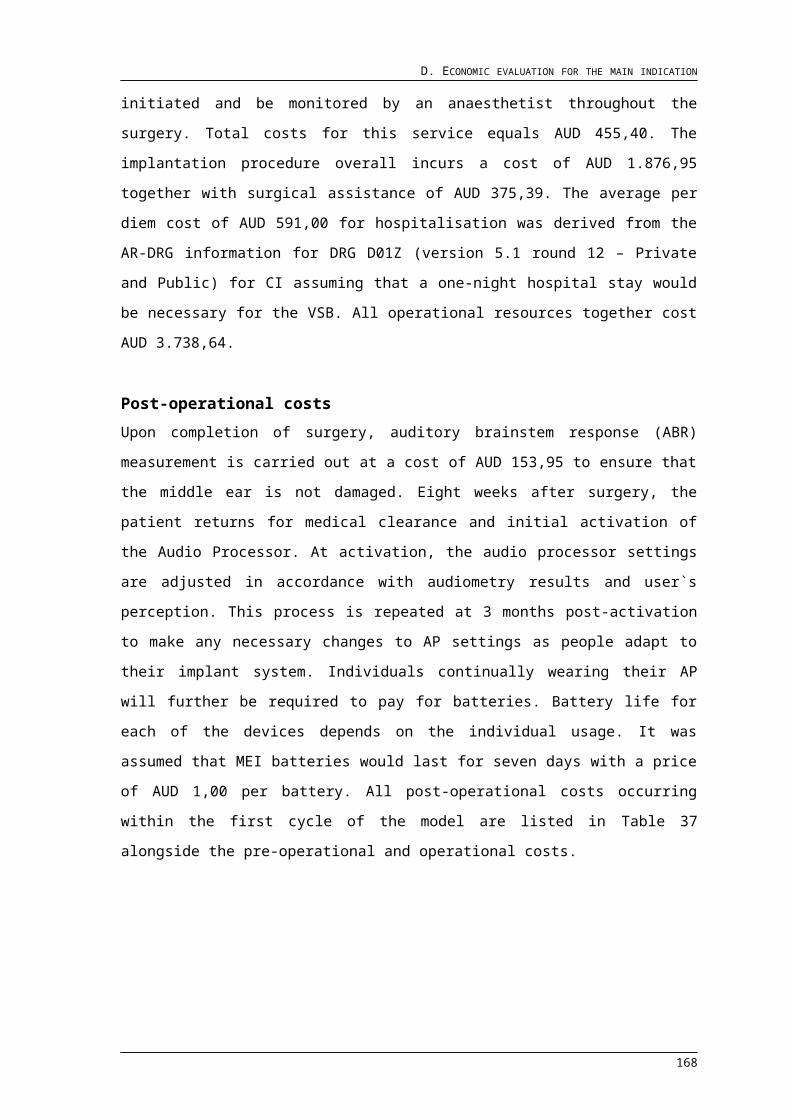
REFERENCES
176
Recommended