1
Pay-for-performanceMore than rearranging the deck chairs?
Robert and Alma Moreton LectureMay 21, 2007
Elliott S. Fisher, MD, MPHProfessor of Medicine
Center for the Evaluative Clinical SciencesDartmouth Medical School
Senior AssociateVA Outcomes Group
White River Junction, Vermont
CECSCenter for the EvaluativeClinical Sciences

2
Pay-for-performanceMore than rearranging the deck chairs?
Robert and Alma Moreton LectureMay 24, 2007
Elliott S. Fisher, MD, MPHProfessor of Medicine
Center for the Evaluative Clinical SciencesDartmouth Medical School
Senior AssociateVA Outcomes Group
White River Junction, Vermont
CECSCenter for the EvaluativeClinical Sciences

3
Houston, we’ve got a problem…
4
Quality variable -- and often poor
Access to care worsening
Fragmented delivery system
Expensive new technologies on the horizon
Growing physician dissatisfaction
Rising health care costs
Challenges we face
Houston, we’ve got a problem…

5
Houston, we’ve got a problem…
Think of the United States government as a gigantic insurance company with a sideline business in national defense…
This particular insurance company has made promises to its policy holders that have a current value $20 trillion… in excess of the revenues that it expects to receive…..
It is an accident waiting to happen.
Peter FisherUndersecretary of the TreasuryNovember 2002

6
Houston, we’ve got a problem…
Think of the United States government as a gigantic insurance company with a sideline business in national defense…
This particular insurance company has made promises to its policy holders that have a current value $20 trillion… in excess of the revenues that it expects to receive…..
It is an accident waiting to happen.
Most of the shortfall is due to federal health care programsMost of the shortfall is due to federal health care programs
David WalkerComptroller General May, 2007
$50.5 trillion
Fiscal Exposure: 50.5 Household Net Worth 53.3 Burden per household $440,000

7
Quality variable -- and often poor
Access to care worsening
Fragmented delivery system
Expensive new technologies on the horizon
Collapse of primary care
Growing physician dissatisfaction
Rising health care costs threaten our national security
Challenges we face
Houston, we’ve got a problem…
Current P4P efforts are a bit like rearranging the deck chairs on the Titanic.
We need to rethink our approach

Slide 8
Rethinking Health CareSpending, quality and the paradox of plenty
Science, December 14, 1973; Volume 182, pp 1102-08

Slide 9
Rethinking Health CareSpending, quality and the paradox of plenty
Slide 10
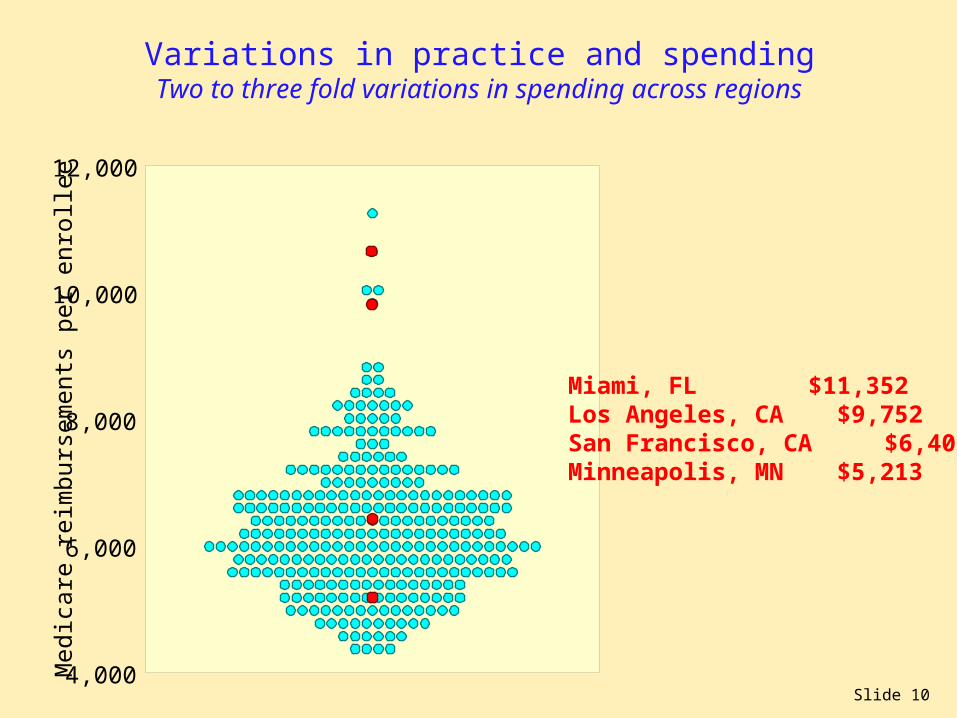
Variations in practice and spendingTwo to three fold variations in spending across regions
4,000
6,000
8,000
10,000
12,000
Med
icar
e re
imbu
rsem
ents
per
enr
olle
e
Miami, FL $11,352Los Angeles, CA $9,752San Francisco, CA $6,408Minneapolis, MN $5,213

Slide 11
How can the best medical care in the world cost twice asmuch as the best medical care in the world?
Uwe Reinhardt
20,000
40,000
60,000
80,000
100,000
120,000
Inpa
tien
t + P
art B
spe
ndin
g pe
r de
cede
nt Spending per Medicare beneficiary with severe chronic disease
(Last 2 years of life, 2000-2003)
Rethinking Health CareSpending differences among USN&WR “best” academic medical centers
UCLA Medical Center 72,793New York-Presbyterian 69,962Johns Hopkins 60,653UCSF Medical Center 56,859Univ. of Washington 50,716Mass. General 47,880Barnes-Jewish 44,463Duke University Hosp. 37,765Mayo Clinic (St. Mary's) 37,271Cleveland Clinic 35,455
Slide 12
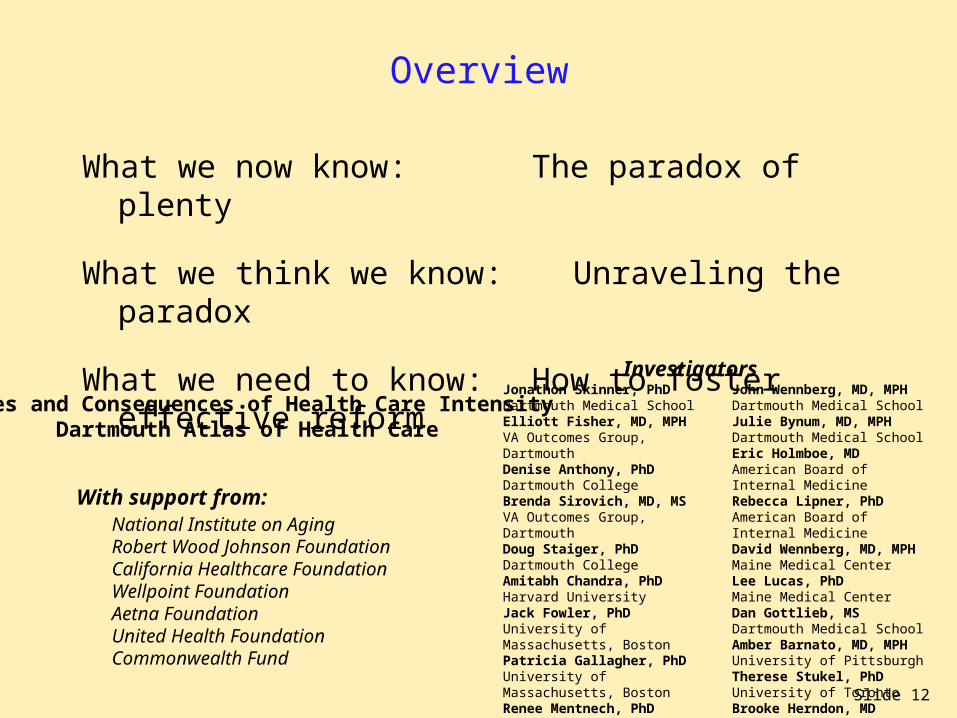
Overview
What we now know: The paradox of plenty
What we think we know: Unraveling the paradox
What we need to know: How to foster effective reform
John Wennberg, MD, MPHDartmouth Medical SchoolJulie Bynum, MD, MPHDartmouth Medical SchoolEric Holmboe, MDAmerican Board of Internal MedicineRebecca Lipner, PhDAmerican Board of Internal MedicineDavid Wennberg, MD, MPHMaine Medical CenterLee Lucas, PhDMaine Medical CenterDan Gottlieb, MSDartmouth Medical SchoolAmber Barnato, MD, MPHUniversity of PittsburghTherese Stukel, PhDUniversity of TorontoBrooke Herndon, MDDartmouth Medical School
Jonathon Skinner, PhDDartmouth Medical SchoolElliott Fisher, MD, MPHVA Outcomes Group, DartmouthDenise Anthony, PhDDartmouth CollegeBrenda Sirovich, MD, MSVA Outcomes Group, DartmouthDoug Staiger, PhDDartmouth CollegeAmitabh Chandra, PhDHarvard UniversityJack Fowler, PhDUniversity of Massachusetts, BostonPatricia Gallagher, PhDUniversity of Massachusetts, BostonRenee Mentnech, PhDCenter for Medicare and Medicaid Services
Causes and Consequences of Health Care IntensityDartmouth Atlas of Health Care
National Institute on AgingRobert Wood Johnson FoundationCalifornia Healthcare FoundationWellpoint FoundationAetna FoundationUnited Health FoundationCommonwealth Fund
With support from:
Investigators
Slide 13
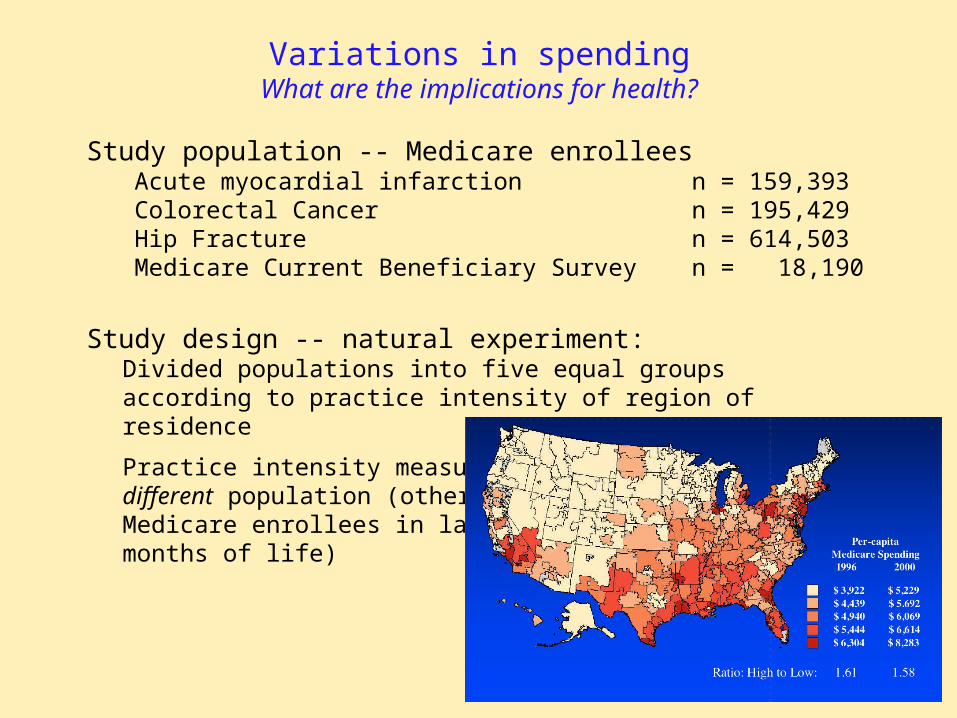
Variations in spendingWhat are the implications for health?
Study population -- Medicare enrollees Acute myocardial infarction n = 159,393Colorectal Cancer n = 195,429Hip Fracture n = 614,503Medicare Current Beneficiary Survey n = 18,190
Study design -- natural experiment:Divided populations into five equal groupsaccording to practice intensity of region ofresidence
Practice intensity measured indifferent population (otherMedicare enrollees in last six months of life)

Slide 14
Variations in spendingContent of care -- three categories
Effective care: Evidence-based services that all patients should receive. No tradeoffs involved.Acute revascularization for AMI
Preference-sensitive Treatment choices that entail tradeoffs among care risks and benefits. Patients’ values and preferences
should determine treatment choice.CABG for stable angina
Supply-sensitive Services where utilization is strongly associatedservices with local supply of health care resources
Frequency of MD visits, specialist consultationsuse of hospital or ICU as a site of care, tests,imaging and minor procedures
Wennberg, Skinner and Fisher, Geography and the Debate over Medicare ReformHealth Affairs, web exclusives, February13, 2002

Slide 15
Ratio of Use Rates in High vs Low Spending Regions -- in similar patientsIf red dot is to right, high spending regions get MORE
1.00 1.5 2.00.5 2.5 3.0
1.00 1.5 2.00.5 2.5 3.0
Reperfusion in 12 hours (Heart attack)Effective Care: technical quality
Lower in High Spending Regions Higher in High Spending Regions
Low Spending High Spending55.8 49.8

Slide 16
Ratio of Use Rates in High vs Low Spending Regions -- in similar patientsIf red dot is to right, high spending regions get MORE
1.00 1.5 2.00.5 2.5 3.0
1.00 1.5 2.00.5 2.5 3.0
Reperfusion in 12 hours (Heart attack)Effective Care: technical quality
Lower in High Spending Regions Higher in High Spending Regions
Aspirin at admission (Heart attack)Mammogram, Women 65-69Pap Smear, Women 65+Pneumococcal Immunization (ever)

Slide 17
Ratio of Use Rates in High vs Low Spending Regions -- in similar patientsIf red dot is to right, high spending regions get MORE
1.00 1.5 2.00.5 2.5 3.0
1.00 1.5 2.00.5 2.5 3.0
Reperfusion in 12 hours (Heart attack)Effective Care: technical quality
Lower in High Spending Regions Higher in High Spending Regions
Aspirin at admission (Heart attack)Mammogram, Women 65-69Pap Smear, Women 65+Pneumococcal Immunization (ever)
Total Hip ReplacementTotal Knee ReplacementBack Surgery
Preference Sensitive Care: elective surgery
CABG following heart attack
Slide 18
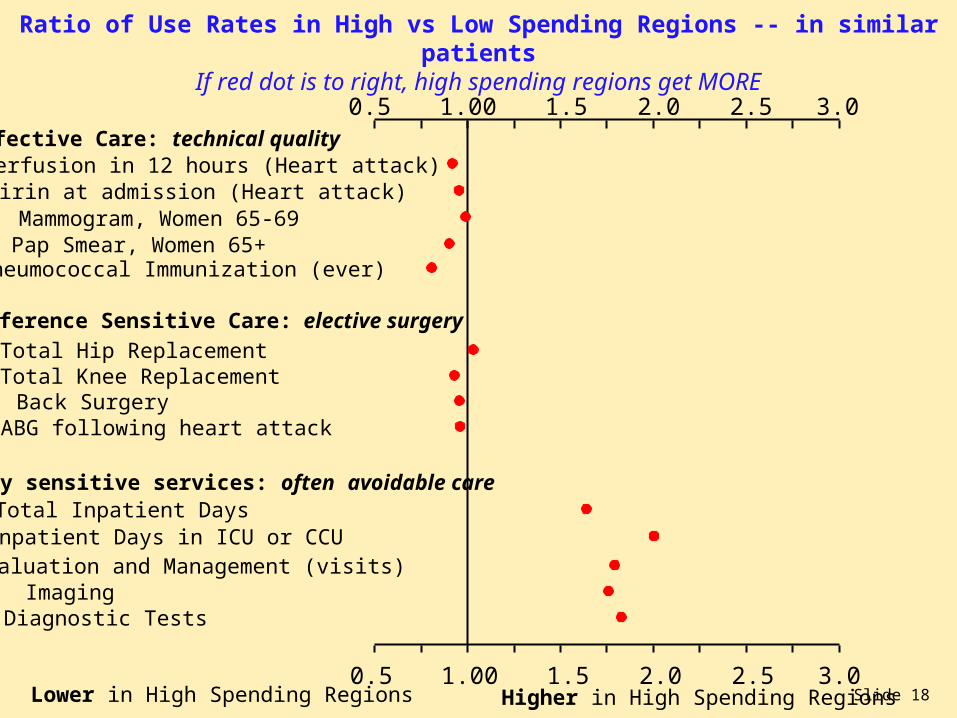
Ratio of Use Rates in High vs Low Spending Regions -- in similar patientsIf red dot is to right, high spending regions get MORE
1.00 1.5 2.00.5 2.5 3.0
1.00 1.5 2.00.5 2.5 3.0
Reperfusion in 12 hours (Heart attack)Effective Care: technical quality
Lower in High Spending Regions Higher in High Spending Regions
Aspirin at admission (Heart attack)Mammogram, Women 65-69Pap Smear, Women 65+Pneumococcal Immunization (ever)
Total Hip ReplacementTotal Knee ReplacementBack Surgery
Preference Sensitive Care: elective surgery
CABG following heart attack
Evaluation and Management (visits)ImagingDiagnostic Tests
Supply sensitive services: often avoidable care
Inpatient Days in ICU or CCUTotal Inpatient Days

Slide 19
The paradox of plentyWhat do higher spending regions -- and systems -- get?
Technical quality worseNo more elective surgeryMore hospital stays, visits, specialist use, tests
Content / Quality of Care1,2
Health Outcomes1,2
(1) Ann Intern Med: 2003; 138: 273-298 (2) Health Affairs web exclusives, October 7, 2004(3) Health Affairs, web exclusives, Nov 16, 2005(4) Health Affairs web exclusives, Feb 7, 2006(5) Ann Intern Med: 2006; 144: 641-649

Slide 20
The paradox of plentyWhat do higher spending regions -- and systems -- get?
Technical quality worseNo more elective surgeryMore hospital stays, visits, specialist use, tests
Content / Quality of Care1,2
Slightly higher mortalityNo better function
Health Outcomes1,2
Worse communication among physiciansGreater difficulty ensuring continuity of careGreater difficulty providing high quality careGreater perception of scarcity
Physician’s perceptions5
Patient-perceived quality1,3 Lower satisfaction with hospital careWorse access to primary care
Trends over time4 Greater growth in per-capita resource useLower gains in survival (following AMI)
(1) Ann Intern Med: 2003; 138: 273-298 (2) Health Affairs web exclusives, October 7, 2004(3) Health Affairs, web exclusives, Nov 16, 2005(4) Health Affairs web exclusives, Feb 7, 2006(5) Ann Intern Med: 2006; 144: 641-649
Slide 21
Pop Quiz
1. U.S. health care spending would decline by over 30%.
2. The projected deficit in the Medicare Trust fund would be postponed by at least 25 years.
3. We could send 30% of the U.S. health care workforce to Africa and -- in theory -- improve the health of both continents.
4. All of the above.
If all US regions could adopt the practice patterns of the mostconservative US regions (such as N. California or Rochester, NY) which of the following statements would apply?
Slide 22
Major points
What I know: Higher spending across regions and physician groups is largely due to overuse of supply-sensitive services -- hospital and ICU stays, MD visits, specialist consults; and -- at the margin -- more is worse.

Slide 23
What might be going on?Some general attributes of U.S. healthcare
Assumption that more is better
Slide 24
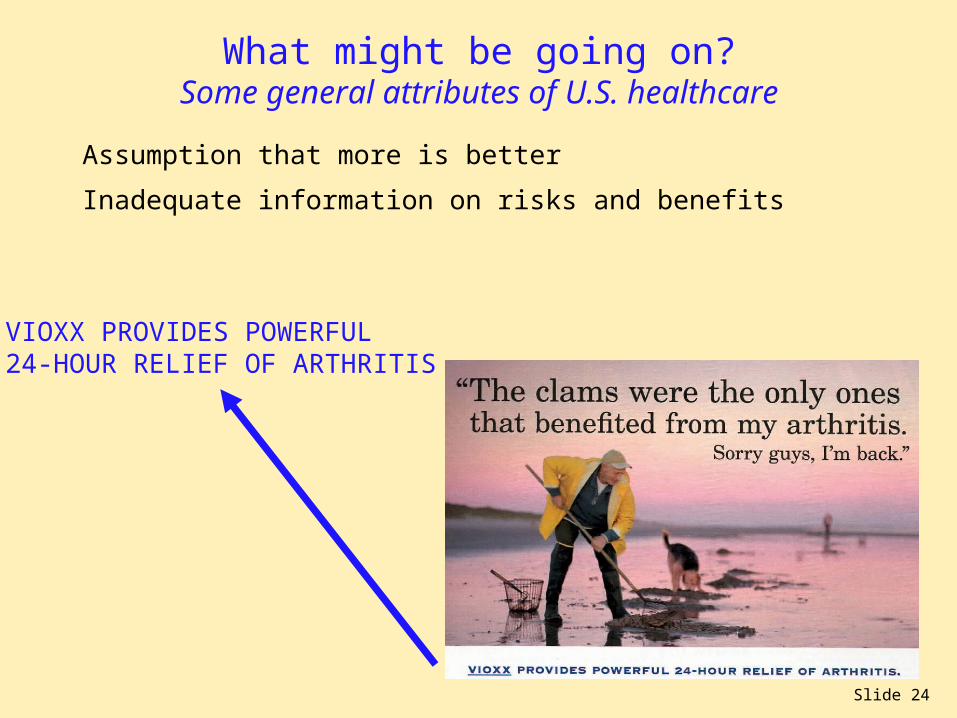
What might be going on?Some general attributes of U.S. healthcare
Assumption that more is better
Inadequate information on risks and benefits
VIOXX PROVIDES POWERFUL24-HOUR RELIEF OF ARTHRITIS
Slide 25
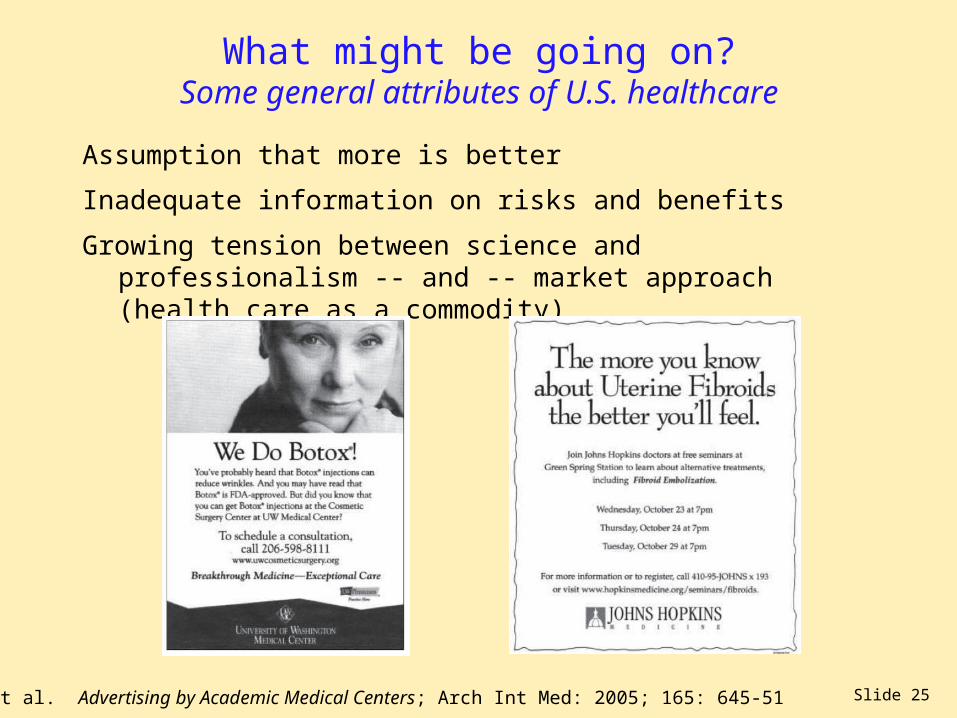
What might be going on?Some general attributes of U.S. healthcare
Assumption that more is better
Inadequate information on risks and benefits
Growing tension between science and professionalism -- and -- market approach (health care as a commodity)
Larson et al. Advertising by Academic Medical Centers; Arch Int Med: 2005; 165: 645-51
Slide 26
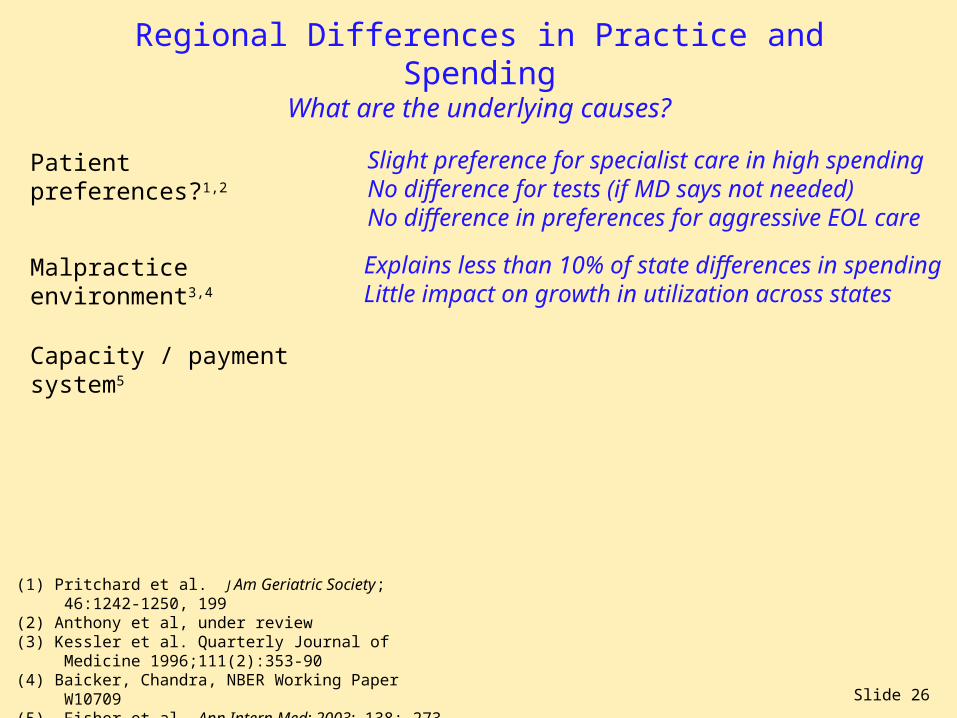
Regional Differences in Practice and SpendingWhat are the underlying causes?
Explains less than 10% of state differences in spendingLittle impact on growth in utilization across states
Malpractice environment3,4
Capacity / payment system5
(1) Pritchard et al. J Am Geriatric Society; 46:1242-1250, 199(2) Anthony et al, under review(3) Kessler et al. Quarterly Journal of Medicine 1996;111(2):353-90(4) Baicker, Chandra, NBER Working Paper W10709(5) Fisher et al. Ann Intern Med: 2003; 138: 273-298(6) Sirovich et al. Archives of Internal Medicine. 165(19):2252-6.(7) Sirovich et al, J Gen Intern Med. 2006;21(Suppl4):164.
Slight preference for specialist care in high spendingNo difference for tests (if MD says not needed)No difference in preferences for aggressive EOL care
Patient preferences?1,2

Slide 27
Regional Differences in Practice and SpendingWhat are the underlying causes?
Capacity and payment
Slide 28
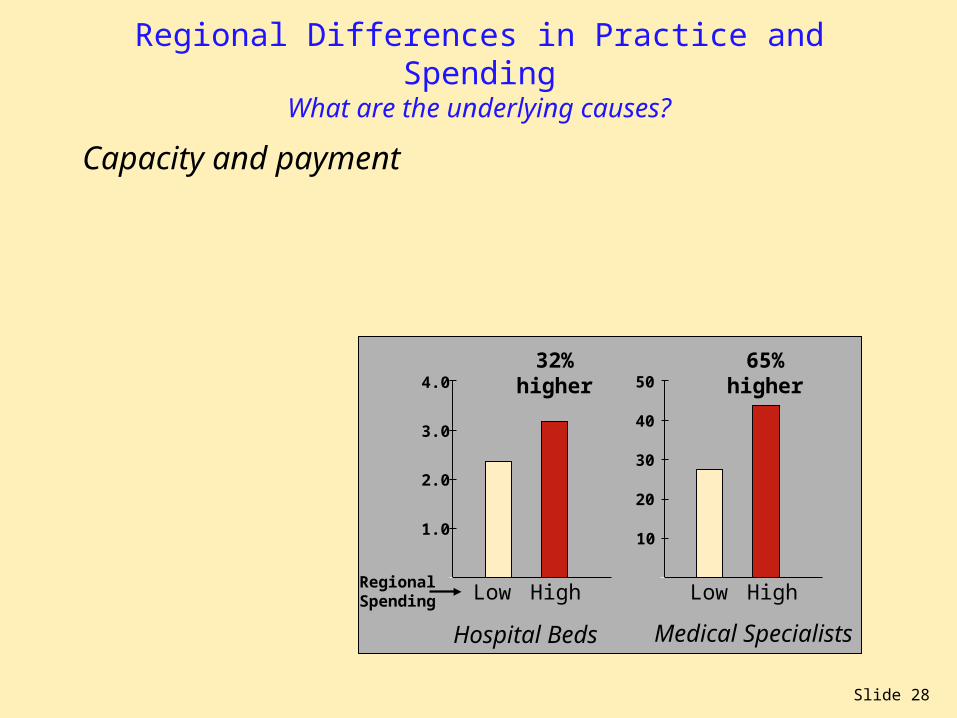
Regional Differences in Practice and SpendingWhat are the underlying causes?
Capacity and payment
1.0
3.0
4.0
10
40
50
30
202.0
Hospital Beds Medical Specialists
Low High Low High
32% higher
65% higher
RegionalSpending

Slide 29
Regional Differences in Practice and SpendingWhat are the underlying causes?
Capacity and payment
Whatever capacity is inplace will be fully utilized
R2 = 0.490.0
0.5
1.0
1.5
2.0
2.5
0.0 2.5 5.0 7.5 10.0 12.5 15.0
Cardiologists per 100,000 Residents
Car
diol
ogis
t V
isit
s pe
r 1,
000
Med
icar
eE
nrol
lees
Slide 30
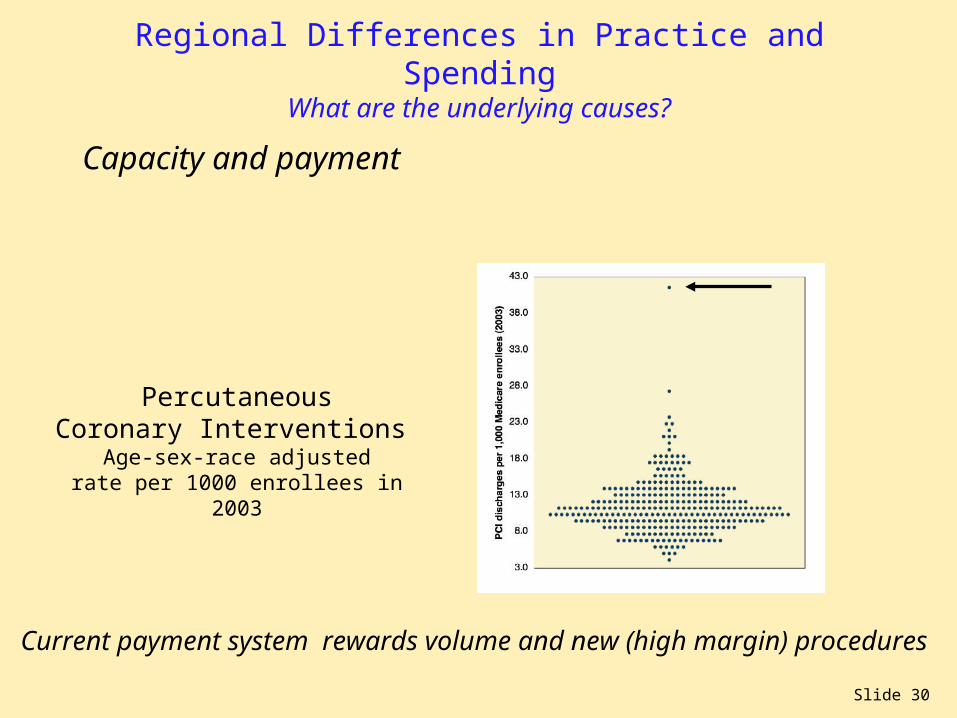
Regional Differences in Practice and SpendingWhat are the underlying causes?
Capacity and payment
Current payment system rewards volume and new (high margin) procedures
PercutaneousCoronary Interventions
Age-sex-race adjustedrate per 1000 enrollees in
2003

Slide 31
Regional Differences in Practice and SpendingWhat are the underlying causes?
Capacity and payment
PercutaneousCoronary Interventions
Age-sex-race adjustedrate per 1000 enrollees in
2003
Current payment system rewards volume and new (high margin) procedures

Slide 32
Regional Differences in Practice and SpendingWhat are the underlying causes?
Capacity and payment
New York Times, August 18, 2006
Slide 33
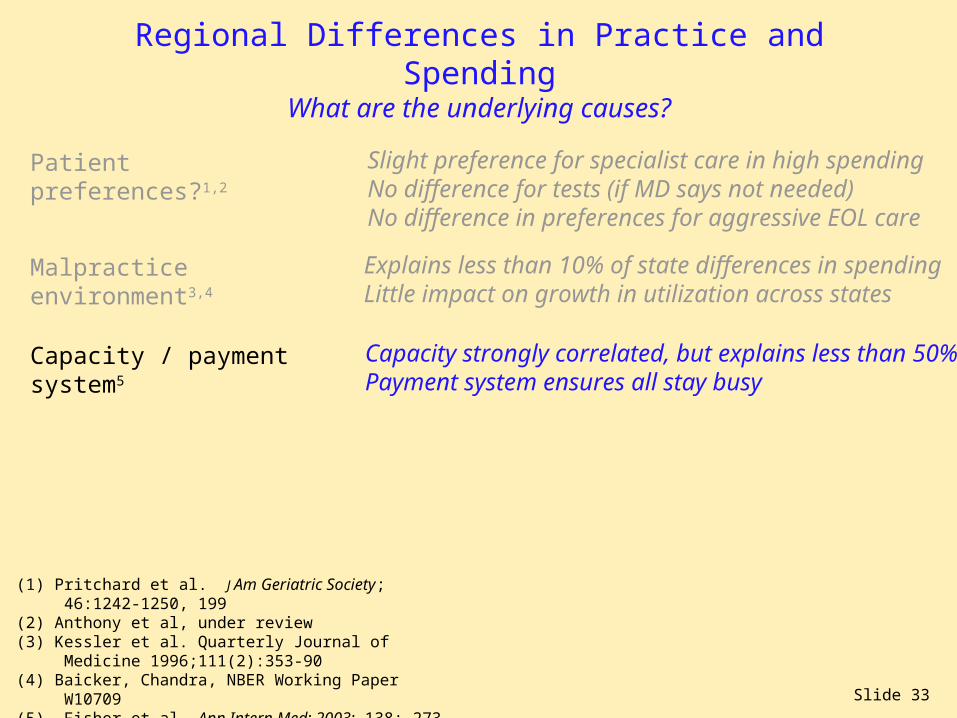
Regional Differences in Practice and SpendingWhat are the underlying causes?
Explains less than 10% of state differences in spendingLittle impact on growth in utilization across states
Malpractice environment3,4
Capacity strongly correlated, but explains less than 50%Payment system ensures all stay busy
Capacity / payment system5
(1) Pritchard et al. J Am Geriatric Society; 46:1242-1250, 199(2) Anthony et al, under review(3) Kessler et al. Quarterly Journal of Medicine 1996;111(2):353-90(4) Baicker, Chandra, NBER Working Paper W10709(5) Fisher et al. Ann Intern Med: 2003; 138: 273-298(6) Sirovich et al. Archives of Internal Medicine. 165(19):2252-6.(7) Sirovich et al, J Gen Intern Med. 2006;21(Suppl4):164.
Slight preference for specialist care in high spendingNo difference for tests (if MD says not needed)No difference in preferences for aggressive EOL care
Patient preferences?1,2
Slide 34
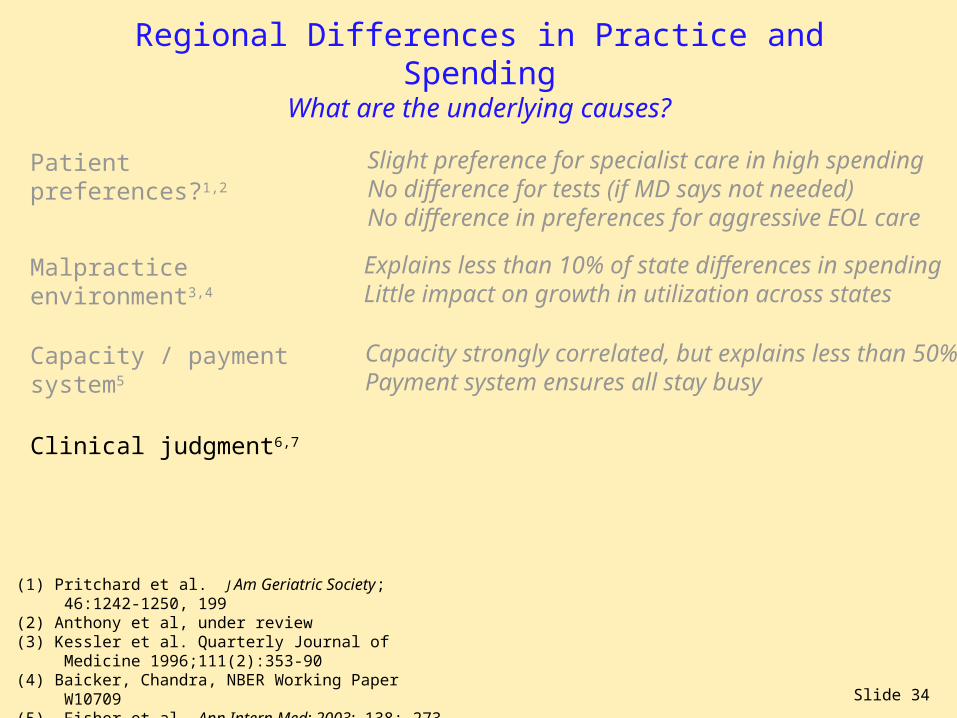
Regional Differences in Practice and SpendingWhat are the underlying causes?
Explains less than 10% of state differences in spendingLittle impact on growth in utilization across states
Malpractice environment3,4
Capacity strongly correlated, but explains less than 50%Payment system ensures all stay busy
Capacity / payment system5
Clinical judgment6,7
(1) Pritchard et al. J Am Geriatric Society; 46:1242-1250, 199(2) Anthony et al, under review(3) Kessler et al. Quarterly Journal of Medicine 1996;111(2):353-90(4) Baicker, Chandra, NBER Working Paper W10709(5) Fisher et al. Ann Intern Med: 2003; 138: 273-298(6) Sirovich et al. Archives of Internal Medicine. 165(19):2252-6.(7) Sirovich et al, J Gen Intern Med. 2006;21(Suppl4):164.
Slight preference for specialist care in high spendingNo difference for tests (if MD says not needed)No difference in preferences for aggressive EOL care
Patient preferences?1,2

Slide 35
Physician propensity to intervene Primary Care Physician Surveys
Cardiology referral for chest pain and 91 93 no abnormal stress test
Sirovich Archives of Internal Medicine. 165(19):2252-6, 2005 Oct 24Sirovich, Journal of General Internal Medicine, Suppl May 2006
LowSpendingRegions
HighSpendingRegions
Trendsignificant
Percent of patients for whom physicians wouldrecommend the intervention in low and highspending regions in each scenario:

Slide 36
Physician propensity to intervene Primary Care Physician Surveys
Cardiology referral for chest pain and 91 93 no abnormal stress test
MRI for back pain and mildly 69 82 yes abnormal nerve function
Sirovich Archives of Internal Medicine. 165(19):2252-6, 2005 Oct 24Sirovich, Journal of General Internal Medicine, Suppl May 2006
LowSpendingRegions
HighSpendingRegions
Trendsignificant
Percent of patients for whom physicians wouldrecommend the intervention in low and highspending regions in each scenario:
Slide 37
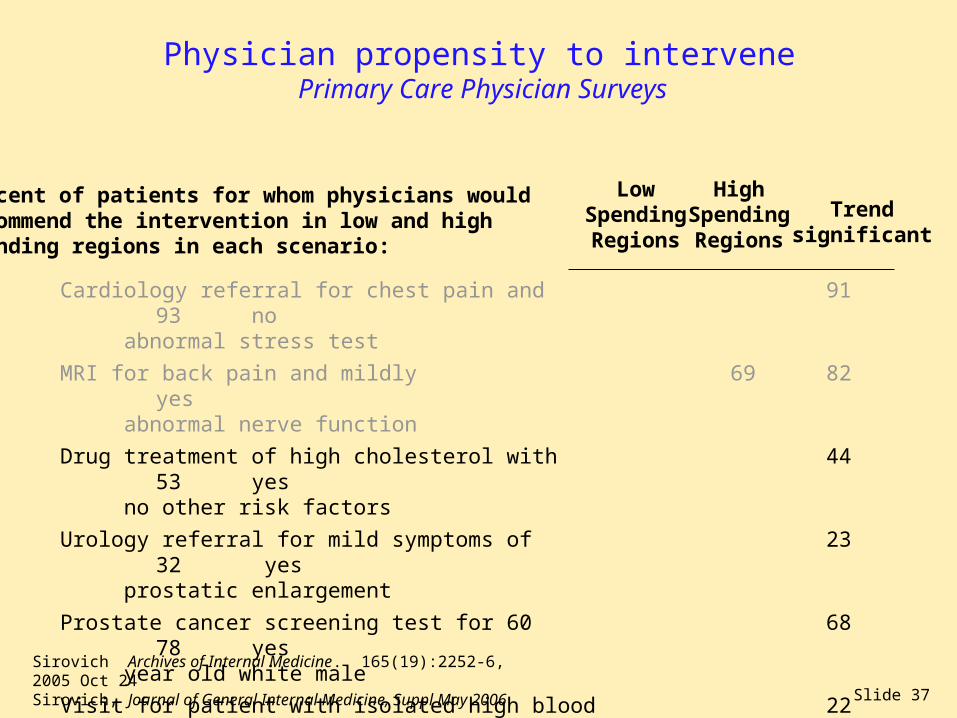
Physician propensity to intervene Primary Care Physician Surveys
Cardiology referral for chest pain and 91 93 no abnormal stress test
MRI for back pain and mildly 69 82 yes abnormal nerve function
Drug treatment of high cholesterol with 44 53 yes no other risk factors
Urology referral for mild symptoms of 23 32 yes prostatic enlargement
Prostate cancer screening test for 60 68 78 yes year old white male
Visit for patient with isolated high blood 22 49 yespressure in 3 months or less
Sirovich Archives of Internal Medicine. 165(19):2252-6, 2005 Oct 24Sirovich, Journal of General Internal Medicine, Suppl May 2006
LowSpendingRegions
HighSpendingRegions
Trendsignificant
Percent of patients for whom physicians wouldrecommend the intervention in low and highspending regions in each scenario:
Slide 38
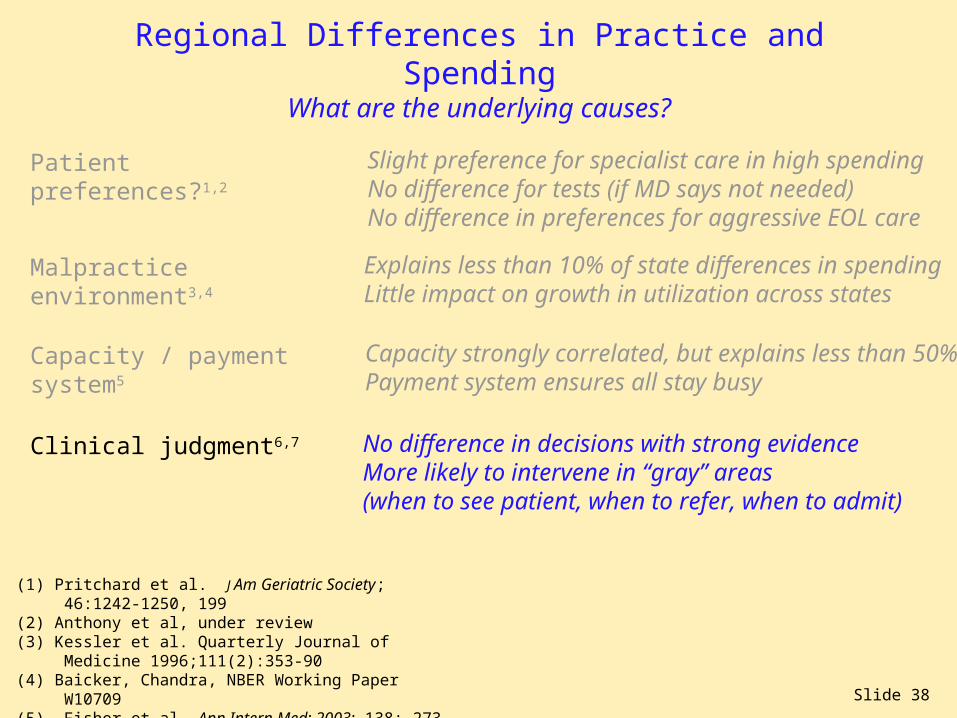
Regional Differences in Practice and SpendingWhat are the underlying causes?
Explains less than 10% of state differences in spendingLittle impact on growth in utilization across states
Malpractice environment3,4
Capacity strongly correlated, but explains less than 50%Payment system ensures all stay busy
Capacity / payment system5
No difference in decisions with strong evidenceMore likely to intervene in “gray” areas(when to see patient, when to refer, when to admit)
Clinical judgment6,7
(1) Pritchard et al. J Am Geriatric Society; 46:1242-1250, 199(2) Anthony et al, under review(3) Kessler et al. Quarterly Journal of Medicine 1996;111(2):353-90(4) Baicker, Chandra, NBER Working Paper W10709(5) Fisher et al. Ann Intern Med: 2003; 138: 273-298(6) Sirovich et al. Archives of Internal Medicine. 165(19):2252-6.(7) Sirovich et al, J Gen Intern Med. 2006;21(Suppl4):164.
Slight preference for specialist care in high spendingNo difference for tests (if MD says not needed)No difference in preferences for aggressive EOL care
Patient preferences?1,2

Slide 39
Likely diagnosisLocal capacity and clinical culture drive practice and spending
Physician - PatientEncounter
Clinical EvidenceProfessionalism
Clinical evidence (e.g. RCTs, guidelines) and principles of professionalism are a critically important -- but limited -- influence on clinical decision-making.
Consequence: reasonable individual clinical and local decisions lead, in aggregate, to higher utilization rates,greater costs -- and inadvertently -- worse outcomes
LocalOrganizational Context(e.g. capacity - culture)
Policy Environment(e.g. payment system)
Physicians practice within a local organizationalcontext and policy environment that profoundlyinfluences their decision-making. Payment systemensures that existing (and new capacity) is fullyutilized. Capacity helps determine local culture.

Slide 40
How could health outcomes be worse?
Fisher ES, Welch HG. JAMA. 1999;281:446-53.
More Medical Care
Settings
Mechanisms
Harms

Slide 41
How could health outcomes be worse?
More Medical Care
Settings
Mechanisms
Harms
More Diagnosis
PseudodiseaseLabeling
Emphasizes high survival with screening and possible benefit (no mention of risks)
Acknowledges that screening not “currently” recommended for lung cancer
No mention of ongoing trial

Slide 42
How could health outcomes be worse?
More Medical Care
Settings
Mechanisms
Harms
More Diagnosis
PseudodiseaseLabeling

Slide 43
How could health outcomes be worse?
Lower treatment thresholdsTampering
More Medical Care
Settings
Mechanisms
Harms
More Diagnosis
PseudodiseaseLabeling
More Treatment
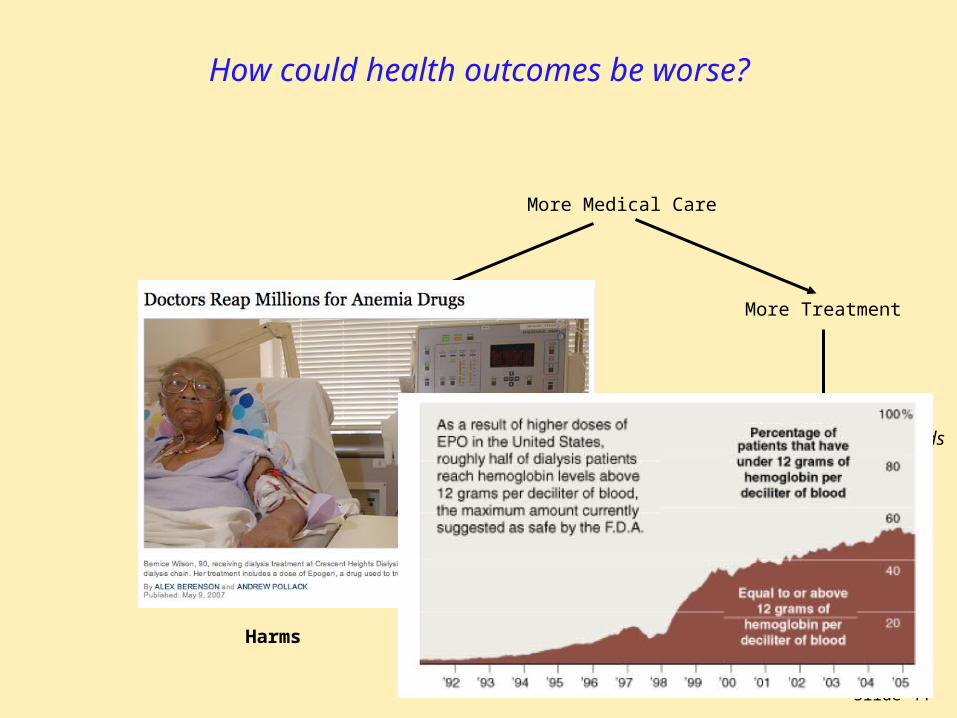
Slide 44
How could health outcomes be worse?
Lower treatment thresholdsTampering
More Medical Care
Settings
Mechanisms
Harms
More Diagnosis
PseudodiseaseLabeling
More Treatment

Slide 45
How could health outcomes be worse?
More Medical Care
Settings More Diagnosis More Treatment
Lower treatment thresholdsTampering
Mechanisms PseudodiseaseLabeling
Harms
More to do
DistractionComplexity
Fisher et al. Health Affairs October 7, 2004 web exclusives

Slide 46
How could health outcomes be worse?
Lower treatment thresholdsTampering
More Medical Care
Settings
Mechanisms
Harms
More Diagnosis More to do
PseudodiseaseLabeling
DistractionComplexity
More worry and disabilityMore unnecessary treatmentMore mistakesMore adverse events
More Treatment

Slide 47
Slide 48
Major points
What I know: Higher spending across regions and physician groups is largely due to overuse of supply-sensitive services -- hospital and ICU stays, MD visits, specialist consults; and -- at the margin -- more is worse.
What I think I know: Overuse is largely a consequence of reasonable differences in clinical judgment that emerge in response to local organizational attributes (capacity, clinical culture) and financial incentives that promote unnecessary growth and more care.

Slide 49
Why might this be important?Highlights the challenges confronting current P4P initiatives
Level of measurement: individual providersReinforces current fragmentation and lack of coordinationAttribution and small numbers a serious problemData collection at individual MD level (n = 500,000) a challenge
Scope of measurement: technical qualityNarrow focus on technical quality, guideline adherenceMeasures ignore problem of clinical judgment, patient preferences No measures of many important dimensions: health outcomes, costs of care, care coordination, care transitions
Implementation: difficult for majority of physicians
Unintended consequences: cause more harm than good?If inadequate risk adjustment, physicians will avoid sick patientsSafety net providers could be less likely to receive rewardsEmphasis on financial incentives could further undermine core professional values (already threatened by commercializaton)

Slide 50
But do we have a choice?Institute of Medicine recommended moving forward with P4P
The current payment system is “toxic” -- a key cause of our problemsReinforces fragmentation and lack of coordinationThe driving force behind rising costs and overuseIn many settings -- rewards bad care, punishes good care.
Implementation of P4P can be seen as a path to fundamental payment reform -- if specific principles guide implementationComprehensive performance measures: outcomes, costs Encourage shared accountability among all responsible providersRigorous, ongoing evaluation to allow mid-course corrections
But this is more easily said than done…

Slide 51
Some thoughts on moving forwardWe need to consider underlying causes of rising costs, poor quality
Failure to recognize key role of local system (capacity, clinical culture) asdriver
Assumption that more is betterEquating less care with rationing
Payment system that rewards morecare, increased capacity, high margintreatments, entrepreneurial behavior
Foster development of local organizations(delivery systems) accountable for care (withincentives to limit future growth)
Balanced information on risks / benefitsComprehensive performance measures
Reform of payment system (long term)Shared savings as interim approach
Underlying cause General Approach
Slide 52
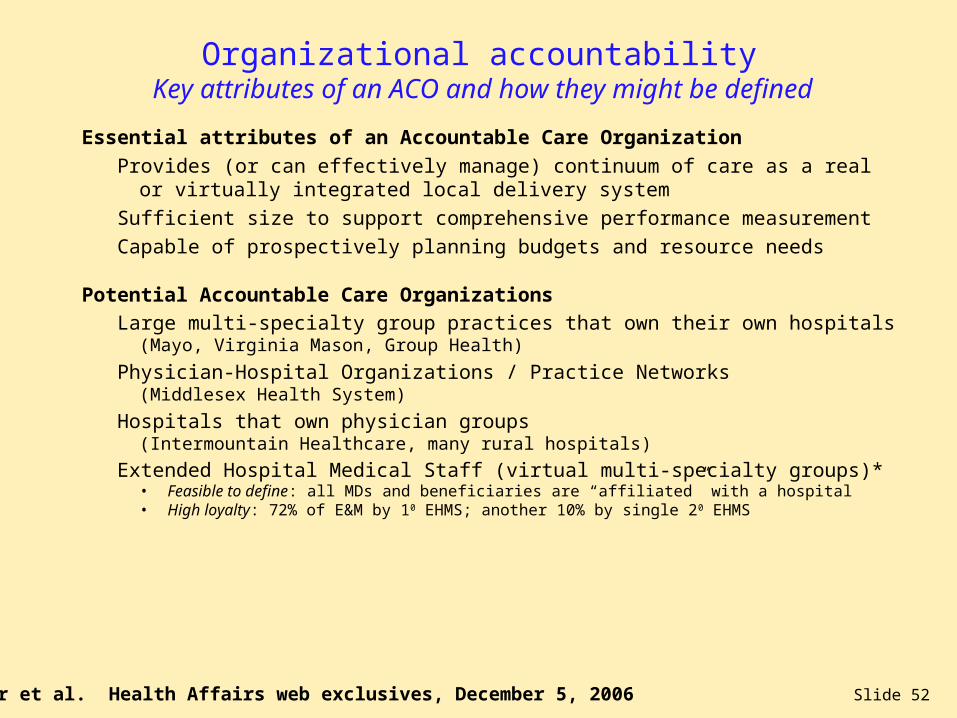
Organizational accountability Key attributes of an ACO and how they might be defined
Essential attributes of an Accountable Care Organization
Provides (or can effectively manage) continuum of care as a real or virtually integrated local delivery system
Sufficient size to support comprehensive performance measurement
Capable of prospectively planning budgets and resource needs
Potential Accountable Care Organizations
Large multi-specialty group practices that own their own hospitals(Mayo, Virginia Mason, Group Health)
Physician-Hospital Organizations / Practice Networks(Middlesex Health System)
Hospitals that own physician groups(Intermountain Healthcare, many rural hospitals)
Extended Hospital Medical Staff (virtual multi-specialty groups)*• Feasible to define: all MDs and beneficiaries are “affiliated” with a hospital• High loyalty: 72% of E&M by 10 EHMS; another 10% by single 20 EHMS
*Fisher et al. Health Affairs web exclusives, December 5, 2006

Slide 53
Performance MeasurementAdvantages of focusing on medical groups or hospital - staff
Performance measurement more tractable at ACO levelCan include all physicians who contribute to care within frame of measurement immediately -- with
adequate sample sizes
More practical (5000 entities to audit, vs 500,000)
Scope of measurement could include all aspects relevant to patients Effective care: more precise and stable measures of technical quality
Preference sensitive care: “informed patient choice” measures.
Supply-sensitive care: longitudinal costs and quality
Structural measures: traditional (e.g. electronic health records, CPOE)new dimensions: transparency on incentives, potential conflicts of interest
Establishes a viable locus of accountability and needed resources No other logical candidate for decisions on capacity
ACOs would have resources to finance electronic health records for associated physicians and implement quality improvement initiatives

Slide 54
Payment reform Challenges and opportunities
Barriers to comprehensive payment reform are substantial
Public opposition to capitation; provider concern about bearing risk
Development of other prospective payment approaches years away
Might “shared savings” approaches help in the interim?
Key notion: establish target growth rate; reward physician groups that achieve per-beneficiary spending growth below the target with portion of savings
Theory being tested in the Physician Group Practice demonstration
Has important advantages:• Preserves fee-for-service payment (a plus for patients and MDs)• Provides incentive to avoid increases in capacity (and to reduce capacity where feasible); and to improve care in domains previously ignored:
care coordination, end-of-life care• Can be done with existing claims data

Slide 55
Payment reform Per-beneficiary spending in EHMS (n = 4772) sorted into quintiles
by magnitude of per-beneficiary growth (1999-2003)
Percentincrease 99-03**
46%
10%
21%
27%
33%
Absoluteincrease
per benef.
$936
$198
$431
$551
$675
$4000
$3000
$2000
1999 2003
Averagespending*
on MD servicesper beneficiary
at EHMS
* Using standardized payments, using 2003 RVU** Percent increase calculated relative to average 1999 per-beneficiary spending
AverageAnnual Rate
9.9%
2.4%
4.8%
6.1%
7.3%
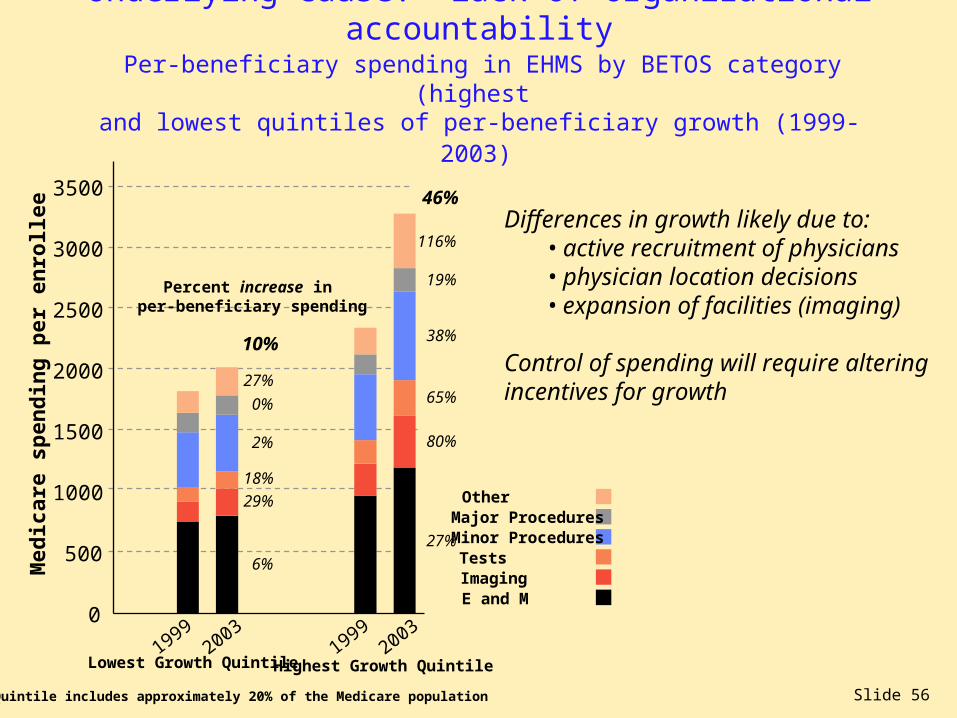
Slide 56
Underlying cause: lack of organizational accountability Per-beneficiary spending in EHMS by BETOS category (highest
and lowest quintiles of per-beneficiary growth (1999-2003)
0
500
1000
1500
2000
2500
3000
3500
19992003
Lowest Growth Quintile
Med
icar
e sp
end
ing
per
en
roll
ee
OtherMajor ProceduresMinor ProceduresTestsImagingE and M
6%
29%
18%
2%
0%
27%
10%
19992003
Highest Growth Quintile
27%
80%
65%
38%
19%
116%
46%
Percent increase in per-beneficiary spending
Each Quintile includes approximately 20% of the Medicare population
Differences in growth likely due to: • active recruitment of physicians • physician location decisions • expansion of facilities (imaging)
Control of spending will require alteringincentives for growth
Slide 57
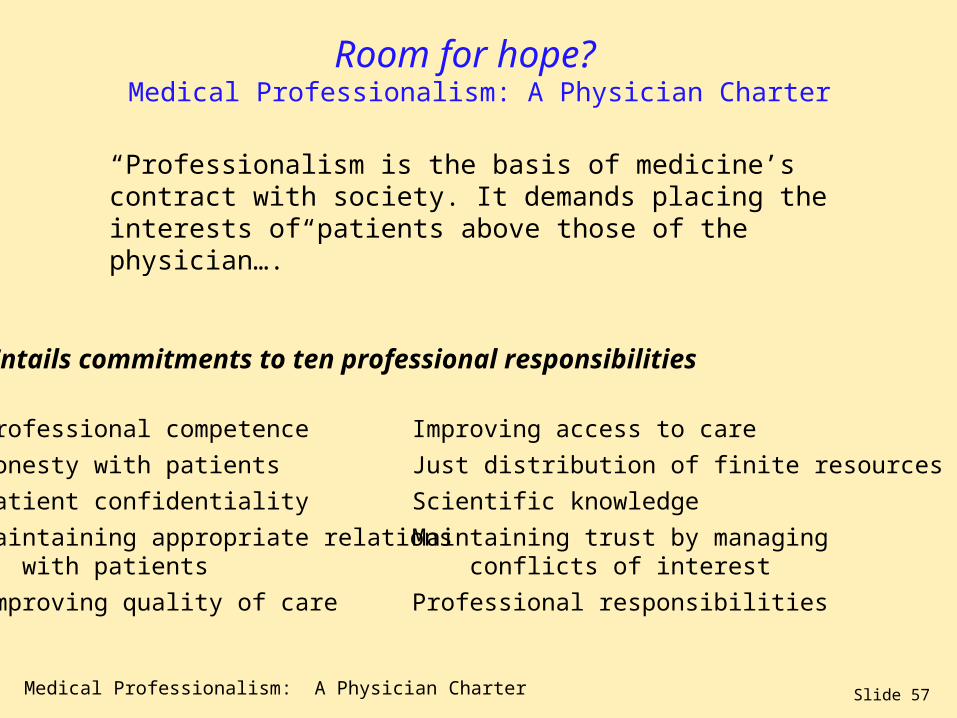
Room for hope? Medical Professionalism: A Physician Charter
“Professionalism is the basis of medicine’s contract with society. It demands placing the interests of patients above those of the physician….”
Medical Professionalism: A Physician Charter
Professional competence
Honesty with patients
Patient confidentiality
Maintaining appropriate relations with patients
Improving quality of care
Improving access to care
Just distribution of finite resources
Scientific knowledge
Maintaining trust by managing conflicts of interest
Professional responsibilities
Entails commitments to ten professional responsibilities
Slide 58
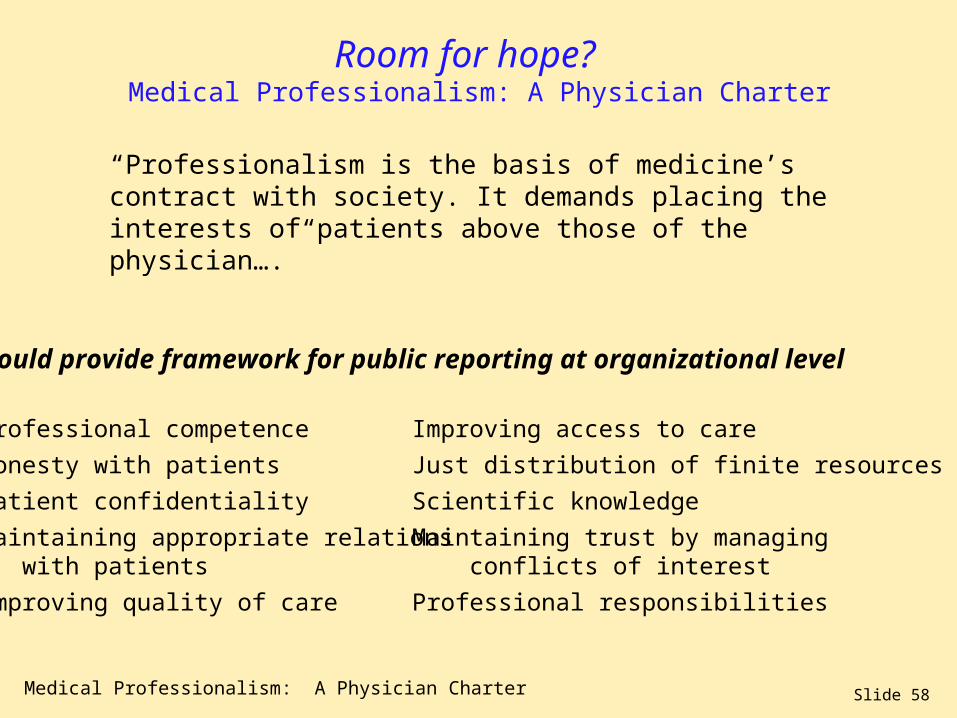
Room for hope? Medical Professionalism: A Physician Charter
“Professionalism is the basis of medicine’s contract with society. It demands placing the interests of patients above those of the physician….”
Medical Professionalism: A Physician Charter
Professional competence
Honesty with patients
Patient confidentiality
Maintaining appropriate relations with patients
Improving quality of care
Improving access to care
Just distribution of finite resources
Scientific knowledge
Maintaining trust by managing conflicts of interest
Professional responsibilities
Could provide framework for public reporting at organizational level

Slide 59
Room for hope? ACR statement on P4P
Down the road, we hope that all providers involved in treating the same patient can share in any bonus for improved care efficiency and outcomes. The ultimate goal of P4P is to unify providers around what is best for the patient, eliminating the lack of coordination and segmentation so commonplace today and allowing quality to take center stage.
American College of Radiology“ACR’s Pay for Performance (P4P) InitiativesWhere We Are and Where We’re Going”

Slide 60
Major points
What I know: Higher spending across regions and physician groups is largely due to overuse of supply-sensitive services -- hospital and ICU stays, MD visits, specialist consults; and -- at the margin -- more is worse.
What I think I know: Overuse is largely a consequence of reasonable differences in clinical judgment that emerge in response to local organizational attributes (capacity, clinical culture) and a national policy and culture that promotes growth and more care.
What I’d like to know: How to shift the focus of the health care system from simply “delivering care” to improving health and reducing suffering.

Slide 61
Houston…. We’ve got a problem.
Recommended