1Challenge the future
Field-test of nacelle-based lidar to explore its applications for Vattenfall as wind park operator
Monday, 18 May 2015
Stefan Goossens
2Challenge the future
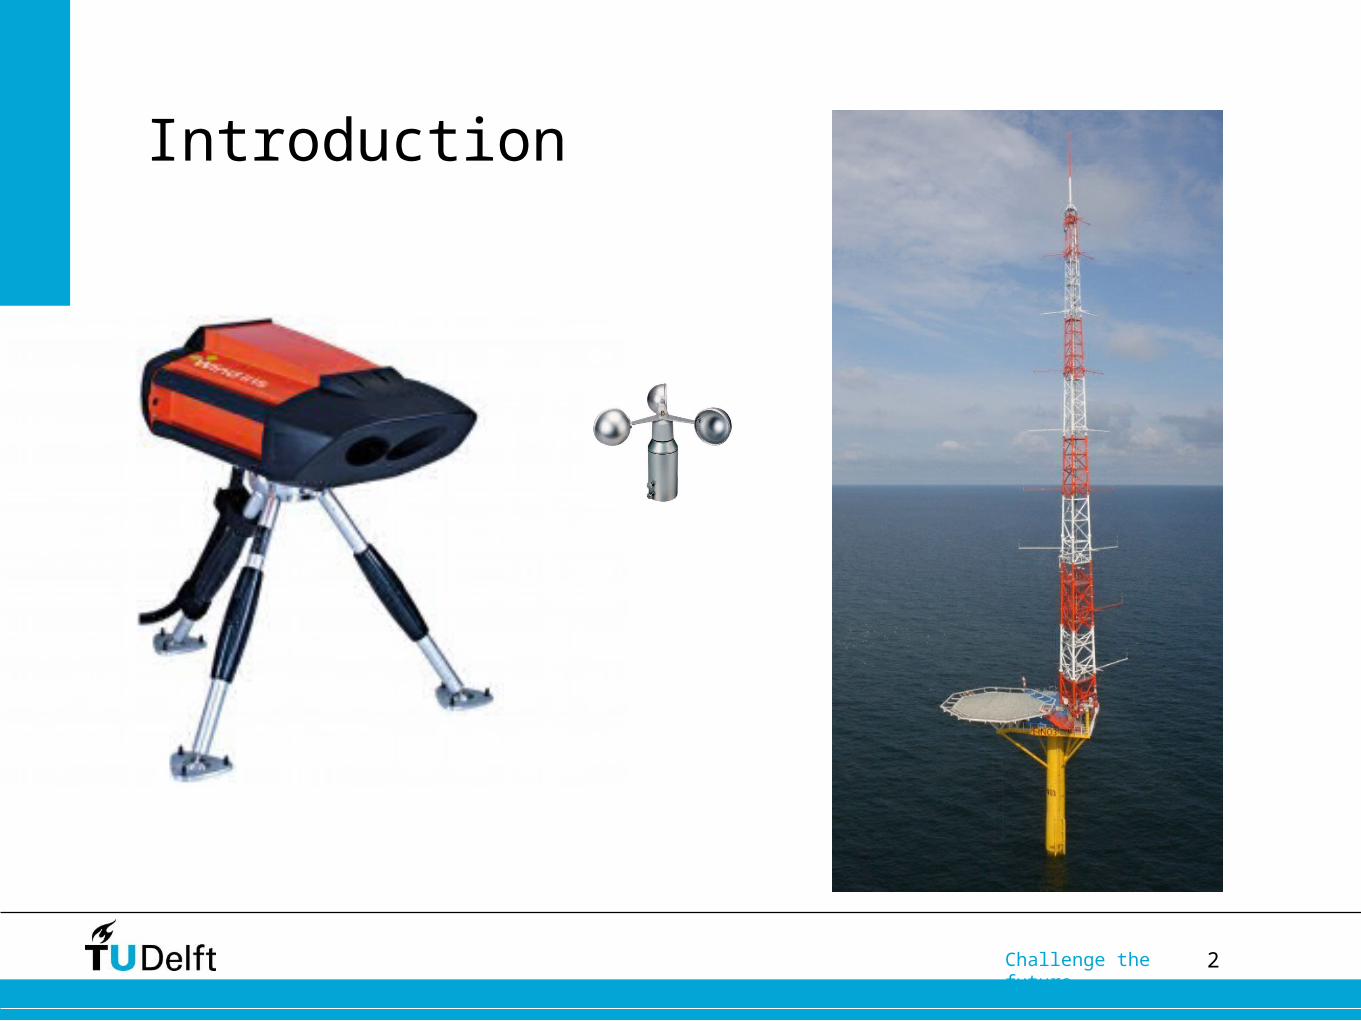
Introduction

3Challenge the future
Applications
1. Power curve2. Yaw misalignment3. Blockage effect

4Challenge the future
Content
(Research objective I)
(Research objective II)(Research objective III)(Research objective IV)(Research objective V)
Measurement campaignWorking principleExperienceValidation1. Power curve2. Yaw misalignment3. Blockage effect Financial feasibilityConclusions and RecommendationsQuestions

5Challenge the future
Measurement campaign
• Slufterdam West• Wind Iris installed 18 September 2014• Sodar installed 13 October 2014• Campaign length: 3 months
Photo: Havenbedrijf Rotterdam N.V., Projectorganisatie Maasvlakte 2

6Challenge the future
Working principle

7Challenge the future
Experience
• Installation ~8 hours by 4 technicians, no major issues
• Easy access to data; good availability (90%)• Data processing relatively straightforward• Good support during the campaign from Oldbaum• Plenty of literature and guidelines for comparison and
verification

8Challenge the future
Validation
Comparison to on-site sodar• Wind Iris is able to measure 10-min
wind speed accurately: good
correlation, in accordance with
literature
• Turbulence intensity questionable
• YM measurement less accurate than
anticipated: 4°vs 0.5°

9Challenge the future
1. Power curve
• Wind speed at hub height and 2.5D• Power measurement requires more certainty to be IEC
compliant• Density correction• Shear & Veer

10Challenge the future
2. Yaw misalignment

11Challenge the future
2. Yaw misalignment
What is the ideal yaw misalignment when it comes to the power curve?
A small angle (~5 degrees)90 degrees
As close to zero as possible?

12Challenge the future
• Mean yaw misalignment: 1.5 degrees• 0 degrees yaw misalignment not necessarily best?
2. Yaw misalignment

13Challenge the future
2. Yaw misalignment

14Challenge the future
2. Yaw misalignment
??
What is the ideal yaw misalignment when it comes to the power curve?
A small angle (~5 degrees)90 degrees
As close to zero as possible

15Challenge the future
3. Blockage effect

16Challenge the future
3. Blockage effect
Good fit with theory (average and filtered)

17Challenge the future
Financial feasibility

18Challenge the future
Financial feasibility
• Strongest drivers of ROI:• Purchase costs
• PV improvement factor
• Break even point (ROI 0%) for PV improvement of 1.2%
• Implementation not recommended due to uncertainty in PV improvement
• Financially attractive if power curve improvement can be quantified

19Challenge the future
Conclusions
• Wind Iris advantages:• Power curve measurement
• R&D applications (e.g. blockage)
• Wind Iris disadvantages:• Yaw misalignment measurement less accurate than anticipated
• No density, shear and veer measurements (yet)

20Challenge the future
Recommendations
• Use Wind Iris for PV measurement, R&D and if large yaw misalignment is suspected
• More research to investigate effect of yaw misalignment on the PV curve (e.g. intentional YM)
• Implementation recommended if PV improvement can be quantified

21Challenge the future
The future
• Power curve measurement• Feed-forward control• R&D

22Challenge the future
Questions
23Challenge the future
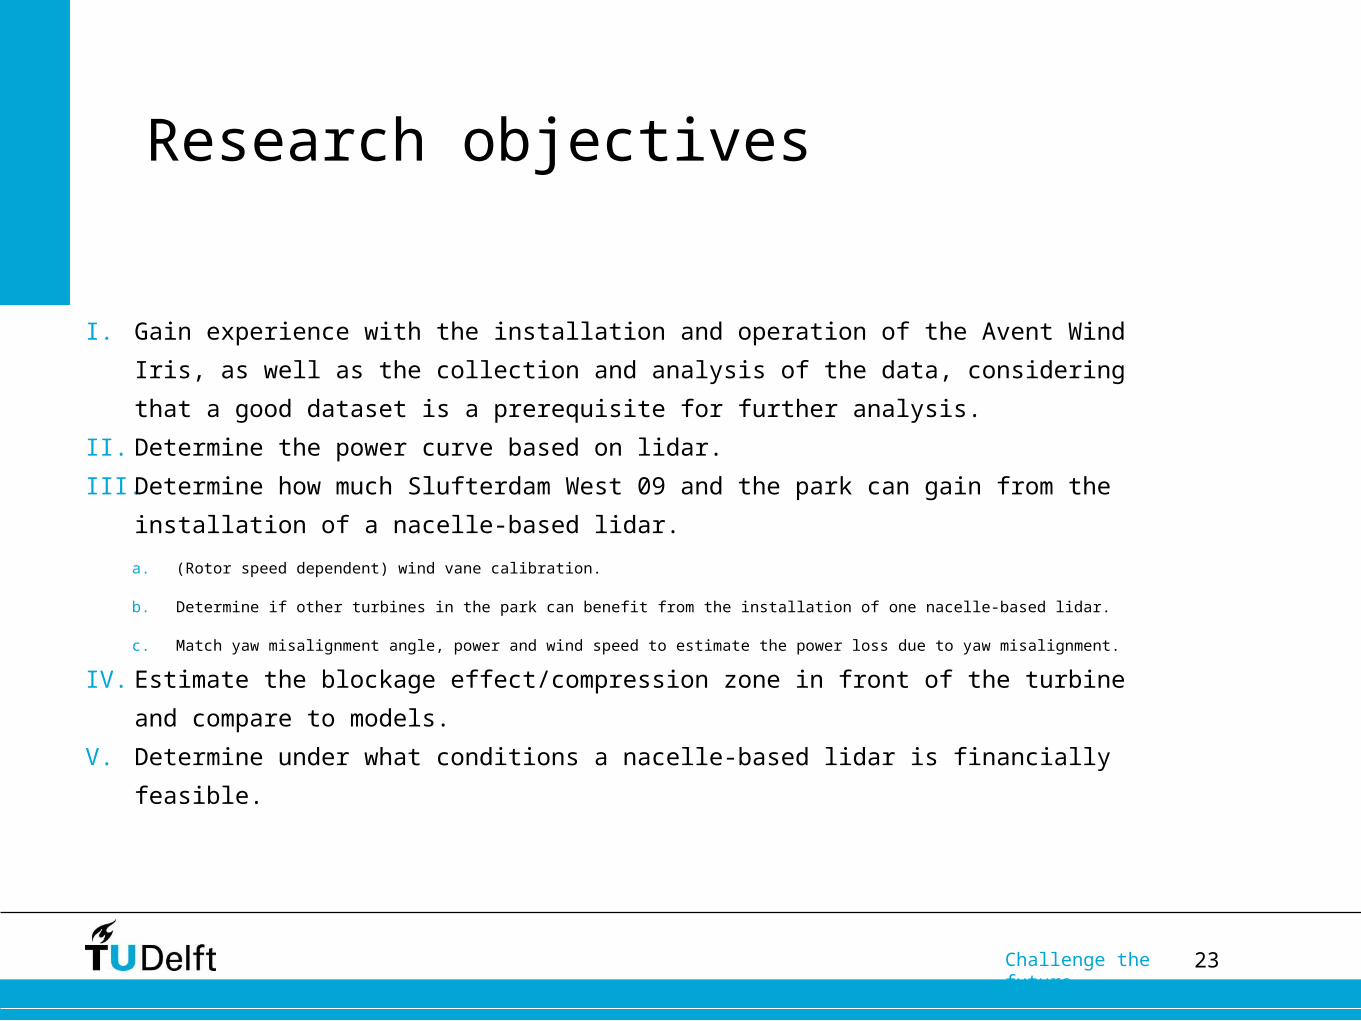
Research objectives
I. Gain experience with the installation and operation of the Avent Wind Iris,
as well as the collection and analysis of the data, considering that a good
dataset is a prerequisite for further analysis.
II. Determine the power curve based on lidar.
III. Determine how much Slufterdam West 09 and the park can gain from the
installation of a nacelle-based lidar.
a. (Rotor speed dependent) wind vane calibration.
b. Determine if other turbines in the park can benefit from the installation of one nacelle-based lidar.
c. Match yaw misalignment angle, power and wind speed to estimate the power loss due to yaw misalignment.
IV. Estimate the blockage effect/compression zone in front of the turbine and
compare to models.
V. Determine under what conditions a nacelle-based lidar is financially
feasible.

24Challenge the future
Power and yaw misalignment

25Challenge the future
Yaw misalignment and RPM/V
Recommended