1
Arlene Ash
QMC - Third TuesdaySeptember 21, 2010
Analyzing Observational Data: Focus on Propensity Scores

2
The Problem
• Those with the intervention and those without have markedly different values for important measured risk factors &
• Outcome is related to the risk factors that are imbalanced between the groups &
• It is not clear how the risk factors and outcome are related
• Why may standard analyses be misleading?

3
0
0.2
0.4
0.6
0.8
1.0
0 0.5 1.0 1.5 2.0
Risk
Out
com
eTrue and Modeled Relationship
Between Risk and Outcome
4
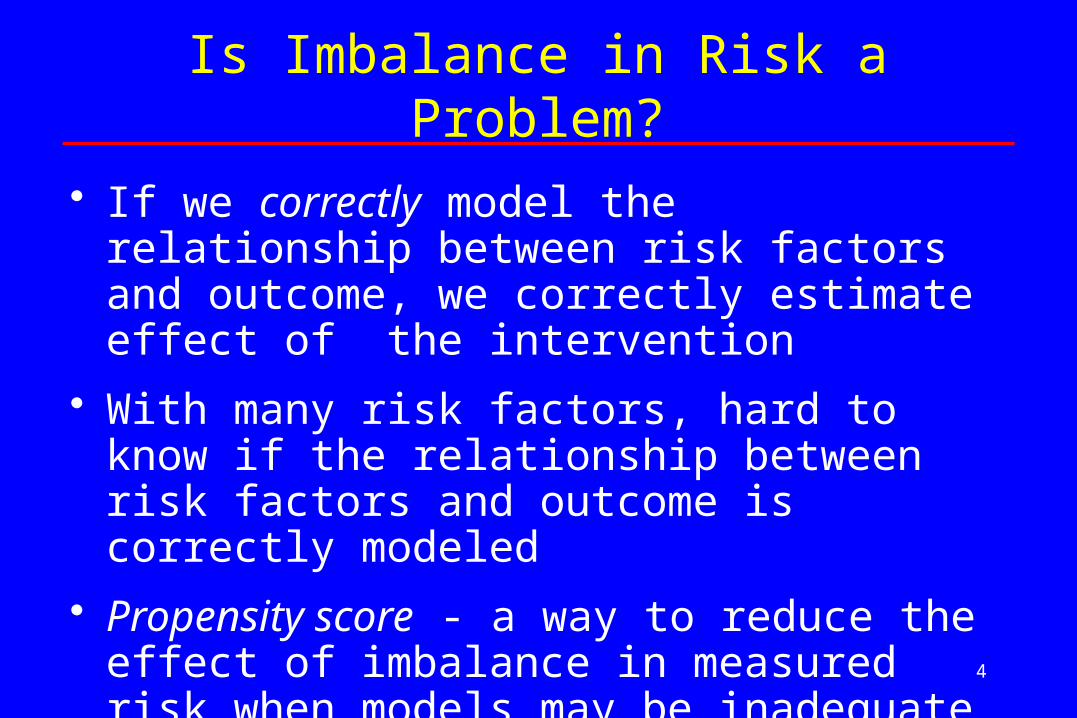
Is Imbalance in Risk a Problem?
• If we correctly model the relationship between risk factors and outcome, we correctly estimate effect of the intervention
• With many risk factors, hard to know if the relationship between risk factors and outcome is correctly modeled
• Propensity score - a way to reduce the effect of imbalance in measured risk when models may be inadequate

5
Propensity Score Method (Key Idea)
• Draw a sub-sample that is more balanced on
risk factors • Use standard techniques to analyze the sub-
sample

6
Typical Propensity Score Approach
• Estimate a model to predict the “probability of receiving the intervention” – This is “the propensity score”
• Divide the full population into quintiles of the propensity score
• Sample equal numbers of cases and controls from each quintile
• Re-fit the model to estimate the effect of the intervention in the sampled cases

7
Propensity Score Sampling Example
PS Quintile # Cases # Controls # Sampled
Lowest 12 81 24
2nd 30 67 60
Middle 44 38 76
4th 53 15 30
Highest 78 8 16
Total 217 209 206

8
Propensity Score Sampling Example: Treatments for Drug Abusers
• Patients seeking substance abuse detoxification in Boston receive either
Residential detoxification
Lasts ~ one week + encouragement for post-detox treatment, or
Acupuncture
Acute (daily) detox + 3-6 months of maintenance with acupuncture and motivational counseling

9
Data
• From Boston’s publicly-funded substance abuse treatment system
• All cases discharged from residential detox or acupuncture between 1/93 and 9/94
• Client classified (only once) as residential or acupuncture based on the modality of first discharge

10
Outcome
• Is client re-admitted to detox within 6 months? (Y/N)
• Study question: Are acupuncture clients more likely to be re-admitted than residential detox clients

11
Client Characteristics Available At Time Of Admission
• Gender• Race/ethnicity• Age• Education• Employment status• Income• Health insurance status
• Living situation• Prior mental health treatment • Primary drug• Substance abuse treatment history

12
Residential Detox & Acupuncture Cases:% with Various Characteristics
CharacteristicResidential (n = 6,907)
Acupuncture(n = 1,104)
Gender: female 29 33
Race/ethnicity: black 46 46
Hispanic 12 10
White 41 43
Education: HS grad 56 59
College graduate 4 13
13
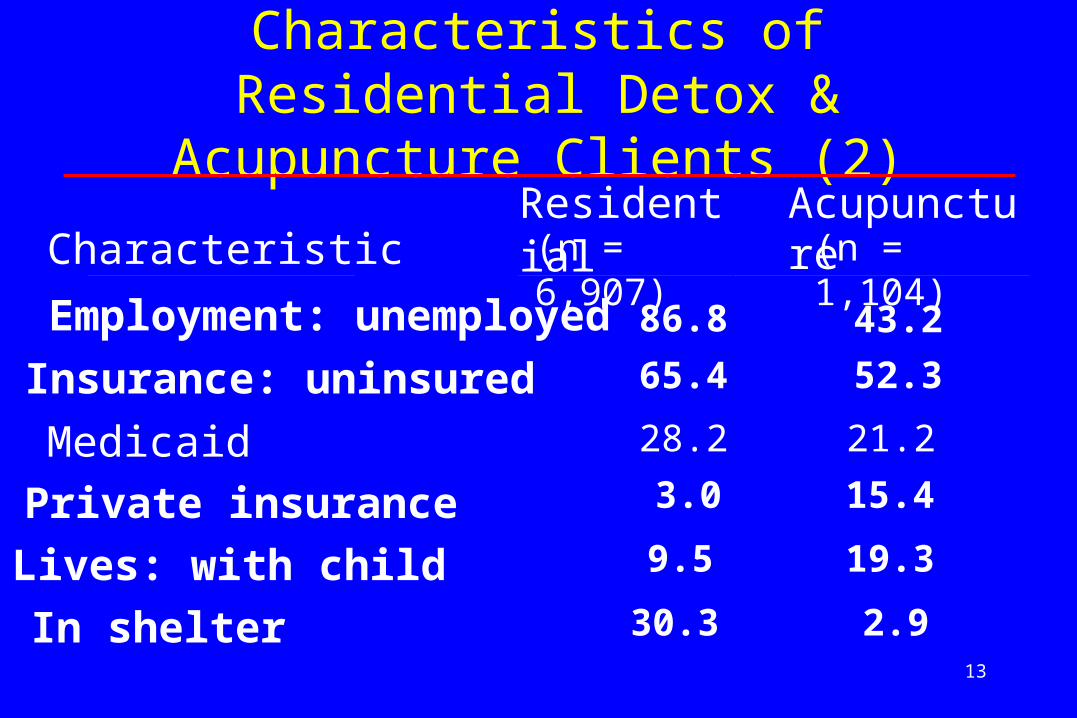
Employment: unemployed 86.8 43.2
Insurance: uninsured 65.4 52.3
Medicaid 28.2 21.2
Private insurance 3.0 15.4
Lives: with child 9.5 19.3
In shelter 30.3 2.9
CharacteristicResidential (n = 6,907)
Acupuncture(n = 1,104)
Characteristics of Residential Detox & Acupuncture Clients (2)
14
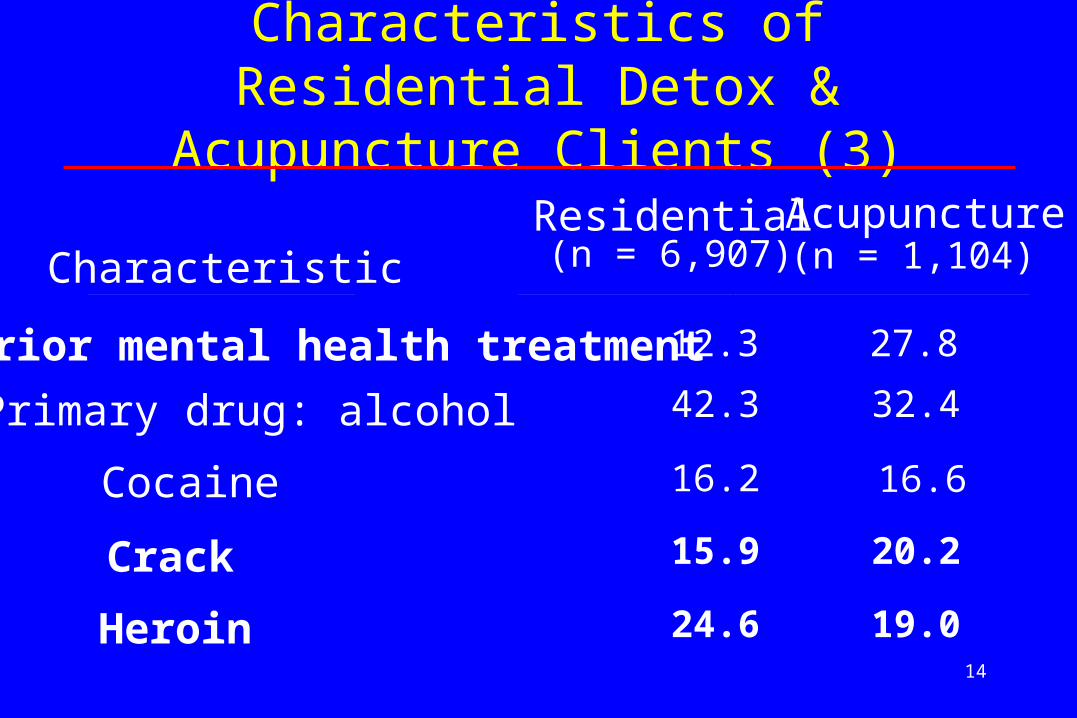
Prior mental health treatment 12.3 27.8
Primary drug: alcohol 42.3 32.4
Cocaine 16.2 16.6
Crack 15.9 20.2
Heroin 24.6 19.0
CharacteristicResidential (n = 6,907)
Acupuncture(n = 1,104)
Characteristics of Residential Detox & Acupuncture Clients (3)

15
Substance abuse admits in the last yearResidential detox: 0
12+
Short-term residential: 0Long-term residential: 0Outpatient: NoneAcupuncture: None
56.7
20.223.176.280.580.695.9
81.012.17.0
94.893.554.390.1
CharacteristicResidential (n = 6,907)
Acupuncture(n = 1,104)
Characteristics of Residential Detox & Acupuncture Clients (4)

16
Results Of Standard Analysis
Percentage of clients re-admitted to detox within 6 months• Among 1,104 acupuncture cases, 18% re-admitted • Among 6,907 residential detox cases, 36% re-admitted• Raw odds ratio = 0.40From a multivariable stepwise logistic regression model:• Odds ratio for acupuncture: 0.71 (CI = 0.53-0.95)

17
Concern
• Given large differences in risk adjustors between the groups and possibility of model mis-specification, should we be concerned about the estimated effect of acupuncture?
• Stratum-specific modeling has been used to address such concerns historically– Strata defined by a limited number of particularly
important risk adjustors• Propensity scores, a generalization
– Used when there are many important predictors

18
Propensity Score Application
• Use stepwise logistic regression to build a model to predict whether a client “is a case” (i.e., receives acupuncture)
• Select sub-samples of cases and controls that have similar distribution of the “propensity score” (predicted probability of being a case)
• Model (as before) on the sub-sample
19
Sampling Results
• Able to match 740 cases (out of the full sample of 1,104 cases) with 740 comparable controls (out of the full sample of 6,907 controls)
• Much more balance in terms of risk in this sub-sample

20
Characteristic Residential Acupuncture
College graduateEmployedPrivate InsuranceLives with child or adultLives in shelterPrior mental health Rx
7% 41%
9% 72%
5% 21%
(4%)(13%)
(3%)(55%)(30%)(12%)
7% 42%
6% 77%
4% 21%
(13%)(57%)(15%)(76%)
(3%)(28%)
Characteristics of Clients in Subsample (Full Sample)

21
Comparing Standard and Propensity Score Findings
From the multivariable model fit to all cases:Odds Ratio for acupuncture: 0.7195% Confidence Interval: 0.53-
0.95From multivariable model fit to more comparable sub-
sample:OR for acupuncture: 0.6195% CI: 0.39-
0.94

22
Summary
• In this case, results were similar - Why? Original model was very good (C-statistic = 0.96)• What was learned from the propensity score
analysis:–Could find a subset of controls (about 10%) who
look very similar to cases–Found similar results in this subset, increasing
the credibility of the findings
23
Which Belong in the PS Model?
• Confounders (Brookhart’s X1 variables)?
• Simple predictors (X2 s)?
• Simple selectors (X3 s)?
• Let’s work together to fill in the following table

24
Variable type Directly affectsBelongs in
which modelOutcome
(Y) Exposure
(E) PS Regression
X1 Confounder 1 1 ? ?
X2 Predictor 1 0 ? ?
X3 Selector 0 1 ? ?
Recommended