© 2006 Prentice Hall, Inc. 8 – 1
Location StrategyLocation Strategy
One of the most important decisions One of the most important decisions a firm makesa firm makes
Increasingly global in natureIncreasingly global in nature
Long term impact and decisions are Long term impact and decisions are difficult to changedifficult to change
The objective is to maximize the The objective is to maximize the benefit of location to the firmbenefit of location to the firm

© 2006 Prentice Hall, Inc. 8 – 2
Location and InnovationLocation and Innovation
Cost is not always the most important Cost is not always the most important aspect of a strategic decisionaspect of a strategic decision
Four key attributes when strategy is Four key attributes when strategy is based on innovationbased on innovation High-quality and specialized inputsHigh-quality and specialized inputs
An environment that encourages An environment that encourages investment and local rivalryinvestment and local rivalry
A sophisticated local marketA sophisticated local market
Local presence of related and Local presence of related and supporting industriessupporting industries

© 2006 Prentice Hall, Inc. 8 – 3
Location DecisionsLocation Decisions
Long-term decisions Long-term decisions
Decisions made infrequentlyDecisions made infrequently
Decision greatly affects both fixed Decision greatly affects both fixed and variable costs and variable costs
Once committed to a location, Once committed to a location, many resource and cost issues are many resource and cost issues are difficult to changedifficult to change

© 2006 Prentice Hall, Inc. 8 – 4
Location DecisionsLocation DecisionsCountry DecisionCountry Decision Critical Success FactorsCritical Success Factors
1.1. Political risks, government Political risks, government rules, attitudes, incentivesrules, attitudes, incentives
2.2. Cultural and economic Cultural and economic issuesissues
3.3. Location of marketsLocation of markets
4.4. Labor availability, Labor availability, attitudes, productivity, attitudes, productivity, costscosts
5.5. Availability of supplies, Availability of supplies, communications, energycommunications, energy
6.6. Exchange rates and Exchange rates and currency riskscurrency risks
Figure 8.1Figure 8.1

© 2006 Prentice Hall, Inc. 8 – 5
Location DecisionsLocation DecisionsRegion/ Region/
Community Community DecisionDecision
Critical Success FactorsCritical Success Factors
1.1. Corporate desiresCorporate desires
2.2. Attractiveness of region Attractiveness of region
3.3. Labor availability, costs, Labor availability, costs, attitudes towards unionsattitudes towards unions
4.4. Costs and availability of utilitiesCosts and availability of utilities
5.5. Environmental regulationsEnvironmental regulations
6.6. Government incentives and Government incentives and fiscal policiesfiscal policies
7.7. Proximity to raw materials and Proximity to raw materials and customerscustomers
8.8. Land/construction costsLand/construction costs
MN
WI
MI
IL INOH
Figure 8.1Figure 8.1

© 2006 Prentice Hall, Inc. 8 – 6
Location DecisionsLocation DecisionsSite DecisionSite Decision Critical Success FactorsCritical Success Factors
1.1. Site size and costSite size and cost
2.2. Air, rail, highway, and Air, rail, highway, and waterway systemswaterway systems
3.3. Zoning restrictionsZoning restrictions
4.4. Nearness of services/ Nearness of services/ supplies neededsupplies needed
5.5. Environmental impact Environmental impact issuesissues
Figure 8.1Figure 8.1

© 2006 Prentice Hall, Inc. 8 – 7
Factors That Affect Factors That Affect Location DecisionsLocation Decisions
Labor productivityLabor productivity Wage rates are not the only costWage rates are not the only cost
Lower productivity may increase total costLower productivity may increase total cost
Labor cost per dayLabor cost per day
Productivity (units per day)Productivity (units per day)= cost per unit= cost per unit
ConnecticutConnecticut
= $1.17= $1.17 per unit per unit$70$70
6060 units units
JuarezJuarez
= $1.25= $1.25 per unit per unit$25$25
2020 units units

© 2006 Prentice Hall, Inc. 8 – 8
Factors That Affect Factors That Affect Location DecisionsLocation Decisions
Exchange rates and currency risksExchange rates and currency risks Can have a significant impact on cost Can have a significant impact on cost
structurestructure
Rates change over timeRates change over time
CostsCosts Tangible - easily measured costs such as Tangible - easily measured costs such as
utilities, labor, materials, taxesutilities, labor, materials, taxes
Intangible - less easy to quantify and Intangible - less easy to quantify and include education, public transportation, include education, public transportation, community, quality-of-lifecommunity, quality-of-life

© 2006 Prentice Hall, Inc. 8 – 9
Factors That Affect Factors That Affect Location DecisionsLocation Decisions
AttitudesAttitudes National, state, local governments toward National, state, local governments toward
private and intellectual property, zoning, private and intellectual property, zoning, pollution, employment stabilitypollution, employment stability
Worker attitudes towards turnover, unions, Worker attitudes towards turnover, unions, absenteeismabsenteeism
Globally cultures have different attitudes Globally cultures have different attitudes towards punctuality, legal, and ethical towards punctuality, legal, and ethical issuesissues

© 2006 Prentice Hall, Inc. 8 – 10
Factors That Affect Factors That Affect Location DecisionsLocation Decisions
Proximity to marketsProximity to markets Very important to servicesVery important to services
JIT systems or high transportation costs JIT systems or high transportation costs may make it important to manufacturersmay make it important to manufacturers
Proximity to suppliersProximity to suppliers Perishable goods, high transportation Perishable goods, high transportation
costs, bulky productscosts, bulky products

© 2006 Prentice Hall, Inc. 8 – 11
Factors That Affect Factors That Affect Location DecisionsLocation Decisions
Proximity to competitorsProximity to competitors Called clusteringCalled clustering
Often driven by resources such as natural, Often driven by resources such as natural, information, capital, talentinformation, capital, talent
Found in both manufacturing and service Found in both manufacturing and service industriesindustries

© 2006 Prentice Hall, Inc. 8 – 12
Growth Competitiveness Growth Competitiveness Index of CountriesIndex of Countries
CountryCountry 2004 Rank2004 Rank 2003 Rank2003 Rank
FinlandFinland 11 11USAUSA 22 22SwedenSweden 33 33TaiwanTaiwan 44 55JapanJapan 99 1111UKUK 1111 1515GermanyGermany 1313 1313CanadaCanada 1515 1616New ZealandNew Zealand 1818 1414FranceFrance 2727 2626RussiaRussia 7070 7070

© 2006 Prentice Hall, Inc. 8 – 13
Clustering of CompaniesClustering of Companies
IndustryIndustry LocationsLocations Reason for clusteringReason for clustering
Wine makersWine makers Napa Valley (US) Napa Valley (US) Bordeaux region Bordeaux region (France)(France)
Natural resources of Natural resources of land and climateland and climate
Software firmsSoftware firms Silicon Valley, Silicon Valley, Boston, Bangalore Boston, Bangalore (India)(India)
Talent resources of Talent resources of bright graduates in bright graduates in scientific/technical scientific/technical areas, venture areas, venture capitalists nearbycapitalists nearby
Race car Race car buildersbuilders
Huntington/North Huntington/North Hampton region Hampton region (England)(England)
Critical mass of talent Critical mass of talent and informationand information
Table 8.3Table 8.3

© 2006 Prentice Hall, Inc. 8 – 14
Clustering of CompaniesClustering of Companies
IndustryIndustry LocationsLocations Reason for clusteringReason for clustering
Theme parksTheme parks OrlandoOrlando A hot spot for A hot spot for entertainment, warm entertainment, warm weather, tourists, and weather, tourists, and inexpensive laborinexpensive labor
Electronic firmsElectronic firms Northern MexicoNorthern Mexico NAFTA, duty free NAFTA, duty free export to USexport to US
Computer Computer hardware hardware manufacturersmanufacturers
Singapore, TaiwanSingapore, Taiwan High technological High technological penetration rate and penetration rate and per capita GDP, per capita GDP, skilled/educated skilled/educated workforce with large workforce with large pool of engineerspool of engineers
Table 8.3Table 8.3

© 2006 Prentice Hall, Inc. 8 – 15
Clustering of CompaniesClustering of Companies
IndustryIndustry LocationsLocations Reason for clusteringReason for clustering
Fast food Fast food chainschains
Sites within one Sites within one mile of each othermile of each other
Stimulate food sales, Stimulate food sales, high traffic flowshigh traffic flows
General General aviation aircraftaviation aircraft
Wichita, KansasWichita, Kansas Mass of aviation skillsMass of aviation skills
Table 8.3Table 8.3
© 2006 Prentice Hall, Inc. 8 – 16
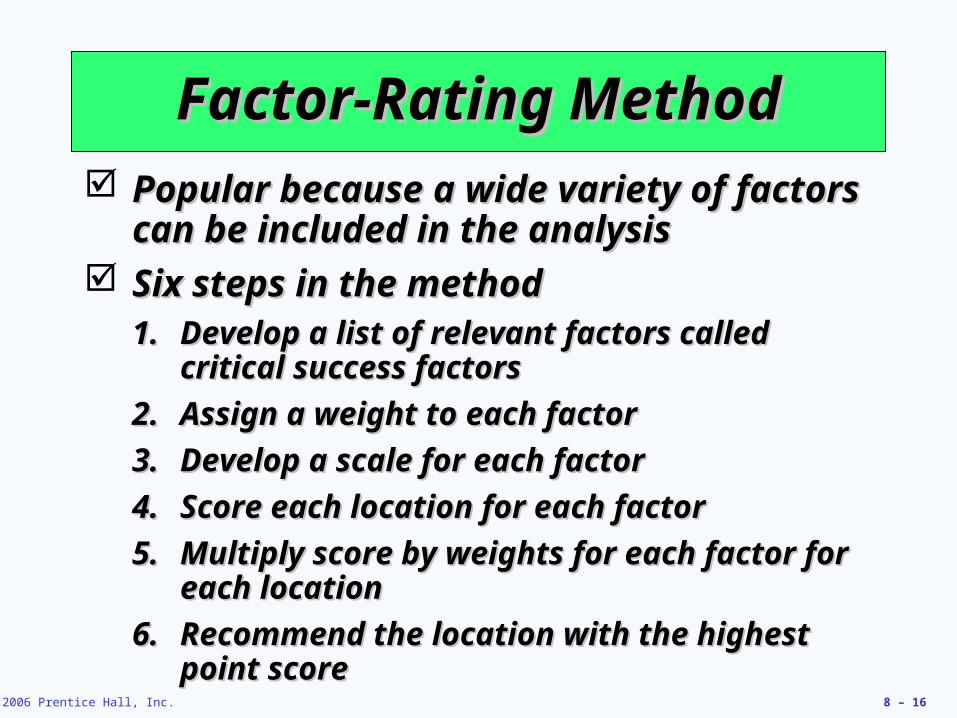
Factor-Rating MethodFactor-Rating Method Popular because a wide variety of factors Popular because a wide variety of factors
can be included in the analysiscan be included in the analysis Six steps in the methodSix steps in the method
1.1. Develop a list of relevant factors called Develop a list of relevant factors called critical success factorscritical success factors
2.2. Assign a weight to each factorAssign a weight to each factor
3.3. Develop a scale for each factorDevelop a scale for each factor
4.4. Score each location for each factorScore each location for each factor
5.5. Multiply score by weights for each factor for Multiply score by weights for each factor for each locationeach location
6.6. Recommend the location with the highest Recommend the location with the highest point scorepoint score

© 2006 Prentice Hall, Inc. 8 – 17
Factor-Rating ExampleFactor-Rating Example
CriticalCritical ScoresScoresSuccessSuccess (out of 100)(out of 100) Weighted ScoresWeighted ScoresFactorFactor WeightWeight FranceFrance DenmarkDenmark FranceFrance DenmarkDenmark
Labor Labor availability availability and attitude and attitude .25.25 7070 6060 (.25)(70) = 17.5(.25)(70) = 17.5 (.25)(60) = 15.0(.25)(60) = 15.0People-toPeople-to car ratiocar ratio .05.05 5050 6060 (.05)(50) = 2.5(.05)(50) = 2.5 (.05)(60) = 3.0(.05)(60) = 3.0Per capitaPer capita incomeincome .10.10 8585 8080 (.10)(85) = 8.5(.10)(85) = 8.5 (.10)(80) = 8.0(.10)(80) = 8.0Tax structureTax structure .39.39 7575 7070 (.39)(75) = 29.3(.39)(75) = 29.3 (.39)(70) = 27.3(.39)(70) = 27.3EducationEducation and healthand health .21.21 6060 7070 (.21)(60) = 12.6(.21)(60) = 12.6 (.21)(70) = 14.7(.21)(70) = 14.7
TotalsTotals 1.001.00 70.470.4 68.068.0
Table 8.3Table 8.3
© 2006 Prentice Hall, Inc. 8 – 18
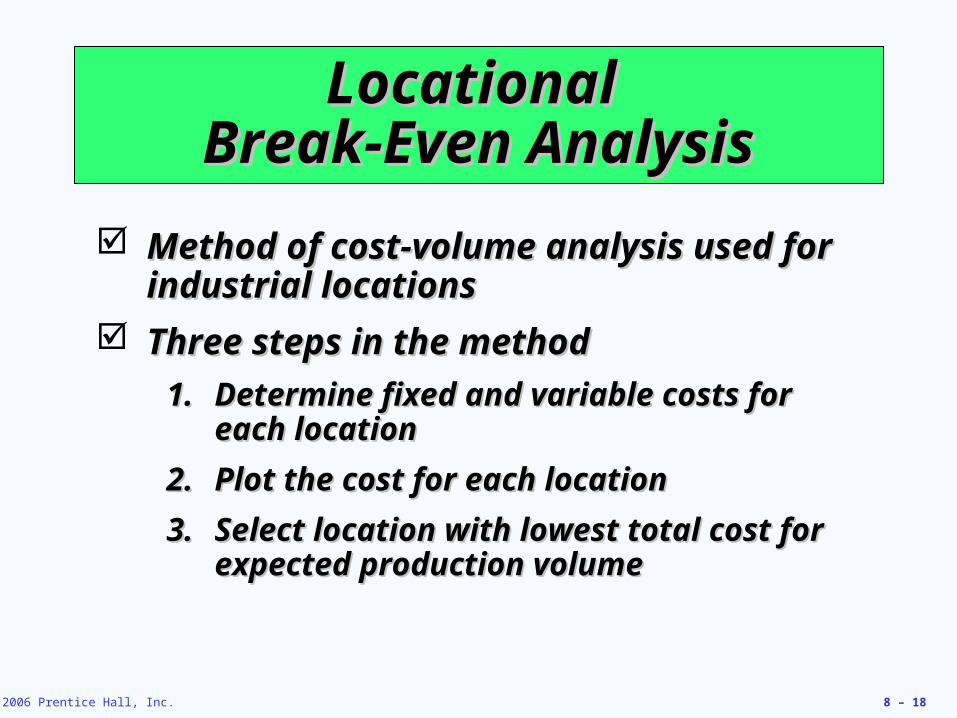
Locational Locational Break-Even AnalysisBreak-Even Analysis
Method of cost-volume analysis used for Method of cost-volume analysis used for industrial locationsindustrial locations
Three steps in the methodThree steps in the method
1.1. Determine fixed and variable costs for Determine fixed and variable costs for each locationeach location
2.2. Plot the cost for each location Plot the cost for each location
3.3. Select location with lowest total cost for Select location with lowest total cost for expected production volumeexpected production volume
© 2006 Prentice Hall, Inc. 8 – 19
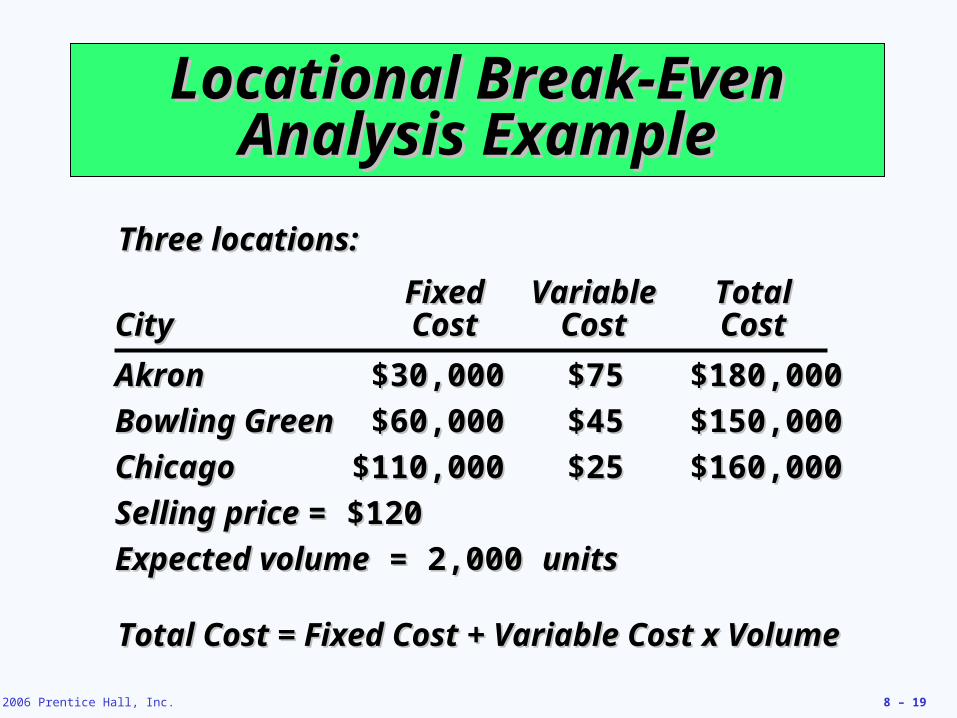
Locational Break-Even Locational Break-Even Analysis ExampleAnalysis Example
Three locations:Three locations:
AkronAkron $30,000$30,000 $75$75 $180,000$180,000
Bowling GreenBowling Green $60,000$60,000 $45$45 $150,000$150,000
ChicagoChicago $110,000$110,000 $25$25 $160,000$160,000
Selling price Selling price = $120= $120
Expected volumeExpected volume = 2,000 = 2,000 unitsunits
FixedFixed VariableVariable TotalTotalCityCity CostCost CostCost CostCost
Total Cost = Fixed Cost + Variable Cost x VolumeTotal Cost = Fixed Cost + Variable Cost x Volume

© 2006 Prentice Hall, Inc. 8 – 20
Locational Break-Even Locational Break-Even Analysis ExampleAnalysis Example
–$180,000 $180,000 –
–$160,000 $160,000 –$150,000 $150,000 –
–$130,000 $130,000 –
–$110,000 $110,000 –
––
$80,000 $80,000 ––
$60,000 $60,000 –––
$30,000 $30,000 ––
$10,000 $10,000 ––
An
nu
al c
ost
An
nu
al c
ost
| | | | | | |
00 500500 1,0001,000 1,5001,500 2,0002,000 2,5002,500 3,0003,000
VolumeVolume
Akron Akron lowest lowest costcost
Bowling Green Bowling Green lowest costlowest cost
Chicago Chicago lowest lowest costcost
Chicago cost curve
Chicago cost curve
Akron c
ost
Akron c
ost
curv
e
curv
e
Bowling Green
Bowling Green
cost curve
cost curve
Figure 8.2Figure 8.2

© 2006 Prentice Hall, Inc. 8 – 21
Center-of-Gravity MethodCenter-of-Gravity Method
Finds location of distribution Finds location of distribution center that minimizes distribution center that minimizes distribution costscosts
ConsidersConsiders Location of marketsLocation of markets
Volume of goods shipped to those Volume of goods shipped to those marketsmarkets
Shipping cost (or distance)Shipping cost (or distance)

© 2006 Prentice Hall, Inc. 8 – 22
Center-of-Gravity MethodCenter-of-Gravity Method
Place existing locations on a Place existing locations on a coordinate gridcoordinate grid Grid origin and scale is arbitrary Grid origin and scale is arbitrary
Maintain relative distancesMaintain relative distances
Calculate X and Y coordinates for Calculate X and Y coordinates for ‘center of gravity’‘center of gravity’ Assumes cost is directly Assumes cost is directly
proportional to distance and volume proportional to distance and volume shippedshipped

© 2006 Prentice Hall, Inc. 8 – 23
Center-of-Gravity MethodCenter-of-Gravity Method
x - coordinate =x - coordinate =∑∑ddixixQQii
∑∑QQii
ii
ii
∑∑ddiyiyQQii
∑∑QQii
ii
ii
y - coordinate =y - coordinate =
wherewhere ddixix == x-coordinate of x-coordinate of location ilocation i
ddiyiy == y-coordinate of y-coordinate of location ilocation i
QQii == Quantity of Quantity of goods moved to or from goods moved to or from location ilocation i

© 2006 Prentice Hall, Inc. 8 – 24
Center-of-Gravity MethodCenter-of-Gravity Method
North-SouthNorth-South
East-WestEast-West
120 120 –
90 90 –
60 60 –
30 30 –
–| | | | | |
3030 6060 9090 120120 150150Arbitrary Arbitrary originorigin
Chicago Chicago (30, 120)(30, 120)New York New York (130, 130)(130, 130)
Pittsburgh Pittsburgh (90, 110)(90, 110)
Atlanta Atlanta (60, 40)(60, 40)

© 2006 Prentice Hall, Inc. 8 – 25
Center-of-Gravity MethodCenter-of-Gravity Method
Number of ContainersNumber of ContainersStore LocationStore Location Shipped per MonthShipped per Month
Chicago Chicago (30, 120)(30, 120) 2,0002,000Pittsburgh Pittsburgh (90, 110)(90, 110) 1,0001,000New York New York (130, 130)(130, 130) 1,0001,000Atlanta Atlanta (60, 40)(60, 40) 2,0002,000
x-coordinate =x-coordinate =(30)(2000) + (90)(1000) + (130)(1000) + (60)(2000)(30)(2000) + (90)(1000) + (130)(1000) + (60)(2000)
2000 + 1000 + 1000 + 20002000 + 1000 + 1000 + 2000= = 66.766.7
y-coordinate =y-coordinate =(120)(2000) + (110)(1000) + (130)(1000) + (40)(2000)(120)(2000) + (110)(1000) + (130)(1000) + (40)(2000)
2000 + 1000 + 1000 + 20002000 + 1000 + 1000 + 2000= = 93.393.3

© 2006 Prentice Hall, Inc. 8 – 26
Center-of-Gravity MethodCenter-of-Gravity Method
North-SouthNorth-South
East-WestEast-West
120 120 –
90 90 –
60 60 –
30 30 –
–| | | | | |
3030 6060 9090 120120 150150Arbitrary Arbitrary originorigin
Chicago Chicago (30, 120)(30, 120)New York New York (130, 130)(130, 130)
Pittsburgh Pittsburgh (90, 110)(90, 110)
Atlanta Atlanta (60, 40)(60, 40)
Center of gravity Center of gravity (66.7, 93.3)(66.7, 93.3)+

© 2006 Prentice Hall, Inc. 8 – 27
Transportation ModelTransportation Model
Finds amount to be shipped from Finds amount to be shipped from several points of supply to several several points of supply to several points of demandpoints of demand
Solution will minimize total Solution will minimize total production and shipping costsproduction and shipping costs
A special class of linear A special class of linear programming problemsprogramming problems

© 2006 Prentice Hall, Inc. 8 – 28
Worldwide Distribution of Worldwide Distribution of Volkswagens and PartsVolkswagens and Parts
Figure 8.4Figure 8.4

© 2006 Prentice Hall, Inc. 8 – 29
Service Location StrategyService Location Strategy
1. Purchasing power of customer-drawing area1. Purchasing power of customer-drawing area
2. Service and image compatibility with demographics 2. Service and image compatibility with demographics of the customer-drawing areaof the customer-drawing area
3. Competition in the area3. Competition in the area
4. Quality of the competition4. Quality of the competition
5. Uniqueness of the firm’s and competitors’ locations5. Uniqueness of the firm’s and competitors’ locations
6. Physical qualities of facilities and neighboring 6. Physical qualities of facilities and neighboring businessesbusinesses
7. Operating policies of the firm7. Operating policies of the firm
8. Quality of management8. Quality of management

© 2006 Prentice Hall, Inc. 8 – 30
Location StrategiesLocation Strategies
Service/Retail/Professional LocationService/Retail/Professional Location Goods-Producing Location Goods-Producing Location
Revenue FocusRevenue Focus Cost Focus Cost Focus
Volume/revenueVolume/revenueDrawing area; purchasing powerDrawing area; purchasing powerCompetition; advertising/pricingCompetition; advertising/pricing
Physical qualityPhysical qualityParking/access; security/lighting; Parking/access; security/lighting; appearance/imageappearance/image
Cost determinantsCost determinantsRentRentManagement caliberManagement caliberOperations policies (hours, wage Operations policies (hours, wage rates)rates)
Tangible costsTangible costsTransportation cost of raw Transportation cost of raw materialmaterialShipment cost of finished goodsShipment cost of finished goodsEnergy and utility cost; labor; raw Energy and utility cost; labor; raw material; taxes, and so onmaterial; taxes, and so on
Intangible and future costsIntangible and future costsAttitude toward unionAttitude toward unionQuality of lifeQuality of lifeEducation expenditures by stateEducation expenditures by stateQuality of state and local Quality of state and local governmentgovernment
Table 8.4Table 8.4

© 2006 Prentice Hall, Inc. 8 – 31
Location StrategiesLocation Strategies
Service/Retail/Professional LocationService/Retail/Professional Location Goods-Producing Location Goods-Producing Location
TechniquesTechniques Techniques Techniques
Regression models to determine Regression models to determine importance of various factorsimportance of various factors
Factor-rating methodFactor-rating methodTraffic countsTraffic countsDemographic analysis of drawing areaDemographic analysis of drawing areaPurchasing power analysis of areaPurchasing power analysis of areaCenter-of-gravity methodCenter-of-gravity methodGeographic information systemsGeographic information systems
Transportation methodsTransportation methodsFactor-rating methodFactor-rating methodLocational break-even analysisLocational break-even analysisCrossover chartsCrossover charts
Table 8.4Table 8.4

© 2006 Prentice Hall, Inc. 8 – 32
Location StrategiesLocation Strategies
Service/Retail/Professional LocationService/Retail/Professional Location Goods-Producing Location Goods-Producing Location
AssumptionsAssumptions Assumptions Assumptions
Location is a major determinant of Location is a major determinant of revenuerevenue
High customer-contact issues are High customer-contact issues are criticalcritical
Costs are relatively constant for a Costs are relatively constant for a given area; therefore, the revenue given area; therefore, the revenue function is criticalfunction is critical
Location is a major determinant of Location is a major determinant of costcost
Most major costs can be identified Most major costs can be identified explicitly for each siteexplicitly for each site
Low customer contact allows focus Low customer contact allows focus on the identifiable costson the identifiable costs
Intangible costs can be evaluatedIntangible costs can be evaluated
Table 8.4Table 8.4

© 2006 Prentice Hall, Inc. 8 – 33
How Hotel Chains Select SitesHow Hotel Chains Select Sites
Location is a strategically important Location is a strategically important decision in the hospitality industrydecision in the hospitality industry
La Quinta started with 35 independent La Quinta started with 35 independent variables and worked to refine a variables and worked to refine a regression model to predict profitabilityregression model to predict profitability
The final model had only four variablesThe final model had only four variables Price of the innPrice of the inn
Median income levelsMedian income levels
State population per innState population per inn
Location of nearby collegesLocation of nearby colleges
r2 = .5151% of the
profitability is predicted by
just these four variables!

© 2006 Prentice Hall, Inc. 8 – 34
Telemarketing/Internet Telemarketing/Internet IndustriesIndustries
Require neither face-to-face contact Require neither face-to-face contact nor movement of materialsnor movement of materials
Have very broad location optionsHave very broad location options
Traditional variables are no longer Traditional variables are no longer relevantrelevant
Cost and availability of labor may Cost and availability of labor may drive location decisionsdrive location decisions

© 2006 Prentice Hall, Inc. 8 – 35
Geographic Information Geographic Information Systems (GIS)Systems (GIS)
New tool to help in location analysisNew tool to help in location analysis
Enables more complex demographic Enables more complex demographic analysisanalysis
Available data bases includeAvailable data bases include Detailed census dataDetailed census data
Detailed mapsDetailed maps
UtilitiesUtilities
Geographic featuresGeographic features
Locations of major servicesLocations of major services

© 2006 Prentice Hall, Inc. 8 – 36
Geographic Information Geographic Information Systems (GIS)Systems (GIS)
Recommended