Embed Size (px)
Citation preview
Water Resources of Lac Vieux Desert Indian Community and Vicinity Western Upper Peninsula Michigan
US Department of the Interior US Geological Survey Water-Resources Investigations Report 98-4051
Prepared in cooperation with the Lac Vieux Desert Band of Lake Superior Chippewa Indians
ZUSGS science fora changing world
Water Resources of Lac Vieux Desert Indian Community and Vicinity Western Upper Peninsula Michigan
By Gary J Barton and Norman G Grannemann
US Department of the Interior US Geological Survey Water-Resources Investigations Report 98-4051
Prepared in cooperation with the Lac Vieux Desert Band of Lake Superior Chippewa Indians
USGS science fere changing world
US DEPARTMENT OF THE INTERIOR
BRUCE BABBITT Secretary
US GEOLOGICAL SURVEY
Charles G Groat Director
For additional information write to
District Chief US Geological Survey WRD 6520 Mercantile Way Suite 5 Lansing MI 48911-5991
Copies of this report can be purchased from
US Geological Survey Branch of Information Services Box 25286 Denver CO 80225-0286
Contents
Page Abstract 1
Introduction 1
Description of the Lac Vieux Desert Study Area 1
Previous Studies 3
Ground Water 3
Aquifers in Glacial Deposits 3
Tritium Analyses for Determining Age of Ground Water 5
Ground-Water Levels 8
Water Quality 8
Surface Water 8
Water Levels in Lac Vieux Desert 8
Water Quality 10
Summary 15
References Cited 15
Figures
1 Map showing the Lac Vieux Desert study area and location of wells used for
this study 2
2 Map showing sampling locations for water quality on Lac Vieux Desert 4
3 Chart showing preliminary hydrogeologic section at Lac Vieux Desert 7
4 Graph showing water levels at Lac Vieux Desert 1913-95 11
Tables
1 Well data from drillers logs 6
2 Physical and chemical characteristics of water from wells near Lac Vieux
Desert and water quality standards for human consumption 9
3 Physical and chemical characteristics of water from three sites on Lac Vieux
Desert March 1996 12
4 Physical and chemical characteristics of water from ten sites on Lac Vieux
Desert October 1996 13
5 Physical characteristics of water in Lac Vieux Desert at five sites profiled
October 1996 14
CONVERSION FACTORS AND VERTICAL DATUM
CONVERSION FACTORS
Multiply
By To obtain
inch 254 millimeter foot (ft) 03048 meter mile (mi) 1609 kilometer foot per day (ftd) 03048 meter per day foot per second (fts) 3048 centimeter per second gallon per minute (gpm) 006309 liter per second
cubic foot (ft3) 002832 cubic meter million gallons per day (Mgald) 0003785 cubic meters per day
square foot (ft2) 009290 square meter
square mile (mil) 2590 square kilometer
VERTICAL DATUM In this report sea level refers to the National Geodetic Vertical Datum of 1929mdash a geodetic datum derived from a general adjustment of the first-order level nets of both the United States and Canada formerly called Sea Level Datum of 1929
ii
Water Resources of Lac Vieux Desert Indian Community and Vicinity Western Upper Peninsula Michigan
By Gary J Barton and
Norman G Grannemann
ABSTRACT
Lac Vieux Desert a 66 square-mile lake on the Michigan-Wisconsin border is the headwaters of the Wisconsin River The Lac Vieux Desert Band of Lake Superior Chippewa Indians have a number of homes and tribal property on the Lakes north shore Most drinking water is obtained from wells drilled in unconsolidated glacial deposits A gravel layer at or near the bedrock surface is the most proshyductive aquifer on tribal property
Water quality of Lac Vieux Desert is a conshycern for tribal members To assess general water-quality conditions water samples were collected at three sites on the lake in March 1996 and at 10 sites in October 1996 Profiles of pH dissolved oxygen specific conductance and temperature indicate that the lake is well mixed in the fall but not when the lake is ice covered in winter
Between 1913 and 1995 the minimum and maximum daily recorded lake levels were 167928 feet (in 1925) and 168216 feet (in 1951) above sea level Since the early 1950s the annual minimum lake-level has been lower and less variable than before the 1950s Although the level of Lac Vieux Desert is regshyulated historical levels show year-to-year flucshytuations that reflect transient changes in precipitation amounts
INTRODUCTION
The Lac Vieux Desert Band of Lake Supeshyrior Chippewa Indians rely on wells completed in glacial deposits to provide a reliable source of potable water for domestic and community uses Recently a number of Indian Community homes have been built on a parcel of land on the northern shore of Lac Vieux Desert which
is the name adopted by this Band and also the name for a natural lake near their community The homes have individual wells and septic systems
The water level of Lac Vieux Desert was twice raised several feet by construction modishyfication and operation of a dam on the lakes outlet A wooden dam was first constructed about 1870 to regulate flow for transporting logs down the Wisconsin River During 1937 the wooden dam was replaced with a concrete and steel structure and the lake level was raised to help control flow in the Wisconsin River for hydroelectric power production
Elevated water levels may have affected the lakes ability to sustain growth of wild rice which is important both culturally and as a food source for the Chippewa throughout the Great Lakes area The Lac Vieux Desert Indian Community requested that the USGS evaluate surface- and ground-water resources on and near Lac Vieux Desert to address ground-water quantity and quality for water supply and to characterize long-term lake-level fluctuations and lake water quality as factors that may be important for reintroduction of wild rice in the lake This report provides information about water quantity and quality at Lac Vieux Desert that may help the community make decisions about water-resource issues
Description of the Lac Vieux Desert Study Area
Lac Vieux Desert covers 66 square miles
(mi2) about half of which is in Gogebic County Michigan and half in Vilas County Wisconsin (fig 1) The lake and small tributarshyies to the lake are the headwaters of the Wisshyconsin River Water levels at the lake are about 1680 feet (ft) above sea level water depths average about 15 ft and range from about 5 ft in Rice Bay to about 30 ft in the south-central part of the lake A general comparison of the size and configuration of the lake before the first dam was constructed and the current size of the lake was made by comparing land plat survey maps drawn in 1852 and 1863 with curshyrent maps of the lake However the early surshyvey plat maps were not drawn with sufficient
1
ampP-5---- -
HO CI
p1 4-cr Base from US Geological Survey 124000 quadrangles
0 5000 FEET
EXPLANATION yr
Lac Vieux A A Hydrogeologic section Desert
Location and Identifierbull L1 of domestic well
MICHIGAN
Figure 1 Lac Vieux Desert study area and location of wells used for this study (See figure 3 for hydrogeologic section)
2
detail to make more than a general comparison Water levels of Lac Vieux Desert are regulated between a minimum level of 167937 and maximum level of 168153 ft above sea level (John Kaskey oral commun Lac Vieux Desert Dam Caretaker 1996)
Lac Vieux Desert drains a 344 mi2 watershyshed Marsh Bay Creek Misery Creek and Lobischer Creek flow into the lake (fig 1) Land-surface elevations in the watershed range from about 1680 to 1865 ft above sea level Inspection of US Geological Survey 75 minute topographic quadrangle maps indicate
that the watershed includes about 4 mi2 of wetlands and five smaller lakes
Land-surface features in the- Lac Vieux Desert watershed range from flat lying plains and wetlands to rolling hills These features are mostly the result of sediment deposition by continental glaciers that melted about 10000 years ago leaving debris as thick as 200 ft (Attig 1985 plate 1 and fig 1)
Flat-lying or gently sloping plains and some submerged areas along the south-central western and northern parts of the lake are underlain by stratified sand and gravel deposits (braided-stream sediment in plains) Wetlands and some submerged areas are capped with organic-rich sediments in areas bordering Misshyery Bay Rice Bay and Slaughter Bay the western lake shore the Indian Community land trust and extensive areas along Marsh Bay Misery and Lobischer Creeks These organic-rich sediments are generally underlain with sand and gravel and some clay
The landscape is primarily rolling in part due to drumlin landforms which are rounded hills that were shaped by glacial ice about 10000 years ago The drumlins consist of poorly stratified silty and clay-rich glacial sedshyiment and compact gravelly sandy till that forms a discontinuous cover over stratified sand and gravel The long axes of these hills are parallel to the direction of glacial ice moveshyment Drumlins are present primarily along the southern and eastern edges of the lake
Previous Studies
Attig (1985) reported on the Pleistocene geology of Vilas County Wisconsin Morey and others (1982) studied the bedrock geology of the Lake Superior region The US Natural Resource Commission (Lawrence Kerrey and David Hvizdak US Natural Resource Comshymission written commun 1995) and the US Forest Service (Sarah Mase US Forest Sershyvice written commun 1995) have mapped soil types at Lac Vieux Desert Doonan and Hendrickson (1968) described the groundshywater resources of Gogebic County Michigan Patterson (1989) reported on the water resources of Vilas County Wisconsin and samshypled three wells located less than one mile south and west of Lac Vieux Desert The Wisshyconsin Valley Improvement Company (WVIC) monitored the water quality of Lac Vieux Desert at site 5 (fig 2) during the spring sumshymer and fall of 1979-83 (Wisconsin Valley Improvement Company 1990)
GROUND WATER
Ground-water supplies in the Lac Vieux Desert watershed are obtained from wells drilled in Pleistocene glacial deposits that are underlain by quartzose metasedimentary rock granite and amphibolite all of Precambrian age (Morey and others 1982) Because bedshyrock in this area generally yields small quantishyties of water the top of bedrock is considered to be the base of the aquifer system
Aquifers in Glacial Deposits
Construction records for wells in the Lac Vieux Desert watershed indicate that all wells are screened above the bedrock surface (table 1) A hydrogeologic section for the northern shore of Lac Vieux Desert developed from information in seven drillers logs is shown in figure 3
Aquifers in the Lac Vieux Desert watershyshed chiefly comprise stream-deposited sand and gravel from 5 ft to tens of ft thick (fig 3) Confining layers of till and debris-flow sedishyment range from about 10 to 100 ft thick Conshyfining layers are commonly described in well
3
Base from Wisconsin Valley Improvement Company 0 5000 FEET I
8 EXPLANATION bull Sampling site location
and identifier
MICHIGAN
Figure 2 Sampling locations for water quality on Lac Vieux Desert
4
construction records as a hard pan clay or `hard clay and sometimes include boulders and fine sand (fig 3) Most wells in the area are screened in stream-deposited sand and gravel however a few wells may obtain small amounts of water from till and debris-flow sedshyiments Clay confining layers overlying sand and gravel aquifers were logged on 19 of the 29 well records listed in table 1 Most of these wells penetrate a multiple-aquifer system conshysisting of an upper water-table aquifer and a lower confmed aquifer(s) Moreover in most of these wells it is the confmed aquifer that yields the greatest amount of water A few wells may penetrate only a confmed aquifer Drillers logs for wells L4 L9 L10 L11 L13 L14 L16 L17 and L27 indicate that the deepshyest confmed aquifer is a discontinuous gravel layer that can yield water at rates as great as 30 gallons per minute (gpm) The upper surface of this gravel aquifer ranges from about 96 to 188 ft below land surface with a minimum thickshyness of 3 ft The maximum thickness reported in the well logs is 15 ft the maximum thickshyness of the aquifer is unknown however because the aquifer was not fully penetrated by any of the wells In some areas the gravel aquishyfer may be lying directly on the bedrock surshyface
Drillers logs indicate that sand lenses are present between 44 and 78 21 and 42 and 68 and 84 ft below land surface in wells L25 L28 and L29 respectively The bottom of well L25 is comprised of till and flow-debris sediment which is mostly hard clay This clay layer overshylies and probably confines a stream-deposited sand and gravel aquifer Well L27 (fig 3) which is about one mile west of the Indian Community is 120 ft deep and penetrates a sand and gravel aquifer at 50 to 60 ft and again at 106 to 120 ft below land surface
Hydraulic properties of the aquifers are needed to assist with delineating contributing areas for some wells near the Lake Patterson (1989 table 3) analyzed the geologic logs for two wells located near the southwestern shoreshyline and used slug-test data to calculate a horishyzontal hydraulic conductivity of about 17 ft per day (ftd) for sand and gravel and 008 ftd for sandy till The geometric means of the hydrau-
lic conductivities for slug-tests performed in 31 of 39 wells fmished in sand and gravel in Vilas County was calculated to be 24 ftd and for 10 wells fmished in silty and clayey till or debris-flow material was calculated to be 023 ftd (Patterson 1989 p 16) There are no reported aquifer tests at the Lac Vieux Desert Indian Village Community besides the well acceptance test reported in well construction records
Tritium Analyses for Determining Age of Ground Water
Tritium is a natural radioactive isotope of hydrogen that has a half-life of 123 years The concentration of tritium in a water sample can be used to determine if the water entered the ground-water system prior to the beginning of nuclear testing in the atmosphere in 1953 and thus help determine how readily precipitation enters the ground-water system The natural concentration of tritium in precipitation is about 5 tritium units (TU) however atmoshyspheric detonation of nuclear weapons added large quantities of tritium to precipitation durshying the 1950s and 1960s Tritium concentrashytions in ground water recharged before 1953 when the first hydrogen bomb was detonated generally are less than 2 TU Tritium concenshytrations less than 2 TU indicates that an aquifer is not recharged rapidly from precipitation at the land surface and is less vulnerable to conshytamination
Water samples from three wells at the Lac Vieux Desert Indian Community were anashylyzed for tritium The concentrations of tritium in water from wells L28 L29 and L30 were 197 202 and 225 TU respectively (table 2) which indicate that at least some of the water in the glacial aquifer at depths of about 80 ft deep was in contact with atmosphere within the last 40 years These tritium concentrations support the well-log data which indicate that the shallow aquifer is largely unconfined and thus recharged fairly rapidly because the till layer which has confming characteristics is discontinuous Water samples from the deeper aquifer which lies at depths greater than 106 ft below land surface were not tested but that
5
Table 1 Well data from drillers logs
[ft feet bls below land surface gpm gallons per minute T amp R Township and Range -- no data]
Well Depth Screened Static Pumped Pumping Well Well Number drilled interval water level water level rate diameter location
(ft bls) (ft bls) (ft bls) (ft bls) (gpm) (inches) (T amp R)
Ll 105 open 12 19 15 6 42N11E5 L2 43 40-43 10 15 15 6 42N11E5CD L3 43 40-43 7 30 18 6 42N11E5DD L4 178 open 15 150 6 6 42N11E6AC L5 48 20-48 flowing 48 25 6 42N11E8 L6 44 41-44 10 25 18 6 42N11E8DC L7 83 80-83 20 40 35 6 42N11E8CB L8 165 163-165 18 -- -- 6 42N11E8BB L9 155 151-155 120 125 15 4 42N11E13CC L10 191 open 112 123 17 6 42N11E13BD L11 145 140-145 60 64 30 6 42N11E13BB L12 98 94-98 30 80 7 6 42N11E14 L13 192 open 14 32 30 6 42N11E14 L14 103 99-103 -- 42 18 4 42N11E15 L15 116 106-116 87 103 5 6 42N11E15 L16 169 open 70 80 25 6 42N11E16BDD L17 125 open 60 65 10 6 42N11E16AC L18 123 open 15 20 15 4 42N11E17BB L19 87 83-87 55 60 10 6 42N11E23 L20 100 96-100 40 55 15 4 42N11E24 L21 105 101-105 5 30 15 4 43N39W1CB L22 128 124-128 22 28 15 4 43N39W2 L23 98 95-98 15 35 20 6 43N39W2BBD L24 72 68-72 15 32 10 4 43N39W2BB L25 80 67-77 26 65 12 6 43N38W5CA L26 49 44-49 18 20 10 6 43N38W6BC L27 120 open 35 40 10 6 43N38W7 L28 84 81-84 6 43N38W5DB L29 42 39-42 6 43N38W5CB L30 6 43N38W5CD
6
AL
TIT
UD
E
INFE
ET A
BO
VE
ME
AN
SEA
LEV
EL
A A
1700-L24
Land surface L25 L29 28
L22 L21 L26
V
et
NNN y
NN
G
al u
7$ o ) CI
1650-T ( T
G
1600- T
T
mdash 0
bullbullbullbull bullbullbullbullbullbullbullbullbullbullbullbullbullbullbullbullbullbullbullbullbullbullbullbullbullbullbullbullbullbullbullbullbullbullbullbullbullbullbullbullbullbullbull bull bull
1550 0 5000 FEET
0 1500 METERS
EXPLANATION L24 WELL IDENTIFIER
Lac Vieux WELL SCREEN Desert
G STREAM-DEPOSITED SAND AND GRAVEL T TILL AND DEBRIS-FLOW SEDIMENT
f7777 PRECAMBRIAN BEDROCK MICHIGAN V GROUND-WATER LEVEL MEASURED BY WELL DRILLER
UPON COMPLETION OF WELL
mdash mdash APPROXIMATE BOUNDARY OF HYDROGEOLOGIC LAYER
Figure 3 Preliminary hydrogeologic section at Lac Vieux Desert (Line of section shown in figure 1)
7
aquifer is likely to be under semi-confined or confined conditions and therefore may be less vulnerable to contamination from the surface than the shallower water-table aquifer
Ground-Water Levels
Ground-water levels in the Lac Vieux Desert watershed Vilas County range from about 1683 to 1705 ft above sea level and decrease toward Lac Vieux Desert (Patterson 1989 plate 1) The only available ground-water-level data for the Lac Vieux Desert watershed is that reported by water-well drillshyers (table 1) These measurements may not accurately reflect the actual depth to ground water Each measurement was made in a newly constructed well and the water level in the well may not have had sufficient time to equilishybrate with the water level in the surrounding aquifer
Depth-to-water ranges from above land surface at well L5 (flowing at time of installashytion) to 120 ft below land surface at well L9 Well L9 is not typical because it is located southeast of Lac Vieux Desert where land surshyface elevation can be nearly 200 ft higher than lake level and drumlins dominate the topograshyphy most other wells drilled in the watershed are near the lake Depth-to-water at well L25 at the Lac Vieux Desert Indian Community is 26 ft below land surface and water levels in neighboring wells L26 and L27 are 18 and 35 ft below land surface respectively Wells L26 and L27 are in relatively low-lying areas Water levels measured in wells on both sides of the state border and the fact that ground-water flow generally is toward topographically low lying areas indicates that ground water in the watershed generally flows toward and disshycharges into the lake or into creeks that disshycharge into the lake In the vicinity of the lakes outlet however a small ground-water outflow from the lake occurs
Water Quality
Samples were collected from two domestic wells at the Lac Vieux Desert Indian Commushynity on March 19 and 21 1996 (wells L28 and
L29) and from a well at the Pow Wow Center (well L30) on October 10 1996 These three wells are believed to be similar to wells comshypleted in the shallow aquifer near Indian trust land In order to avoid contamination of water samples the sampling was conducted using ultraclean procedures and quality-control samshyples described by Koterba and others (1995) The samples were analyzed for common ions nutrients and some trace metals The physical and chemical characteristics of the samples are similar to those reported by Patterson (1989) Water from wells L28 L29 and L30 is modershyately alkaline and has low concentrations of iron however the water is moderately hard Calcium and bicarbonate are the major disshysolved constituents in the ground water Conshycentrations of nitrite and nitrate total mercury and total lead are below the USEPAs primary Maximum Contaminant Level (MCL) for these dissolved constituents
Concentrations of sulfate chloride iron and manganese in ground water are below the secondary MCL action levels The concentrashytion of copper in water from well L29 (210 micrograms per liter (ugL)) is considerably higher than concentrations in water from nearby well L28 (lt10 ugL) but still considershyably less than the USEPAs secondary MCL of 1300 ugL Because the water sample for well L29 was collected from a tap at a residence the source of copper may be the dwellings plumbshying
SURFACE WATER
Water Levels in Lake Vieux Desert
During 1913-28 lake-level measurements were made approximately weekly and since 1929 lake levels have been recorded daily by WVIC (Sam Morgan Wisconsin Valley Improvement Company 1995) (fig 4) In addishytion lake levels were monitored by the US Geological Survey during 1973-91
During the period of record the average lake level was 16805 ft above sea level The minimum and maximum observed lake level is 167928 and 168216 ft above sea level on September 19 1925 and May 5-6 1951
8
Table 2 Physical and chemical characteristics of water from wells near Lac Vieux Desert and water-quality standards for human consumption
[Concentrations are in milligrams per liter unless otherwise noted drinking-water standards are US Environmental Protection Agency (USEPA) Primary or Secondary Standards analyses by US Geological Survey except for tritium in water of wells 28 and 29 which were by University of Waterloo Environmental Isotope Laboratory -- not analyzed lt actual value is less than value shown]
USEPA drinking water Well Well Well Equip-
Physical characteristic or stand- 28 29 30 ment water-quality constituent and blank
Date of sample 31996 32196 101096 --
Well depth (feet below land surface) 84 42
Specific conductance field 144 137 149 (microsiemens per centimeter at 25 degrees Celsius)
pH field (standard units) 65-85 77 81 81
Hardness total (as CaCO3) 71 64 72
Calcium dissolved 20 18 20
Magnesium dissolved 52 47 53
Sodium dissolved 21 21 24
Potassium dissolved 08
Bicarbonate (as HCO3) 81 73
Sulfate dissolved 250a 64 66 81
Chloride dissolved 250a 03 07 05
Alkalinity field (as CaCO3) 66 60
Nitrogen dissolved (as N) 20 02 05
Nitrogen nitrite dissolved (as N) l b lt001 lt001 003
Nitrogen nitrate dissolved (as N) 10b 029 023
Phosphorus total 006 003 002
Arsenic total (micrograms per liter) 50b 1 3 lt1
Copper total (micrograms per liter) 1300a lt10 210 lt10
Iron dissolved (micrograms per liter) 300a 14 24 9
Lead total (micrograms per liter) 15b lt1 lt1 lt1
Manganese total (micrograms per liter) lt10 lt10 lt10
Manganese dissolved (micrograms per liter) 50a lt1
Mercury total (micrograms per liter) 2b lt01 lt01 lt01
Tritium total (tritium units) 197 202 225
a USEPA Secondary Maximum Contaminant Level for drinking water
b USEPA Maximum Contaminant Level for drinking water
9
respectively On three occasions the annual average lake level (fig 4) increased more than one foot over a one or two year period During 1918-19 and 1925-26 the average lake level rose 12 ft during 1949-51 it rose nearly 15 ft After each of these rising water events water levels receded considerably slower than the rate at which water levels rose
Between 1913 and 1950 the annual minishymum lake level was greater than 168000 ft above sea level 6 times since 1950 the annual minimum levels were slightly lower ranging from 167937 to 167980 ft above sea level (fig 4) Between 1913-50 the average lake level was about 16807 ft from 1950 to 1995 the average lake level was about 16803 ft above sea level Similarly the maximum lake levels from 1913 to 1950 averaged about 16815 ft from 1950-1995 they averaged about 16813 ft
Although the lake level of Lac Vieux Desert is regulated the annual lake-level flucshytuations reflect changes in annual precipitation amounts For example lake-level declines occurred for the drought periods of 1918 1925 1932 1948 1958 1963 1976 and 1988-89 Precipitation was below average durshying these periods In 1963 and 1976 precipitashytion was 8 and 14 inches below average respectively High lake levels occurred in 1919-22 1926-28 1938-39 1951-53 1960 and 1983 (fig 4) The correlation between high annual maximum lake levels and above avershyage amounts of precipitation is more consistent after 1950 than from 1913-50
Water Quality
During March 1996 water samples were collected at sites 3 4 and 5 on ice covered Lac Vieux Desert (fig 2) Water samples were colshylected 2 ft below the base of the lake ice These water samples were analyzed for nutrients pH and specific conductance (table 3) Attempts were made to collect samples at sites 1 and 2 in Rice Bay however at both locations the lake ice was greater than 3 ft thick and nearly in contact with the lake bottom Site 5 is located near the deepest area of the lake where WVIC previously monitored water quality
At sites 1 2 and 3 a strong organic odor was detected indicating reduced oxygen conshyditions under the ice During October 1996 additional samples were collected at 10 sites on Lac Vieux Desert (table 4) Reducing condishytions were not evident during the fall sampling period when dissolved oxygen concentrations ranged from 64 to 94 mgL (milligrams per liter) Profiles of temperature pH dissolved oxygen and specific conductance are illusshytrated in table 5 for 5 of the 10 sites Water depths at the remaining 5 sites were too shalshylow to collect profiles Specific conductance and temperature data from these profiles also indicate that water in the lake is well mixed in the fall
WVIC monitored water temperature and dissolved oxygen in the inflow and outflow at the Lac Vieux Desert dam and at site 5 (fig 2) on a bimonthly basis during the 1970 to 1989 Temperature of the inflow at the dam ranged
from 02 degrees Celsius (degC) on December
13 1983 to 252 degC on June 24 1987 and disshysolved oxygen ranged from 31 mgL on March 29 1988 to 140 mgL on December 20 1988 Temperature of the outflow at the dam ranged
from 03 degC on November 11 1983 to 257 degC on July 22 1988 and dissolved oxygen ranged from 36 mgL on April 14 1982 to 144 mgL on December 20 1988 At site 5 dissolved oxygen at a 66 ft sampling depth ranged from 18 mgL on March 5 1980 and February 13 1981 to 115 mgL on April 29 1980 and May 17 1983 Water temperature at this site and
depth ranged from 38 degC on March 5 1980 to
237 degC on July 28 1982 and July 27 1983 WVIC also analyzed for nitrate plus nitrite
concentrations and pH in water from site 5 Sampling depth ranged from about 31 to 384 ft below lake surface Concentrations of nitrite plus nitrate ranged from 003 to 018 mgL The average summer and fall pH were similar at 69 and 71 units
Comparison of the water-quality data in tables 3 and 4 illustrate the differences between quality of water in the lake during fall and winshyter Specific conductance during fall was about 67 microsiemens per centimeter (microScm) dur-
10
ALTI
TUD
EIN
FEE
T AB
OV
ESE
ALE
VEL
165250
mdashIN--Annual Average Lake Level mdash 4 mdash Annual Moimum Lake Level mdash i mdash Annual Minimum Lake Level
168200 -
1 I
bull168110 -
4t I1 I 11 1 4 4168100 -
I I 1 1 bull
168050 - I1i II I
I I I 4
t I A I11 I 1 I 4 i 1 II 1
t I bullA bull I i i 1 I
168000 - II I i I 1 1 1 t
1 I Ili IA l I I 1 1 1 11 +A t 5 1 fiiAbull i 1 Ark I I _ LILI A 1 4 Ilk 14 lsquoi 1 1 bull bull A i l i bull i ik A ea I i A il I 1 I i 4 A lbull 167950 - 1 n 11 11 1 1 t i 1 I la 111 I a A
AR Ai bull ikbullbullbullbullbull1 Vi1 i A hi z IA bull
167900 1910 1920 1930 1940 1950 1960 1970 1980 1990 200X
Figure 4 Water levels at Lac Vieux Desert 1913-95
11
Table 3 Physical and chemical characteristics of water from three sites on Lac Vieux Desert March 1996
[Concentrations are in milligrams per liter unless otherwise noted analyses by US Geological Survey lt actual value is less than value shown samples collected on March 20-21 1996]
Physical characteristic or
water-quality constituent Site 3 Site 4 Site 5
Specific conductance field
(microsiemens per centimeter at 25 degrees Celsius) 122 109 103
pH field (standard units) 70 70 71
Alkalinity (as CaCO3) 55 49 46
Nitrogen dissolved (as N) 09 06 07
Nitrogen nitrite dissolved (as N) 01 lt01 lt01
Nitrogen nitrate dissolved (as N) 07 23 34
Phosphorus total (as P) 17 02 03
12
Table 4 Physical and chemical characteristics of water from ten sites on Lac Vieux Desert October 1996
[Concentrations are in milligrams per liter unless otherwise noted analyses by US Geological Survey -- not analyzed lt actual value is less than value shown samples collected on October 8-9 1996]
Physical characteristic or water-quality constituent Site 1 Site 2 Site 3 Site 4 Site 5 Site 6 Site 7 Site 8 Site 9 Site 10
Specific conductance field (microsiemens per centimeter 67 67 67 67 66 67 67 68 67 67 at 25 degrees Celsius)
pH field (standard units) 76 76 74 72 74 76 87 75 76 73
Alkalinity (as CaCO3) 33 34 33 33 33 33 34 33 34 33
Nitrogen dissolved (as N) 05 lt01 02 02 04 lt01 04 02 lt01 02
Nitrogen nitrite dissolved (as N) 03 03 02 03 04 02 02 02 03 02
Phosphorus total (as P) lt01 01 lt01 lt01 lt01 lt01 lt01 01 lt01 lt01
Phosphorus dissolved (as P) lt01 lt01 lt01 02 lt01 lt01 lt01 lt01 lt01 lt01
Phosphorus ortho dissolved (as P) lt01 lt01 lt01 lt01 lt01 lt01 lt01 lt01 lt01
13
Table 5 Physical characteristics of water in Lac Vieux Desert at five sites
profiled October 1996
[mgL milligrams per liter microScm microsiemens per centimeter at 25 degrees Celsius]
Depth below pH Oxygen Specific Temperature lake surface field dissolved conductance (degrees
(feet) (units) (mgL) (microScm) Celsius)
Site 3
2 74 94 67 101 4 73 94 67 100 6 73 93 67 98 8 73 91 67 96 10 73 93 67 95 11 73 93 67 95
Site 4
2 72 86 67 100 4 72 85 67 97 6 72 85 67 97 8 73 85 67 97 10 72 85 67 97
Site 5
2 74 87 66 100 4 74 87 66 98 6 74 87 66 98 8 74 87 66 97 10 74 87 66 97 12 74 87 66 97 14 74 87 66 96 16 74 87 66 96 18 74 86 66 96 20 74 86 66 96 22 74 85 66 96 24 74 84 66 96 26 73 79 66 96 28 72 64 66 96
Site 9
2 75 85 68 96 4 75 85 68 96 6 76 84 67 96
Site 10
2 73 88 67 97 4 73 90 67 97 6 73 87 67 97 8 73 87 67 96 10 73 87 67 96 12 73 84 67 96
14
ing winter it ranged from 103 to 122 microScm Likewise alkalinity nitrogen and phosphorus were all less in samples collected in fall than those collected in the winter However greater concentrations of nitrite were detected in samshyples collected in fall compared to the winter samples
SUMMARY
All ground-water supplies in the Lac Vieux Desert watershed are obtained from wells drilled in Pleistocene glacial deposits Analysis of well data indicates that a gravel layer near the bedrock surface is a highly productive aquifer
None of the constituents measured in samshyples collected from three wells at the Lac Vieux Desert Indian Community exceed Maxishymum Contaminant Levels Calcium and bicarshybonate are the major dissolved constituents in the ground water
During March 1996 surface-water samples were collected at three sites on ice covered Lac Vieux Desert During October 1996 samples were collected at 10 sites on the lake Profiles of pH dissolved oxygen specific conductance and temperature indicate that the lake is well mixed in the fall but not in winter when the lake was ice covered
During 1913-95 the minimum and maxishymum daily recorded lake level was 167928 and 168216 ft above sea level on May 17 and 18 1925 and September 24 1951 respectively Since the early 1950s the annual minimum lake-level was lower and less variable During the period of record the average lake level is 16805 ft above sea level There have been three events where the annual average lake level has increased more than one foot over a one or two year period During 1918-19 and 1925-26 the average lake level rose 12 ft and during 1949-51 water levels rose nearly 15 ft Water levels receded slower than they rose after all 3 of these events
Although the lake level of Lac Vieux Desert is regulated historical levels show yearshyto-year fluctuations that reflect transient changes in precipitation amounts These historshyical water-level trends are similar to trends in
annual precipitation amounts however they correlate better after 1950 than before
REFERENCES CITED
Attig John W 1985 Pleistocene Geology of Vilas County Wisconsin Wisconsin Geological and Natural History Survey Information Cirshycular 50 32 p
Doonan CJ and Hendrickson GE 1968 Ground water in Gogebic County Michigan Michishygan Geological Survey Water Investigation 8 22 p
Koterba KT Wilde FD and Lapham WW Ground-water data collection protocols and procedures for the national water-quality assessment program collection and docushymentation of water-quality samples and related data US Geological Survey Open-File Report 95-399 113 p
Morey GB Sims PK Cannon WF Mudrey MG Jr and Southwick DL 1982 Geoshylogic map of the Lake Superior Region Minshynesota Wisconsin and northern Michigan (bedrock) Minnesota Geological Survey
Patterson GL 1989 Water Resources of Vilas County Wisconsin University of Wisconsin-Extension Geological and Natural History Survey Miscellaneous Paper 89-1 46 p
US Environmental Protection Agency 1991 Wellshyhead protection strategies for confined-aquishyfer settings Washington D C Office of Ground Water Protection variously pagishynated
Wisconsin Valley Improvement Company 1990 WVIC water quality monitoring data volume I Natural-lake reservoirs Wisconsin Valley Improvement Company Wausau Wisshyconsin variously paginated
15

Water Resources of Lac Vieux Desert Indian Community and Vicinity Western Upper Peninsula Michigan
By Gary J Barton and Norman G Grannemann
US Department of the Interior US Geological Survey Water-Resources Investigations Report 98-4051
Prepared in cooperation with the Lac Vieux Desert Band of Lake Superior Chippewa Indians
USGS science fere changing world
US DEPARTMENT OF THE INTERIOR
BRUCE BABBITT Secretary
US GEOLOGICAL SURVEY
Charles G Groat Director
For additional information write to
District Chief US Geological Survey WRD 6520 Mercantile Way Suite 5 Lansing MI 48911-5991
Copies of this report can be purchased from
US Geological Survey Branch of Information Services Box 25286 Denver CO 80225-0286
Contents
Page Abstract 1
Introduction 1
Description of the Lac Vieux Desert Study Area 1
Previous Studies 3
Ground Water 3
Aquifers in Glacial Deposits 3
Tritium Analyses for Determining Age of Ground Water 5
Ground-Water Levels 8
Water Quality 8
Surface Water 8
Water Levels in Lac Vieux Desert 8
Water Quality 10
Summary 15
References Cited 15
Figures
1 Map showing the Lac Vieux Desert study area and location of wells used for
this study 2
2 Map showing sampling locations for water quality on Lac Vieux Desert 4
3 Chart showing preliminary hydrogeologic section at Lac Vieux Desert 7
4 Graph showing water levels at Lac Vieux Desert 1913-95 11
Tables
1 Well data from drillers logs 6
2 Physical and chemical characteristics of water from wells near Lac Vieux
Desert and water quality standards for human consumption 9
3 Physical and chemical characteristics of water from three sites on Lac Vieux
Desert March 1996 12
4 Physical and chemical characteristics of water from ten sites on Lac Vieux
Desert October 1996 13
5 Physical characteristics of water in Lac Vieux Desert at five sites profiled
October 1996 14
CONVERSION FACTORS AND VERTICAL DATUM
CONVERSION FACTORS
Multiply
By To obtain
inch 254 millimeter foot (ft) 03048 meter mile (mi) 1609 kilometer foot per day (ftd) 03048 meter per day foot per second (fts) 3048 centimeter per second gallon per minute (gpm) 006309 liter per second
cubic foot (ft3) 002832 cubic meter million gallons per day (Mgald) 0003785 cubic meters per day
square foot (ft2) 009290 square meter
square mile (mil) 2590 square kilometer
VERTICAL DATUM In this report sea level refers to the National Geodetic Vertical Datum of 1929mdash a geodetic datum derived from a general adjustment of the first-order level nets of both the United States and Canada formerly called Sea Level Datum of 1929
ii
Water Resources of Lac Vieux Desert Indian Community and Vicinity Western Upper Peninsula Michigan
By Gary J Barton and
Norman G Grannemann
ABSTRACT
Lac Vieux Desert a 66 square-mile lake on the Michigan-Wisconsin border is the headwaters of the Wisconsin River The Lac Vieux Desert Band of Lake Superior Chippewa Indians have a number of homes and tribal property on the Lakes north shore Most drinking water is obtained from wells drilled in unconsolidated glacial deposits A gravel layer at or near the bedrock surface is the most proshyductive aquifer on tribal property
Water quality of Lac Vieux Desert is a conshycern for tribal members To assess general water-quality conditions water samples were collected at three sites on the lake in March 1996 and at 10 sites in October 1996 Profiles of pH dissolved oxygen specific conductance and temperature indicate that the lake is well mixed in the fall but not when the lake is ice covered in winter
Between 1913 and 1995 the minimum and maximum daily recorded lake levels were 167928 feet (in 1925) and 168216 feet (in 1951) above sea level Since the early 1950s the annual minimum lake-level has been lower and less variable than before the 1950s Although the level of Lac Vieux Desert is regshyulated historical levels show year-to-year flucshytuations that reflect transient changes in precipitation amounts
INTRODUCTION
The Lac Vieux Desert Band of Lake Supeshyrior Chippewa Indians rely on wells completed in glacial deposits to provide a reliable source of potable water for domestic and community uses Recently a number of Indian Community homes have been built on a parcel of land on the northern shore of Lac Vieux Desert which
is the name adopted by this Band and also the name for a natural lake near their community The homes have individual wells and septic systems
The water level of Lac Vieux Desert was twice raised several feet by construction modishyfication and operation of a dam on the lakes outlet A wooden dam was first constructed about 1870 to regulate flow for transporting logs down the Wisconsin River During 1937 the wooden dam was replaced with a concrete and steel structure and the lake level was raised to help control flow in the Wisconsin River for hydroelectric power production
Elevated water levels may have affected the lakes ability to sustain growth of wild rice which is important both culturally and as a food source for the Chippewa throughout the Great Lakes area The Lac Vieux Desert Indian Community requested that the USGS evaluate surface- and ground-water resources on and near Lac Vieux Desert to address ground-water quantity and quality for water supply and to characterize long-term lake-level fluctuations and lake water quality as factors that may be important for reintroduction of wild rice in the lake This report provides information about water quantity and quality at Lac Vieux Desert that may help the community make decisions about water-resource issues
Description of the Lac Vieux Desert Study Area
Lac Vieux Desert covers 66 square miles
(mi2) about half of which is in Gogebic County Michigan and half in Vilas County Wisconsin (fig 1) The lake and small tributarshyies to the lake are the headwaters of the Wisshyconsin River Water levels at the lake are about 1680 feet (ft) above sea level water depths average about 15 ft and range from about 5 ft in Rice Bay to about 30 ft in the south-central part of the lake A general comparison of the size and configuration of the lake before the first dam was constructed and the current size of the lake was made by comparing land plat survey maps drawn in 1852 and 1863 with curshyrent maps of the lake However the early surshyvey plat maps were not drawn with sufficient
1
ampP-5---- -
HO CI
p1 4-cr Base from US Geological Survey 124000 quadrangles
0 5000 FEET
EXPLANATION yr
Lac Vieux A A Hydrogeologic section Desert
Location and Identifierbull L1 of domestic well
MICHIGAN
Figure 1 Lac Vieux Desert study area and location of wells used for this study (See figure 3 for hydrogeologic section)
2
detail to make more than a general comparison Water levels of Lac Vieux Desert are regulated between a minimum level of 167937 and maximum level of 168153 ft above sea level (John Kaskey oral commun Lac Vieux Desert Dam Caretaker 1996)
Lac Vieux Desert drains a 344 mi2 watershyshed Marsh Bay Creek Misery Creek and Lobischer Creek flow into the lake (fig 1) Land-surface elevations in the watershed range from about 1680 to 1865 ft above sea level Inspection of US Geological Survey 75 minute topographic quadrangle maps indicate
that the watershed includes about 4 mi2 of wetlands and five smaller lakes
Land-surface features in the- Lac Vieux Desert watershed range from flat lying plains and wetlands to rolling hills These features are mostly the result of sediment deposition by continental glaciers that melted about 10000 years ago leaving debris as thick as 200 ft (Attig 1985 plate 1 and fig 1)
Flat-lying or gently sloping plains and some submerged areas along the south-central western and northern parts of the lake are underlain by stratified sand and gravel deposits (braided-stream sediment in plains) Wetlands and some submerged areas are capped with organic-rich sediments in areas bordering Misshyery Bay Rice Bay and Slaughter Bay the western lake shore the Indian Community land trust and extensive areas along Marsh Bay Misery and Lobischer Creeks These organic-rich sediments are generally underlain with sand and gravel and some clay
The landscape is primarily rolling in part due to drumlin landforms which are rounded hills that were shaped by glacial ice about 10000 years ago The drumlins consist of poorly stratified silty and clay-rich glacial sedshyiment and compact gravelly sandy till that forms a discontinuous cover over stratified sand and gravel The long axes of these hills are parallel to the direction of glacial ice moveshyment Drumlins are present primarily along the southern and eastern edges of the lake
Previous Studies
Attig (1985) reported on the Pleistocene geology of Vilas County Wisconsin Morey and others (1982) studied the bedrock geology of the Lake Superior region The US Natural Resource Commission (Lawrence Kerrey and David Hvizdak US Natural Resource Comshymission written commun 1995) and the US Forest Service (Sarah Mase US Forest Sershyvice written commun 1995) have mapped soil types at Lac Vieux Desert Doonan and Hendrickson (1968) described the groundshywater resources of Gogebic County Michigan Patterson (1989) reported on the water resources of Vilas County Wisconsin and samshypled three wells located less than one mile south and west of Lac Vieux Desert The Wisshyconsin Valley Improvement Company (WVIC) monitored the water quality of Lac Vieux Desert at site 5 (fig 2) during the spring sumshymer and fall of 1979-83 (Wisconsin Valley Improvement Company 1990)
GROUND WATER
Ground-water supplies in the Lac Vieux Desert watershed are obtained from wells drilled in Pleistocene glacial deposits that are underlain by quartzose metasedimentary rock granite and amphibolite all of Precambrian age (Morey and others 1982) Because bedshyrock in this area generally yields small quantishyties of water the top of bedrock is considered to be the base of the aquifer system
Aquifers in Glacial Deposits
Construction records for wells in the Lac Vieux Desert watershed indicate that all wells are screened above the bedrock surface (table 1) A hydrogeologic section for the northern shore of Lac Vieux Desert developed from information in seven drillers logs is shown in figure 3
Aquifers in the Lac Vieux Desert watershyshed chiefly comprise stream-deposited sand and gravel from 5 ft to tens of ft thick (fig 3) Confining layers of till and debris-flow sedishyment range from about 10 to 100 ft thick Conshyfining layers are commonly described in well
3
Base from Wisconsin Valley Improvement Company 0 5000 FEET I
8 EXPLANATION bull Sampling site location
and identifier
MICHIGAN
Figure 2 Sampling locations for water quality on Lac Vieux Desert
4
construction records as a hard pan clay or `hard clay and sometimes include boulders and fine sand (fig 3) Most wells in the area are screened in stream-deposited sand and gravel however a few wells may obtain small amounts of water from till and debris-flow sedshyiments Clay confining layers overlying sand and gravel aquifers were logged on 19 of the 29 well records listed in table 1 Most of these wells penetrate a multiple-aquifer system conshysisting of an upper water-table aquifer and a lower confmed aquifer(s) Moreover in most of these wells it is the confmed aquifer that yields the greatest amount of water A few wells may penetrate only a confmed aquifer Drillers logs for wells L4 L9 L10 L11 L13 L14 L16 L17 and L27 indicate that the deepshyest confmed aquifer is a discontinuous gravel layer that can yield water at rates as great as 30 gallons per minute (gpm) The upper surface of this gravel aquifer ranges from about 96 to 188 ft below land surface with a minimum thickshyness of 3 ft The maximum thickness reported in the well logs is 15 ft the maximum thickshyness of the aquifer is unknown however because the aquifer was not fully penetrated by any of the wells In some areas the gravel aquishyfer may be lying directly on the bedrock surshyface
Drillers logs indicate that sand lenses are present between 44 and 78 21 and 42 and 68 and 84 ft below land surface in wells L25 L28 and L29 respectively The bottom of well L25 is comprised of till and flow-debris sediment which is mostly hard clay This clay layer overshylies and probably confines a stream-deposited sand and gravel aquifer Well L27 (fig 3) which is about one mile west of the Indian Community is 120 ft deep and penetrates a sand and gravel aquifer at 50 to 60 ft and again at 106 to 120 ft below land surface
Hydraulic properties of the aquifers are needed to assist with delineating contributing areas for some wells near the Lake Patterson (1989 table 3) analyzed the geologic logs for two wells located near the southwestern shoreshyline and used slug-test data to calculate a horishyzontal hydraulic conductivity of about 17 ft per day (ftd) for sand and gravel and 008 ftd for sandy till The geometric means of the hydrau-
lic conductivities for slug-tests performed in 31 of 39 wells fmished in sand and gravel in Vilas County was calculated to be 24 ftd and for 10 wells fmished in silty and clayey till or debris-flow material was calculated to be 023 ftd (Patterson 1989 p 16) There are no reported aquifer tests at the Lac Vieux Desert Indian Village Community besides the well acceptance test reported in well construction records
Tritium Analyses for Determining Age of Ground Water
Tritium is a natural radioactive isotope of hydrogen that has a half-life of 123 years The concentration of tritium in a water sample can be used to determine if the water entered the ground-water system prior to the beginning of nuclear testing in the atmosphere in 1953 and thus help determine how readily precipitation enters the ground-water system The natural concentration of tritium in precipitation is about 5 tritium units (TU) however atmoshyspheric detonation of nuclear weapons added large quantities of tritium to precipitation durshying the 1950s and 1960s Tritium concentrashytions in ground water recharged before 1953 when the first hydrogen bomb was detonated generally are less than 2 TU Tritium concenshytrations less than 2 TU indicates that an aquifer is not recharged rapidly from precipitation at the land surface and is less vulnerable to conshytamination
Water samples from three wells at the Lac Vieux Desert Indian Community were anashylyzed for tritium The concentrations of tritium in water from wells L28 L29 and L30 were 197 202 and 225 TU respectively (table 2) which indicate that at least some of the water in the glacial aquifer at depths of about 80 ft deep was in contact with atmosphere within the last 40 years These tritium concentrations support the well-log data which indicate that the shallow aquifer is largely unconfined and thus recharged fairly rapidly because the till layer which has confming characteristics is discontinuous Water samples from the deeper aquifer which lies at depths greater than 106 ft below land surface were not tested but that
5
Table 1 Well data from drillers logs
[ft feet bls below land surface gpm gallons per minute T amp R Township and Range -- no data]
Well Depth Screened Static Pumped Pumping Well Well Number drilled interval water level water level rate diameter location
(ft bls) (ft bls) (ft bls) (ft bls) (gpm) (inches) (T amp R)
Ll 105 open 12 19 15 6 42N11E5 L2 43 40-43 10 15 15 6 42N11E5CD L3 43 40-43 7 30 18 6 42N11E5DD L4 178 open 15 150 6 6 42N11E6AC L5 48 20-48 flowing 48 25 6 42N11E8 L6 44 41-44 10 25 18 6 42N11E8DC L7 83 80-83 20 40 35 6 42N11E8CB L8 165 163-165 18 -- -- 6 42N11E8BB L9 155 151-155 120 125 15 4 42N11E13CC L10 191 open 112 123 17 6 42N11E13BD L11 145 140-145 60 64 30 6 42N11E13BB L12 98 94-98 30 80 7 6 42N11E14 L13 192 open 14 32 30 6 42N11E14 L14 103 99-103 -- 42 18 4 42N11E15 L15 116 106-116 87 103 5 6 42N11E15 L16 169 open 70 80 25 6 42N11E16BDD L17 125 open 60 65 10 6 42N11E16AC L18 123 open 15 20 15 4 42N11E17BB L19 87 83-87 55 60 10 6 42N11E23 L20 100 96-100 40 55 15 4 42N11E24 L21 105 101-105 5 30 15 4 43N39W1CB L22 128 124-128 22 28 15 4 43N39W2 L23 98 95-98 15 35 20 6 43N39W2BBD L24 72 68-72 15 32 10 4 43N39W2BB L25 80 67-77 26 65 12 6 43N38W5CA L26 49 44-49 18 20 10 6 43N38W6BC L27 120 open 35 40 10 6 43N38W7 L28 84 81-84 6 43N38W5DB L29 42 39-42 6 43N38W5CB L30 6 43N38W5CD
6
AL
TIT
UD
E
INFE
ET A
BO
VE
ME
AN
SEA
LEV
EL
A A
1700-L24
Land surface L25 L29 28
L22 L21 L26
V
et
NNN y
NN
G
al u
7$ o ) CI
1650-T ( T
G
1600- T
T
mdash 0
bullbullbullbull bullbullbullbullbullbullbullbullbullbullbullbullbullbullbullbullbullbullbullbullbullbullbullbullbullbullbullbullbullbullbullbullbullbullbullbullbullbullbullbullbullbullbull bull bull
1550 0 5000 FEET
0 1500 METERS
EXPLANATION L24 WELL IDENTIFIER
Lac Vieux WELL SCREEN Desert
G STREAM-DEPOSITED SAND AND GRAVEL T TILL AND DEBRIS-FLOW SEDIMENT
f7777 PRECAMBRIAN BEDROCK MICHIGAN V GROUND-WATER LEVEL MEASURED BY WELL DRILLER
UPON COMPLETION OF WELL
mdash mdash APPROXIMATE BOUNDARY OF HYDROGEOLOGIC LAYER
Figure 3 Preliminary hydrogeologic section at Lac Vieux Desert (Line of section shown in figure 1)
7
aquifer is likely to be under semi-confined or confined conditions and therefore may be less vulnerable to contamination from the surface than the shallower water-table aquifer
Ground-Water Levels
Ground-water levels in the Lac Vieux Desert watershed Vilas County range from about 1683 to 1705 ft above sea level and decrease toward Lac Vieux Desert (Patterson 1989 plate 1) The only available ground-water-level data for the Lac Vieux Desert watershed is that reported by water-well drillshyers (table 1) These measurements may not accurately reflect the actual depth to ground water Each measurement was made in a newly constructed well and the water level in the well may not have had sufficient time to equilishybrate with the water level in the surrounding aquifer
Depth-to-water ranges from above land surface at well L5 (flowing at time of installashytion) to 120 ft below land surface at well L9 Well L9 is not typical because it is located southeast of Lac Vieux Desert where land surshyface elevation can be nearly 200 ft higher than lake level and drumlins dominate the topograshyphy most other wells drilled in the watershed are near the lake Depth-to-water at well L25 at the Lac Vieux Desert Indian Community is 26 ft below land surface and water levels in neighboring wells L26 and L27 are 18 and 35 ft below land surface respectively Wells L26 and L27 are in relatively low-lying areas Water levels measured in wells on both sides of the state border and the fact that ground-water flow generally is toward topographically low lying areas indicates that ground water in the watershed generally flows toward and disshycharges into the lake or into creeks that disshycharge into the lake In the vicinity of the lakes outlet however a small ground-water outflow from the lake occurs
Water Quality
Samples were collected from two domestic wells at the Lac Vieux Desert Indian Commushynity on March 19 and 21 1996 (wells L28 and
L29) and from a well at the Pow Wow Center (well L30) on October 10 1996 These three wells are believed to be similar to wells comshypleted in the shallow aquifer near Indian trust land In order to avoid contamination of water samples the sampling was conducted using ultraclean procedures and quality-control samshyples described by Koterba and others (1995) The samples were analyzed for common ions nutrients and some trace metals The physical and chemical characteristics of the samples are similar to those reported by Patterson (1989) Water from wells L28 L29 and L30 is modershyately alkaline and has low concentrations of iron however the water is moderately hard Calcium and bicarbonate are the major disshysolved constituents in the ground water Conshycentrations of nitrite and nitrate total mercury and total lead are below the USEPAs primary Maximum Contaminant Level (MCL) for these dissolved constituents
Concentrations of sulfate chloride iron and manganese in ground water are below the secondary MCL action levels The concentrashytion of copper in water from well L29 (210 micrograms per liter (ugL)) is considerably higher than concentrations in water from nearby well L28 (lt10 ugL) but still considershyably less than the USEPAs secondary MCL of 1300 ugL Because the water sample for well L29 was collected from a tap at a residence the source of copper may be the dwellings plumbshying
SURFACE WATER
Water Levels in Lake Vieux Desert
During 1913-28 lake-level measurements were made approximately weekly and since 1929 lake levels have been recorded daily by WVIC (Sam Morgan Wisconsin Valley Improvement Company 1995) (fig 4) In addishytion lake levels were monitored by the US Geological Survey during 1973-91
During the period of record the average lake level was 16805 ft above sea level The minimum and maximum observed lake level is 167928 and 168216 ft above sea level on September 19 1925 and May 5-6 1951
8
Table 2 Physical and chemical characteristics of water from wells near Lac Vieux Desert and water-quality standards for human consumption
[Concentrations are in milligrams per liter unless otherwise noted drinking-water standards are US Environmental Protection Agency (USEPA) Primary or Secondary Standards analyses by US Geological Survey except for tritium in water of wells 28 and 29 which were by University of Waterloo Environmental Isotope Laboratory -- not analyzed lt actual value is less than value shown]
USEPA drinking water Well Well Well Equip-
Physical characteristic or stand- 28 29 30 ment water-quality constituent and blank
Date of sample 31996 32196 101096 --
Well depth (feet below land surface) 84 42
Specific conductance field 144 137 149 (microsiemens per centimeter at 25 degrees Celsius)
pH field (standard units) 65-85 77 81 81
Hardness total (as CaCO3) 71 64 72
Calcium dissolved 20 18 20
Magnesium dissolved 52 47 53
Sodium dissolved 21 21 24
Potassium dissolved 08
Bicarbonate (as HCO3) 81 73
Sulfate dissolved 250a 64 66 81
Chloride dissolved 250a 03 07 05
Alkalinity field (as CaCO3) 66 60
Nitrogen dissolved (as N) 20 02 05
Nitrogen nitrite dissolved (as N) l b lt001 lt001 003
Nitrogen nitrate dissolved (as N) 10b 029 023
Phosphorus total 006 003 002
Arsenic total (micrograms per liter) 50b 1 3 lt1
Copper total (micrograms per liter) 1300a lt10 210 lt10
Iron dissolved (micrograms per liter) 300a 14 24 9
Lead total (micrograms per liter) 15b lt1 lt1 lt1
Manganese total (micrograms per liter) lt10 lt10 lt10
Manganese dissolved (micrograms per liter) 50a lt1
Mercury total (micrograms per liter) 2b lt01 lt01 lt01
Tritium total (tritium units) 197 202 225
a USEPA Secondary Maximum Contaminant Level for drinking water
b USEPA Maximum Contaminant Level for drinking water
9
respectively On three occasions the annual average lake level (fig 4) increased more than one foot over a one or two year period During 1918-19 and 1925-26 the average lake level rose 12 ft during 1949-51 it rose nearly 15 ft After each of these rising water events water levels receded considerably slower than the rate at which water levels rose
Between 1913 and 1950 the annual minishymum lake level was greater than 168000 ft above sea level 6 times since 1950 the annual minimum levels were slightly lower ranging from 167937 to 167980 ft above sea level (fig 4) Between 1913-50 the average lake level was about 16807 ft from 1950 to 1995 the average lake level was about 16803 ft above sea level Similarly the maximum lake levels from 1913 to 1950 averaged about 16815 ft from 1950-1995 they averaged about 16813 ft
Although the lake level of Lac Vieux Desert is regulated the annual lake-level flucshytuations reflect changes in annual precipitation amounts For example lake-level declines occurred for the drought periods of 1918 1925 1932 1948 1958 1963 1976 and 1988-89 Precipitation was below average durshying these periods In 1963 and 1976 precipitashytion was 8 and 14 inches below average respectively High lake levels occurred in 1919-22 1926-28 1938-39 1951-53 1960 and 1983 (fig 4) The correlation between high annual maximum lake levels and above avershyage amounts of precipitation is more consistent after 1950 than from 1913-50
Water Quality
During March 1996 water samples were collected at sites 3 4 and 5 on ice covered Lac Vieux Desert (fig 2) Water samples were colshylected 2 ft below the base of the lake ice These water samples were analyzed for nutrients pH and specific conductance (table 3) Attempts were made to collect samples at sites 1 and 2 in Rice Bay however at both locations the lake ice was greater than 3 ft thick and nearly in contact with the lake bottom Site 5 is located near the deepest area of the lake where WVIC previously monitored water quality
At sites 1 2 and 3 a strong organic odor was detected indicating reduced oxygen conshyditions under the ice During October 1996 additional samples were collected at 10 sites on Lac Vieux Desert (table 4) Reducing condishytions were not evident during the fall sampling period when dissolved oxygen concentrations ranged from 64 to 94 mgL (milligrams per liter) Profiles of temperature pH dissolved oxygen and specific conductance are illusshytrated in table 5 for 5 of the 10 sites Water depths at the remaining 5 sites were too shalshylow to collect profiles Specific conductance and temperature data from these profiles also indicate that water in the lake is well mixed in the fall
WVIC monitored water temperature and dissolved oxygen in the inflow and outflow at the Lac Vieux Desert dam and at site 5 (fig 2) on a bimonthly basis during the 1970 to 1989 Temperature of the inflow at the dam ranged
from 02 degrees Celsius (degC) on December
13 1983 to 252 degC on June 24 1987 and disshysolved oxygen ranged from 31 mgL on March 29 1988 to 140 mgL on December 20 1988 Temperature of the outflow at the dam ranged
from 03 degC on November 11 1983 to 257 degC on July 22 1988 and dissolved oxygen ranged from 36 mgL on April 14 1982 to 144 mgL on December 20 1988 At site 5 dissolved oxygen at a 66 ft sampling depth ranged from 18 mgL on March 5 1980 and February 13 1981 to 115 mgL on April 29 1980 and May 17 1983 Water temperature at this site and
depth ranged from 38 degC on March 5 1980 to
237 degC on July 28 1982 and July 27 1983 WVIC also analyzed for nitrate plus nitrite
concentrations and pH in water from site 5 Sampling depth ranged from about 31 to 384 ft below lake surface Concentrations of nitrite plus nitrate ranged from 003 to 018 mgL The average summer and fall pH were similar at 69 and 71 units
Comparison of the water-quality data in tables 3 and 4 illustrate the differences between quality of water in the lake during fall and winshyter Specific conductance during fall was about 67 microsiemens per centimeter (microScm) dur-
10
ALTI
TUD
EIN
FEE
T AB
OV
ESE
ALE
VEL
165250
mdashIN--Annual Average Lake Level mdash 4 mdash Annual Moimum Lake Level mdash i mdash Annual Minimum Lake Level
168200 -
1 I
bull168110 -
4t I1 I 11 1 4 4168100 -
I I 1 1 bull
168050 - I1i II I
I I I 4
t I A I11 I 1 I 4 i 1 II 1
t I bullA bull I i i 1 I
168000 - II I i I 1 1 1 t
1 I Ili IA l I I 1 1 1 11 +A t 5 1 fiiAbull i 1 Ark I I _ LILI A 1 4 Ilk 14 lsquoi 1 1 bull bull A i l i bull i ik A ea I i A il I 1 I i 4 A lbull 167950 - 1 n 11 11 1 1 t i 1 I la 111 I a A
AR Ai bull ikbullbullbullbullbull1 Vi1 i A hi z IA bull
167900 1910 1920 1930 1940 1950 1960 1970 1980 1990 200X
Figure 4 Water levels at Lac Vieux Desert 1913-95
11
Table 3 Physical and chemical characteristics of water from three sites on Lac Vieux Desert March 1996
[Concentrations are in milligrams per liter unless otherwise noted analyses by US Geological Survey lt actual value is less than value shown samples collected on March 20-21 1996]
Physical characteristic or
water-quality constituent Site 3 Site 4 Site 5
Specific conductance field
(microsiemens per centimeter at 25 degrees Celsius) 122 109 103
pH field (standard units) 70 70 71
Alkalinity (as CaCO3) 55 49 46
Nitrogen dissolved (as N) 09 06 07
Nitrogen nitrite dissolved (as N) 01 lt01 lt01
Nitrogen nitrate dissolved (as N) 07 23 34
Phosphorus total (as P) 17 02 03
12
Table 4 Physical and chemical characteristics of water from ten sites on Lac Vieux Desert October 1996
[Concentrations are in milligrams per liter unless otherwise noted analyses by US Geological Survey -- not analyzed lt actual value is less than value shown samples collected on October 8-9 1996]
Physical characteristic or water-quality constituent Site 1 Site 2 Site 3 Site 4 Site 5 Site 6 Site 7 Site 8 Site 9 Site 10
Specific conductance field (microsiemens per centimeter 67 67 67 67 66 67 67 68 67 67 at 25 degrees Celsius)
pH field (standard units) 76 76 74 72 74 76 87 75 76 73
Alkalinity (as CaCO3) 33 34 33 33 33 33 34 33 34 33
Nitrogen dissolved (as N) 05 lt01 02 02 04 lt01 04 02 lt01 02
Nitrogen nitrite dissolved (as N) 03 03 02 03 04 02 02 02 03 02
Phosphorus total (as P) lt01 01 lt01 lt01 lt01 lt01 lt01 01 lt01 lt01
Phosphorus dissolved (as P) lt01 lt01 lt01 02 lt01 lt01 lt01 lt01 lt01 lt01
Phosphorus ortho dissolved (as P) lt01 lt01 lt01 lt01 lt01 lt01 lt01 lt01 lt01
13
Table 5 Physical characteristics of water in Lac Vieux Desert at five sites
profiled October 1996
[mgL milligrams per liter microScm microsiemens per centimeter at 25 degrees Celsius]
Depth below pH Oxygen Specific Temperature lake surface field dissolved conductance (degrees
(feet) (units) (mgL) (microScm) Celsius)
Site 3
2 74 94 67 101 4 73 94 67 100 6 73 93 67 98 8 73 91 67 96 10 73 93 67 95 11 73 93 67 95
Site 4
2 72 86 67 100 4 72 85 67 97 6 72 85 67 97 8 73 85 67 97 10 72 85 67 97
Site 5
2 74 87 66 100 4 74 87 66 98 6 74 87 66 98 8 74 87 66 97 10 74 87 66 97 12 74 87 66 97 14 74 87 66 96 16 74 87 66 96 18 74 86 66 96 20 74 86 66 96 22 74 85 66 96 24 74 84 66 96 26 73 79 66 96 28 72 64 66 96
Site 9
2 75 85 68 96 4 75 85 68 96 6 76 84 67 96
Site 10
2 73 88 67 97 4 73 90 67 97 6 73 87 67 97 8 73 87 67 96 10 73 87 67 96 12 73 84 67 96
14
ing winter it ranged from 103 to 122 microScm Likewise alkalinity nitrogen and phosphorus were all less in samples collected in fall than those collected in the winter However greater concentrations of nitrite were detected in samshyples collected in fall compared to the winter samples
SUMMARY
All ground-water supplies in the Lac Vieux Desert watershed are obtained from wells drilled in Pleistocene glacial deposits Analysis of well data indicates that a gravel layer near the bedrock surface is a highly productive aquifer
None of the constituents measured in samshyples collected from three wells at the Lac Vieux Desert Indian Community exceed Maxishymum Contaminant Levels Calcium and bicarshybonate are the major dissolved constituents in the ground water
During March 1996 surface-water samples were collected at three sites on ice covered Lac Vieux Desert During October 1996 samples were collected at 10 sites on the lake Profiles of pH dissolved oxygen specific conductance and temperature indicate that the lake is well mixed in the fall but not in winter when the lake was ice covered
During 1913-95 the minimum and maxishymum daily recorded lake level was 167928 and 168216 ft above sea level on May 17 and 18 1925 and September 24 1951 respectively Since the early 1950s the annual minimum lake-level was lower and less variable During the period of record the average lake level is 16805 ft above sea level There have been three events where the annual average lake level has increased more than one foot over a one or two year period During 1918-19 and 1925-26 the average lake level rose 12 ft and during 1949-51 water levels rose nearly 15 ft Water levels receded slower than they rose after all 3 of these events
Although the lake level of Lac Vieux Desert is regulated historical levels show yearshyto-year fluctuations that reflect transient changes in precipitation amounts These historshyical water-level trends are similar to trends in
annual precipitation amounts however they correlate better after 1950 than before
REFERENCES CITED
Attig John W 1985 Pleistocene Geology of Vilas County Wisconsin Wisconsin Geological and Natural History Survey Information Cirshycular 50 32 p
Doonan CJ and Hendrickson GE 1968 Ground water in Gogebic County Michigan Michishygan Geological Survey Water Investigation 8 22 p
Koterba KT Wilde FD and Lapham WW Ground-water data collection protocols and procedures for the national water-quality assessment program collection and docushymentation of water-quality samples and related data US Geological Survey Open-File Report 95-399 113 p
Morey GB Sims PK Cannon WF Mudrey MG Jr and Southwick DL 1982 Geoshylogic map of the Lake Superior Region Minshynesota Wisconsin and northern Michigan (bedrock) Minnesota Geological Survey
Patterson GL 1989 Water Resources of Vilas County Wisconsin University of Wisconsin-Extension Geological and Natural History Survey Miscellaneous Paper 89-1 46 p
US Environmental Protection Agency 1991 Wellshyhead protection strategies for confined-aquishyfer settings Washington D C Office of Ground Water Protection variously pagishynated
Wisconsin Valley Improvement Company 1990 WVIC water quality monitoring data volume I Natural-lake reservoirs Wisconsin Valley Improvement Company Wausau Wisshyconsin variously paginated
15
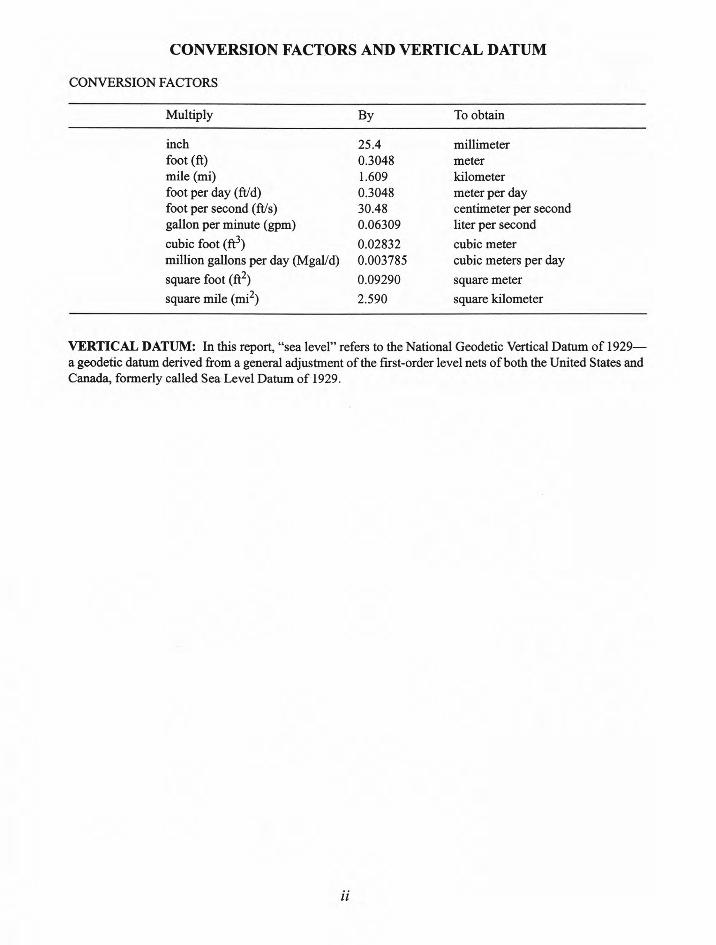
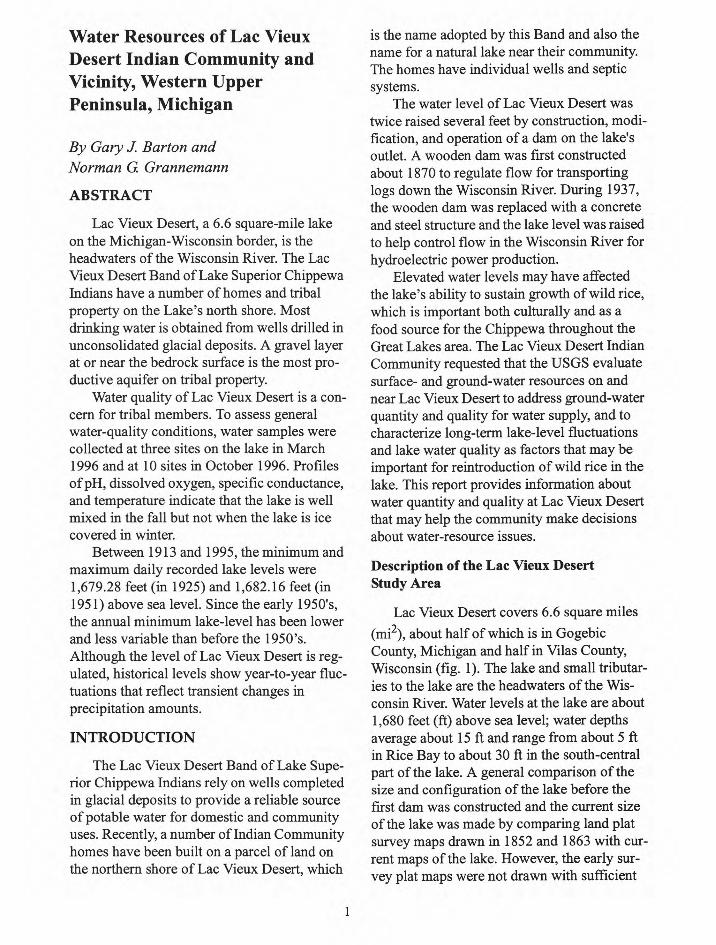
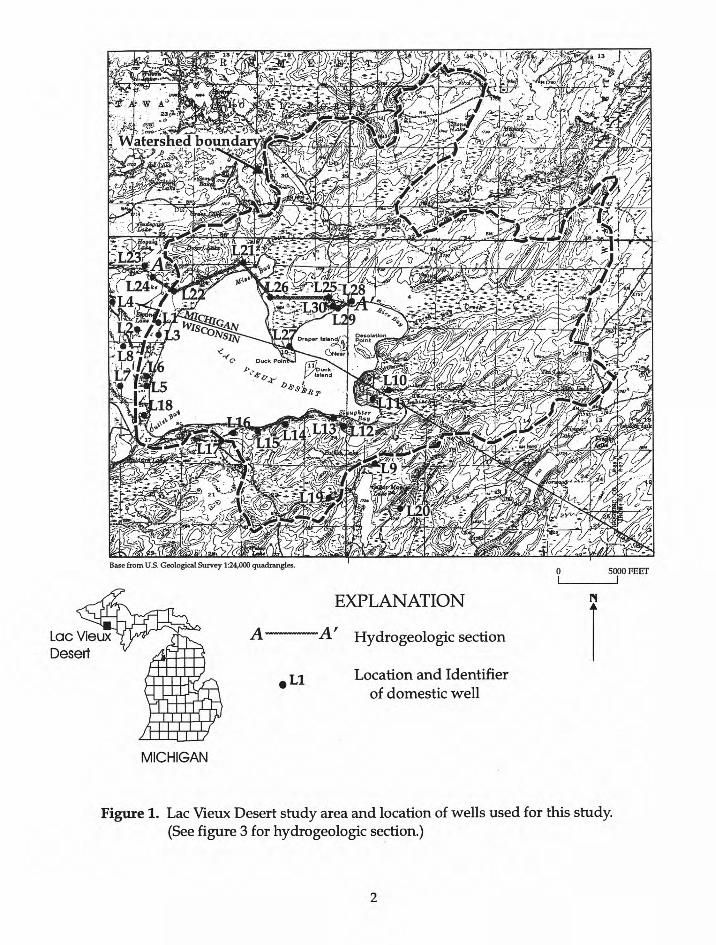
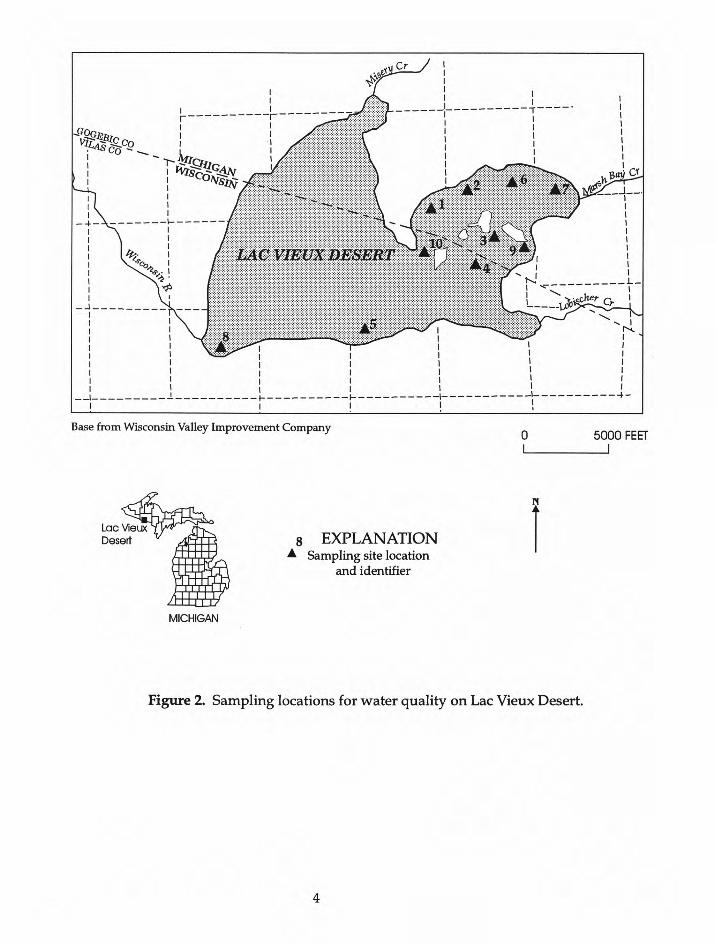
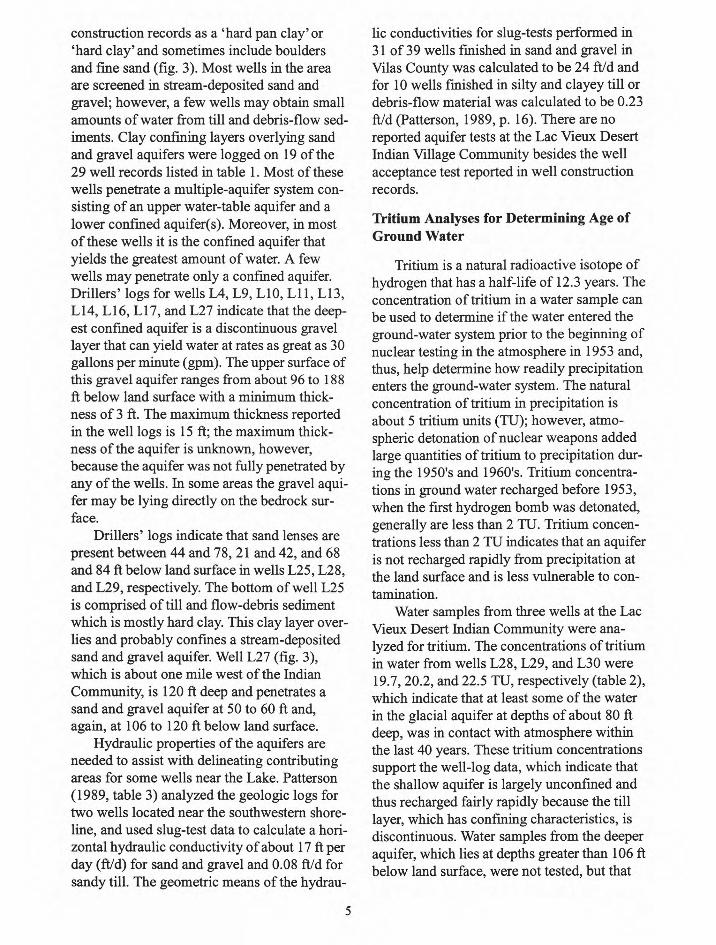
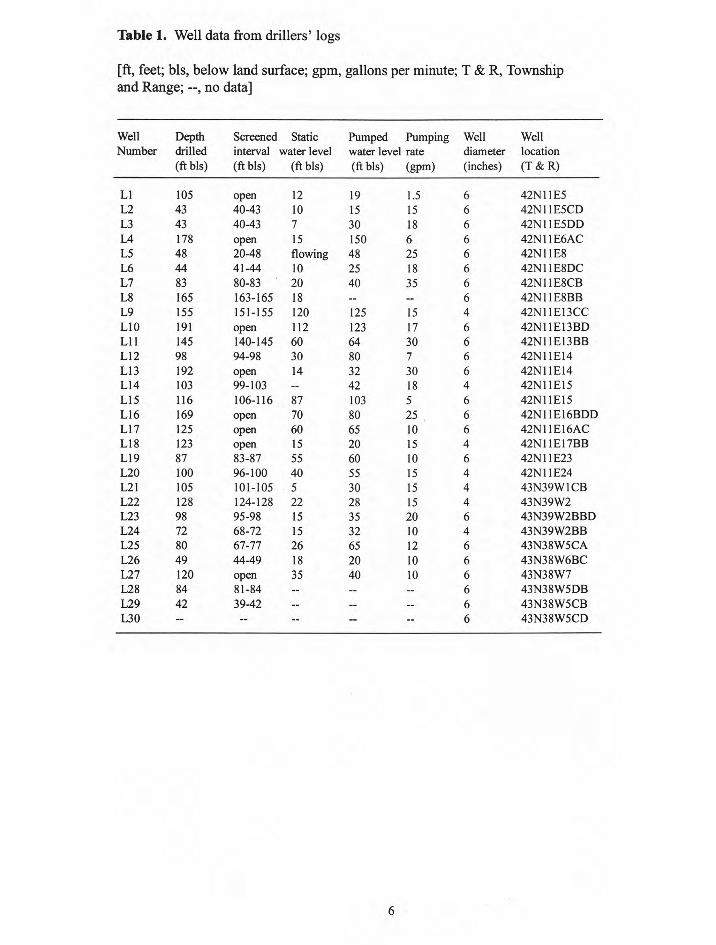
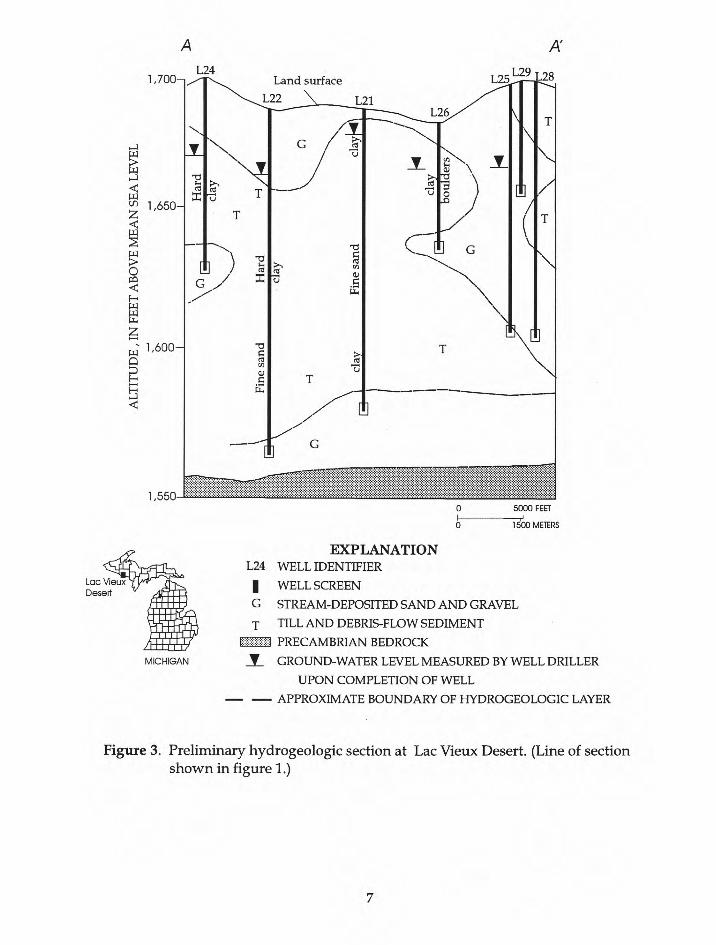
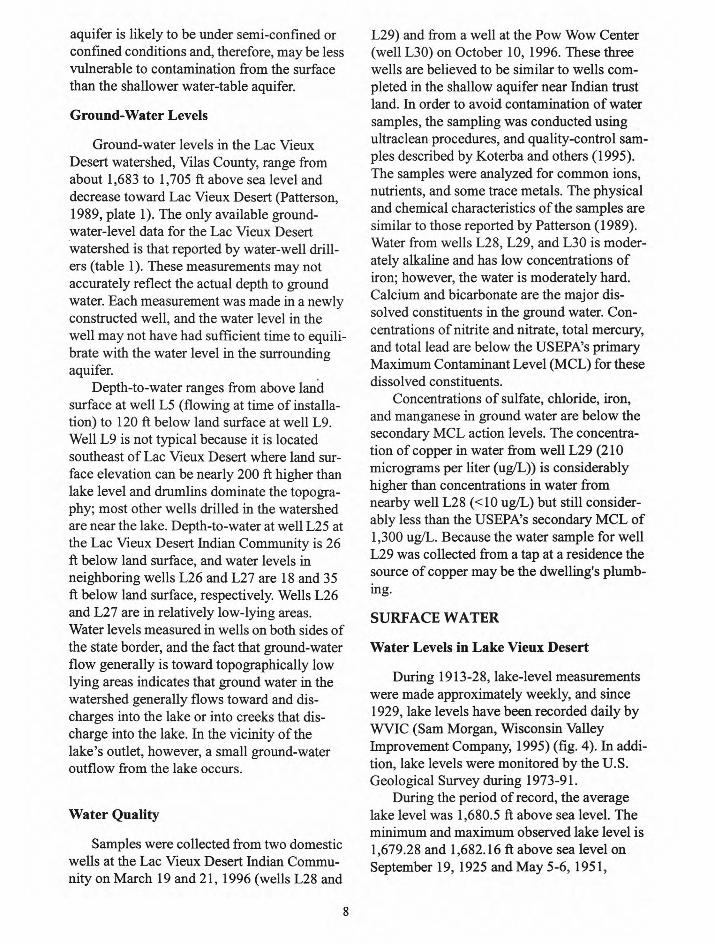
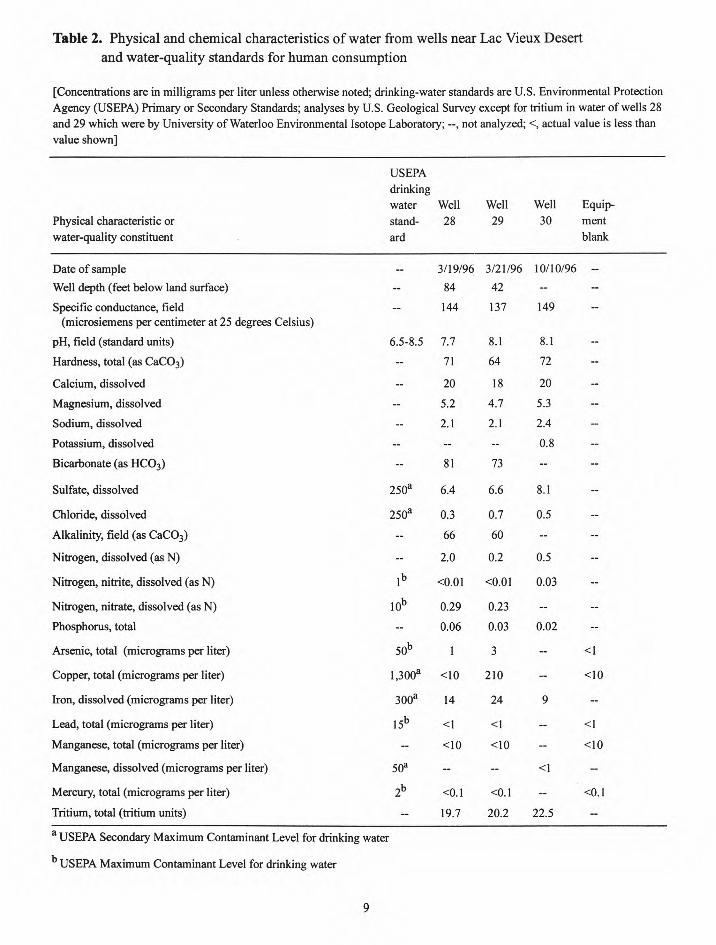
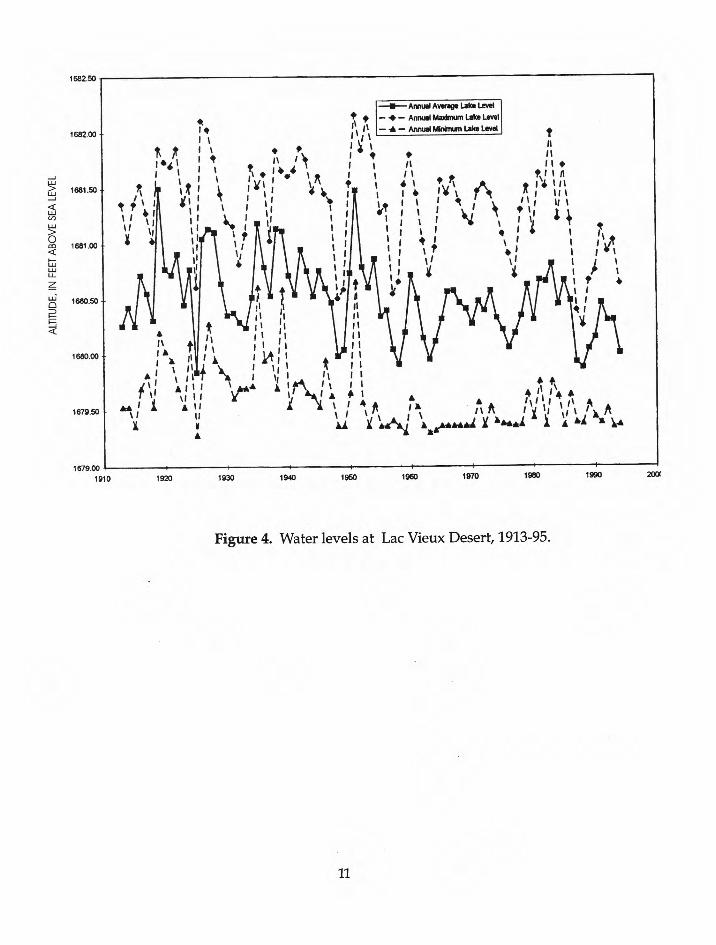
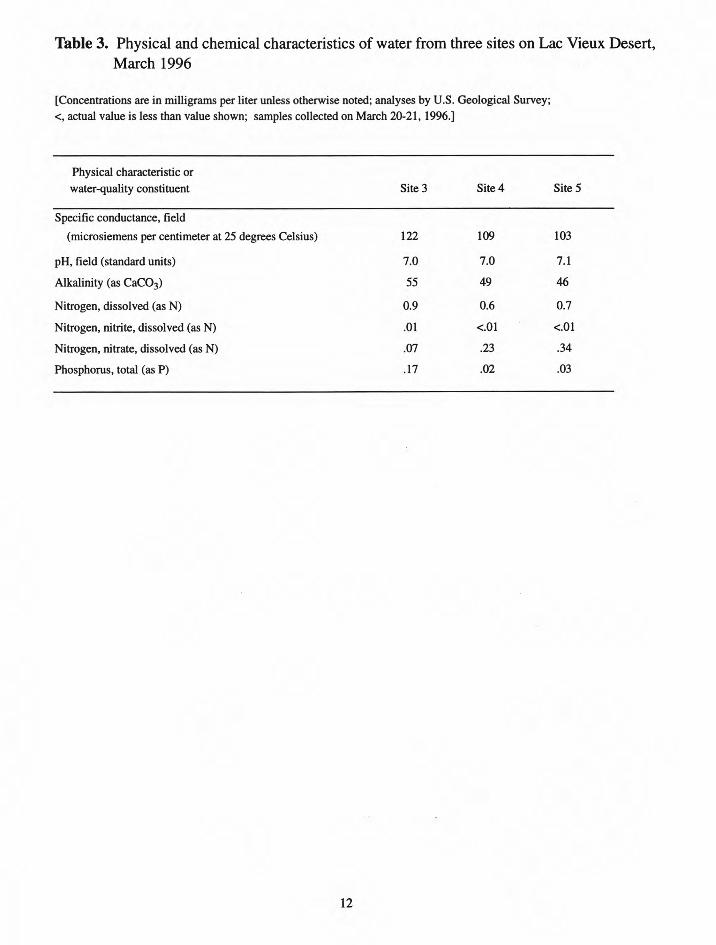
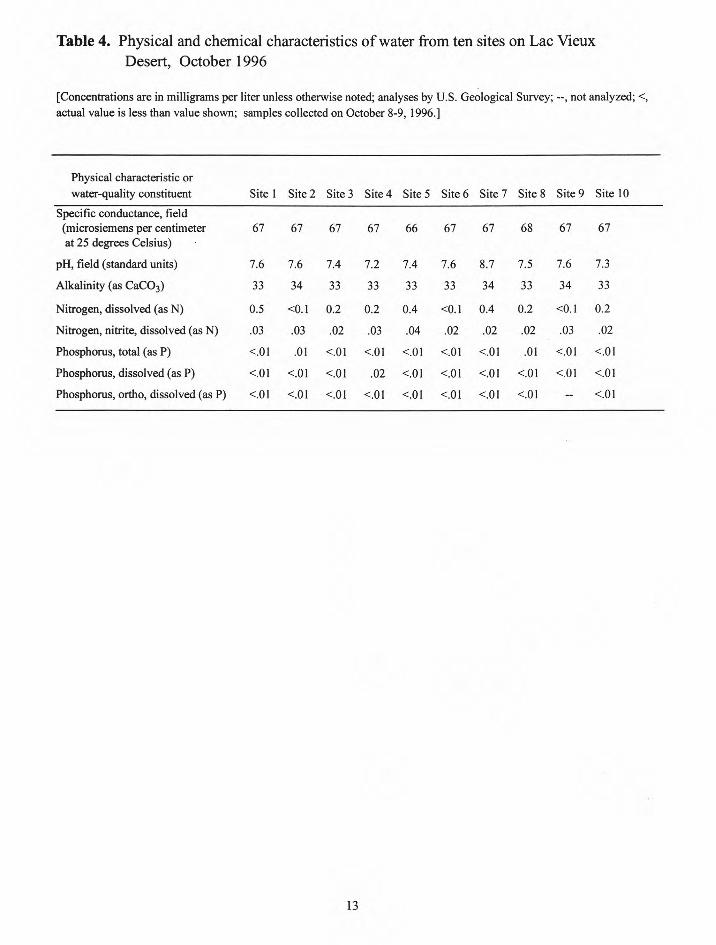
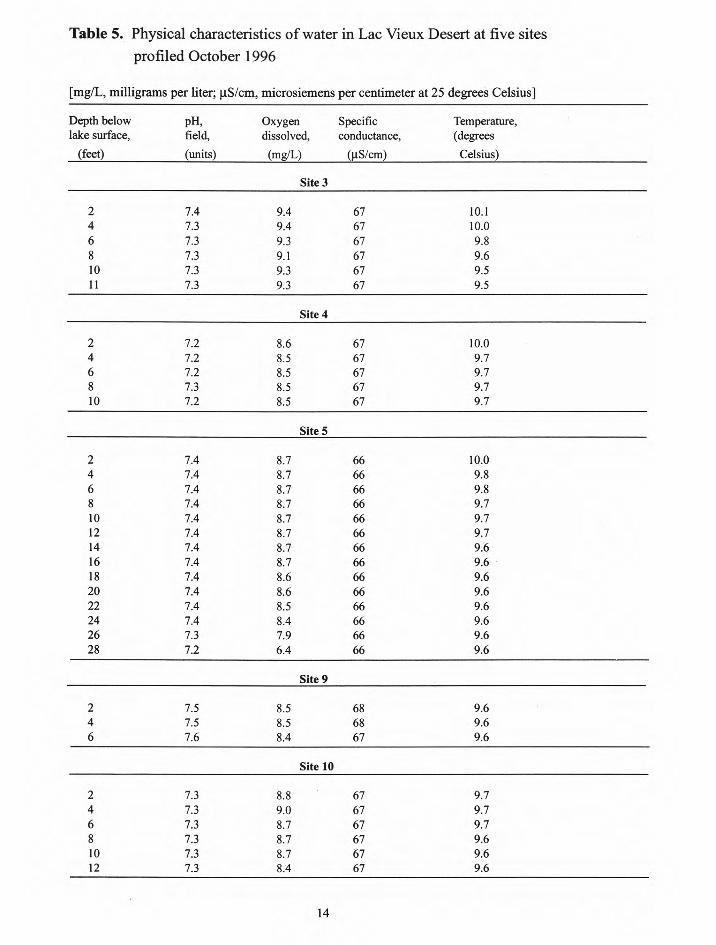