Embed Size (px)
Citation preview
Zurich Open Repository andArchiveUniversity of ZurichMain LibraryStrickhofstrasse 39CH-8057 Zurichwww.zora.uzh.ch
Year: 2010
Enhanced CellClassifier: a multi-class classification tool for microscopyimages
Misselwitz, B ; Strittmatter, G ; Periaswamy, B ; Schlumberger, M C ; Rout, S ; Horvath, P ; Kozak, K; Hardt, W D
Abstract: BACKGROUND: Light microscopy is of central importance in cell biology. The recent in-troduction of automated high content screening has expanded this technology towards automation ofexperiments and performing large scale perturbation assays. Nevertheless, evaluation of microscopy datacontinues to be a bottleneck in many projects. Currently, among open source software, CellProfiler andits extension Analyst are widely used in automated image processing. Even though revolutionizing imageanalysis in current biology, some routine and many advanced tasks are either not supported or requireprogramming skills of the researcher. This represents a significant obstacle in many biology laborato-ries. RESULTS: We have developed a tool, Enhanced CellClassifier, which circumvents this obstacle.Enhanced CellClassifier starts from images analyzed by CellProfiler, and allows multi-class classificationusing a Support Vector Machine algorithm. Training of objects can be done by clicking directly ”on themicroscopy image” in several intuitive training modes. Many routine tasks like out-of focus exclusion andwell summary are also supported. Classification results can be integrated with other object measurementsincluding inter-object relationships. This makes a detailed interpretation of the image possible, allowingthe differentiation of many complex phenotypes. For the generation of the output, image, well and platedata are dynamically extracted and summarized. The output can be generated as graphs, Excel-files,images with projections of the final analysis and exported as variables. CONCLUSION: Here we describeEnhanced CellClassifier which allows multiple class classification, elucidating complex phenotypes. Ourtool is designed for the biologist who wants both, simple and flexible analysis of images without requiringprogramming skills. This should facilitate the implementation of automated high-content screening.
DOI: https://doi.org/10.1186/1471-2105-11-30
Posted at the Zurich Open Repository and Archive, University of ZurichZORA URL: https://doi.org/10.5167/uzh-36283Journal Article
The following work is licensed under a Creative Commons: Attribution 3.0 Unported (CC BY 3.0)License.
Originally published at:Misselwitz, B; Strittmatter, G; Periaswamy, B; Schlumberger, M C; Rout, S; Horvath, P; Kozak, K;Hardt, W D (2010). Enhanced CellClassifier: a multi-class classification tool for microscopy images.BMC Bioinformatics, 11:30.
SOFTWARE Open Access
Enhanced CellClassifier: a multi-class classificationtool for microscopy imagesBenjamin Misselwitz1*, Gerhard Strittmatter1, Balamurugan Periaswamy1, Markus C Schlumberger1, Samuel Rout1,Peter Horvath2, Karol Kozak2, Wolf-Dietrich Hardt1
Abstract
Background: Light microscopy is of central importance in cell biology. The recent introduction of automated highcontent screening has expanded this technology towards automation of experiments and performing large scaleperturbation assays. Nevertheless, evaluation of microscopy data continues to be a bottleneck in many projects.Currently, among open source software, CellProfiler and its extension Analyst are widely used in automated imageprocessing. Even though revolutionizing image analysis in current biology, some routine and many advanced tasksare either not supported or require programming skills of the researcher. This represents a significant obstacle inmany biology laboratories.
Results: We have developed a tool, Enhanced CellClassifier, which circumvents this obstacle. EnhancedCellClassifier starts from images analyzed by CellProfiler, and allows multi-class classification using a Support VectorMachine algorithm. Training of objects can be done by clicking directly “on the microscopy image” in severalintuitive training modes. Many routine tasks like out-of focus exclusion and well summary are also supported.Classification results can be integrated with other object measurements including inter-object relationships. Thismakes a detailed interpretation of the image possible, allowing the differentiation of many complex phenotypes.For the generation of the output, image, well and plate data are dynamically extracted and summarized. Theoutput can be generated as graphs, Excel-files, images with projections of the final analysis and exported asvariables.
Conclusion: Here we describe Enhanced CellClassifier which allows multiple class classification, elucidatingcomplex phenotypes. Our tool is designed for the biologist who wants both, simple and flexible analysis of imageswithout requiring programming skills. This should facilitate the implementation of automated high-contentscreening.
BackgroundAutomated analysis of microscopy images is of growingimportance in many biological fields [1,2]. The improve-ments in microscopy and informatics hardware as wellas the development of software tools have enabled ambi-tious experiments like genome scale RNAi screens,screening of large libraries of chemical compounds, etc.Image processing involves segmentation of the imageinto objects, in the biological setting usually nuclei andcells. Object attributes, for instance intensity, shape ortexture can later be measured. For simple tasks, e.g. pre-sence/absence of a color signal from a specific response
reporter, a single object attribute is sufficient to distin-guish biological phenotypes. However, biological ques-tions often involve complex phenotypes that cannot bedifferentiated using a single object attribute. Changes inthe cell organelle distribution or changes of the actincytoskeleton are examples for this. Therefore, determi-nation of such phenotypes makes the parallel evaluationof multiple object attributes necessary. This can beachieved by classification via machine learningapproaches, for instance by specific supervised statisticalpattern recognition algorithms. Supervised methodsneed training of objects by a user with prior knowledge;objects are thereby labeled to belong to one of severalclasses of phenotypes. A classification algorithm laterutilizes the collected object attributes to identify a
* Correspondence: [email protected] of Microbiology, ETH Zurich, Wolfgang Pauli-Str. 10, 8093 Zürich,Switzerland
Misselwitz et al. BMC Bioinformatics 2010, 11:30http://www.biomedcentral.com/1471-2105/11/30
© 2010 Misselwitz et al; licensee BioMed Central Ltd. This is an Open Access article distributed under the terms of the CreativeCommons Attribution License (http://creativecommons.org/licenses/by/2.0), which permits unrestricted use, distribution, andreproduction in any medium, provided the original work is properly cited.
decision boundary between the phenotypes trained. Anexample for a commonly used classifier is the SupportVector Machine (SVM) algorithm [3].In images of biological samples, typically objects with
several complex phenotypes are simultaneously presenton one image. Cell populations are inherently heteroge-neous, for instance presenting themselves in differentstages of their cell cycle. In addition, cells might reactdifferently to a given experimental intervention. Thecombination of these phenotypes would make multi-class classification necessary for successful image analy-sis. In another common scenario, two independentobjects might be identified on an image, for example thecell and a pathogen. Analysis might require first to clas-sify one of these objects and later, classification informa-tion has to be collated with information about inter-object relationships. In conclusion, a tool which canhandle multiple classes as well as inter-object relation-ships after classification is necessary. Enhanced CellClas-sifier is a software solution for such complex imageanalysis problems.Commercial image analysis software has tremendously
improved over the recent years. ArrayScan (ThermoFisher Scientific) is one of the most popular programs.It is usually directly integrated with an automatedscreening microscope, enables image analysis with manyfeatures and handling of high content experiments. Inthis program, machine learning approaches are not sup-ported but can be incorporated in connection with thirdparty commercial data visualization and data miningsoftware. Another program, Cellenger (Definiens), offersimage analysis with great flexibility using pre-set mod-ules and a powerful scripting language. An image brow-ser, analysis modules and programming tools for imageanalysis including some machine learning algorithms areintegrated in one single program that can also handlehigh content experiments. Limitations of some commer-cial programs include licensing fees and difficult custo-mization, as well as lack of transparency of the analysisprocess and limited flexibility.Among the currently available open source software
resources, the Matlab based program CellProfiler [4] ispopular and has been successfully used in many biologi-cal applications. It provides image segmentation andmeasurement routines as modules which can be flexiblycombined. CellProfiler Analyst (CP Analyst) is a recentlyreleased CellProfiler extension which employs a gentleboosting algorithm for 2 class classification [5,6]. Eventhough the biological image analysis field has made tre-mendous progress because of the above programs, theuser still faces limitations. Importantly, classification byCP Analyst is restricted to two classes. Moreover gen-eration of a flexible output and solving of more compleximage analysis tasks requires individual programming in
addition to the usage of these tools. Other highly suc-cessful software projects focus on different aspects ofimage processing for instance subcellular localization ofproteins [7-9], cell cycle phase identification [10], imagesegmentation [11], characterization of drugs based oncell phenotypic features [12,13], phenotypic changesafter RNAi treatment [14,15], analysis of high contentRNAi screening by time-lapse microscopy in a highthroughput setting [16] or specific histopathology ques-tions [17]; however, these approaches cannot easily begeneralized. In a similar focused approach, the opensource program ImageJ [18] has been used in combina-tion with the image analysis program WEKA [19] toclassify images of biological species [20]. Image analysisand classification can also be done with tools based onthe open source platform R [21] including tools for ana-lyzing RNAi-screens [22]. Some software packages focuson classification of whole images, not objects withinimages (for instance [23]). In addition, many of theabove mentioned tools are used from a command lineand might be useful mainly for bioinformatics expertsbut much less so for typical biological laboratories.In a typical laboratory setting, experiments and micro-
scopy are done by biologists without programmingknowledge. Assays are typically performed in a 96 or384-well format and 4-20 microscopy images areacquired in 1 to 3 or 4 channels per well. The task gener-ally involves identifying the changes in cell phenotypes toevaluate the effect of the compound, condition or pertur-bation. When using the currently available software tools,in our experience four limitations are apparent: 1) Imagesbelonging to the same well need to be summarized. 2)Out of focus images need to be excluded. 3) Several post-processing steps of the data need to be performed and 4)a comprehensive overview of data and an output in ahuman readable format needs to be generated. In Cell-Profiler, currently these tasks can only be accomplishedby scripting. Since most biologists would need additionaltraining before being able to write programs, tools forflexible post-processing analysis are required. For dailyexperiments with quickly changing conditions, flexibilityof evaluation, ease of use and transparency of the evalua-tion process becomes very important.In this publication we introduce Enhanced CellClassi-
fier, a flexible and easy to use tool which allows classifi-cation as well as flexible post-processing that enablesthe user to evaluate many biological phenotypes. In theimplementation section, we provide definition anddescription of important concept and terms, a detaileddiscussion of the SVM approach chosen by us and addi-tional technical details. In the results section we presentimportant features of our tool such as the graphical userinterface, the different training methods and data inte-gration and output generation. In addition we provide
Misselwitz et al. BMC Bioinformatics 2010, 11:30http://www.biomedcentral.com/1471-2105/11/30
Page 2 of 13
two biological case studies to illustrate the usage of ourtool. Finally we compared our tool to another opensource program, CP Analyst.
ImplementationDefinition of important termsObjectAn object is an observation or an item on an image,defined and identified by an image analysis algorithm,for instance a recognized nucleus, cell or a spot.Object attributesMeasurements of an object, for instance concerning itsshape, intensity or texture; object attributes are oftenalso referred to as object features.ClassUser defined phenotypic labels of an object are calledclasses. Classes might be mitotic, non-mitotic etc. Dur-ing training the user assigns a class to an object.ModelA set of instructions to predict the class of an objectfrom object attributes. In Enhanced CellClassifier, a“model” can be trained, saved and reloaded, it containsthe output of the SVM classifier, information about scal-ing of the data and the names of the object attributes.5-fold cross-validation accuracyThe data set is randomly divided into 5 equal parts. Theclassifier takes 80% of the data to calculate a model topredict the classes of the remaining 20% and to calculatethe accuracy of this prediction. This is done five timesand the accuracies are averaged.VectorIn Enhanced CellClassifier vectors are user defined vari-ables, important for summarizing and integrating data.A vector is binary (contains only the values zero or one)and has one type of object as its parent (for instance avector might be derived from the nuclei of an image).Classification results, object attributes or inter-objectrelationships are translated into vectors for every image.The number of vectors that can be defined is not lim-ited. Please refer to results section for an example.Image, well and plate variablesUser defined variables which integrate data and yield ina single value for an image, a well or a plate,respectively.ProgrammingEnhanced CellClassifier was programmed in Matlab. Gra-phical user interfaces were designed using the Matlab-fea-ture GUIDE. Matlab was chosen because CellProfiler hasalso been written in Matlab; a good compatibilitybetween both programs could thus be ensured. The pro-gram is easy to extend and to prototype.SVM classificationSVM is one of several supervised statistical patternrecognition algorithms. Such supervised machine
learning algorithms classify objects of different classesaccording to their object attributes. In SVM, an objectwith n object attributes could be considered a point(vector) in an n-dimensional space of the object attri-butes. In a dataset consisting of two classes and appro-priately chosen object attributes, the objects of eachclass might cluster together in this space. Therefore, inthis n-dimensional space hyperplanes would exist, whichseparate the objects of the two different classes. In asimple case, the two classes could be distinguished by alinear separation and the hyperplane would lack anycurves. A linear SVM algorithm would calculate thehyperplane separating these objects with the largest pos-sible margin. The objects which are situated just atthese margins and thus define the margins are calledsupport vectors. If the dataset cannot be separated in alinear way, non-linear SVM-classifiers are used to calcu-late a curved hyperplane. For these calculations, theobject attributes are mapped by a kernel function into ahigher dimensional space in which the separation can bedone linearly. Furthermore, in many practical examples,two classes cannot be separated perfectly; therefore a“soft margin” is introduced, where each misclassificationyields in a “penalty” for the classifier, this penalty will beminimized by the algorithm (for a introduction see [24]and references therein). For multi-class classification,internally several hyperplanes are calculated to separateall possible pairs of classes; for three classes, 3 hyper-planes would be necessary (class 1 versus 2, 2 versus 3and 1 versus 3).In Enhanced CellClassifier, SVM-classification is done
using libsvm [25]; this software package can handlemulti-class classification and is integrated in EnhancedCellClassifier. Before training the data set is scaled,unknown to the user to ensure the best possible classifi-cation. We use a non-linear kernel (radial basis function(RBF)-kernel) to calculate models; other kernels are cur-rently not supported. In the SVM window, the user canfreely combine data from the current session and up to10 previous sessions to form a set of training data andvalidation data. If a model is calculated, the accuraciesof prediction for the training and validation data setsare calculated as well as the confusion matrix (matrixshowing predicted classes versus trained classes).In Enhanced CellClassifier, a separate window is dedi-
cated for SVM training and adjustments. Our tool pro-vides maximum flexibility in dividing all loaded objectsinto a training and a validation subpopulation, beforecalculating the model. The resulting model can therebybe tested against the current objects as well as objectsfrom former training sessions. Optimization and adjust-ment of the critical parameters C (cost) and gamma ofthe RBF-kernel is supported [26], to optimize classifica-tion for different data sets. Enhanced CellClassifier also
Misselwitz et al. BMC Bioinformatics 2010, 11:30http://www.biomedcentral.com/1471-2105/11/30
Page 3 of 13
allows adjustment of the penalties for the differentclasses to ensure balanced classification of a heteroge-neous data set. Histograms of the features of the trainedcells can be visualized; apparently useless features canbe excluded to save computation time.While using SVM, Enhanced CellClassifier makes a
powerful classifier available to the user; the approachworked better or as good as alternative classifiers in thebiological examples 1 or 2, respectively (see below) andhas been successfully applied on two unrelated micro-biological problems (not shown). Moreover, reducingthe numbers of classifiers to just one might avoid confu-sion for the novice user. However, our approach facessome potential limitations. First, in datasets containingan exceedingly large number of objects or a large num-ber of object features, computational power for calculat-ing models might become prohibitive. In this situation,for instance tree based classifiers or SVM using linearkernels might yield equivalent results in a shorter timeframe. Enhanced CellClassifier users would need toapply feature selection techniques and exclude uselessobject features before training to overcome this poten-tial problem. However, in our experience training timeon normal desktop computers is usually within 1-5 sec-onds during normal usage; we tested datasets of up to6000 cells and up to 400 features without training timeexceeding 1 min. Second, optimal performance of theSVM classifier for some datasets (biological example 1)requires a grid search of the critical parameters C andgamma of the RBF-kernel which is supported byEnhanced CellClassifier. Otherwise poor classification ofthe training data set or overfitting, indicated by poor
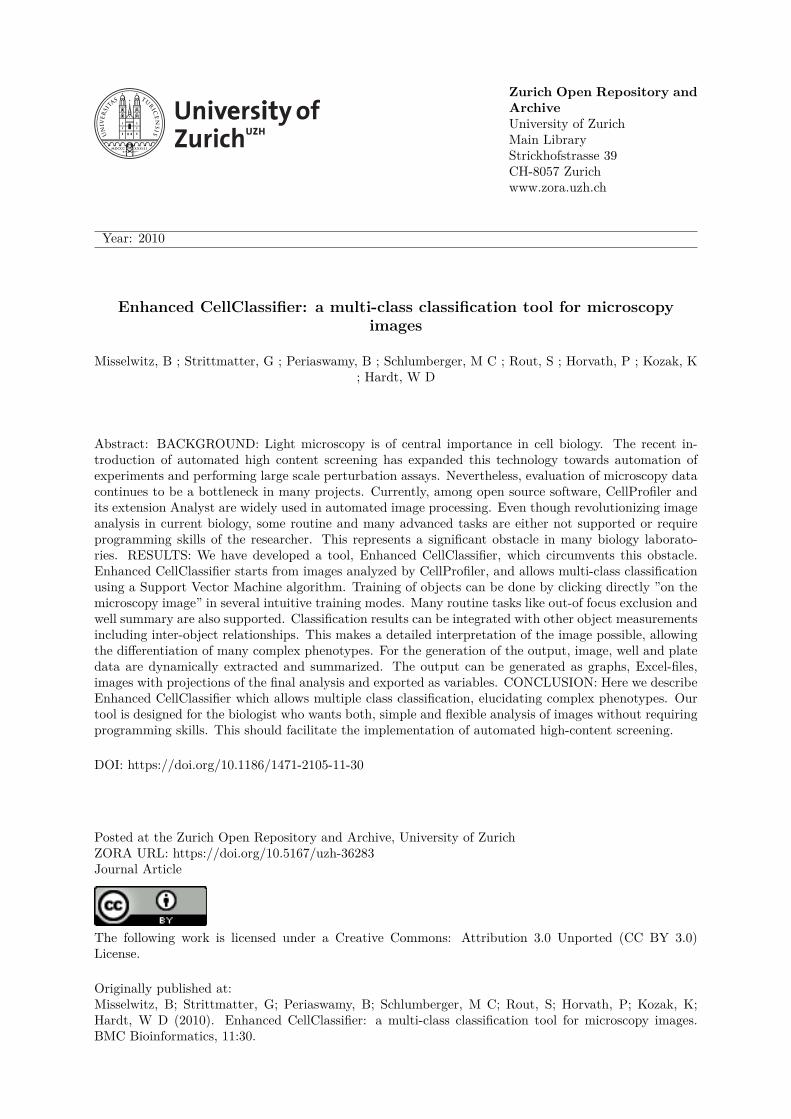
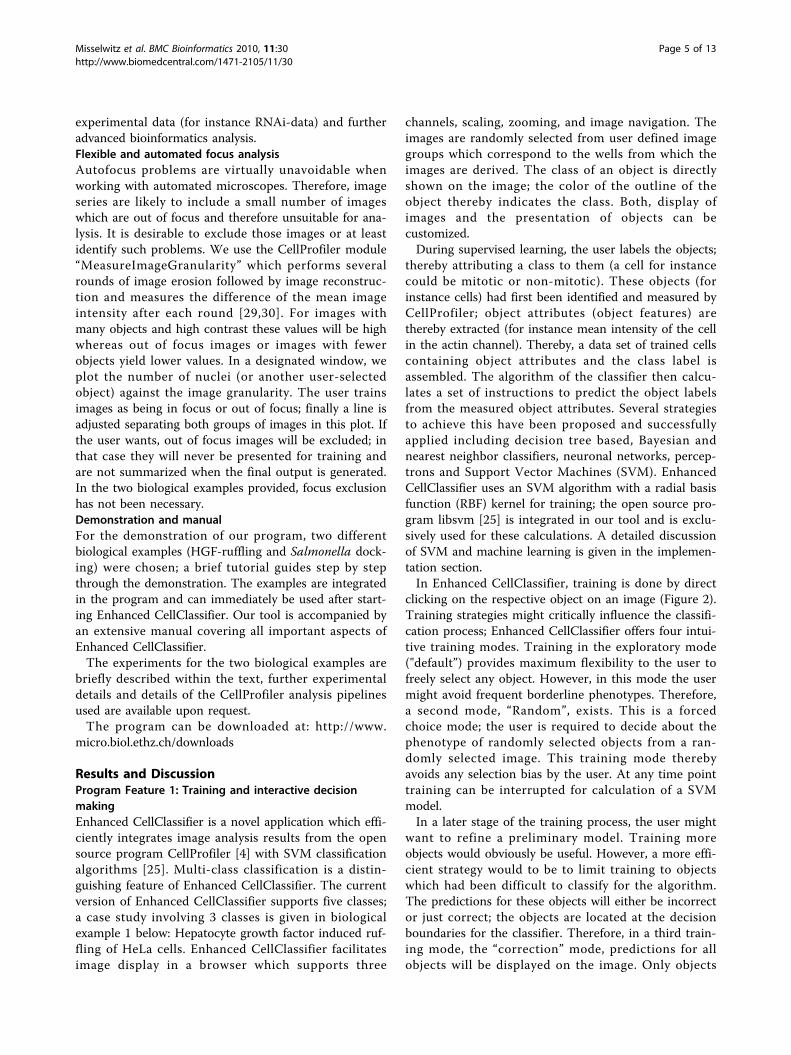
classification of the validation data set, might occur. Incontrast, other classifiers either need no or considerablyless parameter optimization. Finally, even though SVMwith an RBF-kernel and correct settings can modelevery training data set accurately, it might predict a newdata set not as accurately as other algorithms. Therefore,for some biological questions SVM using other non lin-ear kernels, other classifiers or meta-classifiers mightperform better than our approach even though we didnot experience an example for this.Workflow in Enhanced CellClassifierFigure 1 shows an overview of the workflow inEnhanced CellClassifier. The input of our tool consistsof CellProfiler output files (Matlab files containingobject data, for instance measurements of identifiedcells), CellProfiler generated label matrix images (imagesshowing the borders of the objects) and the originalmicroscopy images. The output could be graphs, imagesdemonstrating the analysis, Matlab data and Excel-files.Integration with other programsEnhanced CellClassifier can load CellProfiler data; theoutput of other image analysis programs is currently notsupported. Data from trained Enhanced CellClassifierobjects including object attributes and their classificationcan be saved as ‘.arff’ files and imported into the opensource program WEKA (Waikato environment forknowledge analysis) [27] for further analysis of the datawith different classifiers. In addition, the data can beimported into the recently released open source pro-gram HCDC-KNIME http://hcdc.ethz.ch, [28]); thisworkflow based system enables linking Enhanced Cell-Classifier output data with the original images,
Figure 1 Schematic view of the workflow in CellClassifier. As an input, the tool needs the original microscopy images, as well as output filesand label matrix images produced by CellProfiler. The interaction with the user happens mainly via the main window (for a screenshot seeFigure 3). For special tasks like adaptation of the focus exclusion routine, Support Vector Machine model generation and alternative training aswell as adjustment of the output and settings (not shown) more graphical user interfaces open. CellClassifier produces several different outputs:a) Outlined images with projections of the object borders, colors of the outlines thereby projecting classification or other object information (forexamples see Figures 2 and 4). b) Excel-files with user defined information about the image, wells and the whole plate. c) Heat maps or othergraphical summaries containing user defined overviews over a whole 96- or 384-well plate. d) Manual cell count, generating a well basedsummary of the classifications by the user and e) Matlab summaries, making export as Matlab variables possible.
Misselwitz et al. BMC Bioinformatics 2010, 11:30http://www.biomedcentral.com/1471-2105/11/30
Page 4 of 13
experimental data (for instance RNAi-data) and furtheradvanced bioinformatics analysis.Flexible and automated focus analysisAutofocus problems are virtually unavoidable whenworking with automated microscopes. Therefore, imageseries are likely to include a small number of imageswhich are out of focus and therefore unsuitable for ana-lysis. It is desirable to exclude those images or at leastidentify such problems. We use the CellProfiler module“MeasureImageGranularity” which performs severalrounds of image erosion followed by image reconstruc-tion and measures the difference of the mean imageintensity after each round [29,30]. For images withmany objects and high contrast these values will be highwhereas out of focus images or images with fewerobjects yield lower values. In a designated window, weplot the number of nuclei (or another user-selectedobject) against the image granularity. The user trainsimages as being in focus or out of focus; finally a line isadjusted separating both groups of images in this plot. Ifthe user wants, out of focus images will be excluded; inthat case they will never be presented for training andare not summarized when the final output is generated.In the two biological examples provided, focus exclusionhas not been necessary.Demonstration and manualFor the demonstration of our program, two differentbiological examples (HGF-ruffling and Salmonella dock-ing) were chosen; a brief tutorial guides step by stepthrough the demonstration. The examples are integratedin the program and can immediately be used after start-ing Enhanced CellClassifier. Our tool is accompanied byan extensive manual covering all important aspects ofEnhanced CellClassifier.The experiments for the two biological examples are
briefly described within the text, further experimentaldetails and details of the CellProfiler analysis pipelinesused are available upon request.The program can be downloaded at: http://www.
micro.biol.ethz.ch/downloads
Results and DiscussionProgram Feature 1: Training and interactive decisionmakingEnhanced CellClassifier is a novel application which effi-ciently integrates image analysis results from the opensource program CellProfiler [4] with SVM classificationalgorithms [25]. Multi-class classification is a distin-guishing feature of Enhanced CellClassifier. The currentversion of Enhanced CellClassifier supports five classes;a case study involving 3 classes is given in biologicalexample 1 below: Hepatocyte growth factor induced ruf-fling of HeLa cells. Enhanced CellClassifier facilitatesimage display in a browser which supports three
channels, scaling, zooming, and image navigation. Theimages are randomly selected from user defined imagegroups which correspond to the wells from which theimages are derived. The class of an object is directlyshown on the image; the color of the outline of theobject thereby indicates the class. Both, display ofimages and the presentation of objects can becustomized.During supervised learning, the user labels the objects;
thereby attributing a class to them (a cell for instancecould be mitotic or non-mitotic). These objects (forinstance cells) had first been identified and measured byCellProfiler; object attributes (object features) arethereby extracted (for instance mean intensity of the cellin the actin channel). Thereby, a data set of trained cellscontaining object attributes and the class label isassembled. The algorithm of the classifier then calcu-lates a set of instructions to predict the object labelsfrom the measured object attributes. Several strategiesto achieve this have been proposed and successfullyapplied including decision tree based, Bayesian andnearest neighbor classifiers, neuronal networks, percep-trons and Support Vector Machines (SVM). EnhancedCellClassifier uses an SVM algorithm with a radial basisfunction (RBF) kernel for training; the open source pro-gram libsvm [25] is integrated in our tool and is exclu-sively used for these calculations. A detailed discussionof SVM and machine learning is given in the implemen-tation section.In Enhanced CellClassifier, training is done by direct
clicking on the respective object on an image (Figure 2).Training strategies might critically influence the classifi-cation process; Enhanced CellClassifier offers four intui-tive training modes. Training in the exploratory mode("default”) provides maximum flexibility to the user tofreely select any object. However, in this mode the usermight avoid frequent borderline phenotypes. Therefore,a second mode, “Random”, exists. This is a forcedchoice mode; the user is required to decide about thephenotype of randomly selected objects from a ran-domly selected image. This training mode therebyavoids any selection bias by the user. At any time pointtraining can be interrupted for calculation of a SVMmodel.In a later stage of the training process, the user might
want to refine a preliminary model. Training moreobjects would obviously be useful. However, a more effi-cient strategy would to be to limit training to objectswhich had been difficult to classify for the algorithm.The predictions for these objects will either be incorrector just correct; the objects are located at the decisionboundaries for the classifier. Therefore, in a third train-ing mode, the “correction” mode, predictions for allobjects will be displayed on the image. Only objects
Misselwitz et al. BMC Bioinformatics 2010, 11:30http://www.biomedcentral.com/1471-2105/11/30
Page 5 of 13
corrected by the user will be memorized. Adding theseborderline objects to the data set can greatly improvethe model. Finally, in a fourth mode, the “decisionboundaries” mode, only objects for which the predic-tions are closest to the decision boundaries of the cur-rent model are presented; these objects are also mostvaluable for further refinement. The user can freelyswitch between training modes; moreover, training canbe performed in an “informed” or a “blinded” fashion,either displaying the image filenames or not.Presentation of objects within the original images
directly illustrates the biological process, image segmen-tation and performance of the classifier to the user. Itmight enhance training accuracy, since the context ofeach object can be taken into account by an experiencedbiologist. On the other hand, the context might result ina training bias and image based training might causeunder-representation of objects from images with highcell densities. Therefore, training can also be conductedin another window; here, 10 individual objects from upto 10 different images from the 96- or 384-well platewill be displayed. 8 of those objects are selected to beclose to the decision boundaries of the current model,
the remaining 2 illustrate the positive and negative phe-notype. This mode avoids any training bias and mightenhance the efficiency of the training process by select-ing the most interesting objects from the whole plate. Asimilar training mode has recently been described [6].Program feature 2: data integrationEnhanced CellClassifier facilitates the integration of clas-sification information with other CellProfiler data. Dur-ing image analysis by CellProfiler inter-objectinformation can be calculated. For instance, two inde-pendent object types can be related to each other if theyoverlap (for instance cells and “spots”, see below); oneobject will be labeled as the child of the other. With adifferent module, neighborhood information for objectsof the same kind can be calculated. However, in Cell-Profiler this information can only be utilized after indi-vidual programming.Enhanced CellClassifier allows the user to define inter-
nal representations of the objects which we call “vec-tors”. A vector is binary and will be calculated for eachimage; it contains as many numbers as objects of thespecified kind. Classification, measurement and inter-object information can all be translated into binary
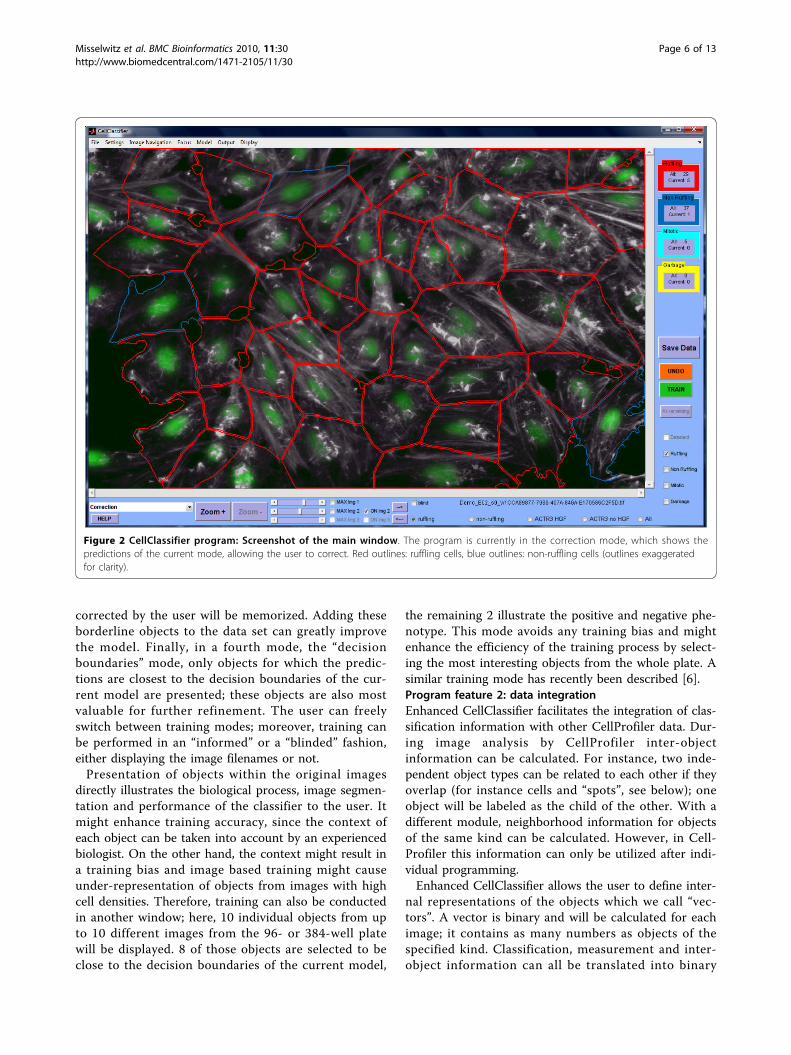
Figure 2 CellClassifier program: Screenshot of the main window. The program is currently in the correction mode, which shows thepredictions of the current mode, allowing the user to correct. Red outlines: ruffling cells, blue outlines: non-ruffling cells (outlines exaggeratedfor clarity).
Misselwitz et al. BMC Bioinformatics 2010, 11:30http://www.biomedcentral.com/1471-2105/11/30
Page 6 of 13
vector information. Since one can generate new vectorsfrom existing vectors using logical operations, the useris now able to define any subgroup of objects desired.For example: If an image contains 5 cells, of which 1and 3 are mitotic, the vector for mitotic cells for thisimage would be 1, 0, 1, 0, 0. If cells 1, 4 and 5 are calcu-lated to be infected by a pathogen, the vector forinfected cells would be 1, 0, 0, 1, 1. The vector infectedmitotic cells would be 1, 0, 0, 0, 0, infected non-mitoticcells 0, 0, 0, 1, 1 and so on. This vector concept enablesthe user to handle cases combining classification andinter-object relationships or other object propertieswhich would otherwise only possible by scripting. Fea-ture integration is illustrated below in the biologicalexample 2, Salmonella-docking onto HeLa cells.Program feature 3: Dynamic data extractionTo ensure the greatest possible flexibility three furtherinternal representations can be defined by the user:“image variables “, “well variables “ and “plate vari-ables”. Image variables comprise just one number foreach image, for instance “number nuclei”, “numberinfected cells” or “percent infected cells”. They are inmost situations calculated from vectors; however,Enhanced CellClassifier also allows importing CellPro-filer data directly, for instance threshold information.Well variables are summaries of the image variables ofone well. Well variables can also be the result of a cal-culation, for instance the normalization of the numberof docked or ruffling cells by the total number ofnuclei in this well. Plate variables are summaries ofvariables from wells chosen by the user. They are espe-cially useful for normalizing all data on a plate or forbringing internal controls prominently to the attentionof the user. All variables are defined via a graphicaluser interface where predefined choices avoid “impossi-ble” settings.Program feature 4: Flexible output optionsMost important for the user is the summary of thewhole experiment in a comprehensible and human read-able format. Our program generates four different kindsof output data: outlined images, Excel-files, graphicalsummaries and a Matlab readable output. Outlinedimages visualize a vector or the result of the classifica-tion for a given image; if for instance the user wanted tovisualize the vector “mitotic cells” using a yellow color,for all objects for which the vector had been positive (i.e. all mitotic cells) the outlines would be stained yellow(for examples see Figures 3, 4). Outlined images allowfor a visual control of the final analysis and documenta-tion. Excel-data are probably the most popular data for-mat for biologists; all image, well and plate variables areautomatically exported to an Excel-sheet. Well variablesfrom the whole plate can be visualized as heat maps,histograms or scatter plots. They allow a quick overview
over the whole experiment. When doing larger experi-ments, the user might want to do further customizedanalysis. Therefore, image and well variables of interestcan be exported in a Matlab readable format.Enhanced CellClassifier supports automatic processing
of multiple plates. To allow for the analysis of a highcontent screen, the Enhanced CellClassifier output canbe imported into the open source program HCDC-KNIME which enables the analysis of large experimentsas well as integration with the original images, experi-mental data and further advanced bioinformaticsanalysis.Biological example 1: Hepatocyte growth factor inducedrufflingWe chose ruffling of cells in response to hepatocytegrowth factor (HGF) as an example for automated iden-tification of complex phenotypes. HGF is a cytokinewhich can stimulate cell motility, proliferation and mor-phogenesis. A visible sign of HGF-activity is the appear-ance of pronounced “dorsal” ruffles on the surface ofthe cell [31]. Ruffles are driven by rapid actin polymeri-zation. In this context, the master regulator of actinpolymerization Arp2/3 with its central componentACTR3 is known to play a major role. The intracellularsignaling from HGF-receptor leading to ruffling is cur-rently a subject of intense research [32].We established an image based ruffling assay using
HeLa cells (Figure 3). HeLa cells were incubated for 5minutes with HGF at a final concentration of 100 ng/ml, fixed and stained with 4’, 6-diamidino-2-phenylin-dole (DAPI), for visualization of nuclei and tetramethylrhodamine iso-thiocyanate (TRITC)-phalloidin for stain-ing of the actin cytoskeleton. Where indicated, cells hadbeen incubated with Lipofectamine 2000 and 20 nM ofan siRNA directed against the mRNA of ACTR3 fordown regulation of this protein prior to the assay. 20images were acquired per well with an Image Xpressmicroscope (Molecular devices) using a 20×-objective.In the microscopy images, nuclei and cells were identi-fied in the DAPI and the actin channel, respectivelyusing established CellProfiler modules.Cells and nuclei were subsequently measured in both
channels using CellProfiler tools for measurements ofobject texture and intensity. In brief, CellProfiler texturemeasurements include Haralick features, comprising aset of statistical calculations derived from the grey levelco-occurrence matrix of an object [33] and Gabor fea-tures, obtained after applying Gabor filters [34] in the xand y direction. Intensity measurements include theminimum, maximum, median and mean pixel intensitiesover an object and its edge regions, respectively. Both,intensity and texture measurements were performed forthe actin- and DAPI-channel of the image for the regionof the nucleus and the cell.
Misselwitz et al. BMC Bioinformatics 2010, 11:30http://www.biomedcentral.com/1471-2105/11/30
Page 7 of 13
In order to improve the performance of the classifier,customized CellProfiler modules were developed. Ourmodules take advantage of the high difference in theintensity of a ruffle in the actin channel compared tothe remainder of the cell and their distinctive compactshape. In brief, in one strategy we determined theregions of the cell with the brightest intensities, eitherby applying a fixed circular mask or by thresholdingusing the Otsu algorithm [35]. Subsequently, featuresdescribing the contrast between the brightest area andthe remaining area of the cell were extracted [36]. In an
additional approach, we took advantage of the fact thatthe area of ruffles within a cell consisted usually of the5% brightest pixels within a cell. The shape of the thusidentified regions was measured (solidity, eccentricity) aswell as the contrast (difference, z-score) of the potentialruffle relative to the remainder of the cell.However, no single feature could clearly distinguish
ruffling from non-ruffling cells (not shown). This wasnot entirely unexpected, since changes in actin polymer-ization also happen during normal cellular life, forinstance at the entry into mitosis. Therefore this
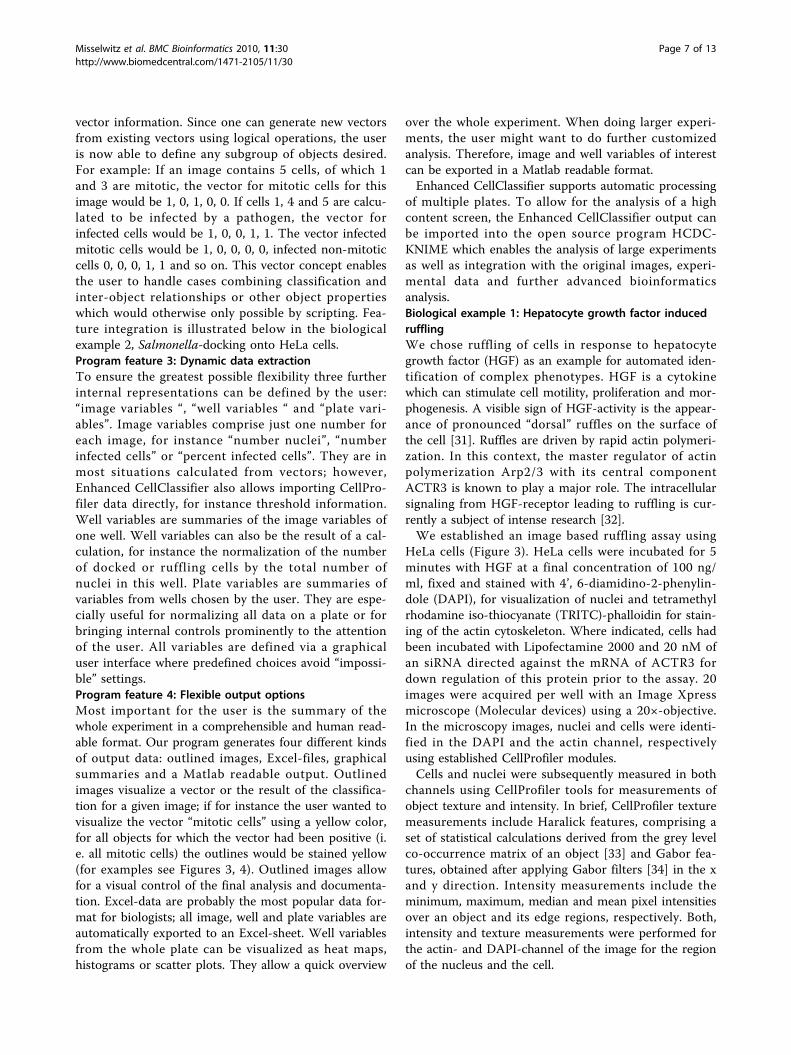
Figure 3 HGF-induced ruffling. A: HeLa-cells were pre-treated either under Mock-conditions or with an siRNA directed against the mRNA ofthe ACTR3 component of the Arp2/3 complex. Later, HGF was added, where indicated. Red: Actin, Blue: Nuclei. Scale bar: 20 μm. B: After imagesegmentation and measurement by CellProfiler, a model was trained in CellClassifier, outlined images showing predictions were produced. Grey:actin, green: nuclei, red outlines: ruffling cells, blue outlines: non-ruffling cells, yellow outlines: mitotic cells. C: Part of the Excel-sheet generatedby CellClassifier. D: Illustration of CellClassifier output, left: heat maps. Positions of mock treated wells +HGF: B02-E02, no HGF: B11-E11. siRNAsagainst ACTR3 mRNA were positioned at F03-F06 (+HGF) and F07-F11 (no HGF). Only wells of interest were imaged. E: Summary of theexperiment generated outside CellClassifier. Cells were pre-treated with siRNA and incubated with HGF as indicated. Each bar shows the medianand standard deviation of 4 wells. With ACTR3 each well was treated with a different siRNA against ACTR3, yielding virtually identical effects.
Misselwitz et al. BMC Bioinformatics 2010, 11:30http://www.biomedcentral.com/1471-2105/11/30
Page 8 of 13
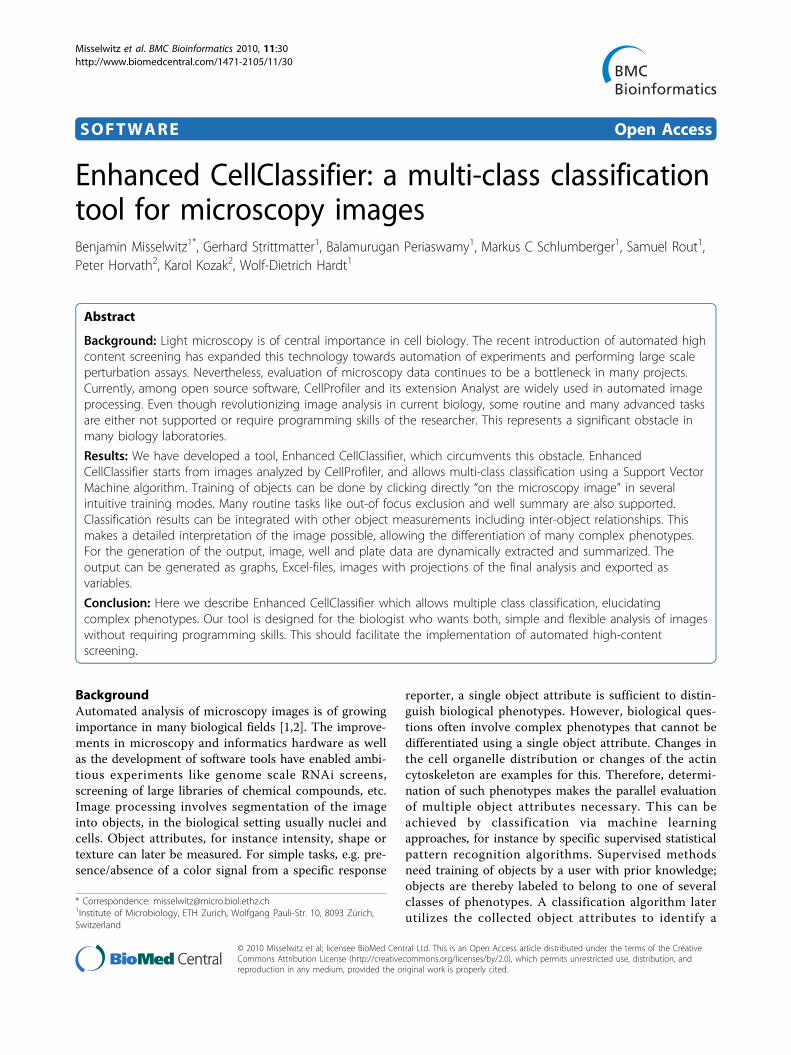
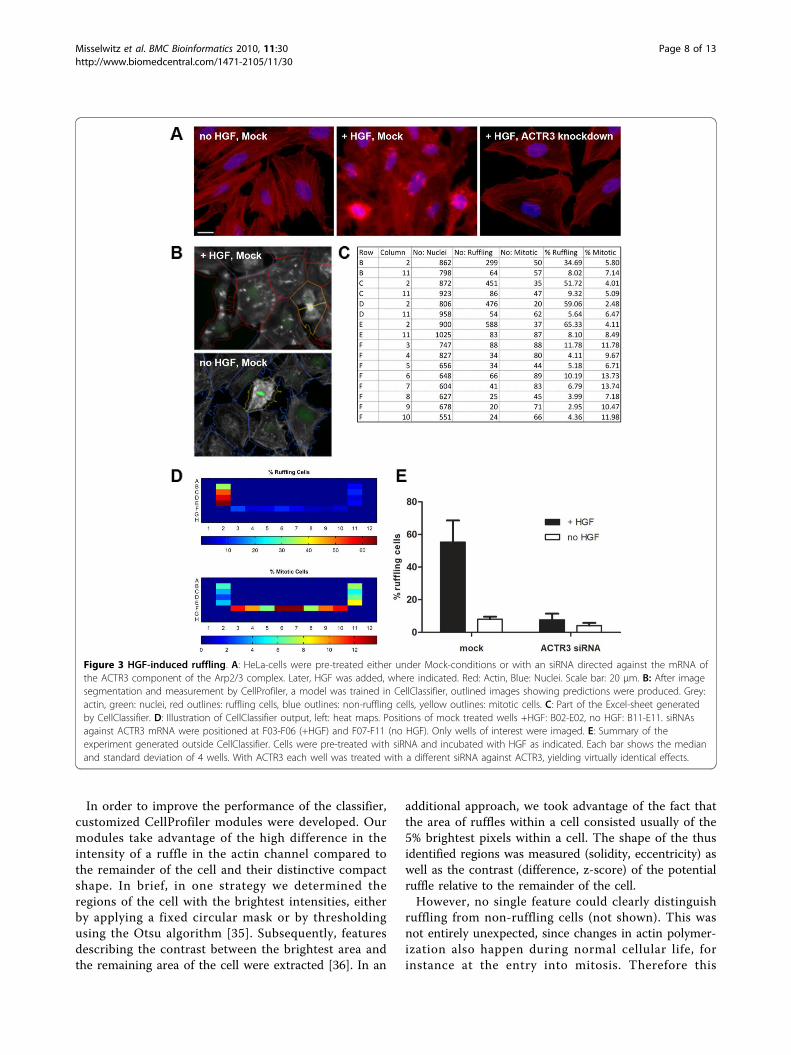
Figure 4 Feature integration by CellClassifier. A: Salmonella (shown in green) preferentially dock onto mitotic cells (nuclei shown in grey).Segmentation and measurements of image were done using CellProfiler: First both, nuclei and Salmonella, were identified as independentobjects. Cell objects were generated by expansion with reference to the nucleus. Inter-object relationships between Salmonella-spots and cells,as well as between neighboring nuclei were calculated. In CellClassifier a model was trained to distinguish mitotic cells from non-mitotic cells.Cells with at least 1 associated spot were considered infected. Using the feature integration properties of CellClassifier, 6 population of nuclei (6vectors) were calculated and exported to Excel and as outlined image: Infected mitotic cells (orange outline), non infected mitotic cells (pink,very rare therefore not shown), cell with mitotic neighbor, infected (green), mitotic neighbor, non-infected (cyan), normal cell, infected (red),non-infected (blue). Scale bar: 100 μm. B: Illustration of CellClassifier graphical output (heat maps). The experiment was done in a 96-well plate.Row A represents mock conditions (A01-A06) and no bacteria (A07-A12). The diagram in the upper left shows percentage of normal cellsinfected; the diagram in the upper right cell shows the log2 of the percentage of infected normal cells, normalized to a standard (G01-G12).Lower left: histogram of percent infected cells in the whole 96-well plate. Lower right: % normal cells infected plotted as a function of numbernuclei. The red circles represent a trend analysis determined by a sliding window. In this plot, no gross trends are obvious. C: Summary of theoutput done outside CellClassifier, showing the preference of Salmonella docking for mitotic cells. D: Part of the Excel-file generated byCellClassifier.
Misselwitz et al. BMC Bioinformatics 2010, 11:30http://www.biomedcentral.com/1471-2105/11/30
Page 9 of 13
problem required to identify three different cell types:ruffling, non-ruffling and mitotic cells. This task couldconveniently be achieved using Enhanced CellClassifier.For identifying dorsal ruffles on HGF-treated cells,
objects were trained in the “default” and “random” train-ing mode. After training a preliminary SVM model,incorrectly classified cells were corrected in the “correc-tion” mode, yielding a final data set of 782 objects. Aftera grid search of the parameters C and gamma for theRBF-kernel, the 5-fold cross-validation accuracy was87.7%. This slightly less than optimal performance ismost likely due to the presence of weakly ruffling cellswith a borderline phenotype which are difficult to clas-sify, even for a human observer. In agreement with thisinterpretation, a detailed look on the confusion matrixof the 5-fold-cross-validation procedure showed, thatmitotic and non-ruffling cells were mainly correctly pre-dicted (94% and 91%, respectively), in contrast to ruf-fling cells (77%) which were frequently misclassified asnon-ruffling (22%). In further tests with the sameimages, a dataset containing 340 objects with exclusivelystrong phenotypes was classified almost perfectly (5-foldcross-validation accuracy 95%), while another datasetfrom the same image set containing 700 objects trainedin a strictly random and blinded manner yielded a 5-fold cross-validation accuracy of 85.7%.To allow for experimental comparison of the perfor-
mance of different classifiers, our dataset (782 objects)was exported to the open source program WEKA. Wetested a large set of classifiers of which only few algo-rithms approached the accuracy of SVM with an RBF-kernel (additional file 1). From these tests we conclude,that for this dataset the performance of libsvm with anRBF-kernel and our settings cannot easily be outper-formed by other algorithms.When the different object features were ranked by
WEKA for their ability to distinguish ruffling from non-ruffling cells using different algorithms, for instanceSVM attribute selection [37], the object attributesdescribing texture in the actin channel consistentlyranked best followed by our customized object attri-butes. To determine the relationship between the num-ber of available object attributes and the 5-fold cross-validation accuracy, we systematically tested the perfor-mance of our classifier using increasing numbers ofobject attributes. We started with one attribute andadded more attributes in the order suggested by theSVM attribute selection algorithm and optimized thekernel parameters C and gamma. A set of 28 objectattributes performed best, achieving a 5-fold cross-vali-dation accuracy of 89%, thereby marginally exceedingthe cross-validation accuracy of the whole set of objectattributes. Object attribute selection (restricting trainingto a subset of object attributes) has the additional
advantage of decreasing training time. Nevertheless, amodel for this dataset could be calculated in only 2 sec-onds on a desktop computer, therefore no furtherattempts were made. Object attribute selection algo-rithms are currently not supported by Enhanced Cell-Classifier but will be the scope of future developments.In summary, Enhanced CellClassifier could identify
mitotic and non-ruffling cells with high and rufflingcells with moderate accuracy. Using our tool in the “cor-rection” training mode, the biologist can directly visua-lize the predictions of the model on different images;this increases the confidence of the researcher to theanalysis algorithm. Subsequently, the model was appliedto the complete dataset of the biological experiment. Asshown in Figure 3, frequent ruffling was observed undercontrol conditions; in contrast, without HGF, only back-ground ruffling was observed. Moreover, elimination ofa critical component of the cascade leading from HGFto actin polymerization also reduced ruffling: AftersiRNA mediated knockdown of the ACTR3-componentof the Arp2/3 complex, ruffling was reduced to back-ground. Therefore, Enhanced CellClassifier can automa-tically analyze HGF-induced ruffling. This could beuseful for future identification of new intracellular pro-teins important for ruffling.Biological example 2: Docking of Salmonella onto HeLacellsSalmonella Typhimurium is an important food bornepathogen causing diarrhea and rarely systemic disease.Central to the pathogenesis by Salmonella is its ability toinvade epithelial cells [38,39]. Docking onto cells is thefirst crucial step of the infection by Salmonella. This pro-cess can be studied in tissue culture: Cells were incubatedwith the non-invasive Salmonella Typhimurium strainM566 (SL1344 ΔSipA, ΔSopBEE2, [40]) for 6 minutes,washed and fixed. Nuclei were visualized using DAPI,Salmonella by indirect immunofluorescence in the greenchannel using a rabbit antibody directed against the O-side chain of LPS (Difco). 4 images per well wereacquired with a 4×-objective. Using CellProfiler modules,nuclei could be identified in the DAPI-images. Cells weredefined by expansion of the area of the nucleus. Infec-tious “spots” representing single bacteria or a small num-ber of Salmonella cells were identified as independentobjects in the green channel. During CellProfiler analysisinter-object data were collected: the relationship of spotsand cells was determined using the CellProfiler module“relate": any spot overlapping with a cell was labeled thechild of this cell. In addition, neighborhood informationof different cells was also calculated.When looking at the microscopy images, a striking
preference of Salmonella for mitotic cells was observed(Figure 4). Salmonella were also enriched at cells adja-cent to mitotic cells. Therefore, when investigating the
Misselwitz et al. BMC Bioinformatics 2010, 11:30http://www.biomedcentral.com/1471-2105/11/30
Page 10 of 13
docking process, the researcher would like to quantifydocking properties for 3 types of cells: mitotic cells,neighbors of mitotic cells and non-mitotic cells.Nuclei of mitotic cells can easily be recognized in the
DAPI-channel by the human observer. However, forautomated analysis more than one object attribute wasnecessary (not shown). Therefore, the final analysis wasdone using Enhanced CellClassifier. Two classes weredefined: mitotic and non-mitotic nuclei and trained firstin the “default” training mode, followed by a refinementof a model in the “correction” training mode. The finaldata set contained 2001 objects from samples of forty96-well plates of 2 independent experiments.Object attributes, measured by CellProfiler available to
the classifier were intensity and texture measurementsof the nuclei in the DAPI-channel (for explanation seebiological example 1). The object attributes ranking bestaccording to their ability to distinguish between classes[37] included intensity measurements followed by Gaborand Haralick features (not shown). The combination ofthese object attributes enabled the SVM-algorithm toreliably distinguish between mitotic and non-mitoticnuclei with a 5-fold cross-validation accuracy of 96.0%.Using a large data set including 2000 cells was notnecessary to achieve reliable discrimination between theclasses, since 5-fold cross-validation accuracies above93% were consistently achieved with random samples assmall as 250 objects. Nevertheless, a larger data set didnot require extensive computational power, since calcu-lations needed only 2.5 seconds on a desktop computer.Other classifiers performed equally well on this data
set: after exporting the training data set to WEKA, 5-fold cross-validation accuracies ranging from 94% to97% were obtained with the 20 algorithms tested (addi-tional file 1).For the summary of the data 3 vectors were calcu-
lated: one with information about the cell cycle (mitotic,non mitotic), the second with information about neigh-borhood to mitotic cells and a third with informationabout associated spots. Combining these three vectorsyielded all the desired subtypes of cells (Figure 4). Asshown in Figure 4C, mitotic cells, neighbors of mitoticcells and normal cells differ greatly in the percentage ofdocked Salmonella. To the best of our knowledge, thisis the first demonstration of the docking preference ofSalmonella to mitotic cells; however, the biological basisfor this interesting phenomenon remains elusive. In anycase, to investigate the docking process independentlyfrom the cell cycle, the user can now concentrate on thepurged cell population.Experimental comparison of Enhanced CellClassifier withCP AnalystWe wanted to compare our new tool with existing soft-ware; among the available open-source software only the
program CellProfiler Analyst (CP Analyst) was devel-oped with a similar scope as our tool: flexible imageanalysis using machine learning algorithms for biologistswithout the need for scripting.We compared several aspects of the two programs
including the scope of the classifier, the training process,and the user interface and export options. Importantly,CP Analyst is limited to 2 class classification where asEnhanced CellClassifier can manage up to 5 differentclasses. This is a limitation for the analysis of manycomplex biological phenotypes. For the training process,both, CP Analyst and Enhanced CellClassifier provideinnovative methods. In CP Analyst, the algorithm selectsfor presentation of an adjustable number of objects,either randomly or of the “positive” or “negative” pheno-type; these objects are chosen to be close to the decisionboundaries of the current model and can quicklyimprove the current model. The different trainingoptions of our tool have been described above. In CPAnalyst, the user interface is less friendly and offers verylittle flexibility. The objects are presented to the user aslittle image snippets which have to be sorted into a binof positive and negative objects. Therefore, visual judg-ment of the object phenotypes becomes extremely diffi-cult. In contrast, Enhanced CellClassifier offers manyoptions for image presentation in order to ease visualinspection and training. Furthermore, Enhanced Cell-Classifier provides a visual feedback of the currentmodel on the whole image which allows for immediateevaluation of the performance of the current model. Incontrast, CP Analyst lacks such a feature. Finally, CPAnalyst uses a MySQL database for data retrieval whichfacilitates quick summarization of data. However, outputoptions were severely limited; for example, the results ofthe 2-class classification cannot be integrated with otherobject information. In addition, customization or well-based data summary were not supported. In compari-son, Enhanced CellClassifier has a dynamic way of inte-grating results with maximum flexibility. This allows theuser to define an output with almost unlimited options(details discussed above).For experimental comparison, we chose our biological
examples mentioned above. For biological example 1,classification had to be simplified since CP Analyst onlysupports two classes; mitotic cells therefore could notbe simultaneously identified. However, the programcould clearly distinguish ruffling and non-ruffling cellsand recognized the phenotypes of the RNAis tested inthis experiment (not shown). In biological example 2,the program could learn to distinguish mitotic fromnon-mitotic cells, however, the differential analysis wedid with Enhanced CellClassifier to measure the percen-tage of infected cells for mitotic cells, its neighbors andinterphase cells were not possible with CP Analyst.
Misselwitz et al. BMC Bioinformatics 2010, 11:30http://www.biomedcentral.com/1471-2105/11/30
Page 11 of 13
In summary, while classification of biological objects isalso possible in CP Analyst, the user is restricted to two-class classification and an inflexible display and outputwhich only provides most basic analysis options. Mostlikely, these problems will be solved in the next versionof this software, Classifier 2.0, which is not available forwindows yet.
ConclusionIn summary, Enhanced CellClassifier is a user-friendlyand intuitive tool which allows multi-class classificationof biological objects in many intuitive and performanceenhancing training modes. For feature integration, clas-sification information can subsequently be combinedwith data about inter-object relationships and objectmeasurements, greatly enhancing the evaluation options.Further useful features are focus exclusion, well sum-mary, and specific calculation and normalizationoptions. The output function which can be defined bythe user within broad ranges should cover many needsof image analysis in a biological setting. Our tool greatlyfacilitates image analysis for biologists without requiringprogramming skills.
Availability and requirementsProject name: Enhanced CellClassifierWeb page: http://www.micro.biol.ethz.ch/downloadsOperating system: Platform independentProgramming language: MatlabOther requirements: Matlab 7, full version, release
2008a or laterLicense: GNU GPL
List of abbreviationsDAPI: 4’,6-diamidino-2-phenylindole; HGF: hepatocytegrowth factor; RBF: radial basis function; SVM: supportvector machine; TRITC: Tetramethyl rhodamine iso-thiocyanate; WEKA: Waikato environment for knowl-edge analysis
Additional file 1: Comparison of SVM with RBF kernel with otherclassifiers. Classifiers were tested using WEKA [19]. Meta-classifiers weretested in combination with the classifiers performing best when testedalone including Random Forrest, J48, Simple Logistic and Decisionstump. Please refer to the documentation of the WEKA program for adetailed description of the classifiers and respective references.Click here for file[ http://www.biomedcentral.com/content/supplementary/1471-2105-11-30-S1.DOCX ]
AcknowledgementsThe authors would like to thank Michael Held and Jonathan Oakley forstimulating discussions, Matthias Truttmann, Kerstin Weidner, VanessaLandtwing, Alexander Sturm, Patrick Kaiser, Pascale Vonaesch, Stefano Bruniand Laura Falter for critical feedback on the program, Florian Strittmatter for
help with the figures, Jacques Laville and the management of the Brutuscluster at ETH for excellent IT-support, Kumaran Kandasamy for help withthe MySQL database and Pascale Vonaesch for critical reading of themanuscript. BM and WDH were supported by a grant from the Bonizzi-Theler foundation and by a grant from UBS. The project was financed inpart by a grant (InfectX) from the Swiss SystemsX.ch initiative, evaluated bythe Swiss National Science Foundation. BP is supported by a grant from theUBS Optimus foundation.
Author details1Institute of Microbiology, ETH Zurich, Wolfgang Pauli-Str. 10, 8093 Zürich,Switzerland. 2Light Microscopy Centre, Institute of Biochemistry, ETH Zürich,Schafmattstr. 18, 8093 Zürich, Switzerland.
Authors’ contributionsBM designed and developed the program, did the Salmonella experimentsand wrote the paper. GS designed and performed the HGF experiments. BPparticipated in interpretation of the data, and writing of the manuscript. MS,PH, KK participated in interpretation of the data. SR performed theSalmonella experiments. WDH designed the research and participated ininterpretation of the data and writing of the manuscript. All authors readand approved the final version of the manuscript.
Competing interestsThe authors declare that they have no competing interests.
Received: 11 June 2009Accepted: 14 January 2010 Published: 14 January 2010
References1. Eggert US, Mitchison TJ: Small molecule screening by imaging. Curr Opin
Chem Biol 2006, 10(3):232-237.2. Carpenter AE: Image-based chemical screening. Nat Chem Biol 2007,
3(8):461-465.3. Cortes C, Vapnik V: Support vector networks. Machine Learning 1995,
20:273-297.4. Carpenter AE, Jones TR, Lamprecht MR, Clarke C, Kang IH, Friman O,
Guertin DA, Chang JH, Lindquist RA, Moffat J, et al: CellProfiler: imageanalysis software for identifying and quantifying cell phenotypes.Genome Biol 2006, 7(10):R100.
5. Jones TR, Carpenter AE, Lamprecht MR, Moffat J, Silver SJ, Grenier JK,Castoreno AB, Eggert US, Root DE, Golland P, et al: Scoring diverse cellularmorphologies in image-based screens with iterative feedback andmachine learning. Proc Natl Acad Sci USA 2009, 106(6):1826-1831.
6. Jones TR, Kang IH, Wheeler DB, Lindquist RA, Papallo A, Sabatini DM,Golland P, Carpenter AE: CellProfiler Analyst: data exploration andanalysis software for complex image-based screens. BMC Bioinformatics2008, 9:482.
7. Hamilton NA, Pantelic RS, Hanson K, Teasdale RD: Fast automated cellphenotype image classification. BMC Bioinformatics 2007, 8:110.
8. Nanni L, Lumini A: A reliable method for cell phenotype imageclassification. Artif Intell Med 2008, 43(2):87-97.
9. Chen SC, Murphy RF: A graphical model approach to automatedclassification of protein subcellular location patterns in multi-cell images.BMC Bioinformatics 2006, 7:90.
10. Wang M, Zhou X, Li F, Huckins J, King RW, Wong ST: Novel cellsegmentation and online SVM for cell cycle phase identification inautomated microscopy. Bioinformatics 2008, 24(1):94-101.
11. Lebrun G, Charrier C, Lezoray O, Meurie C, Cardot H: A fast and efficientsegmentation scheme for cell microscopic image. Cell Mol Biol (Noisy-le-grand) 2007, 53(2):51-61.
12. Loo LH, Wu LF, Altschuler SJ: Image-based multivariate profiling of drugresponses from single cells. Nat Methods 2007, 4(5):445-453.
13. Adams CL, Kutsyy V, Coleman DA, Cong G, Crompton AM, Elias KA,Oestreicher DR, Trautman JK, Vaisberg E: Compound classification usingimage-based cellular phenotypes. Methods Enzymol 2006, 414:440-468.
14. Bakal C, Aach J, Church G, Perrimon N: Quantitative morphologicalsignatures define local signaling networks regulating cell morphology.Science 2007, 316(5832):1753-1756.
Misselwitz et al. BMC Bioinformatics 2010, 11:30http://www.biomedcentral.com/1471-2105/11/30
Page 12 of 13
15. Wang J, Zhou X, Bradley PL, Chang SF, Perrimon N, Wong ST: Cellularphenotype recognition for high-content RNA interference genome-widescreening. J Biomol Screen 2008, 13(1):29-39.
16. Neumann B, Held M, Liebel U, Erfle H, Rogers P, Pepperkok R, Ellenberg J:High-throughput RNAi screening by time-lapse imaging of live humancells. Nat Methods 2006, 3(5):385-390.
17. Huang CR, Chung PC, Sheu BS, Kuo HJ, Popper M: Helicobacter pylori-related gastric histology classification using support-vector-machine-based feature selection. IEEE Trans Inf Technol Biomed 2008, 12(4):523-531.
18. Abramoff MD, Magelhaes PJ, Ram SJ: Image Processing with ImageJ.Biophotonics International 2004, 11(7):36-42.
19. Hall M, Eibe F, Holmes G, Pfahringer B, Reutemann P, Witten IH: The WEKAData Mining Software: An Update. SIGKDD Explorations 2009, 11(1):10-18.
20. Mayo M, Watson AT: Automatic species identification of live moths.Knowledge-Based Systems 2007, 20(2):195-202.
21. R Development Core Team: R: A language and environment for statisticalcomputing.http://www.R-project.org.
22. Boutros M, Bras LP, Huber W: Analysis of cell-based RNAi screens. GenomeBiol 2006, 7(7):R66.
23. Shamir L, Orlov N, Eckley DM, Macura T, Johnston J, Goldberg IG: Wndchrm- an open source utility for biological image analysis. Source Code BiolMed 2008, 3:13.
24. Ivanciuc O: Applications of Support Vector Machines in Chemistry.Reviews in Computational Chemistry 2007, 23:291-400.
25. Chang CC, Lin CJ: LIBSVM: a library for support vector machines 2001http://www.csie.ntu.edu.tw/~cjlin/libsvm.
26. Hsu CW, Chang CC, Lin CJ: A practical guide to support vector classification2009http://www.csie.ntu.edu.tw/~cjlin.
27. Witten IA, Frank E: Data Mining: Practical machine learning tools andtechniques. San Francisco: Morgan Kaufmann, 2 2005.
28. Kozak K, Firkowski A, Csucs G: Open source data management in highcontent screening technology. European Pharmaceutical Review 2009, 1:16-24.
29. Ravkin I, Temov V: Bit representation techniques and image processing.Applied Informatics 1988, 14:41-90.
30. Vincent L: Granulometries and Opening Trees. Fundamenta Informaticae2000, 41:57-90.
31. Buccione R, Orth JD, McNiven MA: Foot and mouth: podosomes,invadopodia and circular dorsal ruffles. Nat Rev Mol Cell Biol 2004,5(8):647-657.
32. Palamidessi A, Frittoli E, Garre M, Faretta M, Mione M, Testa I, Diaspro A,Lanzetti L, Scita G, Di Fiore PP: Endocytic trafficking of Rac is required forthe spatial restriction of signaling in cell migration. Cell 2008, 134(1):135-147.
33. Haralick RM, Shanmugam K, Dinstein IH: Textural features for imageclassification. IEEE Transactions on Systems Man and Cybernetics 1973, 3:610-621.
34. Gabor D: Theory of communication. Journal of the Institute of ElectricalEngineers 1946, 93:429-441.
35. Otsu N: A Threshold Selection Method from Gray-Level Histograms. IEEETransactions on Systems, Man and Cybernetics 1979, 9(1):62-66.
36. te Brake GM, Karssemeijer N, Hendriks JH: An automatic method todiscriminate malignant masses from normal tissue in digitalmammograms. Phys Med Biol 2000, 45(10):2843-2857.
37. Guyon I, Weston J, Barnhill S, Vapnik V: Gene selection for cancerclassification using support vector machines. Machine Learning 2002,46:389-422.
38. Schlumberger MC, Hardt WD: Salmonella type III secretion effectors:pulling the host cell’s strings. Curr Opin Microbiol 2006, 9(1):46-54.
39. Lara-Tejero M, Galan JE: The Salmonella Typhimurium SPI-1 type IIIsecretion translocases mediate intimate attachment to non-phagocyticcells. Infect Immun 2009, 77(7):2635-2642.
40. Ehrbar K, Friebel A, Miller SI, Hardt WD: Role of the Salmonellapathogenicity island 1 (SPI-1) protein InvB in type III secretion of SopEand SopE2, two Salmonella effector proteins encoded outside of SPI-1. JBacteriol 2003, 185(23):6950-6967.
doi:10.1186/1471-2105-11-30Cite this article as: Misselwitz et al.: Enhanced CellClassifier: a multi-classclassification tool for microscopy images. BMC Bioinformatics 2010 11:30.
Publish with BioMed Central and every scientist can read your work free of charge
"BioMed Central will be the most significant development for disseminating the results of biomedical research in our lifetime."
Sir Paul Nurse, Cancer Research UK
Your research papers will be:
available free of charge to the entire biomedical community
peer reviewed and published immediately upon acceptance
cited in PubMed and archived on PubMed Central
yours — you keep the copyright
Submit your manuscript here:http://www.biomedcentral.com/info/publishing_adv.asp
BioMedcentral
Misselwitz et al. BMC Bioinformatics 2010, 11:30http://www.biomedcentral.com/1471-2105/11/30
Page 13 of 13