Embed Size (px)
Citation preview
ZmCCT and the genetic basis of day-length adaptationunderlying the postdomestication spread of maizeHsiao-Yi Hunga,1, Laura M. Shannonb,1, Feng Tianc,d,1, Peter J. Bradburyd,e, Charles Chenf, Sherry A. Flint-Garciag,h,Michael D. McMulleng,h, Doreen Waree,i, Edward S. Bucklerd,e, John F. Doebleyb, and James B. Hollanda,j,2
aDepartment of Crop Science, North Carolina State University, Raleigh, NC 27695; bDepartment of Genetics, University of Wisconsin, Madison, WI 53706;cNational Maize Improvement Center, China Agricultural University, Beijing 100193, China; dInstitute for Genomic Diversity, Department of Plant Genetics andBreeding, Cornell University, Ithaca, NY 14853; ePlant, Soil, and Nutrition Research Unit, United States Department of Agriculture Agricultural ResearchService, Ithaca, NY 14853; fDepartment of Plant Breeding and Genetics, Cornell University, Ithaca, NY 14850; gDivision of Plant Sciences, University of Missouri,Columbia, MO 65211; hPlant Genetics Research Unit, United States Department of Agriculture Agricultural Research Service, Columbia, MO 65211; iColdSpring Harbor Laboratory, Cold Spring Harbor, NY 11724; and jPlant Science Research Unit, United States Department of Agriculture Agricultural ResearchService, Raleigh, NC 27695
Edited by Detlef Weigel, Max Planck Institute for Developmental Biology, Tübingen, Germany, and approved May 28, 2012 (received for review February24, 2012)
Teosinte, the progenitor of maize, is restricted to tropical environ-ments in Mexico and Central America. The pre-Columbian spread ofmaize from its center of origin in tropical Southern Mexico to thehigher latitudes of the Americas required postdomestication selec-tion for adaptation to longer day lengths. Flowering time ofteosinte and tropical maize is delayed under long day lengths,whereas temperate maize evolved a reduced sensitivity to photo-period. We measured flowering time of the maize nested associa-tion and diverse association mapping panels in the field under bothshort and long day lengths, and of a maize-teosinte mappingpopulation under long day lengths. Flowering time in maize isa complex trait affected by many genes and the environment.Photoperiod response is one component of flowering time in-volving a subset offlowering time geneswhose effects are stronglyinfluenced by day length. Genome-wide association and targetedhigh-resolution linkagemapping identified ZmCCT, a homologue ofthe rice photoperiod response regulator Ghd7, as the most impor-tant gene affecting photoperiod response in maize. Under long daylengths ZmCCT alleles from diverse teosintes are consistentlyexpressed at higher levels and confer later flowering than temper-ate maize alleles. Many maize inbred lines, including some adaptedto tropical regions, carry ZmCCT alleles with no sensitivity to daylength. Indigenous farmers of the Americas were remarkably suc-cessful at selecting on genetic variation at key genes affecting thephotoperiod response to create maize varieties adapted to vastlydiverse environments despite the hindrance of the geographic axisof the Americas and the complex genetic control of flowering time.
genetic diversity | quantitative trait locus
The rapid spread of agriculture from the Fertile Crescent wasenabled in part by the East–West axis of Eurasia, permitting
crop cultivation to spread across large geographic regions ata common latitude (1). The relatively simple genetic control offlowering time of the key crops domesticated in the Fertile Cres-cent, wheat and barley (2), coupled with a predominantly self-fertilizing mating system, also facilitated colonization of newenvironments by rare mutants with large effects on flowering timeresponses to day length and temperature.In contrast, the spread of maize from its origin in Southern
Mexico 6 to 10,000 y ago was relatively slow (1), hindered by theNorth–South axis of the Americas. Maize (Zea mays L. subsp.mays) was domesticated from the Mexican native teosinte ZeamaysL. subsp. parviglumis (3), a species adapted to day lengths lessthan 13 h. Under the longer day lengths of higher latitudes, teo-sinte flowers very late or not at all (4). From its Meso-Americanorigin, maize was spread by early humans to geographically andecologically diverse environments from Canada to Chile well be-fore the arrival of Columbus to the Americas (5, 6), requiring itsadaptation to long day lengths. Thus, although the spread of maize
occurred later than that of wheat, it was a remarkable achievement,given its ancestral adaptation to short day lengths, outcrossingmating habit, and complex genetic regulation of flowering time (7).The complexity of maize flowering time has hindered the iden-
tification of genes regulating its initiation of flowering. The fewmaize flowering time genes identified to date (8–11) appear tocontrol only a small amount of the standing genetic variation for thephotoperiod response (12, 13). Here we analyzed the floweringtime photoperiod response of the maize nested association map-ping (NAM) population, a set of 5,000 mapping lines derived from25 related crosses that enables powerful, comprehensive linkageanalysis of complex traits (7, 14). We used a genome-wide associ-ation study (GWAS) based on a dense maize haplotype map (15),taking advantage of the control over population structure and ge-netic background variation permitted by NAM (16, 17). Targetedhigh-resolution genetic mapping was used to resolve a key quanti-tative trait locus (QTL) on chromosome 10 to a single gene,ZmCCT. The expression and phenotypic effect of ZmCCT allelesfrom teosinte uniformly conferred late flowering under long daylengths. Thus, the spread of maize to higher latitudes appeared torequire the selection by prehistoric humans of rare mutations atZmCCT and a few other critical genes that reduced sensitivity tolong day lengths.
ResultsGenetic Architecture of Flowering Time Photoperiod Response. Wemeasured the photoperiod response of the maize NAM recombi-nant inbred lines (RILs) by evaluating their flowering time in eightlong-day length and three short-day length environments. Thermaltime [i.e., growing degree days (GDDs)] to flowering was mea-sured within each environment to minimize the effect of temper-ature differences among environments on the observed floweringtimes (Dataset S1). Photoperiod response for each RIL wasmeasured as the difference in mean thermal time to floweringbetween long- and short-day length environments (Dataset S2).
Author contributions: M.D.M., D.W., E.S.B., J.F.D., and J.B.H. designed research; H.-Y.H.,L.M.S., F.T., S.A.F.-G., M.D.M., and J.B.H. performed research; H.-Y.H., L.M.S., F.T., P.J.B.,C.C., and J.B.H. analyzed data; and H.-Y.H., L.M.S., F.T., J.F.D., and J.B.H. wrote the paper.
The authors declare no conflict of interest.
This article is a PNAS Direct Submission.
Freely available online through the PNAS open access option.
Data deposition: Datasets S1, S2, S3, S4, S5, S6, S7, S8, S9, and S10 reported in this paperare deposited on the Panzea Web site, http://www.panzea.org/lit/publication.html#2012.1H.-Y.H., L.M.S., and F.T. contributed equally to this work.2To whom correspondence should be addressed. E-mail: [email protected].
See Author Summary on page 11068 (volume 109, number 28).
This article contains supporting information online at www.pnas.org/lookup/suppl/doi:10.1073/pnas.1203189109/-/DCSupplemental.
www.pnas.org/cgi/doi/10.1073/pnas.1203189109 PNAS | Published online June 18, 2012 | E1913–E1921
AGRICU
LTURA
LSC
IENCE
SPN
ASPL
US

Substantial variation for the response to day length was observedamong the inbred founders of the NAM population (SI Appendix,Fig. S1). Long day lengths delayed flowering time of inbreds fromtropical regions eight times more than inbreds from temperatezones. Photoperiod responses for thermal time to male and femaleflowering were highly correlated (r = 0.92; P < 0.0001) and hadsimilar QTL positions (Fig. 1 and SI Appendix, Table S1 and Fig.S2); we focus on time to female flowering (i.e., silking) because ofits higher heritability (76%). Family main effects and 14 QTLsdetected with joint linkage analysis explained 98% of the geneticvariation in NAM (Figs. 1 and 2 and SI Appendix, Table S2 andDataset S3). Prediction of founder photoperiod responses with theadditive joint linkage model was as accurate as possible given theheritability of the trait (r2 = 75%; SI Appendix, Fig. S3).The 14 photoperiod response QTL largely represent a subset of
the 39 flowering time per se QTLs previously identified in NAMunder the same long-day length environments (7): 13 of 14 pho-toperiod responseQTL intervals are within 5 cMof amarker at thepeak of a long-day length flowering time per se QTL (SI Appendix,Table S1 andDataset S3). To directly compare the number ofQTLfor photoperiod response vs. long-day length flowering time with-out the confounding effects of methodological differences, wereanalyzed the long-day length flowering time data by using thesame scale (i.e., GDDs) and statistical threshold, resulting in de-tection of 29 QTL for flowering time per se, still more than twicethe number of photoperiod responseQTL (SI Appendix, Table S1).The magnitude of QTL effects for photoperiod response and long-day-length flowering time measured in GDDs was similar (DatasetS4). For example, the strongest allele effect on both traits wasconferred by the CML277 allele at chromosome 10QTL; the effectwas similar in magnitude for both traits [27 GDDs or 1.7 d on long-day length flowering time (7) and 31 GDDs on photoperiod re-sponse]. The total phenotypic variation was smaller for photope-riod response than for long-day length flowering time; however,therefore, the phenotypic variance associated with individual QTLwas greater for photoperiod response (mean 2.7% and maximum
9.0% of variation for photoperiod QTL vs. mean 1.1% and maxi-mum 4.1% for long-day length flowering time QTL; SI Appendix,Table S2).Whereas flowering time was highly consistent across long-day
length environments (7), photoperiod differences substantiallyincreased the ratio of genotype-by-environment interaction togenotypic variation when short day lengths were included in theenvironment sample (0.18 vs. 0.10; SI Appendix, Table S3). Whenthis ratio was partitioned between families derived from tropical ortemperate parents crossed to B73, the results were even morestriking (0.35 for tropical families, 0.04 for temperate families; SIAppendix, Table S3). In summary, photoperiod response in maizeis under modestly complex genetic control, regulated by at least 14QTLs, but represents one component of the more complex flow-ering time per se, with fewer genes controlling the component trait.Dissection of a complex trait into its components aids high-reso-lution genetic analysis.Four of five QTL with largest effects (collectively explaining
more than 20% of the phenotypic variation) coincided with themost important QTL detected in an independent study (12). TheQTL explaining the most variation and expressing the strongestallele effects mapped to chromosome 10 (Figs. 1 and 2); the im-portance of this region has been observed consistently acrossmaizephotoperiodmapping studies (12, 18, 19). Alleles at this locus havehighly heterogeneous effects, even within the tropical subgroup offounder lines (Fig. 1 and Dataset S5). Only three tropical linescarry alleles that significantly increase the photoperiod response,and the alleles from tropical founders Ki3 and CML333 reduce thephotoperiod effect relative to the temperate reference founderB73 allele (Fig. 1) (20). The allele from temperate founder Ky21increases photoperiod response for time to anthesis, although notfor silking (Fig. 1 and SI Appendix, Fig. S2). Although the alleleconferring a strong photoperiod response at thisQTL segregates inonly three NAM families, its effect in those families is so great thatit explains more phenotypic variation than any other QTL (Fig. 1).The distribution of allelic effects in the NAM founders varieswidely among the photoperiod QTLs. For example, the rarity ofthe photoperiod sensitive allele at chromosome 10 contrasts withthe more common occurrence of photoperiod-sensitive alleles intropical lines at key QTLs on chromosomes 1, 8, and 9 (Fig. 1).The sensitivity of allelic effects at photoperiod-response QTLs
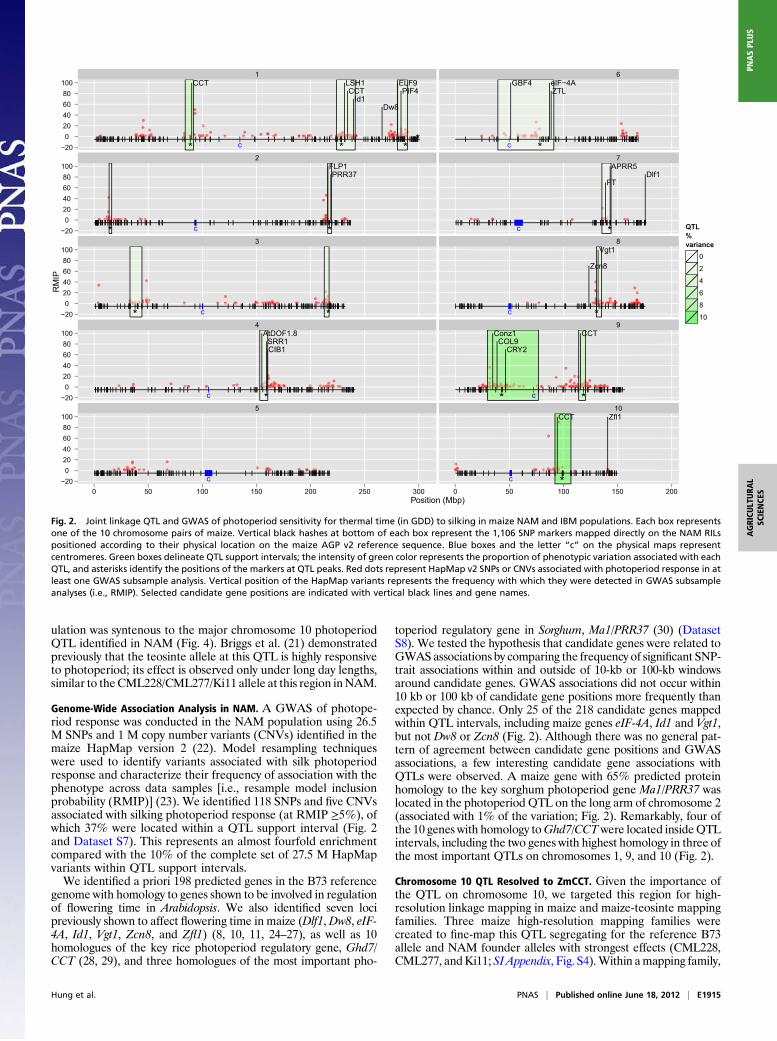
can be seen by comparing their effects on flowering time acrossindividual environments (Fig. 3). For example, the tropical founderalleles with strongest photoperiod response at the chromosome 10QTL had reduced effects under short day lengths and consistentlystrong positive effects under long day lengths (Fig. 3). Almost alltropical alleles at the chromosome 9 (45 cM)QTL had consistentlynegative (i.e., shorter flowering time) effects under short daylengths and positive effects under most long day lengths. The twoNorth Carolina environments presented an exception to the pat-tern, however, with many tropical alleles having negative effects,perhaps because of the slightly shorter day length (14 h) in the earlygrowing season compared with the other long-day length envi-ronments (> 15 h day lengths). At the chromosome 8QTL, tropicalalleles had larger positive effects under long than short day lengths,but many temperate alleles had amarkedly opposite response, withincreasingly negative effects under long day lengths, reducing thephotoperiod responses of those lines.To gain insights into the evolutionary changes that occurred
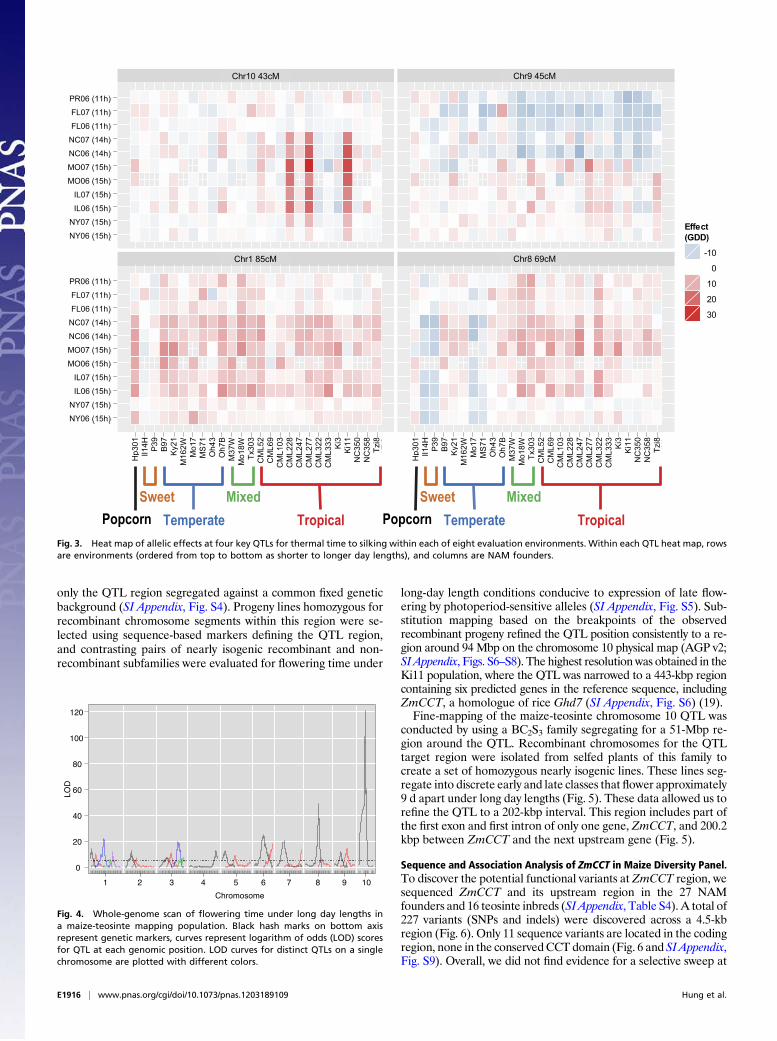
during and following domestication of maize from teosinte, weperformed a parallel linkage analysis of flowering time in a pop-ulation of 866 RILs derived from backcrosses of teosinte toa temperate maize line. We identified 23 QTLs controlling 74% ofthe phenotypic variation for flowering time under long day lengths(Fig. 4). NAM QTL peaks for days to anthesis under long daylengths were within 5 cM of the support intervals of approximatelyhalf (n = 13) of these maize-teosinte QTL (Dataset S6) (7). Themost important flowering time QTL in the maize-teosinte pop-
Hp3
01Il 1
4H P39
B 97
Ky21
M16
2WM
o17
MS7
1O
h 43
Oh7
BM
3 7W
Mo1
8WTx
303
CM
L52
CM
L69
CM
L103
CM
L228
CM
L247
CM
L277
CM
L322
CM
L333 Ki
3Ki
11N
C35
0N
C3 5
8Tz
i8
MixedTemperate
SweetTropicalPopcorn
Effect (GDD)
2Pσ
%QTL peak
Chr cMAGP2
Mb10 43 98.7
9 45 42.89 57 118.51 85 89.08 69 130.73 128 216.42 127 217.73 56 37.94 70 159.11 182 287.71 135 228.62 41 14.86 11 78.27 75 142.8
Nf9 78 135 104 192 72 122 81 51 51 31 61 51 41 5
Fig. 1. Heatmap of NAMQTL effects for photoperiod effect on thermal timeto silking. Rows of the heat map correspond to the 14 QTLs for silking pho-toperiod response, ordered by the proportion of variation they explain (inpercentageof σ2P). Columns correspond to the 25 diverse founders of NAMandthe Mo17 founder for IBM population, ordered according to subpopulationassignment. QTL alleles that are significantly (<5% false discovery rate) dif-ferent from the B73 reference allele are represented with boxed outlines anddots. The number of founders (Nf) segregating for significant allele effects foreach QTL are shown on the right.
E1914 | www.pnas.org/cgi/doi/10.1073/pnas.1203189109 Hung et al.
ulation was syntenous to the major chromosome 10 photoperiodQTL identified in NAM (Fig. 4). Briggs et al. (21) demonstratedpreviously that the teosinte allele at this QTL is highly responsiveto photoperiod; its effect is observed only under long day lengths,similar to theCML228/CML277/Ki11 allele at this region inNAM.
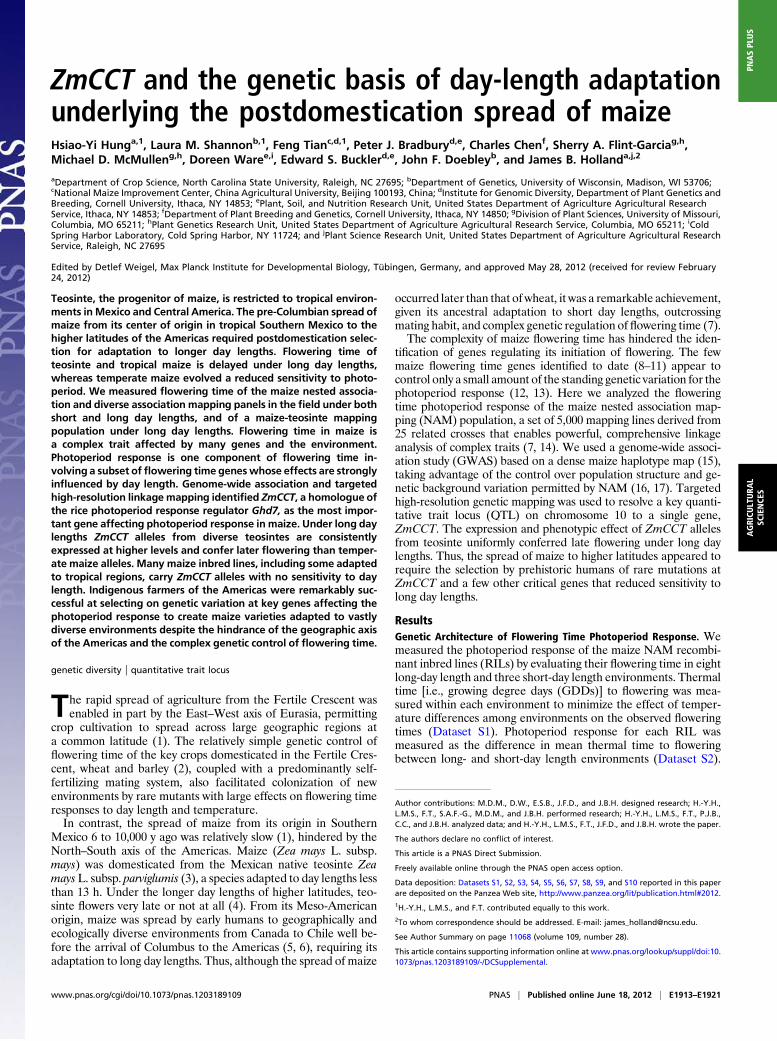
Genome-Wide Association Analysis in NAM. A GWAS of photope-riod response was conducted in the NAM population using 26.5M SNPs and 1 M copy number variants (CNVs) identified in themaize HapMap version 2 (22). Model resampling techniqueswere used to identify variants associated with silk photoperiodresponse and characterize their frequency of association with thephenotype across data samples [i.e., resample model inclusionprobability (RMIP)] (23). We identified 118 SNPs and five CNVsassociated with silking photoperiod response (at RMIP ≥5%), ofwhich 37% were located within a QTL support interval (Fig. 2and Dataset S7). This represents an almost fourfold enrichmentcompared with the 10% of the complete set of 27.5 M HapMapvariants within QTL support intervals.We identified a priori 198 predicted genes in the B73 reference
genome with homology to genes shown to be involved in regulationof flowering time in Arabidopsis. We also identified seven locipreviously shown to affect flowering time in maize (Dlf1,Dw8, eIF-4A, Id1, Vgt1, Zcn8, and Zfl1) (8, 10, 11, 24–27), as well as 10homologues of the key rice photoperiod regulatory gene, Ghd7/CCT (28, 29), and three homologues of the most important pho-
toperiod regulatory gene in Sorghum, Ma1/PRR37 (30) (DatasetS8). We tested the hypothesis that candidate genes were related toGWAS associations by comparing the frequency of significant SNP-trait associations within and outside of 10-kb or 100-kb windowsaround candidate genes. GWAS associations did not occur within10 kb or 100 kb of candidate gene positions more frequently thanexpected by chance. Only 25 of the 218 candidate genes mappedwithin QTL intervals, including maize genes eIF-4A, Id1 and Vgt1,but not Dw8 or Zcn8 (Fig. 2). Although there was no general pat-tern of agreement between candidate gene positions and GWASassociations, a few interesting candidate gene associations withQTLs were observed. A maize gene with 65% predicted proteinhomology to the key sorghum photoperiod gene Ma1/PRR37 waslocated in the photoperiod QTL on the long arm of chromosome 2(associated with 1% of the variation; Fig. 2). Remarkably, four ofthe 10 genes with homology toGhd7/CCTwere located insideQTLintervals, including the two genes with highest homology in three ofthe most important QTLs on chromosomes 1, 9, and 10 (Fig. 2).
Chromosome 10 QTL Resolved to ZmCCT. Given the importance ofthe QTL on chromosome 10, we targeted this region for high-resolution linkage mapping in maize and maize-teosinte mappingfamilies. Three maize high-resolution mapping families werecreated to fine-map this QTL segregating for the reference B73allele and NAM founder alleles with strongest effects (CML228,CML277, andKi11; SIAppendix, Fig. S4).Within amapping family,
* * *c
CCT LSH1CCT
Id1Dw8
ELF9PIF4
*c
GBF4 eIF−4AZTL
* *c
FLP1PRR37
*c
FT
APRR5Dlf1
* *c *c
Zcn8
Vgt1
*c
AtDOF1.8SRR1CIB1
* *c
Conz1COL9
CRY2
CCT
c *c
CCT Zfl1
1 6
2 7
3 8
4 9
5 10
−20020406080100
−200
20406080100
−200
20406080100
−200
20406080100
−200
20406080100
0 50 100 150 200 250 300 0 50 100 150 200Position (Mbp)
RM
IP
*
QTL%variance
0
2
4
6
8
10
Fig. 2. Joint linkage QTL and GWAS of photoperiod sensitivity for thermal time (in GDD) to silking in maize NAM and IBM populations. Each box representsone of the 10 chromosome pairs of maize. Vertical black hashes at bottom of each box represent the 1,106 SNP markers mapped directly on the NAM RILspositioned according to their physical location on the maize AGP v2 reference sequence. Blue boxes and the letter “c” on the physical maps representcentromeres. Green boxes delineate QTL support intervals; the intensity of green color represents the proportion of phenotypic variation associated with eachQTL, and asterisks identify the positions of the markers at QTL peaks. Red dots represent HapMap v2 SNPs or CNVs associated with photoperiod response in atleast one GWAS subsample analysis. Vertical position of the HapMap variants represents the frequency with which they were detected in GWAS subsampleanalyses (i.e., RMIP). Selected candidate gene positions are indicated with vertical black lines and gene names.
Hung et al. PNAS | Published online June 18, 2012 | E1915
AGRICU
LTURA
LSC
IENCE
SPN
ASPL
US
only the QTL region segregated against a common fixed geneticbackground (SI Appendix, Fig. S4). Progeny lines homozygous forrecombinant chromosome segments within this region were se-lected using sequence-based markers defining the QTL region,and contrasting pairs of nearly isogenic recombinant and non-recombinant subfamilies were evaluated for flowering time under
long-day length conditions conducive to expression of late flow-ering by photoperiod-sensitive alleles (SI Appendix, Fig. S5). Sub-stitution mapping based on the breakpoints of the observedrecombinant progeny refined the QTL position consistently to a re-gion around 94 Mbp on the chromosome 10 physical map (AGP v2;SI Appendix, Figs. S6–S8). The highest resolution was obtained in theKi11 population, where the QTL was narrowed to a 443-kbp regioncontaining six predicted genes in the reference sequence, includingZmCCT, a homologue of rice Ghd7 (SI Appendix, Fig. S6) (19).Fine-mapping of the maize-teosinte chromosome 10 QTL was
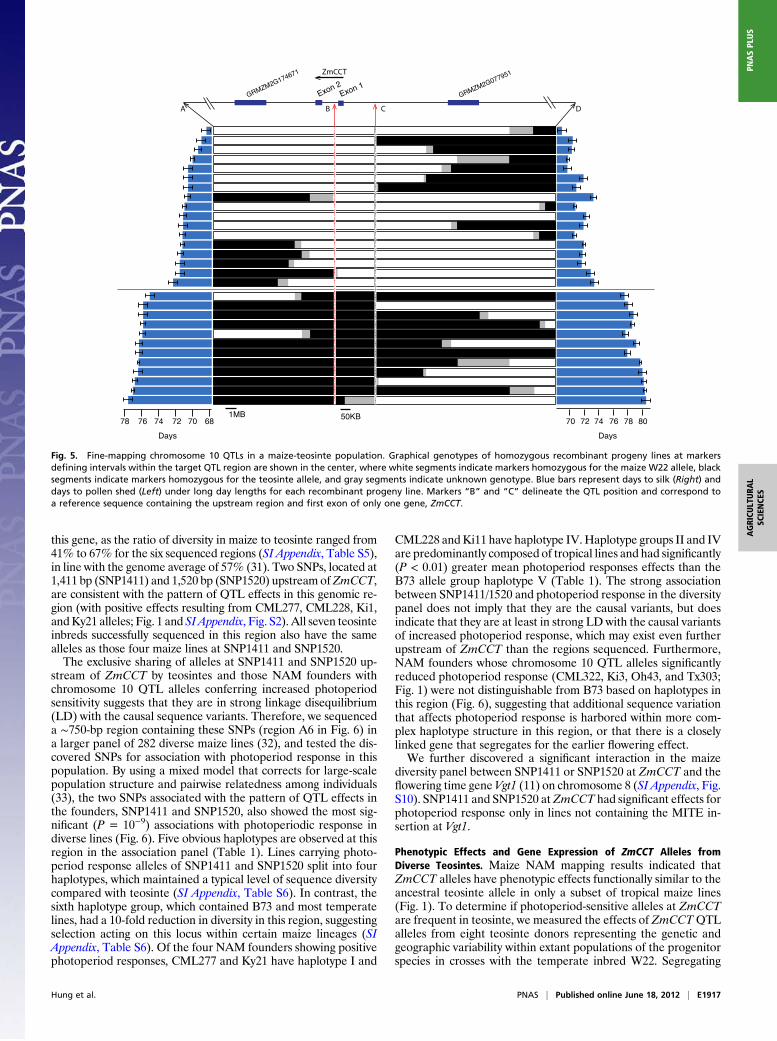
conducted by using a BC2S3 family segregating for a 51-Mbp re-gion around the QTL. Recombinant chromosomes for the QTLtarget region were isolated from selfed plants of this family tocreate a set of homozygous nearly isogenic lines. These lines seg-regate into discrete early and late classes that flower approximately9 d apart under long day lengths (Fig. 5). These data allowed us torefine the QTL to a 202-kbp interval. This region includes part ofthe first exon and first intron of only one gene, ZmCCT, and 200.2kbp between ZmCCT and the next upstream gene (Fig. 5).
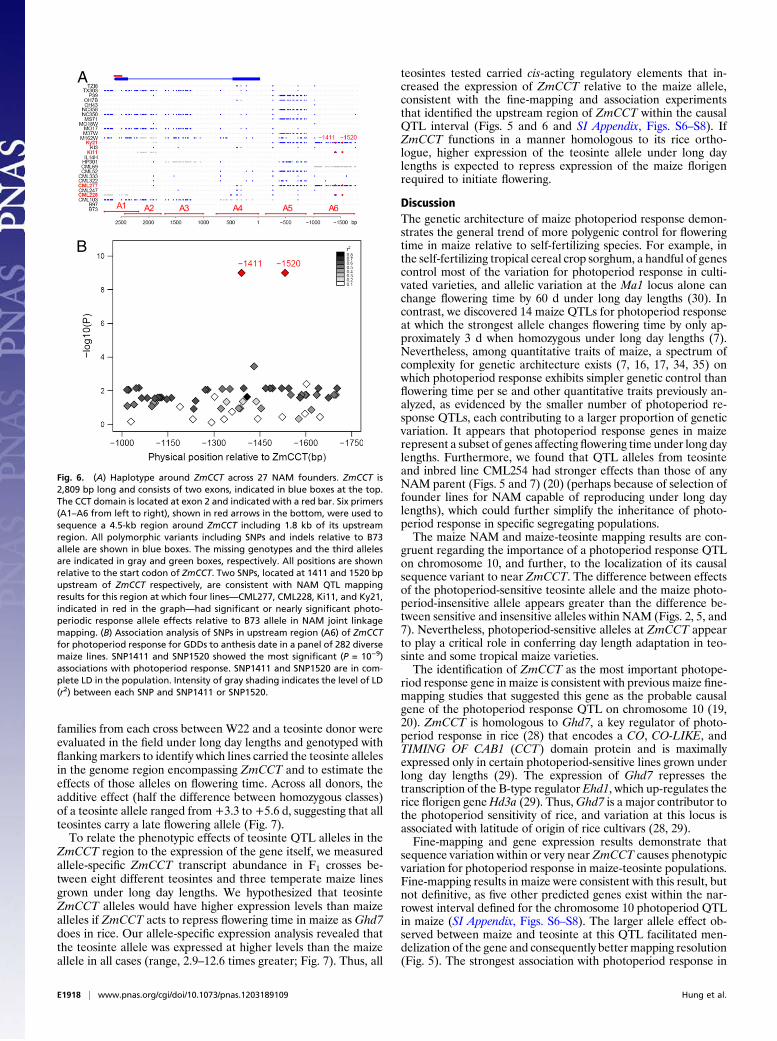
Sequence and Association Analysis of ZmCCT in Maize Diversity Panel.To discover the potential functional variants at ZmCCT region, wesequenced ZmCCT and its upstream region in the 27 NAMfounders and 16 teosinte inbreds (SIAppendix, Table S4). A total of227 variants (SNPs and indels) were discovered across a 4.5-kbregion (Fig. 6). Only 11 sequence variants are located in the codingregion, none in the conservedCCT domain (Fig. 6 and SIAppendix,Fig. S9). Overall, we did not find evidence for a selective sweep at
Fig. 3. Heat map of allelic effects at four key QTLs for thermal time to silking within each of eight evaluation environments. Within each QTL heat map, rowsare environments (ordered from top to bottom as shorter to longer day lengths), and columns are NAM founders.
Fig. 4. Whole-genome scan of flowering time under long day lengths ina maize-teosinte mapping population. Black hash marks on bottom axisrepresent genetic markers, curves represent logarithm of odds (LOD) scoresfor QTL at each genomic position. LOD curves for distinct QTLs on a singlechromosome are plotted with different colors.
E1916 | www.pnas.org/cgi/doi/10.1073/pnas.1203189109 Hung et al.
this gene, as the ratio of diversity in maize to teosinte ranged from41% to 67% for the six sequenced regions (SI Appendix, Table S5),in line with the genome average of 57% (31). Two SNPs, located at1,411 bp (SNP1411) and 1,520 bp (SNP1520) upstream ofZmCCT,are consistent with the pattern of QTL effects in this genomic re-gion (with positive effects resulting from CML277, CML228, Ki1,andKy21 alleles; Fig. 1 and SIAppendix, Fig. S2). All seven teosinteinbreds successfully sequenced in this region also have the samealleles as those four maize lines at SNP1411 and SNP1520.The exclusive sharing of alleles at SNP1411 and SNP1520 up-
stream of ZmCCT by teosintes and those NAM founders withchromosome 10 QTL alleles conferring increased photoperiodsensitivity suggests that they are in strong linkage disequilibrium(LD) with the causal sequence variants. Therefore, we sequenceda ∼750-bp region containing these SNPs (region A6 in Fig. 6) ina larger panel of 282 diverse maize lines (32), and tested the dis-covered SNPs for association with photoperiod response in thispopulation. By using a mixed model that corrects for large-scalepopulation structure and pairwise relatedness among individuals(33), the two SNPs associated with the pattern of QTL effects inthe founders, SNP1411 and SNP1520, also showed the most sig-nificant (P = 10−9) associations with photoperiodic response indiverse lines (Fig. 6). Five obvious haplotypes are observed at thisregion in the association panel (Table 1). Lines carrying photo-period response alleles of SNP1411 and SNP1520 split into fourhaplotypes, which maintained a typical level of sequence diversitycompared with teosinte (SI Appendix, Table S6). In contrast, thesixth haplotype group, which contained B73 and most temperatelines, had a 10-fold reduction in diversity in this region, suggestingselection acting on this locus within certain maize lineages (SIAppendix, Table S6). Of the four NAM founders showing positivephotoperiod responses, CML277 and Ky21 have haplotype I and
CML228 andKi11 have haplotype IV.Haplotype groups II and IVare predominantly composed of tropical lines and had significantly(P < 0.01) greater mean photoperiod responses effects than theB73 allele group haplotype V (Table 1). The strong associationbetween SNP1411/1520 and photoperiod response in the diversitypanel does not imply that they are the causal variants, but doesindicate that they are at least in strong LD with the causal variantsof increased photoperiod response, which may exist even furtherupstream of ZmCCT than the regions sequenced. Furthermore,NAM founders whose chromosome 10 QTL alleles significantlyreduced photoperiod response (CML322, Ki3, Oh43, and Tx303;Fig. 1) were not distinguishable from B73 based on haplotypes inthis region (Fig. 6), suggesting that additional sequence variationthat affects photoperiod response is harbored within more com-plex haplotype structure in this region, or that there is a closelylinked gene that segregates for the earlier flowering effect.We further discovered a significant interaction in the maize
diversity panel between SNP1411 or SNP1520 at ZmCCT and theflowering time gene Vgt1 (11) on chromosome 8 (SI Appendix, Fig.S10). SNP1411 and SNP1520 atZmCCT had significant effects forphotoperiod response only in lines not containing the MITE in-sertion at Vgt1.
Phenotypic Effects and Gene Expression of ZmCCT Alleles fromDiverse Teosintes. Maize NAM mapping results indicated thatZmCCT alleles have phenotypic effects functionally similar to theancestral teosinte allele in only a subset of tropical maize lines(Fig. 1). To determine if photoperiod-sensitive alleles at ZmCCTare frequent in teosinte, we measured the effects of ZmCCTQTLalleles from eight teosinte donors representing the genetic andgeographic variability within extant populations of the progenitorspecies in crosses with the temperate inbred W22. Segregating
Fig. 5. Fine-mapping chromosome 10 QTLs in a maize-teosinte population. Graphical genotypes of homozygous recombinant progeny lines at markersdefining intervals within the target QTL region are shown in the center, where white segments indicate markers homozygous for the maize W22 allele, blacksegments indicate markers homozygous for the teosinte allele, and gray segments indicate unknown genotype. Blue bars represent days to silk (Right) anddays to pollen shed (Left) under long day lengths for each recombinant progeny line. Markers “B” and “C” delineate the QTL position and correspond toa reference sequence containing the upstream region and first exon of only one gene, ZmCCT.
Hung et al. PNAS | Published online June 18, 2012 | E1917
AGRICU
LTURA
LSC
IENCE
SPN
ASPL
US
families from each cross between W22 and a teosinte donor wereevaluated in the field under long day lengths and genotyped withflanking markers to identify which lines carried the teosinte allelesin the genome region encompassing ZmCCT and to estimate theeffects of those alleles on flowering time. Across all donors, theadditive effect (half the difference between homozygous classes)of a teosinte allele ranged from +3.3 to +5.6 d, suggesting that allteosintes carry a late flowering allele (Fig. 7).To relate the phenotypic effects of teosinte QTL alleles in the
ZmCCT region to the expression of the gene itself, we measuredallele-specific ZmCCT transcript abundance in F1 crosses be-tween eight different teosintes and three temperate maize linesgrown under long day lengths. We hypothesized that teosinteZmCCT alleles would have higher expression levels than maizealleles if ZmCCT acts to repress flowering time in maize as Ghd7does in rice. Our allele-specific expression analysis revealed thatthe teosinte allele was expressed at higher levels than the maizeallele in all cases (range, 2.9–12.6 times greater; Fig. 7). Thus, all
teosintes tested carried cis-acting regulatory elements that in-creased the expression of ZmCCT relative to the maize allele,consistent with the fine-mapping and association experimentsthat identified the upstream region of ZmCCT within the causalQTL interval (Figs. 5 and 6 and SI Appendix, Figs. S6–S8). IfZmCCT functions in a manner homologous to its rice ortho-logue, higher expression of the teosinte allele under long daylengths is expected to repress expression of the maize florigenrequired to initiate flowering.
DiscussionThe genetic architecture of maize photoperiod response demon-strates the general trend of more polygenic control for floweringtime in maize relative to self-fertilizing species. For example, inthe self-fertilizing tropical cereal crop sorghum, a handful of genescontrol most of the variation for photoperiod response in culti-vated varieties, and allelic variation at the Ma1 locus alone canchange flowering time by 60 d under long day lengths (30). Incontrast, we discovered 14 maize QTLs for photoperiod responseat which the strongest allele changes flowering time by only ap-proximately 3 d when homozygous under long day lengths (7).Nevertheless, among quantitative traits of maize, a spectrum ofcomplexity for genetic architecture exists (7, 16, 17, 34, 35) onwhich photoperiod response exhibits simpler genetic control thanflowering time per se and other quantitative traits previously an-alyzed, as evidenced by the smaller number of photoperiod re-sponse QTLs, each contributing to a larger proportion of geneticvariation. It appears that photoperiod response genes in maizerepresent a subset of genes affecting flowering time under long daylengths. Furthermore, we found that QTL alleles from teosinteand inbred line CML254 had stronger effects than those of anyNAM parent (Figs. 5 and 7) (20) (perhaps because of selection offounder lines for NAM capable of reproducing under long daylengths), which could further simplify the inheritance of photo-period response in specific segregating populations.The maize NAM and maize-teosinte mapping results are con-
gruent regarding the importance of a photoperiod response QTLon chromosome 10, and further, to the localization of its causalsequence variant to near ZmCCT. The difference between effectsof the photoperiod-sensitive teosinte allele and the maize photo-period-insensitive allele appears greater than the difference be-tween sensitive and insensitive alleles within NAM (Figs. 2, 5, and7). Nevertheless, photoperiod-sensitive alleles at ZmCCT appearto play a critical role in conferring day length adaptation in teo-sinte and some tropical maize varieties.The identification of ZmCCT as the most important photope-
riod response gene in maize is consistent with previous maize fine-mapping studies that suggested this gene as the probable causalgene of the photoperiod response QTL on chromosome 10 (19,20). ZmCCT is homologous to Ghd7, a key regulator of photo-period response in rice (28) that encodes a CO, CO-LIKE, andTIMING OF CAB1 (CCT) domain protein and is maximallyexpressed only in certain photoperiod-sensitive lines grown underlong day lengths (29). The expression of Ghd7 represses thetranscription of the B-type regulator Ehd1, which up-regulates therice florigen geneHd3a (29). Thus,Ghd7 is a major contributor tothe photoperiod sensitivity of rice, and variation at this locus isassociated with latitude of origin of rice cultivars (28, 29).Fine-mapping and gene expression results demonstrate that
sequence variation within or very near ZmCCT causes phenotypicvariation for photoperiod response in maize-teosinte populations.Fine-mapping results in maize were consistent with this result, butnot definitive, as five other predicted genes exist within the nar-rowest interval defined for the chromosome 10 photoperiod QTLin maize (SI Appendix, Figs. S6–S8). The larger allele effect ob-served between maize and teosinte at this QTL facilitated men-delization of the gene and consequently better mapping resolution(Fig. 5). The strongest association with photoperiod response in
B
A1 A2 A3 A4 A5 A6
A
Fig. 6. (A) Haplotype around ZmCCT across 27 NAM founders. ZmCCT is2,809 bp long and consists of two exons, indicated in blue boxes at the top.The CCT domain is located at exon 2 and indicated with a red bar. Six primers(A1–A6 from left to right), shown in red arrows in the bottom, were used tosequence a 4.5-kb region around ZmCCT including 1.8 kb of its upstreamregion. All polymorphic variants including SNPs and indels relative to B73allele are shown in blue boxes. The missing genotypes and the third allelesare indicated in gray and green boxes, respectively. All positions are shownrelative to the start codon of ZmCCT. Two SNPs, located at 1411 and 1520 bpupstream of ZmCCT respectively, are consistent with NAM QTL mappingresults for this region at which four lines—CML277, CML228, Ki11, and Ky21,indicated in red in the graph—had significant or nearly significant photo-periodic response allele effects relative to B73 allele in NAM joint linkagemapping. (B) Association analysis of SNPs in upstream region (A6) of ZmCCTfor photoperiod response for GDDs to anthesis date in a panel of 282 diversemaize lines. SNP1411 and SNP1520 showed the most significant (P = 10−9)associations with photoperiod response. SNP1411 and SNP1520 are in com-plete LD in the population. Intensity of gray shading indicates the level of LD(r2) between each SNP and SNP1411 or SNP1520.
E1918 | www.pnas.org/cgi/doi/10.1073/pnas.1203189109 Hung et al.

the NAM GWAS analysis was a SNP located at 95.7 Mbp on thechromosome 10 reference sequence, approximately 1.5 Mbp fromZmCCT itself, located at 94.2 Mbp (Fig. 2). Surprisingly, anotherSNP with polymorphisms in the same founders but located lessthan 4 kb upstream of ZmCCT was selected as an associated SNPin only 4% of resampling analyses (Dataset S7). These two SNPsare within the same 1-cM genetic interval on the NAMmap, and,therefore, their imputation on the NAM RILs depends on thesame flanking marker information, but differs in the weightinggiven to the two flanking markers in RILs that have a re-combination in this interval. In the absence of information on howrecombination rate varies within the interval, we used physicaldistance between HapMap SNPs and flanking markers to weighttheir influence on the imputation. To investigate the possibilitythat inaccuracies in linkage-based imputations caused the GWASassociation signal to move away from the location of the causalvariants, we used the recently released genotyping-by-sequencing(GBS) markers (36) assayed directly on the NAMRILs to identify
haplotypes centered around these two markers that tracked theirinheritance in the NAM lines. By reimputing genotypes at each ofthese two SNPs based on theGBSmarkers, we found that the SNPmarker closest to ZmCCT had a slightly stronger association withphotoperiod response than the more distant SNP marker (R2
value greater by 0.1%;Dataset S9), but their effects were not easilyseparated. Thus, our results demonstrate that GWAS in NAMmay have limited resolution in cases in which recombination ratesvary within a genetic interval and among families, and when thenumber of families segregating for a causal variant is low, limitingthe number of recombination events that are needed to separatethe effects of closely linked SNPs. In such cases, complementaryanalysis of the diverse maize association panel, characterized bylow LD, can provide higher resolution, as observed in this case.Across the whole genome, we have evidence that a number of
candidate photoperiod response genes are associated with QTL(Fig. 2), but, in general, SNPs associatedwith photoperiod responsedo not represent variants at candidate flowering or photoperiod
BA
Fig. 7. (A) Effect of eight distinct teosinte alleles in ZmCCT region on flowering time under long day lengths measured in backcrosses to maize. The meandifference in number of days to flowering for progenies homozygous for the teosinte allele vs. those homozygous for the maize allele are shown for eachfamily. (B) Allele specific expression of ZmCCT in 10 F1 crosses between photoperiod-insensitive maize inbreds and eight distinct teosintes. The relative ex-pression of teosinte vs. maize alleles is plotted for each F1.
Table 1. Haplotypes at A6 region of ZmCCT in maize association panel
Haplotype No. of linesNAM founders
includedSNP1411 andSNP1520*
Lines carryingMITE at vgt1 vgt1)
GDD to anthesisphotoperiod response†
Tropicalorigin, %Mean SD
I 16 CML277, Ky21 1 5 49.0 14.0 61.4II 2 1 0 126.1‡ 36.0 97.9III 6 1 5 13.7 20.7 69.0IV 9 CML228, Ki11 1 0 129.3‡ 18.1 95.1V 222 B73, other NAM
founders0 56 24.3 6.2 23.2
*SNP alleles at positions upstream of start codon (0, B73 allele at both; 1, alternate allele at both);†Mean and SD least square means of photoperiod response in GDDs to anthesis for each haplotype after correcting for the population substructure and thegenetic background effects.‡Significant difference in photoperiod response from B73 allele group Haplotype V at P < 0.01.
Hung et al. PNAS | Published online June 18, 2012 | E1919
AGRICU
LTURA
LSC
IENCE
SPN
ASPL
US
genes. Perhaps homologues of important photoperiod pathwaygenes from Arabidopsis do not tend to share similar functions inmaize, or perhaps a high proportion of the causal genetic variationoccurs in noncoding regions, and so they are not detected as anenrichment of GWAS associations within candidate genes. Thisresult also may reflect an inherent limitation of GWAS based onsingle SNPs to resolve allelic series as a result of more complexhaplotypic variation.The consistently high levels of expression and phenotypic
effects on photoperiod response of teosinte alleles at ZmCCTsuggests that the mutation(s) that reduced the effect of ZmCCTon photoperiod response were rare or absent in teosinte, but in-creased to high frequencies following the initial domestication ofmaize. The effect of reduced ZmCCT expression on fitness inmaize is highly dependent on environments, so it is possible thatthese alleles were not selected for until humans attempted tomovemaize culture to higher latitudes, which succeeded only in themostrecent 2,000 y (5, 37). The relatively common occurrence ofZmCCT alleles with limited or no effect on photoperiod responseamong tropical inbred lines could be a result of much earlier se-lection sweep related to adaptation of maize to rainfall patternsand other climate differences between the domestication zone andother tropical environments (e.g., highland areas) where the effectof ZmCCT might have hindered flowering under day lengthsgreater than 12 h but less than 13 h. Alternatively, Ghd7 in rice isknown to affect inflorescence architecture, so ZmCCT may havebeen selected first in tropical maize for its effects on ear mor-phology, helping to move alleles that were preadapted to longerday lengths to a high frequency in tropical maize. More recentexchange of maize germplasm among geographic regions may alsobe involved, but, in any case, ZmCCT alleles with reduced effectson photoperiod response appear to be selectively neutral in manytropical environments. Standing variation at photoperiod re-sponse loci provided early American peoples the rawmaterial withwhich to select maize with adaptation to increasingly higher lat-itudes. Although the North–South spread of maize from its centerof origin to cover vast distances in latitudes and ecologies wasslower than the East–West spread of temperate cereals in Eurasia,it was accomplished before the arrival of Columbus to theAmericas and before the discovery of the scientific principles ofplant breeding, highlighting the skill of early agriculturalists andthe power of artificial selection to shape unique genomic variationrapidly on an evolutionary time scale.
Materials and MethodsMaize Population Development and Genotyping. The maize NAM populationwas createdby crossing25diverse inbred lines to thecommonreferenceparentB73andderiving 200RILs fromeach cross to form5,000mapping lines (14). TheNAM population was evaluated in 11 environments, including eight envi-ronmentswithmeanday lengths greater than 13 h during the growing season(long-day length environments) and three environments with mean daylengths less than 13 h (short-day length environments) (38). A sample of 200intermated B73 ×Mo17 (IBM) RILs (39) and a panel of 281 lines encompassingmuch of the global diversity of public maize inbreds (“maize associationpanel”) (32) were also included alongside the NAM lines in field evaluations.The total number of inbred lines evaluated in field experiments was 5,481.Details of experimental design and phenotype data analysis are provided inthework ofHung et al. (38) and in SI Appendix, SIMaterials andMethods. EachNAM and IBM line was genotyped with a common set of 1,106 SNP markerschosen to have high informativeness in these crosses (14). Linkage map andgenotype scores are available at www.panzea.org (40). Lines identified withgreater than 8% heterozygosity or putative contamination based on SNPanalysis were excluded from QTL and GWAS analyses, resulting in a samplesize of 4,699 NAM and 162 IBM (total of 4,861) RILs used for genetic analysis.
Maize Fine-Mapping Chromosome 10 QTLs. Three maize fine-mapping pop-ulations were created to resolve the position of the chromosome 10 QTLs byselecting lines carrying recombinations in the QTL region between chro-mosomes from B73 and CML277, CML228, or Ki11 in homogenized geneticbackgrounds (SI Appendix, Figs. S4–S8). The substitution mapping procedure
widely used in fine mapping (41) was used to delimit the causal QTL regionas detailed in SI Appendix, SI Materials and Methods.
Sequencing ZmCCT Alleles and Association Analysis in a Maize Diverse Panel. Sixprimers were used to sequence a 4.5-kb region around ZmCCT including 1.8 kbof its upstream region in the 27 NAM and IBM founders and in 16 teosinte (Z.mays subsp. parviglumis) inbred lines (Fig. 6, Dataset S10, and SI Appendix,Table S4). Sequencing reactions were performed on PCR products in bothdirections with BigDye v3.1 on an Applied Biosystems 3700 automated se-quencer. PHRED and PHRAP (42) were used for base calling, quality checks,and sequence assembly. Biolign (http://en.bio-soft.net/dna/BioLign.html) wasused formultiple sequence alignments. RegionA6,which includes SNP1411 andSNP1520 (Fig. 6), was further sequenced in a panel of 282 diverse maize lines(32). A mixed linear model that corrects for broad-scale population structureand pairwise relationships among lines (33) was used to conduct associationtesting for each variant identified at region A6. The population structure (i.e.,Q) and relative kinship (i.e., K) matrices were calculated based on 89 micro-satellites and 553 random SNPs, respectively, as described previously (33).
Teosinte Population Development and Genotyping. To compare the QTL con-trollingdifferences in anthesis datebetweenmaizeand teosinte toNAMQTLs,wemapped flowering time QTLs in 866maize-teosinte BC2S3 lines genotypedat 19,838 GBS markers. The large effect QTL for days to anthesis on chro-mosome 10 was fine-mapped by using a single maize-teosinte BC2S3 familythat segregated for a 50.77-Mb chromosomal segment including the QTLregion introgressed from teosinte into theW22 genetic background. By usingtwo marker loci that flanked the QTL, we isolated 74 lines homozygous forchromosomal recombinations around the QTL. These recombinant chromo-some nearly isogenic lines were genotyped at 31 SNP and indel markers acrossthe region (SI Appendix, Table S7) and phenotyped for flowering time underlong day lengths. To assess whether late flowering alleles are prevalent inteosinte, we evaluated long-day length flowering time of BC1S1 familiesderived from crosses between temperate maize line W22 and six teosinteinbred lines. For each of the six families, 190 plants were genotyped at theZmCCT locus and phenotyped for days to anthesis (SI Appendix, Table S7) toestimate the effect of substituting the maize allele with a teosinte allelearound this gene. A more detailed description of maize-teosinte mappingexperiments is provided in SI Appendix, SI Materials and Methods).
Allele-Specific Expression Assay. We used an allele-specific assay of ZmCCTtranscript accumulation in the F1 hybrids of inbred maize and teosinteparents. The hybrids were created by crossing eight teosinte inbred lines tothree temperate maize inbred lines creating a total of 10 F1s (SI Appendix,Table S9). The plants were grown in long-day conditions in the field (summer2011, West Madison Agricultural Research Station, Madison, WI) or in growthchambers (set to a 17:7-h light:dark daily cycle). Total cellular RNA was iso-lated from fully expanded leaf tissue from the third or fourth leaf of eachplant. We assayed three to five biological replicates per cross and two to fourtechnical replicates per biological replicate. Leaf tissue for RNA extractionwas collected in the morning after the plants had experienced approximately3 to 4 h of light. Aliquots of each RNA sample were DNase treated and re-verse-transcribed using a polyT primer and SuperScript III reverse transcrip-tase (Invitrogen) following the manufacturer’s instructions. We used actinprimers (wh182, 5′-CCAAGGCCAACAGAGAGAAA-3′; WH183, 5′-CCAAACG-GAGAATAGCATGAG-3′) to check the integrity of the cDNA and genomicDNA contamination. We found no evidence of genomic DNA contamination.
To distinguish maize vs. teosinte transcripts in an allele-specific expressionassay, we used an indel (PZD00131.indel) that is polymorphic between maizeand teosinte in ZmCCT (SI Appendix, Table S10). We performed PCR on thecDNAs from each cross by using fluorescently labeled primers (GHD7EP1 for-ward, FAM-5′-TCATCACCGTCGTCATGAGT-3′; GHD7DEP1 reverse, 5′-CGCT-TGCTTCTGCTGTCTC-3′; TAQ Core Kit; Qiagen). PCR products were assayed onan ABI 3700 fragment analyzer (Applied Biosystems), and areas under thepeaks for the maize and teosinte transcripts were determined by using GeneMarker version 1.70. Relative expressionwas calculated as the ratio of the areaunder the peak for teosinte allele to the area under the peak for the maizeallele. The calculated relative expression ratios were corrected for biased PCRamplification of the maize vs. teosinte allele by using the observed ratio ofteosinte tomaize PCRproduct for genomicDNA fromeach cross.Mean relativeexpression across biological replicates and SEs are reported (Fig. 7).
ACKNOWLEDGMENTS. This work was supported by National Science Foun-dation (NSF) Division of Biological Infrastructure Grant 0321467 and NSFIntegrative Organismal Systems Grant 0820619, and by the US Department ofAgriculture-Agricultural Research Service.
E1920 | www.pnas.org/cgi/doi/10.1073/pnas.1203189109 Hung et al.
1. Diamond J (2002) Evolution, consequences and future of plant and animaldomestication. Nature 418:700–707.
2. Cockram J, et al. (2007) Control of flowering time in temperate cereals: genes,domestication, and sustainable productivity. J Exp Bot 58:1231–1244.
3. Matsuoka Y, et al. (2002) A single domestication for maize shown by multilocusmicrosatellite genotyping. Proc Natl Acad USA 99:6080–6084.
4. Mangelsdorf PC (1974) Corn: Its Origin, Evolution, and Improvement (Harvard UnivPress, Cambridge, MA).
5. Crawford GW, Saunders D, Smith DG (2006) Pre-contact maize from Ontario, Canada:Context, chronology, variation, and plant association. Histories of Maize:Multidisciplinary Approaches to the Prehistory, Linguistics, Biogeography,Domestication, and Evolution of Maize, eds Staller J, Tykot R, Benz B (Academic, SanDiego), pp 549–559.
6. Weatherwax P (1954) Indian Corn in Old America (McMillan, New York).7. Buckler ES, et al. (2009) The genetic architecture of maize flowering time. Science 325:
714–718.8. Thornsberry JM, et al. (2001) Dwarf8 polymorphisms associate with variation in
flowering time. Nat Genet 28:286–289.9. Colasanti J, et al. (2006) The maize INDETERMINATE1 flowering time regulator
defines a highly conserved zinc finger protein family in higher plants. BMC Genomics7:158–175.
10. Muszynski MG, et al. (2006) delayed flowering1 Encodes a basic leucine zipper proteinthat mediates floral inductive signals at the shoot apex in maize. Plant Physiol 142:1523–1536.
11. Salvi S, et al. (2007) Conserved noncoding genomic sequences associated witha flowering-time quantitative trait locus in maize. Proc Natl Acad USA 104:11376–11381.
12. Coles ND, McMullen MD, Balint-Kurti PJ, Pratt RC, Holland JB (2010) Genetic controlof photoperiod sensitivity in maize revealed by joint multiple population analysis.Genetics 184:799–812.
13. Camus-Kulandaivelu L, et al. (2006) Maize adaptation to temperate climate:Relationship between population structure and polymorphism in the Dwarf8 gene.Genetics 172:2449–2463.
14. McMullen MD, et al. (2009) Genetic properties of the maize nested associationmapping population. Science 325:737–740.
15. Gore MA, et al. (2009) A first-generation haplotype map of maize. Science 326:1115–1117.
16. Tian F, et al. (2011) Genome-wide association study of leaf architecture in the maizenested association mapping population. Nat Genet 43:159–162.
17. Kump KL, et al. (2011) Genome-wide association study of quantitative resistance tosouthern leaf blight in the maize nested association mapping population. Nat Genet43:163–168.
18. Wang CL, et al. (2008) Genetic analysis of photoperiod sensitivity in a tropical bytemperate maize recombinant inbred population using molecular markers. TheorAppl Genet 117:1129–1139.
19. Ducrocq S, et al. (2009) Fine mapping and haplotype structure analysis of a majorflowering time quantitative trait locus on maize chromosome 10. Genetics 183:1555–1563.
20. Coles ND, Zila CT, Holland JB (2011) Allelic effect variation at key photoperiodresponse QTL in maize. Crop Sci 51:1036–1049.
21. Briggs WH, McMullen MD, Gaut BS, Doebley J (2007) Linkage mapping ofdomestication loci in a large maize teosinte backcross resource. Genetics 177:1915–1928.
22. Chia J-M, et al. (2012) Maize HapMap2 identifies extant variation from a genome influx. Nat Genet, 10.1038/ng.2313.
23. Valdar W, Holmes CC, Mott R, Flint J (2009) Mapping in structured populations byresample model averaging. Genetics 182:1263–1277.
24. Coneva V, Zhu T, Colasanti J (2007) Expression differences between normal andindeterminate1 maize suggest downstream targets of ID1, a floral transitionregulator in maize. J Exp Bot 58:3679–3693.
25. Meng X, Muszynski MG, Danilevskaya ON (2011) The FT-like ZCN8 gene functions asa floral activator and is involved in photoperiod sensitivity in maize. Plant Cell 23:942–960.
26. Lazakis CM, Coneva V, Colasanti J (2011) ZCN8 encodes a potential orthologue ofArabidopsis FT florigen that integrates both endogenous and photoperiod floweringsignals in maize. J Exp Bot 62:4833–4842.
27. Durand E, et al. (2012) Flowering time in maize: Linkage and epistasis at a majoreffect locus. Genetics 190:1547–1562.
28. Xue W, et al. (2008) Natural variation in Ghd7 is an important regulator of headingdate and yield potential in rice. Nat Genet 40:761–767.
29. Itoh H, Nonoue Y, Yano M, Izawa T (2010) A pair of floral regulators sets critical daylength for Hd3a florigen expression in rice. Nat Genet 42:635–638.
30. Murphy RL, et al. (2011) Coincident light and clock regulation of pseudoresponseregulator protein 37 (PRR37) controls photoperiodic flowering in sorghum. Proc NatlAcad USA 108:16469–16474.
31. Wright SI, et al. (2005) The effects of artificial selection on the maize genome. Science308:1310–1314.
32. Flint-Garcia SA, et al. (2005) Maize association population: A high-resolution platformfor quantitative trait locus dissection. Plant J 44:1054–1064.
33. Yu JM, et al. (2006) A unified mixed-model method for association mapping thataccounts for multiple levels of relatedness. Nat Genet 38:203–208.
34. Brown PJ, et al. (2011) Distinct genetic architectures for male and femaleinflorescence traits of maize. PLoS Genet 7:e1002383.
35. Cook JP, et al. (2012) Genetic architecture of maize kernel composition in the nestedassociation mapping and inbred association panels. Plant Physiol 158:824–834.
36. Elshire RJ, et al. (2011) A robust, simple genotyping-by-sequencing (GBS) approach forhigh diversity species. PLoS ONE 6:e19379.
37. Smith BD (1989) Origins of agriculture in eastern North America. Science 246:1566–1571.
38. Hung HY, et al. (2012) The relationship between parental genetic or phenotypicdivergence and progeny variation in the maize nested association mappingpopulation. Heredity (Edinb) 108:490–499.
39. Sharopova N, et al. (2002) Development and mapping of SSR markers for maize. PlantMol Biol 48:463–481.
40. Canaran P, et al. (2008) Panzea: An update on new content and features. NucleicAcids Res 36(database issue):D1041–D1043.
41. Paterson AH, DeVerna JW, Lanini B, Tanksley SD (1990) Fine mapping of quantitativetrait loci using selected overlapping recombinant chromosomes, in an interspeciescross of tomato. Genetics 124:735–742.
42. Ewing B, Hillier L, Wendl MC, Green P (1998) Base-calling of automated sequencertraces using phred. I. Accuracy assessment. Genome Res 8:175–185.
Hung et al. PNAS | Published online June 18, 2012 | E1921
AGRICU
LTURA
LSC
IENCE
SPN
ASPL
US