Embed Size (px)
Citation preview

Zendrive Research : Largest Distracted Driving Behavior Study
Drivers Use Their Phones During 88 Out of 100 Trips 3-Month Analysis of 5.6-Billion Miles, 570-Million Trips, 3-Million Drivers April 2017
Introduction Mobile phones are ubiquitous, and they vie for our attention all the time. Traffic deaths have shot off the charts in the last two years. As phones have become commonplace, how have they affected our everyday behaviors? Most importantly, do they impact how safely we perform seemingly mundane tasks, like driving a car? Zendrive is a mission-driven company, working to improve road safety with data and analytics. Our smartphone-based system measures and analyzes driver behavior. This winter, our team of data scientists and policy experts dug into our 10-billion mile data set to see what we can learn about phone use behind the wheel. We started with some commonsense assumptions:
● Distracted driving is dangerous; ● Phone use behind the wheel is distracting, no matter what you’re doing; ● Even a few seconds focused on your phone instead of the road can have dire
consequences; ● Everyone has phones; ● U.S. traffic deaths are rising and distracted driving is contributing to this increase; ● Phone use is very difficult for crash investigators to capture.
What we don’t know is how frequently drivers are using their phones when they are behind the wheel, at least until now. New research from Zendrive has found that Americans use their phones nearly every single time they get behind the wheel. Zendrive conducted the Distracted Driving Behavior Report to look at the frequency and duration of phone use behind the wheel. This study aggregated and analyzed data from 3.1 million anonymized drivers, who took 570 million trips, covering 5.6 billion miles nationwide between December 2016 and February 2017. This is the largest distracted driving study conducted to-date. There are many small scale distracted driving reports, but their conclusions vary and their statistical robustness is questionable. This topic is too important to leave ambiguous.

Zendrive Findings Our top finding shows that drivers used their phones during 88-percent of the 570-million trips analyzed . Everyday, that’s the equivalent of people behind the wheel talking or texting on 5.6-million car rides from our sample alone. When extrapolated for the entire U.S. driving population , the number goes up to 1
roughly 600-million distracted trips a day . Zendrive researchers also found that during an hour-long trip, drivers spent an average of 3.5-minutes using their phones . This finding is frightening, especially when you consider that a 2-second distraction is long enough to increase your likelihood of crashing by over 20-times. In other words, that’s equivalent to 105 opportunities an hour that you could nearly kill yourself and/or others. Read on to see the rankings of the most and least distracted drivers and how Zendrive figured this out.
1 In 2009, there were 210 million licensed drivers in the U.S. ( https://www.fhwa.dot.gov/policyinformation/statistics/2009/dv1c.cfm ). Each driver took 3.21 trips each weekday (most recent data available, http://nhts.ornl.gov/2009/pub/stt.pdf ), resulting in a total number of 674,100,000 vehicle trips a day.

Known Dangers of Distracted Driving We know that phone use behind the wheel is irresponsible:
● The AAA Foundation for Traffic Safety’s most recent public opinion research reports that Americans think phone use behind the wheel is dangerous . A strong majority of drivers think that other drivers who text, talk or email on cell phones are a “very serious threat to their personal safety.”
The public is right. A growing body of research tells us that any type of phone use makes driving more dangerous:
● Talking on the phone, either hand-held or hands-free, increases drivers’ risk of crashing by two to four times . This is because any kind of phone conversation 2
increases a driver’s reaction time and impacts their speed and control of the vehicle . Texting behind the wheel is even worse, making it eight times more likely 3
that a driver will crash . 4
● Using a phone doesn’t just take your eyes off the road; it takes your brain off the
road , which is the real problem: Using a phone while driving substantially reduces brain activities related to driving -- things like tracking the other cars, people and things around you and navigating around them . 5
2 McEvoy, S.P.; Stevenson, M.R.; McCartt, A.T.; Woodward, M.; Haworth, C.; Palamara, P.; and Cercarelli, R. 2005. Role of mobile phones in motor vehicle crashes resulting in hospital attendance: a case-crossover study. British Medical Journal 331(7514):428. Redelmeier, D.A. and Tibshirani, R.J. 1997. Association between cellular-telephone calls and motor vehicle collisions. The New England Journal of Medicine 336:453-58 U.S. Department of Transportation, National Highway Traffic Safety Administration. (2013). The Impact of Hand-Held and Hands-Free Cell Phone Use on Driving Performance and Safety-Critical Event Risk. (DOT HS 811 757). Prepared by Virginia Tech Transportation Institute for NHTSA. Available: http://www.nhtsa.gov/DOT/NHTSA/NVS/Crash Avoidance/Technical Publications/2013/811757.pdf 3 Caird, J.K.; Willness, C.R.; Steel, P.; and Scialfa, C. 2008. A meta-analysis of the effects of cell phones on driver performance. Accident Analysis and Prevention 40(4):1282-93. 4 Drews, F. A., Yazdani, H., Godfrey, C. N., Cooper, J. M., & Strayer, D. L. (2009). Text messaging during simulated driving. Human Factors 51(5):762-770 5 Just, M.A.; Keller, T.A.; Cynkar, J. 2008. A decrease in brain activation associated with driving when listening to someone speak. Brain Research 1205: 70-80

When you’re driving, even the shortest glances at your phone are dangerous:
● Taking your eyes off the road for just 2 seconds increases crash risk 24-times .
● Five seconds is the average time your eyes are off the road while texting. When traveling at 55mph, that's enough time to cover the length of a football field blindfolded .
And, because of the ubiquity of mobile phones, we all need to take responsibility:
● According to the Pew Research Center , in 2016, 95-percent of Americans owned cellphones and 77-percent owned smartphones. This is an increase from 87-percent cellphone and 35-percent smartphone ownership in 2011 and 70-percent cellphone ownership in 2006.
After nearly a decade of decline, traffic deaths are increasing, in part due to driver distraction:
● From 2014 to 2015, traffic deaths increased 7-percent, and from 2015 to 2016, deaths increased by 14-percent. The National Safety Council estimates that 40,200 people lost their lives on U.S. roads in preventable collisions last year.
● In 2015 (the most recent data available), the National Highway Traffic Safety
Administration reports that fatalities from driver distraction saw the largest increase among all crash-related factors.

The Challenge of Reporting Phone Use Unfortunately, phone use behind the wheel is very difficult to measure:
● Experts agree that cell-phone use as a contributing factor in collisions is woefully undercounted . The forms that local police departments use to report traffic crashes do not typically have a box to check, a code or other common ways to designate that phone use was a contributing factor in a collision. Standard fields include factors such as unsafe speed, failure to yield and a generic “driver distraction/inattention,” which could be used to report anything from changing the radio station to eating to a driver’s statement of “I just didn’t see her.”
● Drivers are also unlikely to admit that they were using their phones when they were
involved in a crash.
● Zendrive uses the technology built into smartphones to measure driving, so by virtue of running on a smartphone, Zendrive can measure phone use while driving. Use is detected when the driver handles the phone for a certain period of time for various purposes such as talking, texting or navigating.
Let’s look at 2011 as an example of data reporting:
● NHTSA reported that 32,367 people were killed in traffic , which includes 3,331 distraction-related fatalities .
● Nationwide, during a year when 85-percent of Americans owned mobile phones and drove nearly 3-trillion miles, NHTSA reported only 385 mobile phone-related fatal crashes .
● 42 states reported less than 10 mobile phone-related traffic deaths ○ New York state saw 1,092 traffic deaths, yet only 1 cell phone related death
was reported. ○ In Vermont, there were 55 traffic deaths, yet only 1 cell phone related death
was recorded. ○ Oregon saw 331 traffic deaths, yet only 4 cell phone related fatalities were
reported. ○ Ohio had 1,016 traffic deaths, yet only 3 cell phone related fatalities were
reported. Similarly in 2015, as 91-percent of Americans owned mobile phones and drove over 3-trillion miles , 35,092 people died in traffic . NHTSA reported just 476 mobile phone-related deaths out of 3,477 total distraction-related fatalities on our roads.

Zendrive’s Most and Least Distracted Drivers
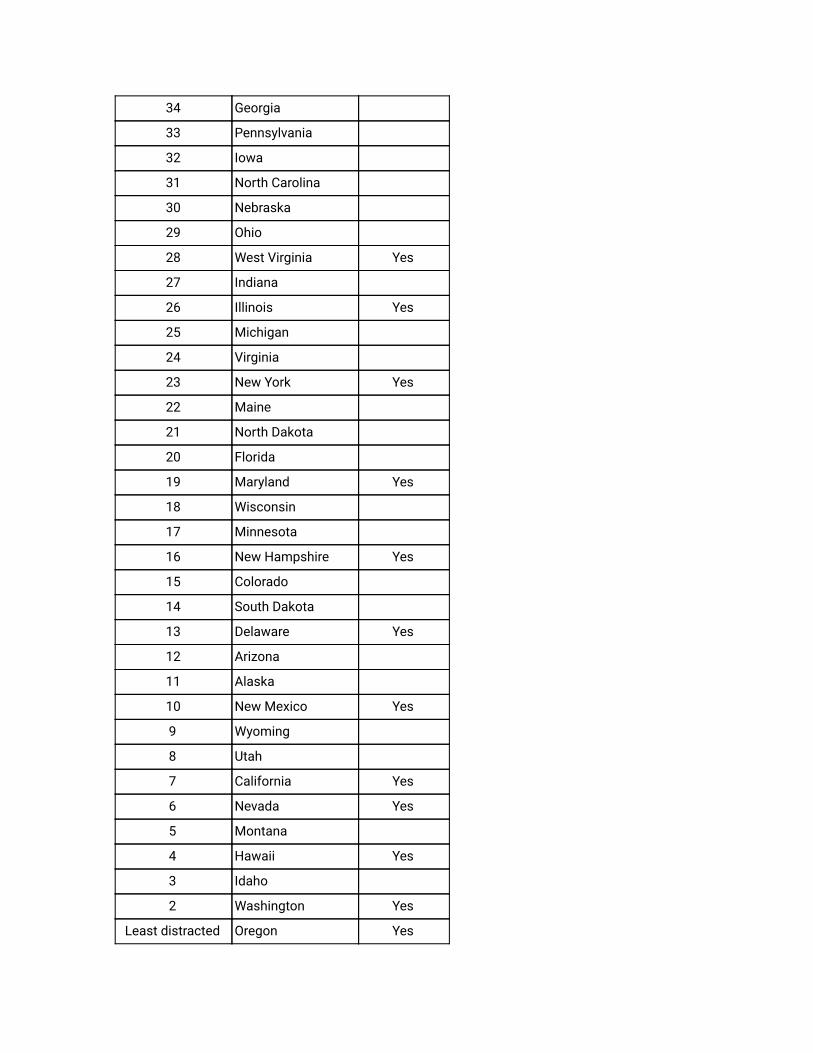
STATE RANKINGS Who are the most and least distracted drivers, and how did Zendrive figure this out? Zendrive dug deep into our data set of 10-billion miles of driver behavior data and pulled out a three month sample of 570-million trips, where 3.1-million people drove 5.6-billion miles around the U.S. between December 2016 and February 2017. Our data science team looked at the relationship between how long people drove each day and how much time they spent using their phones while driving. They calculated the ratio between the average daily trip time and the average amount of time drivers used their phones each day. By comparing duration to duration, i.e. apples to apples, Zendrive came up with the most direct and accurate measurement of driver distraction.
Ranking State Hand-held phone ban
Most distracted Vermont Yes
50 Mississippi
49 Louisiana
48 Alabama
47 Arkansas
46 Oklahoma
45 New Jersey Yes
44 Rhode Island
43 Missouri
42 Massachusetts
41 Tennessee
40 Kansas
39 District of Columbia Yes
38 South Carolina
37 Connecticut Yes
36 Kentucky
35 Texas
34 Georgia
33 Pennsylvania
32 Iowa
31 North Carolina
30 Nebraska
29 Ohio
28 West Virginia Yes
27 Indiana
26 Illinois Yes
25 Michigan
24 Virginia
23 New York Yes
22 Maine
21 North Dakota
20 Florida
19 Maryland Yes
18 Wisconsin
17 Minnesota
16 New Hampshire Yes
15 Colorado
14 South Dakota
13 Delaware Yes
12 Arizona
11 Alaska
10 New Mexico Yes
9 Wyoming
8 Utah
7 California Yes
6 Nevada Yes
5 Montana
4 Hawaii Yes
3 Idaho
2 Washington Yes
Least distracted Oregon Yes

It appears that at the state-level, laws that ban hand-held phone use actually reduce the amount of time per trip drivers use their phones. Of the ten states with the lowest levels of phone use, six have laws limiting phone use while driving. However, the state with the highest level of phone use, Vermont, also has a law that limits phone use while driving.
States that prohibit the use of hand-held cellphones while driving: California, Connecticut, Delaware, Hawaii, Illinois, Maryland, Nevada, New Hampshire, New Jersey, New Mexico, New York, Oregon, Vermont, Washington and West Virginia — plus the District of Columbia.

LOCAL RANKINGS At the local level, it is unclear if these laws impact phone use. Looking at January and February 2017 trip data from a sample of cities in the best and the worst states, Zendrive data scientists found mixed results. Drivers in Los Angeles, for example, spent the most time using their phones during each trip, yet California has a law prohibiting phone use and, as a state, ranks among the least distracted.
City
City/State has hand-held phone ban
Most distracted Los Angeles Yes
Austin
Miami
Philadelphia
Chicago Yes
Houston
Denver
New York Yes
Burlington Yes
Portland Yes
San Francisco Yes
Atlanta
Boston
Washington, DC Yes
Least distracted Seattle Yes
CONCLUSION Zendrive is working with communities, local decision-makers, advocates and driving coaches to use our data to save lives. Zendrive’s powerful system transforms mobile technology from a threat to a lifesaver. Traffic deaths are preventable. Leaders like the National Highway Transportation Safety Administration , the National Safety Council , the AAA Foundation for Traffic Safety and the Vision Zero Network are promoting strategies to end distracted driving. Today, in the Vision Zero era , a data-driven, public health-influenced approach to road safety is helping stakeholders at all levels wrap their heads, and hands, around this massive problem. More than a dozen American cities have committed to Vision Zero by setting time-bound goals to eliminate traffic deaths and serious injuries -- most within 10 to 20 years. The US DOT set a “Road to Zero” goal to end traffic fatalities within the next 30 years. We know what behaviors and factors contribute to traffic deaths, so we can develop interventions to reduce, and eventually eliminate, these factors and, thus, eliminate road deaths. To this effort, Zendrive brings new data and new insights into problems we haven’t been able to measure before, like phone use behind the wheel. We measure what’s happening on our roads because, as the saying goes: If you can measure it, you can manage it.

APPENDIX
Data Overview Total Zendrive driver behavior data set: 10 billion miles Total number of Zendrive users: 5 million drivers Time period for study: December 2016, January 2017, February 2017 (89 days) Driver behavior data set for study: 5.6 billion miles Total number of users in study: 3.1 million drivers Total number of trips in study: 570 million trips Total number of trips with no phone use: 12%
Methodology Drawing from Zendrive’s ten billion miles of behavior data -- aggregated and anonymized from over 5 million drivers -- Zendrive looked at the frequency and duration of phone use behind the wheel. There are many small scale distracted driving reports but their conclusions vary and their statistical robustness is questionable. This topic is too important to leave in ambiguous settings, and so, in this study, Zendrive analyzed 5.6 billion miles driven by 3.1 million drivers nationwide from December 2016 to February 2017 to put together the definitive distracted driving behavior report. For comparison, the Federal Highway Administration’s periodic National Household Transportation Survey -- considered an authoritative source on mobility data -- surveyed about 300,000 people in 2009 . The millions of people who use Zendrive are a mix of commercial customers and individual consumers. They all operate standard passenger vehicles -- e.g. sedans, station wagons, minivans, SUVs, etc., not tractor trailers or other large industrial vehicles. Zendrive technology detects vehicle trips and safety related driving events using smartphone sensors. The safety events that Zendrive focuses on include speeding, aggressive acceleration, hard braking, collisions and phone use.

Phone use while driving is detected when the driver handles the phone for a certain period of time for various purposes such as talking, texting or navigating. For privacy purposes, reported numbers do not differentiate between different purposes or apps; the data consider all sorts of engagement with smartphones as a driving distraction. The dataset used for this study is mostly derived from personal drivers driving passenger cars, though some commercial drivers such as transportation network company drivers, are included. The dataset does not include any type of heavy vehicle. Transportation network characteristics and traffic conditions were not included in the analysis. Zendrive technology is able to differentiate between drivers and passengers based where someone is setting and from what side of the vehicle they disembark. The phone use ratio behind the wheel is calculated as the ratio of total phone use in a trip over total trip duration. Median (50-percent quantile) phone use ratios are reported for all the trips that take place in a city.
U.S. State Ranking Methodology ● All 50 states and the District of Columbia were ranked by what drivers spent the
highest proportion of their daily driving trips using their phones. ● TIme period: December 2016, January 2017 and February 2017 ● Zendrive calculated the phone use ratio for states by dividing the average of users’
daily aggregated phone use (in minutes) by the average of users’ daily aggregated trip duration (also in minutes). Basically: the average amount of time drivers use their phones everyday divided by the average time they drive everyday.
At the state-level, Zendrive found that, on average, drivers spend a total of 3.5-minutes per hour using their phones while driving.
U.S. City Ranking Methodology ● Zendrive selected a sample set of cities to analyze from the best and the worst
states ● Time period: January 2017 and February 2017 ● Zendrive calculated the phone use ratio for cities by dividing the average time per
trip that users use their phones (in minutes) by the average duration of each trip (in minutes). Basically: the average amount of time drivers use their phones on each trip divided by the average time of each trip.
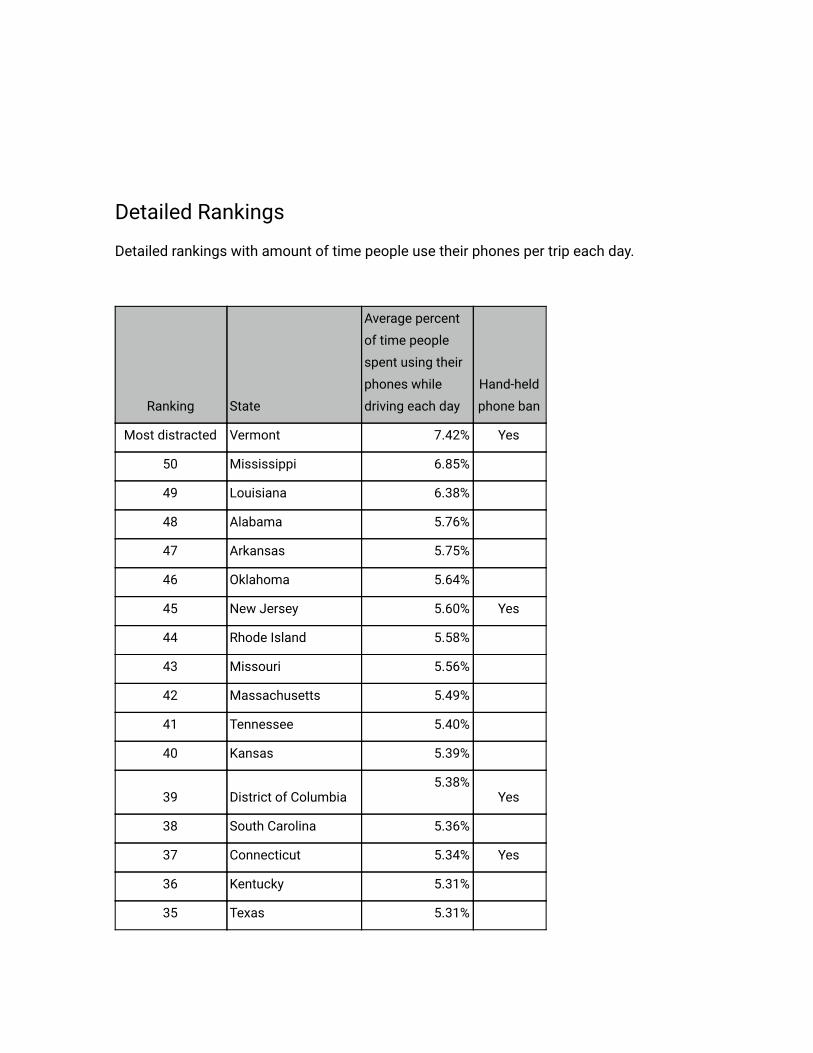
Detailed Rankings
Detailed rankings with amount of time people use their phones per trip each day.
Ranking State
Average percent of time people spent using their phones while driving each day
Hand-held phone ban
Most distracted Vermont 7.42% Yes
50 Mississippi 6.85%
49 Louisiana 6.38%
48 Alabama 5.76%
47 Arkansas 5.75%
46 Oklahoma 5.64%
45 New Jersey 5.60% Yes
44 Rhode Island 5.58%
43 Missouri 5.56%
42 Massachusetts 5.49%
41 Tennessee 5.40%
40 Kansas 5.39%
39 District of Columbia 5.38%
Yes
38 South Carolina 5.36%
37 Connecticut 5.34% Yes
36 Kentucky 5.31%
35 Texas 5.31%

34 Georgia 5.31%
33 Pennsylvania 5.23%
32 Iowa 5.21%
31 North Carolina 5.19%
30 Nebraska 5.18%
29 Ohio 5.15%
28 West Virginia 5.11% Yes
27 Indiana 5.11%
26 Illinois 5.10% Yes
25 Michigan 5.09%
24 Virginia 5.02%
23 New York 5.01% Yes
22 Maine 5.01%
21 North Dakota 5.01%
20 Florida 5.00%
19 Maryland 4.96% Yes
18 Wisconsin 4.92%
17 Minnesota 4.92%
16 New Hampshire 4.88%
Yes
15 Colorado 4.78%
14 South Dakota 4.77%
13 Delaware 4.69% Yes
12 Arizona 4.62%
11 Alaska 4.48%
10 New Mexico 4.40% Yes
9 Wyoming 4.30%
8 Utah 4.25%
7 California 4.24% Yes
6 Nevada 4.14% Yes

5 Montana 4.11%
4 Hawaii 4.07% Yes
3 Idaho 4.01%
2 Washington 3.96% Yes
Least distracted Oregon 3.69% Yes
Detailed rankings with amount of time people use their phones per trip.
City
Average percent of time people spent using their phones while driving per trip
City/State has hand-held phone ban
Most distracted Los Angeles 0.05939015118 Yes
Austin 0.05885196485
Miami 0.05274445088
Philadelphia 0.05246222151
Chicago 0.0520613432 Yes
Houston 0.05151141962
Denver 0.05093086805
New York 0.04608872382 Yes
Burlington 0.0439412752 Yes
Portland 0.04352355986 Yes
San Francisco 0.04177375391 Yes
Atlanta 0.04045336604
Boston 0.03895898071
Washington, DC 0.03790886216 Yes
Least distracted Seattle 0.03589140606 Yes
![d Æ d R y B .F GR ANT WM e r f d U S P i n e o r o e d T ... · k!] 9! 9! 9! 9! 7 I s l a n d R d G l a d e s R d H e a r n ' s u R d R e i d s R d U n i o n R C h a p e l R d G](https://img.pdfslide.us/doc/110x75/5e6f7dd3a89b897c3463f640/d-d-r-y-b-f-gr-ant-wm-e-r-f-d-u-s-p-i-n-e-o-r-o-e-d-t-k-9-9-9-9-7.jpg)


![^^D , >d, WZKs/ Z >/^d/E' r &/E E / > ^^/^d E D ] o ' } µ Z …...^^D , >d, WZKs/ Z >/^d/E' r &/E E / > ^^/^d E](https://img.pdfslide.us/doc/110x75/5eae9b3147042534de5dc81c/d-d-wzks-z-de-r-e-e-d-e-d-o-z-d.jpg)