Embed Size (px)
Citation preview

Highly Transient Molecular Interactions Underlie the Stability
of Kinetochore–Microtubule Attachment During Cell Division
ANATOLY V. ZAYTSEV,1 FAZLY I. ATAULLAKHANOV,2,3,4 and EKATERINA L. GRISHCHUK1
1Physiology Department, Perelman School of Medicine, University of Pennsylvania, 3700 Hamilton Walk, A401 RichardsBuilding, Philadelphia, PA 19104, USA; 2Center for Theoretical Problems of Physicochemical Pharmacology, RAS, Moscow,Russia, 119991; 3Physics Department, Moscow State University, Moscow, Russia, 119899; and 4Laboratory of Biophysics,
Federal Research Center of Pediatric Hematology, Oncology and Immunology, Moscow, Russia, 117198
(Received 28 June 2013; accepted 2 October 2013)
Associate Editor David Odde oversaw the review of this article.
Abstract—Chromosome segregation during mitosis is med-iated by spindle microtubules that attach to chromosomalkinetochores with strong yet labile links. The exact molecularcomposition of the kinetochore–microtubule interface is notknown but microtubules are thought to bind to kinetochoresvia the specialized microtubule-binding sites, which containmultiple microtubule-binding proteins. During prometa-phase the lifetime of microtubule attachments is short butin metaphase it increases 3-fold, presumably owing todephosphorylation of the microtubule-binding proteins thatincreases their affinity. Here, we use mathematical modelingto examine in quantitative and systematic manner the generalrelationships between the molecular properties of microtu-bule-binding proteins and the resulting stability of microtu-bule attachment to the protein-containing kinetochore site.We show that when the protein connections are stochastic,the physiological rate of microtubule turnover is achievedonly if these molecular interactions are very transient, eachlasting fraction of a second. This ‘‘microscopic’’ time isalmost four orders of magnitude shorter than the character-istic time of kinetochore–microtubule attachment. Coopera-tivity of the microtubule-binding events further increases thedisparity of these time scales. Furthermore, for all values ofkinetic parameters the microtubule stability is very sensitiveto the minor changes in the molecular constants. Suchsensitivity of the lifetime of microtubule attachment to thekinetics and cooperativity of molecular interactions at themicrotubule-binding site may hinder the accurate regulationof kinetochore–microtubule stability during mitotic progres-sion, and it necessitates detailed experimental examination ofthe microtubule-binding properties of kinetochore-localizedproteins.
Keywords—Affinity, Cooperativity, Mathematical modeling,
Microtubule binding, Phosphorylation.
ABBREVIATIONS
MAP Microtubule-associated proteinMT MicrotubuleKMT Kinetochore microtubule
INTRODUCTION
In preparation for division, the replicated chromo-somes are captured, aligned and segregated into twoidentical sets by the microtubule-based mitotic spindle.Failure to divide properly leads to chromosomalinstability, a serious threat to human health.40 It is nowwell established that chromosomal instability fre-quently arises from a failed regulation of dynamicinteractions between microtubules (MTs) and thekinetochores, specialized chromosomal structures.29
Indeed, even low levels of drugs that perturb kineto-chore microtubule (KMT) dynamics cause a failure todivide properly.7,8,23 During mitosis the MTs attachand detach from the kinetochore frequently, turningover with a lifetime of only 3–4 min in prometa-phase.8,11,47 As the number of kinetochore-bound MTsincreases, these attachments become more stable andtheir lifetime increases to 7–10 min.11,13 The nature ofconnections that link chromosomes and the MT endsdynamically, and the molecular mechanisms that reg-ulate KMT turnover remain poorly understood.
Previous theoretical studies have modeled thekinetochore as containing the distinct MT-bindingsites, each composed of multiple MT-binding proteinsarranged in a cylinder20,21,39 or a ring6,15,25,31 (reviewedin Grishchuk et al.18) (Fig. 1a). These models havebrought significant progress to our understanding ofhow chromosomes move in conjunction with MT
Address correspondence to Ekaterina L. Grishchuk, Physiology
Department, Perelman School of Medicine, University of Pennsyl-
vania, 3700 Hamilton Walk, A401 Richards Building, Philadelphia,
PA 19104, USA. Electronic mail: [email protected]
Cellular and Molecular Bioengineering (� 2013)
DOI: 10.1007/s12195-013-0309-4
� 2013 Biomedical Engineering Society

dynamics and about the force generation by kineto-chore-bound MTs but they have not examined thedynamic nature of these attachments. The classicalMT-binding ‘‘sleeve’’ structure contains 65 tubulin-binding proteins, 90–95% of which are bound to theMT at any given time in the absence of a load.20,21
Therefore, the sleeve, as well as the ring model with16–25 MT-binding proteins,15 is expected to form ahighly stable MT attachment that turns over onlywhen a MT end is pulled by force. Since structuralstudies of the kinetochores in different species havefound that the kinetochore–MT interface is likely tocontain the mesh-like fibrillar mats,14,30 rather thansleeves, recent theoretical studies have started model-ing the kinetochore–MT interactions via an ensembleof multiple MT-associated proteins (MAPs) that arenot linked in a rigid structure12,28 (Fig. 1a). However,neither these nor the phenomenological models ofkinetochore–MT interactions17,46 have examined in aquantitative and systematic manner how the molecularproperties of MAPs affect the lifetime of MT attach-ments.
To fill this gap we have developed a simple mathe-matical model of the kinetochore–MT interface whichcontains multiple MT-attachment sites.2,48 The exactmolecular composition of real kinetochore sites is notyet known, but they likely contain multiple copies of
the NDC80 complex, a key MT-binding component ofthe KMN network.10 Previous studies have establishedthat NDC80 binding to MTs can be regulated via thephosphorylation by Aurora B kinase.9,13 For example,when Aurora B kinase is inhibited, KMT lifetimeincreases dramatically up to 200 min.11 The phos-phorylation is likely to affect the dissociation constantof NDC80–MT interactions.41 It has also been sug-gested that phosphorylation regulates the cooperativityof NDC80 binding.3,4 While some of the features ofour model are based loosely on these and other prop-erties of the NDC80 protein complex, the calculationswere carried out for a wide range of model parameters,so these results are general and can be applied to anykinetochore-associated proteins that form the mitoti-cally significant MT attachments.
MODEL DESCRIPTION
General Model Description
Our approach for mathematical modeling of theMT-kinetochore interface is based on probabilistic,single-molecule interactions between MTs and thekinetochore-associated molecular MAPs. The MT-binding site was modeled as an ensemble of N0 MAPs,which are equivalent in their molecular properties.
FIGURE 1. Theoretical approaches to study kinetochore–MT interactions. (a) Possible designs of kinetochore–MT binding site.The sleeve and ring models assume that the MAPs are connected rigidly, so their MT binding is not truly independent. In ourmodel, the MAPs can bind and unbind independently, although their apparent dissociation rate is different when two or more MAPsare found next to each other. (b) Schematic of the model for molecular interactions between the MT and N0-independent MAPscomprising one MT-binding site. Arrows and their labels correspond to the sums of all possible transitions between two differentstates, e.g., the MT bound to j and j + 1 MAPs. For details see ‘‘General Model Description’’. (c) Scheme of the stochastic simulationalgorithm for model of the entire kinetochore interface with multiple MT-binding sites, see section ‘‘Numerical Simulations of theKinetochore Interface with Multiple MT-Binding Sites’’.
ZAYTSEV et al.
These MAPs can independently associate and dissoci-ate with one MT (Fig. 1b). A MT was said to be at-tached to the MT-binding site if it had at least oneattached MAP molecule. A MT that lost all attachedMAPs was referred to as the detached MT. The sto-chastic interactions between an individual MAP andMT were described with two parameters: associationrate (kon) and dissociation rate (koff). These rates werethe same for all MAPs in the site, and they did notdepend on the number of MAPs already bound to theMT. Since the MAPs can associate and dissociate withthe MT independently, the rate of binding of one MAPto the MT is a product of kon and the number of un-bound MAPs at the site; analogously, the rate of losingone MAP is a product of koff and the number MAPsthat were already attached to MT (Fig. 1b).
To take into account the cooperative nature ofMAPs–MT interactions, we introduced an indepen-dent parameter x which modified the apparent disso-ciation rate of individual MAPs depending on thenumber of neighboring complexes bound to the sameMT. Parameter x describes the cooperativity of MAPbinding by accounting for the energy of interactionbetween neighboring MAPs on the MT and its effecton the apparent dissociation rate. Standard free energyof MT-binding reaction of a single MAP DG0
MT islinked to the dissociation constant (KD):
KD �koffkon� e
�DG0
MTkBT ð1Þ
When the MAP forms an additional bond withanother MT-bound MAP, the apparent dissociationconstant Kapp
D becomes:
KappD � e
�DG0
MTþDG0coopkBT
KappD ¼ KDe
�DG0coopkBT ¼ KD=x
ð2Þ
where DG0coop is standard free energy of MAP–MAP
interaction, and x � eDG0coop=kBT: Assuming that the
association rate kon does not depend on DG0coop, the
above expression leads to kappoff ¼ koff=x, where, kappoff isapparent dissociation rate for unbinding of the MAP.Analogously, if one MT-bound MAP has two neigh-bors, the apparent dissociation rate is given bykappoff ¼ koff=x2: During simulations, different MT-bound MAPs may have different number of neighbors.For instance, when three MAPs are bound adjacently,one MAP has two lateral bonds and each of other twoMAPs has only one lateral bond, so the average for thisgroup ofMAPs is 4/3 bonds perMAP, and the apparentdissociation rate for the group iskappoff ¼ koff=x4=3: For agroup of N MAPs the apparent dissociation rate iskoff=xj, where power j depends on the number of
molecular neighbors: j = 2(N � 1)/N.WhenN> 2, thevalue of jwas calculated assuming that all MAPs boundnext to each other on the MT lattice.
Analytical Solution for the Model of a SingleMT-Binding Site
The following symbols were used for the model of asingle MT-binding site:
[0]—fraction of time when zero MAPs are attachedto the MT (MT-binding site is free),
[m]—fraction of time when m MAPs are attached tothe MT; m £ N0, the total number of MAPs in theMT-binding site.
The steady state for MAPs–MT interactions sche-matized in Fig. 1b can then be described with N0 + 1equilibrium equations:
XN0
i¼0½i� ¼ 1
½0� N0kon ¼ ½1�koff½1� koff þ ðN0 � 1Þ½1�kon ¼ ½0�Pat þ 2½2�x�1koffm½m�x�2ðm�1Þ=mkoff þ ðN0 �mÞ½m�kon¼ ðN0 �mþ 1Þ½m� 1�kon þ ðmþ 1Þ½mþ 1�x�2m=ðmþ1Þkoff; m ¼ ð2; . . . ; N0 � 1Þ
9>>>>>>>>>>>>>=
>>>>>>>>>>>>>;
ð3Þ
The system of Eq. (3) was solved in Mathematica(Wolfram Research) to determine [m].
To calculate average KMT lifetime s (the averagetime from the attachment of an MT until its detach-ment) we used the following symbols: stot—total timeof simulation; a total number of MT attachments tothe binding site during stot; so—total time when zeroMAPs were attached to the MT; sat—total time whenMT was attached to the binding site.
The average fraction of time when a MT-bindingsite was occupied at steady-state was the sum of allfractions of time when at least one MAP was attached
to MT (PN0
i¼1½i�), therefore:
sat ¼ stotXN0
i¼1½i� ð4Þ
Considering that stot = sot + so, we obtain:
satPNo
i¼1½i�¼ sat þ so
sat ¼ so �
PNo
i¼1½i�
½0� ð5Þ
Molecular Model of a Kinetochore–Microtubule Binding Site
The total time when zero MAPs are attached so is aproduct of average time when the site is unoccupiedbefore a subsequent MT attachment, i.e., the dwelltime when no MAPs are attached: 1/(kon 9 No)(Fig. 1b) and the total number of MT attachmentevents a: so = a/(kon 9 No). Analogously, sat can besubstituted with the product of the average KMTlifetime s and a. Thus, we can rewrite expression (5):
sa ¼ akon �No
�
PNo
i¼1½i�
½0� ð6Þ
Leading to the following expression for the averageKMT lifetime:
s ¼
PN0
i¼1½i�
½0� �N0 � konð7Þ
After determining values [i], i = (0,…N0) from thesystem (3), the average KMT lifetime was found fromEq. (7). Thus, this model allowed the explicit calcula-tion of the average KMT lifetime for different molec-ular parameters of MAPs, such as the total number ofMAPs per site, kon and koff.
Numerical Simulations of the Kinetochore Interface withMultiple MT-Binding Sites
Model of the entire kinetochore was constructedanalogously. The kinetochore was represented with aseries of individual MT-binding sites. The number ofsites at the kinetochore, Nsites, and the probability of aMT to encounter one site, Pat, were estimated as de-scribed in section ‘‘Choice of Model Parameters’’.
Calculations were carried out using a stochasticsimulation algorithm schematized in Fig. 1c. Thesimulation begins with the kinetochore with all MT-binding sites unoccupied by MTs. The following stepswere then executed at each time tn = tn�1 + Dt, whereDt is time of one iteration:
Step 1. Binding of MTs to unoccupied MT-bindingsites The probability for a MT to bind to unoccupiedsite Wat during Dt was calculated as follows:
Wat ¼ 1� eð�Dt�Pat�N0�konÞ ð8Þ
Then, for each unoccupied site the random number pfrom the range [0, 1] was generated. If p was smallerthan Wat, the MT-binding site became occupied and oneMAP from this site became attaches to this MT. If pwas larger than Wat, the MT-binging site remained free.
Step 2. Binding of new MAPs to the site-bound MTThe probability Won for a MAP to bind to the MT thatwas already bound to at least one MAP at the siteduring Dt was calculated as follows:
Won ¼ 1� e �Dt�konð Þ ð9Þ
Then, for each unattached MAPs within the occu-pied sites, the random number p from the range [0, 1]was generated. If p was smaller than Won, this MAPwas called ‘‘bound’’ to the MT. If p was larger thanWon, this MAP remained unbound.
Step 3. Detachment of MAPs from the site-boundMT The probability Woff for a MAP to dissociate fromthe MT during Dt was calculated as follows:
Woff ¼ 1� e�Dt�koff�x�
2ðN�1ÞN
� �
ð10Þ
where N denoted the number of MAPs associated withthis MT. For each attached MAP the random number pfrom the range [0, 1] was generated. If p was larger thanWoff, this MAP remained attached to the MT. If p wassmaller than Woff, the MAP dissociated from the MT.
Step 4. Detachment of the MTs from the kinetochoreThe calculations were stopped for the MTs that havelost all attachments with MAPs. The unoccupied sitesbecame available immediately for interactions with theincoming MTs (see Step 1).
Step 5. For the above iteration sequence we recordedthe time t, total number of MTs and lifetimes of alldetached MTs to calculate average KMT lifetime s.
Steps 1–5 were repeated 7.2 9 106 times, whichcorresponds to simulation time 2 h.
Choice of Model Parameters
Number of MT binding sites per kinetochore (Nsites)Structural studies using electron microscopy suggest thatup to 50 MTs can bind to a kinetochore in PtK1 cells.27
We used this maximum number to reflect the abundanceof MT-binding sites at the kinetochore and to allowcomparing our results with these structural data.
Number of MAPs per site (N0) The number ofMAPs per site was estimated based on the measurednumber of NDC80 complexes per KMT at kineto-chore. According to Lawrimore et al.24 there are about20 NDC80 complexes per KMT. Other studies suggestthat this number may be smaller.5,22,38 In the model wecarried out most of our calculations for N0 = 12(average of different estimates), but we also show thatour main conclusions remain true if the number ofMAPs per site is larger. Since the kinetochore proteinsother than NDC80 are also involved in binding toKMTs,35 the number of MAPs that bind one KMT isunlikely to be small. For comparison, Dam1 ringcontains 16 subunits,44 while in the sleeve model therewere 65 MAPs per KMT.20
Association rate for MAP–MT binding (kon) Theplausible range for the association rate of kinetochore
ZAYTSEV et al.

MAP was estimated using available in vitro data forNDC80 complex. The approximate volume of thekinetochore in PtK1 cells is estimated based on datafrom McDonald et al.26: 0.45 9 0.45 9 0.1 =0.02 lm3, so the approximate concentration of kine-tochore-bound NDC80 is 50 lM. From the associa-tion rate of S. cerevisiae NDC80 protein measuredin vitro (1.2 lM�1 s�1, as reported in Powers et al.33)we estimate that kon is 1.2 9 50/12 = 5 s�1. Theanalogous estimate for human NDC80 complex is95 s�1.41 In our simulations we used the range of konfrom 1 to 100 s�1.
Dissociation rate (koff) was varied in the model toachieve the physiological KMT lifetime: 3.5–10 min.11,13 This molecular parameter corresponds tothe lifetime (= 1/koff) of molecular interactionbetween MAP and MT, so we also refer to it as MAP’sresidency time. Only model solutions for which koffwas larger than 2 s�1 were analyzed to ensure that ourconclusions do not depend strongly on MT dynamics.Indeed, for residency time <500 ms, the MAP shoulddetach on average faster than the average dissociationof tubulin dimers from the depolymerizing KMT plus-end, assuming that dissociation takes place at1 lm min�1, the rate of KMT depolymerization.32
The probability of a new MT to encounter one site(Pat) was estimated based on a configuration at steady-state, when the rate of formation of new MT attach-ments V+ equals to V�—the rate of MTs detachmentThe rate V+ is proportional to the product of Pat andassociation rate kon. It is also proportional to the totalnumber of MAPs in one site N0, the total number ofbinding sites Nsites and the normalized kinetochorearea that is available for MT binding. Based on elec-tron microscopy studies,26 which found that in PtK1cells the KMTs were located at least Lmin distancefrom each other, each MT occupies the area(p 9 L2
min). This leads to an additional factor in theexpression for V+ that corresponds to the ratiobetween kinetochore area available for MT binding(L2
kin � NMT 9 p 9 L2min) and the total kinetochore
area (L2kin). Therefore, the rate of formation of new
MT attachments V+ is given by:
Vþ ¼ Pat � kon �N0 �Nsites �L2kin �NMT � p� L2
min
L2kin
ð11Þ
where Lkin = 450 nm is the linear size of the kineto-chore, Lmin = 35 nm is minimal distance between theKMTs.26
If KMT detachments are stochastic, the rate ofdetachment (V�) is:
V� ¼ NMT � ln 2=s ð12Þ
where NMT is the average number of MTs in thekinetochore fiber and s is the average KMT lifetime,which characterizes the rate of KMT turn-over.
At steady-state, such as seen at metaphase kineto-chores, there is no net change in the number of MTs.Therefore:
Pat ¼ NMT � ln 2=s� L2kin
L2kin �NMT � p� L2
min
� 1
kon �N0 �Nsitesð13Þ
Using NMT = 25 (McDonald et al.26) and s =10 min (DeLuca et al.13), we obtain Pat = 1.2 9 10�5.This parameter was fixed in all model calculations, butwe find that its exact value does not affect the majorresults of our study.
Time step for iterations (Dt) was chosen to be at leasttwo orders of magnitude smaller than the fastest timeparameter. For kon = 10 s�1, Dt was chosen as 1 ms.
Cooperativity parameter (x) The plausible range forthe cooperativity parameter was also estimated frompublished results for NDC80 complex since it is themost well studied kinetochore MAP. NDC80 bindingto MTs is known to be cooperative,10 but the estimateddegree of cooperativity based on fluorescent micros-copy is low: x = 3.4, which corresponds to Hill’scoefficient 2.2.41 However, other authors suggest amuch more cooperative interaction.3,4 This conclusionwas based in part on the highly uneven decoration ofthe MTs by NDC80 in vitro, as viewed with cryo-electron microscopy (Fig. 2a). To estimate the value ofx that could have produced such heterogeneous dec-oration, we used a simple stochastic model, in whichone protofilament was represented by a linear array of104 binding sites (Fig. 2b). With this model we calcu-lated the average size of a cluster (number of MAPsbound adjacently on the array) as a function of x. Thisdependency was then extrapolated to the cluster size of90 MAPs (see legend to Fig. 2a), leading to x = 400(corresponding to Hill’s coefficient of 8.5). This valueis the underestimate since the actual length of thedecorated MT was likely longer than that used for ourestimate of cluster size. For comparison, the coopera-tivity of oxygen binding to hemoglobin has Hill’scoefficient 2.3–3.0.19 For our calculations, we varied xin 1–400 range.
RESULTS AND DISCUSSION
Fraction of MT-Bound MAPs as a Key Determinant ofthe Lifetime of MT Attachment
First, we used the model of a single MT-binding sitethat contained N0 = 12 individual MAPs. The system
Molecular Model of a Kinetochore–Microtubule Binding Site

of Eq. (3) was solved analytically to obtain a steady-state solution for different molecular kinetic rates ofthe MAP’s binding (kon) and unbinding (koff) reac-tions. This led to the average KMT lifetime of MTattachment to the MT-binding site, i.e., the timeinterval during which at least one MAP was found inthe MT-bound state. Figure 3a shows that when themolecule rates are varied from 1 to 100 s�1, the aver-age KMT lifetime changes more than 3 orders ofmagnitude from 1 to 103 min. For all parameters val-ues, however, there was a physiological solution thatcorresponds to the measured MT stability in meta-phase (10 min). With increasing kon, the value of koffthat provided the physiological solution also increased.Such solutions were found within a narrow sector on atwo-dimensional plot of MT stability (white color,Fig. 3a), suggesting that a ratio of these constants,referred to as the dissociation constant KD = koff/kon,controls the average KMT lifetime. We plotted theaverage KMT lifetime as a function of the dissociationconstant and found that the resulting dependence isvery sharp (Fig. 3b). For example, when kon = 10 s�1
(blue curve) only 20% range in KD values spans thephysiologically rate of KMT turnover in prometaphaseand metaphase and even includes the lifetime of thehighly stable MTs in cells with inhibited KMT turn-over. Interestingly, changing the kon from 1 to 100 s�1,which includes the likely physiological range for thisparameter (see ‘‘Choice of Model Parameters’’ sec-tion), shifted this curve slightly, while the range of KD
values at which metaphase MT stability was achievedremained in a very narrow range: from 0.5 to 1.2. Inthis range, the average KMT lifetime dependedstrongly on KD (Fig. 3b). To analyze the origin of thissharp dependence, we calculated the average numberof MAPs that were in contact with the MT for dif-ferent KD values. When KD vas varied from 0 to 10, thenumber of MT-bound MAPs decreased sharply from
12, the number of available MAPs in one MT-bindingsite, to less than 2 MT-bound complexes per KMT(Fig. 3c). Importantly, there was no significant differ-ence in the predicted number of MT-bound MAPs fordifferent values of the association rate kon, and thecurves for different kons overlapped completely. Forvalues of KD in the range of 0.5–1.2, the averagenumber MAPs that were bound to MT was very nar-row: 6–8, corresponding to the fraction of boundMAPs of 0.50–0.67. The change in MT-binding affinityduring mitotic progression is a consequence of a verysmall increase in the average number of MT-boundMAPs: from 12 available MAPs only 1 more MAP onaverage is found in the MT-attached state in meta-phase vs. prometaphase. We conclude that when theMT-binding site contains multiple MAPs that attachrandomly to one MT, the difference in binding of onlyfew molecules spans the entire physiological range ofMT stability.
Highly Transient Molecular Interactions Underlie thePhysiological Attachments Between the MT and
Kinetochore Binding Site
Although the exact values of the kinetic constantsfor kinetochore MAPs in vivo are not known, the rel-atively weak impact of kon on the number of MT-bound MAPs for a given value of KD allows the ex-plicit prediction of the relationship between the time-scales of molecular interactions and the average KMTlifetime. Figure 3d shows that the MT-residency timeof the individual MAPs that produces the biologicallyrelevant stability of MT attachments is extremelynarrow. Even when the average KMT lifetime as longas 104 s, which corresponds to the highly stabilizedKMTs, is included in this range the lifetime ofmolecular interactions lies between 100 and 250 ms.These results were calculated for the MT-binding site
FIGURE 2. Quantitative estimation of the range of cooperativity parameter for NDC80 complexes. (a) Cryo-electron microscopyimage of the MTs pre-incubated with soluble NDC80 protein shows the drastically different degree of protein decoration. Thelength of MT on the left is about 350 nm, which corresponds to 90 NDC80 complexes bound to each protofilament, assuming thatNDC80 binds every tubulin monomer.45 Bar is 25 nm. Reproduced with permission from Alushin et al.4 (b) Simplified model toestimate the degree of cooperativity that leads to complete decoration of one but not the adjacent MT, as seen in (a). All bindingsites are unoccupied at the beginning of simulation; then MAPs (red circles) bind with association rate kon but their dissociation isinhibited due to cooperativity. See ‘‘Model Description’’ for details. (c) Plot shows how the cooperativity parameter affects theaverage size of a cluster of MAPs. Calculated for kon = 1 s21 and on average 50% occupancy of the binding sites in the linear array.
ZAYTSEV et al.

containing 12 MT-binding proteins. The exact numberof the molecular links between the kinetochore and oneMT is not known, but it is likely to be similar to thenumber we used or higher. For example, the estimatednumber of the NDC80 complexes, which represent themajor MT-binding component of the kinetochore is 6–20 per MT,5,22,24 and additional attachments can bemade by other kinetochore MAPs.35 Importantly, themain conclusions of the MT-site model do not dependon the number of MAPs that form MT binding site.Indeed, with increasing number of MAPs per MT-binding site, the dependency in Fig. 3d shifts to evenshorter molecular lifetimes, increasing the disparitybetween two time scales. This can be seen, for example,from the results of analogous calculation for N0 = 20
MAPs per MT, shown in Fig. 3d in red. Also, withmore MAPs per site, the curve becomes steeper,implying that for larger N0, the physiological adjust-ment of the MT turnover during mitosis requires evensmaller changes in the kinetics of molecular interac-tions. For example, for N0 = 12 the lifetime of MAP’sbinding in metaphase is 30 ms longer than in promet-aphase, while for N0 = 20 this time difference is14 ms.
Cooperativity Strongly Amplifies the Influence ofMolecular Parameters on MT Attachment Stability
The above calculations were carried out for a modelwhich assumed that MAPs binding to MT was not
FIGURE 3. Analysis of a model with single MT-binding site in case of non-cooperative binding. (a) Two-colored chart showsaverage KMT lifetime at one site with MAPs that bind the MT with indicated association and dissociation rates. Horizontal hatchingcorresponds to highly unstable MTs with lifetimes <1 min. Vertical hatching corresponds to overly stabilized MTs with lifetimes>103 min. Gray bar at the bottom of the plot indicates the region with model solutions for koff < 2 s21, which was excluded fromsubsequent analysis. (b) Plots show the relationship between average KMT lifetime and dissociation constant KD for individualMAPs in a MT-binding site for indicated values of kon. Curve for kon = 1 s21 corresponds to model solutions for which koff < 2 s21,so they were excluded from further analysis. One can see that the impact of absolute value of kon on this dependence is small.‘‘Stabilized’’ MTs have lifetime 200 min; such stable KMTs are not seen during normal mitosis but can be obtained when Aurora Bkinase, which is one of the major MT-destabilizing factors, is inhibited.11 (c) Plots show how the number of NDC80 complexes perKMT depends on the value of dissociation constant for three different values of kon. The predicted results do not depend on thevalue of kon, so the curves overlap completely. Broken line shows the maximum number of NDC80 complexes per site. Pink barshows the range of KD that corresponds to the physiological KMT stability. (d) Dependence of the average KMT lifetime on thelifetime of individual MAPs was calculated for KD values from 0.4 to 1; these values correspond to 6–8 MAPs bound to one MT atsteady-state (pink vertical bar in (c)). This plot was obtained for kon = 10 s21 but similar results were obtained for kon ranging from1 to 100 s21. Different colors show model solutions for different number of MAPs per MT-binding site (12 and 20).
Molecular Model of a Kinetochore–Microtubule Binding Site
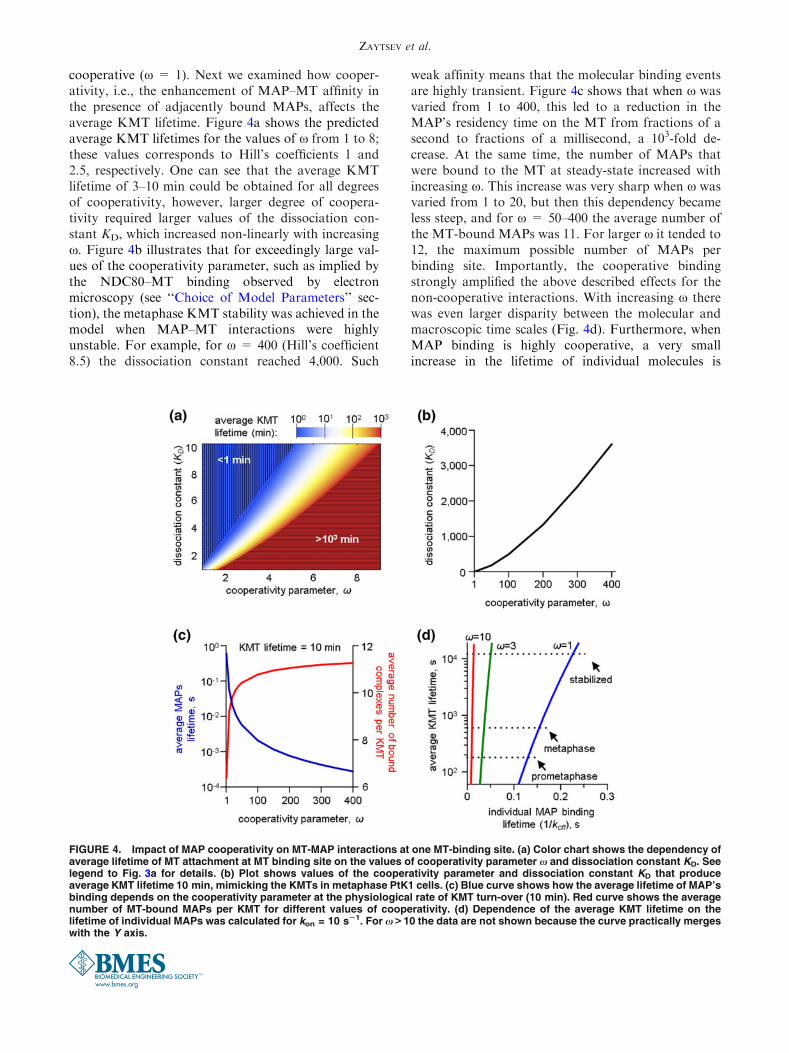
cooperative (x = 1). Next we examined how cooper-ativity, i.e., the enhancement of MAP–MT affinity inthe presence of adjacently bound MAPs, affects theaverage KMT lifetime. Figure 4a shows the predictedaverage KMT lifetimes for the values of x from 1 to 8;these values corresponds to Hill’s coefficients 1 and2.5, respectively. One can see that the average KMTlifetime of 3–10 min could be obtained for all degreesof cooperativity, however, larger degree of coopera-tivity required larger values of the dissociation con-stant KD, which increased non-linearly with increasingx. Figure 4b illustrates that for exceedingly large val-ues of the cooperativity parameter, such as implied bythe NDC80–MT binding observed by electronmicroscopy (see ‘‘Choice of Model Parameters’’ sec-tion), the metaphase KMT stability was achieved in themodel when MAP–MT interactions were highlyunstable. For example, for x = 400 (Hill’s coefficient8.5) the dissociation constant reached 4,000. Such
weak affinity means that the molecular binding eventsare highly transient. Figure 4c shows that when x wasvaried from 1 to 400, this led to a reduction in theMAP’s residency time on the MT from fractions of asecond to fractions of a millisecond, a 103-fold de-crease. At the same time, the number of MAPs thatwere bound to the MT at steady-state increased withincreasing x. This increase was very sharp when x wasvaried from 1 to 20, but then this dependency becameless steep, and for x = 50–400 the average number ofthe MT-bound MAPs was 11. For larger x it tended to12, the maximum possible number of MAPs perbinding site. Importantly, the cooperative bindingstrongly amplified the above described effects for thenon-cooperative interactions. With increasing x therewas even larger disparity between the molecular andmacroscopic time scales (Fig. 4d). Furthermore, whenMAP binding is highly cooperative, a very smallincrease in the lifetime of individual molecules is
FIGURE 4. Impact of MAP cooperativity on MT-MAP interactions at one MT-binding site. (a) Color chart shows the dependency ofaverage lifetime of MT attachment at MT binding site on the values of cooperativity parameter x and dissociation constant KD. Seelegend to Fig. 3a for details. (b) Plot shows values of the cooperativity parameter and dissociation constant KD that produceaverage KMT lifetime 10 min, mimicking the KMTs in metaphase PtK1 cells. (c) Blue curve shows how the average lifetime of MAP’sbinding depends on the cooperativity parameter at the physiological rate of KMT turn-over (10 min). Red curve shows the averagenumber of MT-bound MAPs per KMT for different values of cooperativity. (d) Dependence of the average KMT lifetime on thelifetime of individual MAPs was calculated for kon = 10 s21. For x > 10 the data are not shown because the curve practically mergeswith the Y axis.
ZAYTSEV et al.

dramatically amplified within the binding site, therebystrongly stabilizing the MT attachment. For example,for x = 100 (Hill’s coefficient 7.8), the physiologicalMT stabilization during mitotic progression wouldrequire that x increases less than 5%. Such high sen-sitivity to the input values can lead to a strong insta-bility due to random changes in molecular parametersor if there is a slight variability in the number of MAPsper MT-binding site.
Kinetochore Interface with Multiple MT-Binding Sitesis Highly Sensitivity to the Molecular Parameters of
MT-Binding Proteins
Kinetochore–MT interface is thought to containmultiple MT-binding sites, so we examined whetherour conclusions obtained with the one-site model werevalid when the entire kinetochore–MT interface wasconsidered. As above, each site was modeled as con-taining 12 MAPs. One MT could simultaneouslyinteract with all proteins forming this, but not theother sites. The total number of binding sites in ourmodel was chosen to match the maximum number ofMTs that could bind to the kinetochores in PtK1 cells,as found with electron microscopy (Nsites = 50;McEwen et al.27). Since in the model the total numberof sites is twice larger than the average number ofKMTs in these cells (25),26,27 the model can examinethe kinetochore–MT occupancy without imposing asignificant limit on the number of attached MTs. Thekinetochore model also has an additional parameterPat, which describes the probability for a new MT toencounter the kinetochore MT-binding site (Fig. 5a).The value of this parameter was estimated as specifiedin the section ‘‘Choice of Model Parameters’’(Table 1). Molecular interactions between MT andMAPs were calculated for x = 3 (Hill’s coefficient1.7). For this value of cooperativity, the steady-staterate of KMT turnover was obtained for KD = 2.7.Figure 5b shows that for these parameter values, thenumber of kinetochore-bound MTs reached a plateauin 10-15 min, which corresponds well to the time ofkinetochore fiber maturation in PtK1 cells.27 There is anoticeable stochasticity in the kinetics of KMTattachments but at steady-state, the predicted numberof KMTs lies between 20 and 30, which is in a goodagreement with experiment26,27 (Fig. 5c). Thus, themodel provides good quantitative description of sev-eral key aspects of kinetochore–MT interactions,including the rate of KMT turnover, kinetics of theformation of the kinetochore fiber, and its average size.
We then examined the range of changes in molec-ular parameters that could bring about the dynamicchanges in average KMT lifetime that are normallyseen in mammalian cells as they transition from
prometaphase to metaphase. Figure 5d shows the re-sults of two extreme scenarios, in which such stabil-ization was achieved either by adjusting only thedissociation constant or the cooperativity. If regulationis achieved via changing the KD, the corresponding
FIGURE 5. Model of kinetochore interface with multiple MT-binding sites. (a) Schematic of the kinetochore interface withmultiple MT-binding sites (only part of the kinetochore isshown). After MT encounters one of the binding sites withprobability Pat, it immediately initiates molecular interactionswith all MAPs within this site. Values of model parameters thatwere used to obtain results in this figure are listed in Table 1.(b) Results of three independent simulations of the kineto-chore model. Time zero is a start of calculation, correspond-ing to the initiation of MT binding to the kinetochore. Grey barindicates the range for the number of KMTs that was found atmetaphase in PtK1 cells.26 (c) Distribution of the number ofMTs per kinetochore in the model with multiple MT bindingsites at steady-state. The average predicted KMT number is25.6 per kinetochore, consistent with structural studies inPtK1 cells.26 (d) This graph illustrates how molecular param-eters KD or x need to be adjusted to provide the observedstabilization of KMT attachments during metaphase. Theaverage KMT lifetimes in prometaphase and metaphase were3.5 and 10 min, respectively.11,13 The average KMT lifetime inprometaphase was obtained for KD = 3.2 and x = 3; to calcu-late average KMT lifetime in metaphase, for columns ‘‘KD isregulated’’ the value of x was not changed, and KD was foundto be 2.7, which is 84% of the prometaphase value. For ‘‘x isregulated’’ columns the value of KD was not changed, and xwas found to be 3.4, which is 113% of its prometaphase value.(e) Schematic that illustrates quantitative relationshipbetween two time-scales in the model: the lifetime of molec-ular interactions (microscopic parameters KD and x) andaverage KMT lifetime (experimentally measured KMT turnoverrate).
Molecular Model of a Kinetochore–Microtubule Binding Site

stabilization would require that it decreases 16%; if thecooperativity parameter x is the main regulatory fac-tor—it would need to increase by 13%. Obviously,when both parameters are adjusted, the correspondingchanges in each of the parameters would be evensmaller. Thus, the KMT interface with multiple sitesstrongly amplifies the molecular features of MT-bind-ing MAPs, such that small changes in their affinityand/or cooperativity have a pronounced effect on thelife time of KMT attachments.
In summary, with a stochastic mathematical model,we systematically examined for the first time how themolecular characteristics of a kinetochore MAP influ-ence the experimentally measured behavior of the MT-containing kinetochore fiber. The outcome of suchtheoretical findings clearly depends on the exactmolecular design of the modeled interface betweenkinetochore and MTs. The design of the MT-bindingsite described here is simple and straightforward, andwe show that the main model conclusions hold true (orare enhanced) for a very wide range of model param-eters, most importantly for different number of MAPsper MT-binding site. Even though the physiologicalrate of KMT turnover can be achieved for all values ofbinding/unbinding rates, the range of correspondingKD values is very narrow and it indicates that thelifetime of molecular bindings of the kinetochoreMAPs must be 4 orders of magnitude shorter than theaverage KMT lifetime (Fig. 5e). The molecular MAP–MT binding interactions are therefore highly transientand each binding event lasts for only 30–50 ms(Fig. 4d). Importantly, when MT-binding site containsmultiple MAPs, the small changes in their molecularconstants are predicted to have a strong effect onKMT stability. This conclusion remains valid for theKMT interface containing multiple MT-binding sitesregardless of their spatial arrangement, as long as theybind MTs independently of each other.
Future work is necessary to determine moleculardetails of MT-interactions of the kinetochore proteincomplexes such as NDC80, Ska1 and others, and to
measure how they change during mitotic progression,so that these model predictions can be tested in aquantitative way. It should be noted, however, thatbinding between MAP and MT might be affected bythe dynamic nature of MT polymers. Although ourmodel does not incorporate the MT dynamics explic-itly, model solutions considered here correspond onlyto the MAP–MT interactions that are faster than therate of tubulin subunit dissociation. In this range ofmodel parameters, the predicted lifetime of KMTattachments should be relatively insensitive to thetubulin dynamics per se. MT dynamics can also man-ifest itself in MAP–MT interactions if MAP’s bindingaffinity is modified by tubulin’s biochemistry or shape.While some MAPs, e.g., Ska1 complex, are likely tobind the polymerizing and depolymerizing MT endswith similar affinity, the binding strength of NDC80 todifferent MT structures is different.4,36 However, high-resolution localization studies suggest that at thekinetochores the NDC80 complex binds to the MTlattice, not MT tip,43 in which case its interactions withthe MTs should not depend on its dynamics and themain model conclusion remain unaffected. Much less isknown about how these molecular binding events areaffected by a load, an important feature of the kine-tochore physiology which is not yet included in ourmodel. Experiments with beads coated with purifiedproteins and isolated kinetochores in vitro show a rel-atively weak dependence of the MT attachment timeon a moderate load,1,16,33,42 but more direct measure-ments of how the magnitude and direction of forceaffect single molecule binding events, as modeled here,are not yet available. In this respect we note that if theaffinity between MT and kinetochore complexes, suchas NDC80, is weakened by force considerably, themodel conclusions continue to remain valid but thevalues of all molecular constants should be interpretedas force-dependent (i.e., the residency time of MAPs inthe absence of force could be longer than what ismodeled here, while the force-dependent interactionswill be expected to be highly transient).
TABLE 1. List of model parameters used for stochastic simulations of kinetochore interface with multiple MT-binding sites (datashown in Fig. 5).
Symbol Model parameter Value Units
kon association rate for a MAP 10 s�1
koff Dissociation rate for a MAP 27 s�1
KD = koff/kon MAP dissociation constant 2.7 Nonea
x Cooperativity parameter for MAPs–MT interactions 3 Nonea
Pat The probability of a new MT to encounter one MT-binding site 1.2 9 10�5 Nonea
N0 Number of MAPs per binding site 12 Nonea
Dt Time step in the computational algorithm 1 ms
Nsites Total number of MT-binding sites per kinetochore 50 Nonea
aDimensionless parameters.
ZAYTSEV et al.

Our modeling also suggests that the MT-binding ofthe kinetochore MAPs is unlikely to be very coopera-tive. This conclusion is supported by the recent findingthat the cooperativity of MT-NDC80 binding in vitrohad cooperativity parameter x = 3.4 ± 0.5 (Hill’scoefficient 2.2 ± 0.2; Umbreit et al.41). Our results donot support the view that kinetochore–MT interactionsare regulated in a significant way by the changes incooperativity of NDC80–MT binding.3,4 Figure 5dshows that even when cooperativity is weak (Hill’scoefficient 1.7), only a 15% change in KD is sufficientfor eliciting the MT stabilization typical to metaphase.Such decrease in the dissociation constant correspondsto the change in energy of MT binding of only 0.24kBT. When cooperativity is stronger, e.g., Hill’s coef-ficient is 3, the physiological stabilization will have torely on roughly twice smaller changes in the MT-binding energy. Such a regulatory mechanism seemshighly unlikely because of its sensitivity to naturalvariability in molecular parameters of MAPs and theirnumber, as well as due to thermal noise. It is not clearwhy the electron microscopy images of MTs preincu-bated with highly concentrated solution of re-combinant NDC80 produce highly heterogeneouspopulation of MT decoration (Figure 2A, from Alu-shin et al.4). Similar images are also obtained withother MT-binding proteins, although their biochemicalanalyses and established biological functions do notinvolve a high degree of cooperativity.34,37 It seemslikely that a high heterogeneity of MT decorationreported by cryo-electron microscopy might be anartifact of some aspect of a sample preparation pro-cedure. Our experimental work with GFP-labeledNDC80 proteins shows the homogeneous decorationof MTs when experiments are carried out with reagentsthat block the non-specific protein binding to a surfaceof microscopy chamber, but highly heterogeneous MTdecoration is seen when such blocking reagents areomitted (unpublished observation). Future workshould examine quantitatively how cooperativity ofNDC80–MT binding changes in response to mitoticphosphorylation.
The key feature that sets apart the current model ofkinetochore–MT interface and leads to these molecularconclusions is the independent character of individualMT-binding events between kinetochore MAPs andMT. Previous mathematical models of the kineto-chore–MT binding site included specific structuralfeatures that limited the independence of MAP–MTinteractions.6,15,20,21,25,33,39 Lifting this restriction has asurprisingly large effect on the kinetics of MT attach-ment and this system’s thermodynamics. For example,in Hill’s sleeve model, the number of possible MT–MAPs binding configuration is only 65, which is equalto the number of MAPs in the sleeve.20 This system
tends asymptotically to a state with minimum freeenergy, when the MT is fully inserted and all 65 MAPconnections are made. This outcome is not affectedsignificantly by the molecular constants of MAP–MTbinding. However, when MAPs can bind to the MTindependently, as in our model, the number of possibleconfigurations is significantly larger. For 12 MAPs perbinding site, there are 4096 possible MAP–MT con-figurations, because multiple combinations of MAPscan produce a configuration with the same number ofmolecular bonds. Consequently, the entropic compo-nent in this system is significantly larger than in Hill’ssleeve, and the steady-state solution is achieved whenthe average number of MT-bound MAPs is less thantotal number of available MAPs per site. The lifetimeof such MT attachments depends strongly on themolecular parameters of MAP–MT binding. This andother new insights into the general aspects of MTinteractions with the MAP-containing sites will hope-fully promote further theoretical and experimentalanalysis of the overall design and molecular charac-teristics of mitotic kinetochore.
ACKNOWLEDGMENTS
We thank members of the Grishchuk and Ataulla-khanov laboratories, J. DeLuca and E. Ballister forstimulating discussions; A. Potapenko for reading ofthe manuscript; J.R. McIntosh for supporting thisproject (GM033787). This work was supported byNational Institutes of Health Grant GM098389 toELG, by Russian Academy of Sciences PresidiumGrants ‘‘Mechanisms of the Molecular Systems Inte-gration’’ and ‘‘Molecular and Cell Biology programs’’and by Russian Fund for Basic Research Grant 12-04-00111-a to FIA. ELG is a Kimmel Scholar.
REFERENCES
1Akiyoshi, B., K. K. Sarangapani, A. F. Powers, C. R.Nelson, S. L. Reichow, H. Arellano-Santoyo, T. Gonen, J.A. Ranish, C. L. Asbury, and S. Biggins. Tension directlystabilizes reconstituted kinetochore–microtubule attach-ments. Nature 468(7323):576–579, 2010.2Alberts, B., A. Johnson, J. Lewis, M. Raff, K. Roberts,and P. Walter. Molecular Biology of the Cell (5th ed.).New York: Garland Science, pp. 1082–1086, 2008.3Alushin, G. M., V. Musinipally, D. Matson, J. Tooley, P.T. Stukenberg, and E. Nogales. Multimodal microtubulebinding by the Ndc80 kinetochore complex. Nat. Struct.Mol. Biol. 19(11):1161–1167, 2012.4Alushin, G. M., V. H. Ramey, S. Pasqualato, D. A. Ball,N. Grigorieff, A. Musacchio, and E. Nogales. The Ndc80kinetochore complex forms oligomeric arrays alongmicrotubules. Nature 467(7317):805–810, 2010.
Molecular Model of a Kinetochore–Microtubule Binding Site

5Aravamudhan, P., I. Felzer-Kim, and A. P. Joglekar. Thebudding yeast point centromere associates with two Cse4molecules during mitosis. Curr. Biol. 23(9):770–774, 2013.6Armond, J. W., and M. S. Turner. Force transduction bythe microtubule-bound Dam1 ring. Biophys. J . 98(8):1598–1607, 2010.7Bakhoum, S. F., G. Genovese, and D. A. Compton.Deviant kinetochore microtubule dynamics underlie chro-mosomal instability. Curr. Biol. 19(22):1937–1942, 2009.8Bakhoum, S. F., S. L. Thompson, A. L. Manning, and D.A. Compton. Genome stability is ensured by temporalcontrol of kinetochore–microtubule dynamics. Nat. CellBiol. 11(1):27–35, 2009.9Cheeseman, I. M., S. Anderson, M. Jwa, E. M. Green, J.Kang, J. R. Yates, 3rd, C. S. Chan, D. G. Drubin, and G.Barnes. Phospho-regulation of kinetochore-microtubuleattachments by the Aurora kinase Ipl1p. Cell 111(2):163–172, 2002.
10Cheeseman, I. M., J. S. Chappie, E. M. Wilson-Kubalek,and A. Desai. The conserved KMN network constitutes thecore microtubule-binding site of the kinetochore. Cell127(5):983–997, 2006.
11Cimini, D., X. Wan, C. B. Hirel, and E. D. Salmon. Aurorakinase promotes turnover of kinetochore microtubules toreduce chromosome segregation errors. Curr. Biol.16(17):1711–1718, 2006.
12Civelekoglu-Scholey, G., B. He, M. Shen, X. Wan, E.Roscioli, B. Bowden, and D. Cimini. Dynamic bonds andpolar ejection force distribution explain kinetochore oscil-lations in PtK1 cells. J. Cell Biol. 201(4):577–593, 2013.
13DeLuca, J. G., W. E. Gall, C. Ciferri, D. Cimini, A. Mu-sacchio, and E. D. Salmon. Kinetochore microtubuledynamics and attachment stability are regulated by Hec1.Cell 127(5):969–982, 2006.
14Dong, Y., K. J. Vanden Beldt, X. Meng, A. Khodjakov,and B. F. McEwen. The outer plate in vertebrate kineto-chores is a flexible network with multiple microtubuleinteractions. Nat. Cell Biol. 9(5):516–522, 2007.
15Efremov, A., E. L. Grishchuk, J. R. McIntosh, and F. I.Ataullakhanov. In search of an optimal ring to couplemicrotubule depolymerization to processive chromosomemotions. Proc. Natl. Acad. Sci. U.S.A. 104(48):19017–19022, 2007.
16Franck, A. D., A. F. Powers, D. T. Gestaut, T. Gonen, T.N. Davis, and C. L. Asbury. Tension applied through theDam1 complex promotes microtubule elongation providinga direct mechanism for length control in mitosis. Nat. CellBiol. 9(7):832–837, 2007.
17Gardner, M. K., C. G. Pearson, B. L. Sprague, T. R.Zarzar, K. Bloom, E. D. Salmon, and D. J. Odde. Tension-dependent regulation of microtubule dynamics at kineto-chores can explain metaphase congression in yeast. Mol.Biol. Cell 16:3764–3775, 2005.
18Grishchuk, E. L., J. R. McIntosh, M. I. Molodtsov, and F.I. Ataullakhanov. Comprehensive Biophysics, Vol. 4.Amsterdam: Elsevier, pp. 93–117, 2012.
19Hill, A. V. The possible effects of the aggregation of themolecules of haemoglobin on its dissociation curves. J.Physiol. 40:iv–vii, 1910.
20Hill, T. L. Theoretical problems related to the attachmentof microtubules to kinetochores. Proc. Natl. Acad. Sci.U.S.A. 82:4404–4408, 1985.
21Joglekar, A. P., and A. J. Hunt. A simple, mechanisticmodel for directional instability during mitotic chromo-some movements. Biophys. J . 83(1):42–58, 2002.
22Johnston, K., A. Joglekar, T. Hori, A. Suzuki, T. Fukag-awa, and E. D. Salmon. Vertebrate kinetochore proteinarchitecture: protein copy number. J. Cell Biol. 189(6):937–943, 2010.
23Jordan, M. A., and K. Kamath. How do microtubule-tar-geted drugs work? An overview. Curr. Cancer Drug Targets7(8):730–742, 2007.
24Lawrimore, J., K. S. Bloom, and E. D. Salmon. Pointcentromeres contain more than a single centromere-specificCse4 (CENP-A) nucleosome. J. Cell Biol. 195(4):573–582,2011.
25Liu, J., and J. N. Onuchic. A driving and coupling ‘‘Pac-Man’’ mechanism for chromosome poleward translocationin anaphase A. Proc. Natl. Acad. Sci. U.S.A. 103(49):18432–18437, 2006.
26McDonald, K. L., E. T. O’Toole, D. N. Mastronarde, andJ. R. McIntosh. Kinetochore microtubules in PTK cells. J.Cell Biol. 118(2):369–383, 1992.
27McEwen, B. F., A. B. Heagle, G. O. Cassels, K. F. Buttle,and C. L. Rieder. Kinetochore fiber maturation in PtK1cells and its implications for the mechanisms of chromo-some congression and anaphase onset. J. Cell Biol.137(7):1567–1580, 1997.
28McIntosh, J. R., E. L. Grishchuk, M. K. Morphew, A. K.Efremov, K. Zhudenkov, V. A. Volkov, I. M. Cheeseman,A. Desai, D. N. Mastronarde, and F. I. Ataullakhanov.Fibrils connect microtubule tips with kinetochores: amechanism to couple tubulin dynamics to chromosomemotion. Cell 135(2):322–333, 2008.
29McIntosh, J. R., E. L. Grishchuk, and R. R. West. Chro-mosome-microtubule interactions during mitosis. Annu.Rev. Cell Dev. Biol. 18:193–219, 2002.
30McIntosh, J. R., E. O’Toole, K. Zhudenkov, M. Morphew,C. Schwartz, F. I. Ataullakhanov, and E. L. Grishchuk.Conserved and divergent features of kinetochores andspindle microtubule ends from five species. J. Cell Biol.200(4):459–474, 2013.
31Molodtsov, M. I., E. L. Grishchuk, A. K. Efremov, J. R.McIntosh, and F. I. Ataullakhanov. Force production bydepolymerizing microtubules. Proc. Natl. Acad. Sci. U.S.A.102(12):4353–4358, 2005.
32Nicklas, R. B. Chromosome velocity during mitosis as afunction of chromosome size and position. J. Cell Biol.25:119–135, 1965.
33Powers, A. F., A. D. Franck, D. R. Gestaut, J. Cooper, B.Gracyzk, R. R. Wei, L. Wordeman, T. N. Davis, and C. L.Asbury. The Ndc80 kinetochore complex forms load-bearing attachments to dynamic microtubule tips via biaseddiffusion. Cell 136(5):865–875, 2009.
34Rank, K. C., and I. Rayment. Functional asymmetry inkinesin and dynein dimers. Biol. Cell 105(1):1–13, 2013.
35Santaguida, S., and A. Musacchio. The life and miracles ofkinetochores. EMBO J. 28(17):2511–2531, 2009.
36Schmidt, J. C., H. Arthanari, A. Boeszoermenyi, N. M.Dashkevich, E. M. Wilson-Kubalek, N. Monnier, M.Markus, M. Oberer, R. A. Milligan, M. Bathe, G. Wagner,E. L. Grishchuk, and I. M. Cheeseman. The kinetochore-bound Ska1 complex tracks depolymerizing microtubulesand binds to curved protofilaments. Dev. Cell 23(5):968–980, 2012.
37Shen, Q. T., P. P. Hsiue, C. V. Sindelar, M. D. Welch,K. G. Campellone, and H. W. Wang. Structural insightsinto WHAMM-mediated cytoskeletal coordination dur-ing membrane remodeling. J. Cell Biol. 199(1):111–124,2012.
ZAYTSEV et al.

38Shivaraju, M., J. R. Unruh, B. D. Slaughter, M. Mattingly,J. Berman, and J. L. Gerton. Cell-cycle-coupled structuraloscillation of centromeric nucleosomes in yeast. Cell 150(2):304–316, 2012.
39Shtylla, B., and J. P. Keener. A mechanomolecular modelfor the movement of chromosomes during mitosis drivenby a minimal kinetochore bicyclic cascade. J. Theor. Biol.263(4):455–470, 2010.
40Thompson, S. L., S. F. Bakhoum, and D. A. Compton.Mechanisms of chromosomal instability. Curr. Biol. 20(6):R285–R295, 2010.
41Umbreit, N. T., D. R. Gestaut, J. F. Tien, B. S. Vollmar, T.Gonen, C. L. Asbury, and T. N. Davis. The Ndc80 kine-tochore complex directly modulates microtubule dynamics.Proc. Natl. Acad. Sci. U.S.A. 109(40):16113–16118, 2012.
42Volkov, V. A., A. V. Zaytsev, N. Gudimchuk, P. M. Gris-som, A. L. Gintsburg, F. I. Ataullakhanov, J. R. McIntosh,and E. L. Grishchuk. Long tethers provide high-force cou-pling of the Dam1 ring to shortening microtubules. Proc.Natl. Acad. Sci. U.S.A. 110(19):7708–7713, 2013.
43Wan, X., R. P. O’Quinn, H. L. Pierce, A. P. Joglekar, W. E.Gall, J. G. DeLuca, C. W. Carroll, S. T. Liu, T. J. Yen, B.
F. McEwen, P. T. Stukenberg, A. Desai, and E. D. Salmon.Protein architecture of the human kinetochore microtubuleattachment site. Cell 137(4):672–684, 2009.
44Westermann, S., H. W. Wang, A. Avila-Sakar, D. G.Drubin, E. Nogales, and G. Barnes. The Dam1 kinetochorering complex moves processively on depolymerizingmicrotubule ends. Nature 440(7083):565–569, 2006.
45Wilson-Kubalek, E. M., I. M. Cheeseman, C. Yoshioka, A.Desai, and R. A. Milligan. Orientation and structure of theNdc80 complex on the microtubule lattice. J. Cell Biol.182(6):1055–1061, 2008.
46Wollman, R., G. Civelekoglu-Scholey, J. M. Scholey, andA. Mogilner. Reverse engineering of force integrationduring mitosis in the Drosophila embryo. Mol. Syst. Biol.4:195, 2008.
47Zhai, Y., P. J. Kronebusch, and G. G. Borisy. Kinetochoremicrotubule dynamics and the metaphase–anaphase tran-sition. J. Cell Biol. 131(3):721–734, 1995.
48Zinkowski, R. P., J. Meyne, and B. R. Brinkley. The cen-tromere–kinetochore complex: a repeat subunit model.J. Cell Biol. 113(5):1091–1110, 1991.
Molecular Model of a Kinetochore–Microtubule Binding Site


![[Ernst Kurth] Ernst Kurth Selected Writings (Camb(BookFi.org)](https://img.pdfslide.us/doc/110x75/55cf92c2550346f57b99475f/ernst-kurth-ernst-kurth-selected-writings-cambbookfiorg.jpg)


![H.heine - 1835 Religion & Philosophy in Germany [Camb]](https://img.pdfslide.us/doc/110x75/5695d0d81a28ab9b02941b3b/hheine-1835-religion-philosophy-in-germany-camb.jpg)