Embed Size (px)
Citation preview
Zambia ARV Supply Chain Costs Pilot of the Supply Chain Costing Tool
MARCH 2010
This publication was produced for review by the US Agency for International Development It was prepared by the USAID | DELIVER PROJECT Task Order 1
Zambia ARV Supply Chain Costs Pilot of the Supply Chain Costing Tool
The authors views expressed in this publication do not necessarily reflect the views of the US Agency for International Development or the United States Government
USAID | DELIVER PROJECT Task Order 1 The USAID | DELIVER PROJECT Task Order 1 is funded by the US Agency for International Development under contract no GPO-I-01-06-00007-00 beginning September 29 2006 Task Order 1 is implemented by John Snow Inc in collaboration with PATH Crown Agents Consultancy Inc Abt Associates Inc Fuel Logistics Group (Pty) Ltd UPS Supply Chain Solutions The Manoff Group Inc and 3i Infotech The project improves essential health commodity supply chains by strengthening logistics management information systems streamlining distribution systems identifying financial resources for procurement and supply chain operation and enhancing forecasting and procurement planning The project also encourages policymakers and donors to support logistics as a critical factor in the overall success of their health care mandates
Recommended Citation Baruwa Elaine Marie Tien and David Sarley 2010 Zambia ARV Supply Chain Costs A Pilot of the Supply Chain Costing Tool Arlington Va USAID | DELIVER PROJECT Task Order 1
Abstract In January 2009 the USAID | DELIVER PROJECT Task Order 1 conducted an assessment of the cost of the antiretroviral (ARV) supply chain in Zambia
The surveyrsquos overall objective was to cost the logistics systems that distributes the commodities for Zambiarsquos antiretroviral therapy (ART) program using the Supply Chain Costing Tool developed by the USAID | DELIVER PROJECT This report presents the findings of the costing exercise as well as the implications from the results for Zambiarsquos ART program it also illustrates what the Supply Chain Costing Tool does and how its output can be used
Cover photo Zambia ARV Logistics System Training of Trainers September 2006
USAID | DELIVER PROJECT John Snow Inc 1616 Fort Myer Drive 11th Floor Arlington VA 22209 USA Phone 703-528-7474 Fax 703-528-7480 Email askdeliverjsicom Internet deliverjsicom
Contents
Acronyms v
Acknowledgements vii
Executive Summary ix
Introduction 1 Costing Approach3
Overview 3 Supply Chain Cost Function3 Mapping the Supply Chain4 Selective Sampling 4 Data Collection 7 Data Collection for Costing out the Zambia ARV Supply Chain12
Results of Zambia ARV Supply Chain Costs 13
Supply Chain Cost Estimates 19 Supply Chain Cost Estimates Disaggregated by Tier and Function 19 Limitations 26
System-wide Observations and Conclusions 27 Procurement Costs 27 Storage Costs 27 Transportation Costs 28
Conclusions31
Appendices
1 ARV Average Prices for Commodities Procured in 2008 (PipeLine 40 Zambia MSL)35
2 Sample Facilities by Criteria37
3 Tier 1 Sample Facilities (US$) 39
4 Lusaka Main District Supply Chain Costs (US$)41
5 Mpongwe District Supply Chain Costs (US$) 43
6 Ndola District Supply Chain Costing Statistics45
7 Estimating Total Delivered Costs ndash Ndola District47
8 Estimating Total Delivered Costs ndash Lusaka Main District49
9 Estimating Total Delivered Costs ndash Mpongwe Main District 51
10 Estimating Total Delivered Costs ndash Weighted Average Calculations53
iii
11 USAID | DELIVER PROJECT Supply Chain Costing Tool Pilot55
12 Contact List61
Figures 1 Supply Chain Costing Overview 3 2 Map of Zambia showing Lusaka Main Ndola and Mpongwe Districts5 3 Zambia Supply Chain Structure as used by the Supply Chain Costing Tool 6 4 Value of ARVs through the Tiers (Sampled Facilities Only) in US$2008 15 5 Volume of ARVs through the Tiers (Sampled Facilities Only) in m3 200816 6 Lusaka Main District Total Supply Chain Costs of Delivery at SDP22 7 Mpongwe District Total Supply Chain Costs of Delivery at SDP23 8 Ndola District District Total Supply Chain Costs of Delivery at SDP (US$) 25
Tables 1 Cross-Facility Comparisons of the Percentages of Delivered Costs x 2 Facilities Included in the Sample by Tier Logistic Function and Facility Type 7 3 Costing Tool Data Collection Discussion Guide Topics 8 4 Data Sources for Costing Inputs10 5 Supply Chain Costs Comparative Indicators Definitions and Formula10 6 Summary Figures for Value and Volume of ARVs Flowing Through Facilities in the
Costing Exercise Sample14 7 Estimate Total Costs of the Zambian ARV Supply ChainmdashTier 1 19 8 Cross-Facility Comparison as Percentage of Delivered Costs 26
iv
Acronyms
ART antiretroviral therapy
ARV antiretroviral
CHAI Clinton HIVAIDS Initiative
CHAZ Churches Health Association of Zambia
CIDRZ Centre for Infectious Disease Research in Zambia
CP cooperating partner
DCCDS Directorate of Clinical Care and Diagnostic Services
DFID Department for International Development (British)
DHO District Health Office
GFATM Global Fund to Fight AIDS Tuberculosis and Malaria
GRZ Government of Zambia
HACS HIVAIDS Commodity Security
HIVAIDS human immunodeficiency virusacquired immunodeficiency syndrome
HMIS health management information systems
JSI John Snow Inc
LSAT Logistics System Assessment Tool
LMIS logistics management information systems
MOH Ministry of Health
MSL Medical Stores Limited
NAC National HIVAIDSSTITB Council
NGO nongovernmental organizations
PEPFAR Presidentrsquos Emergency Plan for AIDS Relief
PMTCT prevention of motherndashto-child transmission
SC supply chain
SCMS supply chain management systems
SDP service delivery point
USAID US Agency for International Development
ZNAN Zambia National AIDS Network
ZNTB Zambia National Tenders Board
v
vi
Acknowledgements
The authors wish to express their appreciation for the people who took considerable time from their work to provide the authors with detailed comments your help strengthened the usefulness of this paper At the USAID | DELIVER PROJECT we thank Paul Dowling and Leslie Patykewich for their support and guidance At Abt Associates we thank Mursaleena Islam for her guidance and participation in the conception and design of the tool and Mark McEuen for his support
In Zambia the authors were fortunate enough to be supported by the USAID | DELIVER PROJECT country team including Walter Proper Wendy Nicodemus David Papworth and Peter Kisulo The authors are especially grateful to Paul Kamuna who spent considerable time with the team as they traveled throughout Zambia and they provided invaluable assistance with the data collection process The Zambia country office was exceptionally helpful and the authors owe a huge thanks for all the arrangements and travel that were kindly and efficiently provided The authors are also grateful to Dr Fundafunda of the Ministry of Health and Dirk Van Wyk of Crown Agents for their thorough review and thoughtful comments which significantly enhanced this report
Finally we thank USAID for providing financial support for this effort through the USAID | DELIVER PROJECT
vii
viii
Executive Summary
The USAID | DELIVER PROJECT is developing a Supply Chain Costing Tool to assist in-country supply chain managers by providing big picture cost estimates for the entire supply chain as well as the costs for specific supply chain functions These cost estimates can inform supply chain planning and management assist advocacy for increased funding for the supply chain pricing policy design and support performance assessment A pilot of the supply chain costing tool was conducted on the Zambia ARV supply chain in three districts Lusaka Mpongwe and Ndola
The results provide a snapshot of antiretroviral (ARV) supply chain costs at two out of the nine provinces in Zambia The analysis provided an estimate of the procurement storage and distribution costs in the three districts (one in the Lusaka province and two from the Copperbelt province) and 11 antiretroviral therapy (ART) sites (of the 181 total) The findings are presented by function by tier and by overall total delivered costs which is the cost of procuring storing and transporting products from their entry into the country through all the tiers of the supply chain to the service delivery point (SDP) where they are dispensed1 Zambia continues to scale-up the ART program each year with the goal of achieving near universal access The supply chain will play an important role in delivering ARVs to all ART sites As the ART program expands it will help in planning if a manager understands the costs required to support the ARV supply chain
To this end this study ismdash
1 an assessment and comparison of the supply chain costs of the different agencies operating the ARV supply chain in Zambia including the Medical Stores Limited (MSL) which supplies the District Health Offices (DHO) and hospitals directly the Elizabeth Glaser Pediatric Aids Foundation (EGPAF)Centre for Infectious Disease Research in Zambia (CIDRZ)Ngansa facility which takes the place of the Lusaka Main DHO and the Churches Health Association of Zambia (CHAZ) supply chain
2 an assessment and comparison of the supply chain costs by function (procurement storage and transportation) at different tiers and facilities (urbanrural highlow volume) in the supply chain
The primary finding is that for the two provinces with complete data the cost of delivering the ARVs ranges between 76ndash161 percent of the value of the commodities with a weighted sample average of 896 percent (see table 1) This has implications for setting handling fees and pricing policies in countries with several supply chain options it also suggests that where logisticshandling fees are charged based on the value of the goods costing studies are required to ensure that the fee is appropriately set and to ensure that adequate resources can be provided to successfully execute the supply chain
1 Typically in logistics the functions of storage and transport are referred to jointly as distribution However for the costing analysis where detailed information is required for each function they are referred to separately
ix
Table 1 Cross-Facility Comparisons of the Percentages of Delivered Costs
Lusaka Main District
Delivered Supply Chain Costs as a of Commodity Value
Mpongwe District
Delivered Supply Chain Costs as a of Commodity Value
Ndola District
Delivered Supply Chain Costs as a of Commodity Value
Bauleni Rural Health Clinic
99 Mikata Health Clinic
104 Kavu Health Clinic
161
Kara Clinic 98 St Theresarsquos Hospital
90 Lubuto HC 88
Chilenje 98 Arthur Davison 76
Mttendere HC 94 Ndola Central Mission Hospital
76
The MSL-DHO model which geographically covers all of Zambiamdashand the MSL-NgansaCIDRZ model which accounts for about half of all the ARVs issuedmdashhave similar delivered costs when the delivered cost is the total supply chain cost of procurement storage and transportation incurred to deliver a quantity of ARVs to the SDP In 2008 the MSL-NgansaCIDRZ modelrsquos (operating in the Lusaka Main district) costs ranged from $5000ndash$14000 for the quantity of ARVs delivered in 2008 while the MSL-DHO model (operating in the Ndola district) ranged from $7000ndash$15000 In terms of costs per $1000 of ARVs delivered these figures equate to a range for the Lusaka Main district of $97ndash$105 and $92ndash$165 for the Ndola district The authors of this report are unable to offer firm conclusions about the delivered cost of the third modelmdashthe supply chain run by CHAZmdashbecause of data limitations (a lack of procurement costs) but using the available data the estimate is $89ndash $104
Second this analysis underlines the importance of understanding and assessing the various handling fees that drive the cost of procurement for the three different agencies in this sample that procured ARVs Incidentally these facilities also procured the bulk of Zambiarsquos ARVs in 2008 Procurement costs per $1000 of ARVs procured ranged from $63ndash$67 Procurement costs accounted for 72 percent (by weighted average) of the total delivered cost of ARV logistics in 2008 for the sampled facilities These costs were driven by the Supply Chain Management System (SCMS) projectrsquos cost of procurement which procured 60 percent of Zambiarsquos ARVs in 2008 at $67 per $1000 of the ARVs procured
Third storage costs accounted for 17 percent (by weighted average) of the total delivered costs of ARV logistics in 2008 for the sampled facilities These costs were driven primarily by labor ARV logistics management at the SDP level can be carried out by pharmacists pharmacy technicians or dispensers but because most of the SDPs that deliver ART are small health centers in reality pharmacy technicians do most of the work Technicians and dispensers are paid substantially less than pharmacists and because pharmacists are usually found at tertiary-level institutions only this analysis found that total labor costs in the tertiary institutions were larger per volume or value of ARVs dispensed than at the health centers
x
It should be noted that only two tertiary institutions were included in the sample In addition while this study did not attempt to capture the cost of inventory it is noted that this cost should be captured in the future because of the high value of ARV commodities and the amount of capital that is unavailable to the health systems if commodities are tied up in storage In the future the value of this capital should be compared with the cost of a supply chain model with an increased number of deliveries and a group buffer stock on hand at a single storage facility The sample costing suggests that such a increased delivery model similar to the one used in the Lusaka Main district could be effective (none of the Lusaka Main facilities visited reported stockouts even though they are unable to accommodate more than a weekrsquos worth of ARVs) Note that the authors of this study are unable to firmly recommend this model because performance data were not collected Broad estimates suggest that transportation in Lusaka Main cost $37833 in 2008 Given that the annual value of issued ARVs is over $13000000 for this district this analysis suggests that this modelrsquos cost of transportation is several orders of magnitude smaller than the value of three or even a single month of buffer stock However we note that for this district the volume of ARVs delivered is very high and the distances covered are very short
Fourth in 2008 transportation costs accounted for approximately 5 percent (by weighted average) of the total delivered cost of ARV logistics for the sampled facilities Further findings on transportation suggests that stand-alone ARV-only transportation of ARVs is not as cost efficient as integrated delivery The two models of stand-alone delivery had higher transportation costsmdash CIDRZ and CHAZ ($3 and $40 per 1000 of ARVs)mdashthan the integrated model MSL which also transports essential medicines and other commodities at a cost of $089 per $1000 of ARVs But these models cover very different geographical areas CIDRZ delivers within a 10 kilometer (km) radius CHAZ delivered to a district more than 700 km away and MSL covers the entire country so it is not clear that a direct comparison is valid only that there would be value in an analysis that covered a broader range of MSL and CHAZ sites Within Lusaka Main it is not clear that the Lusaka-based MSL although it has cheaper unit costs would be the better transportation option unless it also took responsibility for storing the Lusaka Main drugs and therefore could provide an integrated transport model rather than the CIDRZ stand-alone ARV model For the facilities that are required to pick up ARVs from district health office storage facilities this analysis found that the cost to these facilities for picking up their supplies is greater than the cost to the district to deliver them However in this small sample size only three facilities picked up supplies so this finding may not be representative Nonetheless this could have significant implications as Zambia tries to move ART sites closer to the rural populations
The costs presented in this analysis do not include the cost of ART service deliverymdashthe cost of identifying counseling testing and treating a person living with HIVAIDS (PLWHA) Separate studies conducted in Zambia looked at the cost of delivering ART services This report provides only part of the total costs of delivering ARTs but the specific costing of logistics has not been included in any of the other ART service costing studies conducted to date therefore it should be an important addition to the costing work being done
In the private sector the cost of getting a commodity to where it needs to be is usually presented as a percentage of its value There has been some discussion that because ARVs are costly relative to many other commodities in the health sector the fee for their handlinglogistics should be lower because the fee is based on the value of the goods This analysis shows the potential usefulness for a tool like the Supply Chain Costing Tool developed by the USAID | DELIVER PROJECT It suggests that for a model like the one used in Zambia a handling fee for ARVs of 9 percent is reasonable In addition this study suggests that supply chain costs for a specific ARV supply chain
xi
may be driven largely by the procurement costs because of the practice of basing handling fees on value that storage costs are driven by labor rather than the cost of space and finally that integrated transport systems particularly over large areas are likely to be significantly less costly than commodity-specific ones
xii
Introduction
The USAID | DELIVER PROJECT is developing the Supply Chain Costing Tool to assist in-country supply chain managers It provides big picture cost estimates for the entire supply chain as well as costs for specific supply chain functions These cost estimates can support supply chain planning and management advocacy for increased funding for the supply chain pricing policy design and performance assessment A pilot of the costing tool was conducted on the Zambia antiretroviral (ARV) supply chain in three districts in Zambia Lusaka Mpongwe and Ndola
The results offer a snapshot of ARV supply costs in two out of the nine geographic provinces which are in turn divided into 72 districts Originally the costing activity was to be conducted as part of a comprehensive evaluation of the ARV supply chain that would have covered between 10ndash 30 percent of all the antiretroviral therapy (ART) sites in Zambia The postponement of the comprehensive evaluation meant that the pilot was conducted in a much smaller number of sitesmdash 11 out of the 181 sites operating in January 2009 The analysis provides an estimate of the procurement storage and distribution costs in the three districts where the 11 sites are located
Zambia continues to scale-up the ART program each year with the goal of achieving near universal access To meet commodity demand the supply chain will play an important role in delivering ARVs to all ART sites For planning as the expansion of the ART program continues it is helpful to understand the costs required to support the ARV supply chain
To this end this study ismdash
1 an assessment and comparison of the supply chain costs of the different agencies operating the ARV supply chain in Zambia including the Medical Stores Limited (MSL) which supplies the District Health Offices (DHO) and hospitals directly the Elizabeth Glaser Pediatric Aids Foundation (EGPAF)Centre for Infectious Disease Research in Zambia (CIDRZ)Ngansa facility which takes the place of the Lusaka Main DHO and the Churches Health Association of Zambia (CHAZ) supply chain
2 an assessment and comparison of the supply chain costs by function (procurement storage and transportation) at different tiers and facilities (urbanrural highlow volume) in the supply chain
1
2
Costing Approach Overview Estimating public sector supply chain costs is complicated for a number of reasons Typically public supply chain inputs do not always have documented costs as financial accounts are not necessarily maintained by function The complexity of many public sector supply chains can also mean that multiple agencies or administrative units may have some responsibility in ensuring that commodities move along the supply chain It may not always be possible to capture each of these parts Finally the cost of the Ministry of Health (MOH) or donor management may not be captured as indirect or overhead costs
To address these complications we first define the supply chain cost function we then map the Zambian ARV supply chainmdashthe distribution tiers and functions We also derive estimates for key inputs using the Zambian civil service pay scales for staff time and accounting conventions for buildings and equipment depreciation
Supply Chain Cost Function A literature review (Baruwa and Islam 2008)2 conducted before this study began identified several relevant approaches to supply chain costing Figure 1 summarizes the different dimensions of a typical public sector supply chain that need to be captured It illustrates how different supply chain functions procurement storage and transportation can be spread across different administrative levelsmdashfrom the central to regional and district and to the service delivery point (SDP)
Figure 1 Supply Chain Costing Overview
Source (Raja Grace and Chesley 2000)3
2 Baruwa Elaine and Mursaleena Islam 2008 Literature Review of Costing Supply Chains and Logistics Systems Washington DC Abt Associates for the USAID | DELIVER PROJECT 3 Raja Sangeeta Cheri Grace and Andrew Chesley 2000 The Cost of Logistics Development and Application of a Logistics Cost Model for Public Sector Health Commodities in Ghana Arlington Va Family Planning Logistics Management (FPLM)John Snow Inc for the US Agency for International Development
3
Typically we would expect the supply chain cost to comprise direct labor storage inventory equipment transport and indirect management costs distributed across these functions and levels It should be stressed that this costing exercise estimates the costs of the existing system with its inherent strengths and weaknesses The tool does not estimate what costs should be if the system is working efficiently at full capacity It should also be stressed that we focused on the in-country costs and not international costs associated with various donor and implementing agencies
Mapping the Supply Chain To ensure that commodities reach the SDPs a number of agencies and partners are involved in the ARV supply chain in Zambia Each agency plays various roles in procuring storing and distributing ARVs The increase in attention from the Government of Zambia (GRZ) and donors to combating HIV and AIDS has led to an increase in the number of funding agencies for ARV drugs Each funding stream may use a different implementing agency and then a different procurement agency Distribution for the facilities in the costing exercise sample is undertaken through three key channelsmdash the MSL EGPAFCIDRZ and CHAZmdashwith products dispensed at public and nongovernmental organization (NGO) SDPs EGPAF funds many of the supply chain activities that CIDRZ performs and will be referenced as CIDRZ in the report because they are the implementing agency
Selective Sampling The sample sites were chosen to reflect both the costs of the various agencies who manage ARV supply chains in Zambia as well as to reflect both urban and rural regions The sample was not intended to be representative of the national ARV supply chain Consequently the analysis in this report represents the costs specific to the facilities visited and their upstream levels in the supply chain Results are aggregated where appropriate to draw conclusions that will be informative to both Zambiarsquos logistics program managers as well as to the donor partners providing technical assistance to these managers
To explore the variations within the supply chain three districts with different supply chain models were chosen for the analysis (see figure 2) Each of these districtrsquos logistics models are discussed in more detail in the Results section because these descriptions represent a qualitative output of the tool itself In summary two of the districts Lusaka Main and Ndola are supplied directly with ARVs stored and transported by MSL whereas the facilities evaluated in the final district Mpongwe are supplied by CHAZ which runs a parallel supply system that is not linked to the MSL at any point in the supply chain (There are other facilities in Mpongwe that the MSL supplies but we did not include them in this sample) Lusaka Main a district in the countryrsquos capital of Lusaka is a densely populated urban district with a very high number of registered patients on ART the highest of all the 72 districts in Zambia The capital is both a city and a province and it includes three other districts as well as Lusaka Main but Lusaka Main is by far the largest in terms of registered ART patients Ndola and Mpongwe are districts in the Copperbelt province of Zambia approximately three hours from Lusaka Ndola is urban but is much less densely populated than Lusaka while Mpongwe is a rural district
4
Figure 2 Map of Zambia showing Lusaka Main Ndola and Mpongwe districts
To collect information on supply chain costs the team selected a number of facilities which range from the MSL to health centers that handle ARV commodities A facility can also be a DHO or a partner such as the Supply Chain Management System (SCMS) project The term facility is used to describe an entity that would have procurement storage vehicle training or staff costs and is different from the term health facility which provides clients with ARVs
The Zambia health system categorizes health facilities into three levels Level 3 are large referral health facilities such as hospitals in urban centers Level 2 health facilities are provincial hospitals and Level 1 health facilities are found at the district level Additionally health centers are found below the district and are not classified into levels
Facilities within the three districts were chosen to ensure that as many of the different levels of the health facilities were included in the sample as possible Level 1 Level 3 facilities and health centers There were no Level 3 facilities in the Mpongwe district and no Level 2 facilities available in any of the districts
For the costing analysis the supply chain is divided into three tiersmdashthe primary or Tier 1 health facilities are national facilities that supplydistribute down the supply chain to Tier 2 and below Tier 2 facilities are district-level facilities In Zambia the provincial level is not recognized as a supply chain tier for the ARV drug supply chain but the provincial pharmacist provides oversight for the district supply chain Instead the 72 districts that make up the provinces are considered to be the Tier 2 facilities Each district has a DHO headed by a District Medical Officer (DMO) These districts may have their own storage facilities and act as pass through facilities where ARVs are only in storage for one to two days before being distributed to SDPs within the district Tier 3 facilities are health facilities that are SDPs Figure 3 illustrates how the Zambia supply chain is divided into three tiers for costing purposes
5
Figure 3 Zambia Supply Chain Structure as used by the Supply Chain Costing Tool
Table 2 lists the names and classifications of all the facilities visited during the study Tier 1 facilities comprise the organizations at the central level The MOH funds both the Drug Procurement Office and MSL The Drug Procurement Office sits within the Ministry of Health while MSL is funded with a grant from GRZ but is run by Crown Agents Inc under a management contract The SCMS and USAID | DELIVER PROJECT and CIDRZ are bilateral donor partners funded by USAID that provide technical assistance to GRZ CHAZ is a Zambian NGO that operates a parallel ARV supply chain supplying certain facilities within Zambia it also supports a number of publicNGO facilities These agencies comprise the Zambian ARV supply chain It should be noted that the Clinton Foundation and UNITAID funded and procured about 25 percent of the ARVs obtained in 2008 Their costs are included in their pricing the commodities they procure enter the supply chain when they are delivered to the MSL facility
In summary ARV drugs flow from Tier 1 facilities through Tier 2 down to Tier 3 facilities but with several exceptions (see the Results section) Individual facilities can perform one or all of the three functions in this analysis being assessed for costs procurement storage and transport Facility types refer to whether the facility is a public- or government-funded facility in which case it is the MOH a DHO or a public service delivery point such as a Level 3 facility or a health center If the facility is not public then it is a partner in the ARV supply chain that is an NGO or is donor funded eg Kara Clinic or SCMS It should be noted that Table 2 lists the facilities included in this analysis but is not a complete list of all the facilities in any of the tiers For example there are a total of six ART sites in the Ndola district the costing team visited four in addition to the Ndola DHO
In summary the study costed the supply chain functions of three Tier 1 facilities
the MOH and MSL which are government-funded facilities
CHAZ and SCMS which are classified as partners in the ARV supply chain because they are not government funded
five Tier 2 facilities which are the three DHOs (where CIDRZ and Ngansa assist the Lusaka Main DHO hence their classification in Tier 2 thus 3 facilities are lsquocountedrsquo as providing the DHO function in Lusaka Main)
6
eleven Tier 3 facilities which are all health facilities and SDPs for ART
See the annex for a full list of facilities and their sample criteria
Table 2 Facilities Included in the Sample by Tier Logistic Function and Facility Type
Facility Name Tier Classification
Facility Type
Pro
cure
Sto
re
Tra
nspo
rt
Central Level
Drug Procurement Office Ministry of Health Tier 1 MOH
Medical Stores Limited Tier 1 MOH
SCMSUSAID | DELIVER PROJECT Tier 1 Partner
Christian Health Association of Zambia (CHAZ)
Tier 1 Partner
Lusaka Main District
Ngansa Pharmaceuticals Ltd Tier 2 Partner
EGPAF(CIDRZ) Center for Infectious Disease Research in Zambia
Tier 2 Partner
Lusaka Main DHMT Tier 2 District Health Office
Kara Clinic Lusaka Tier 3 Health CentreNGO
Mtendere Health Centre Lusaka Main Tier 3 Health Centre
Chilenje Lusaka Main Tier 3 Health Centre
Bauleni Health Centre Lusaka Main Tier 3 Health Centre
Mpongwe District
Mpongwe DHOMission Hospital Tier 2 District Health Office
Mikata Health Centre Mpongwe Tier 3 Health Centre
St Theresas Hospital Mpongwe Tier 3 Level 1
Ndola District
Ndola DHMT Tier 2 District Health Office
Arthur Davison Childrenrsquos Hospital Ndola Tier 3 Level 3
Ndola Central Hospital Ndola Tier 3 Level 3
Lubuto Health Centre Ndola Tier 3 Health Centre
Kavu Rural Health Centre Ndola Tier 3 Health Centre
Data Collection Both qualitative and quantitative data collection methods were required to determine supply chain costs The tool required data from interviews with key informants and the collection of reports and
7
financial data Supply chain cost data came from a wide range of sources including logistics reports transport schedules expenditure reports and on-site interviews at each of the facilities sampled
It was necessary to understand the system in place prior to trying to determine the inputs and costs of running the system In the case of Zambia the USAID | DELIVER PROJECT office and previous analyses primarily the 2007 HACS report provided a clear description of the overall ARV supply chain and the roles played by the many partners who implement and support the program To supplement this the costing exercise required data be collected from each partner on the detailed day-to-day activities that each of these partners undertake
The interviewers (the costing team) used a discussion guide summarized in table 3 to obtain both quantitative and qualitative data from key informant interviews on key logistics functions
Table 3 Costing Tool Data Collection Discussion Guide Topics
Understanding the supply chain functions undertaken by the facility (ie procurement storage and transportation)
Outlining the process followed for each function (eg delivery schedules for transportation and the timingschedule of procurement functions)
Determining staffing and non-labor inputs for each function
Determining the costs of the staffing and non-labor inputs for each function
Obtaining and interpreting the facilityrsquos overhead costs
Obtaining the facilityrsquos overall target client number (eg MSLrsquos clients would be the DHOs the health centerrsquos clients would be the ARV patients)
Key Informant Interviews A range of respondents were interviewed to collect information For facilities in Tier 1 where the facility is large enough to have an administrative financial logisticsstorage and service delivery team it was necessary to meet with at least one person in each of those teams For example at MSL the costing team spoke to the head of each relevant department Using the facilityrsquos annual report and payroll documents the finance officer was interviewed to determine labor and operating costs the transport officer was interviewed to determine transport processes labor requirements distribution schedules and vehicle running costs and the warehouse manager was interviewed to determine the processes staffing levels and consumables required for carrying out storage activities In some Tier 1 facilities it was possible to obtain financial information from a technical staff member by giving the staff member a list of data requirements that would be forwarded to a financial team and then returned to the costing team
The tool classifies each partner as a facility and then asks the respondentrespondents at each facility which of the three primary functionsmdashprocurement storage or transportationmdash the facility carries out For example MSL does not conduct any procurement activities therefore no further questioning about procurement costs was necessary the interview then moved on to probe the MSLrsquos storage process In contrast the medical procurement office in the MOH does undertake
8
procurement activities therefore further details were obtained from the respondent at the facility around the procurement processmdashthe time it takes to complete a single procurement Following this data collection the costing team moved on to determine the staff involved and the inputs (and subsequent) costs associated with the process The interview ended because the medical procurement officersquos role in the ARV supply chain ends after the procured commodities are delivered to the MSL
In many cases notably for the facilities further down the supply chain such as health centers very few people were involved in the actual handling of ARVs It was necessary to only speak to the personnel in-charge to obtain permission to talk to staff Typically the ARV logistics staff would in most cases also be the ART dispenser usually a pharmacist or pharmaceutical technician For example the Mtendere Health Center in the Lusaka Main district employed a single pharmaceutical technician who was interviewed by the costing team The technician provided the necessary information required by the costing team for all the health facilitiesrsquo ARV logistics activities In this particular case the technician worked solely on ART logistics and ARV dispensing This was the case in most of the health centers that the costing team visited All the SDP facilitiesrsquo interviews were completed in less than two hours
Quantitative Data Quantitative data was obtained through financial reports financial expenditures Supply Chain Manager and interviews Each function was divided into a labor component an equipment cost component and a third other section to capture costs specific to the particular function To estimate staff time spent on managing ARV commodities they were asked to estimate the time spent each week or month on supply chainndashrelated tasks Salary data were then collected or obtained by matching each staff memberrsquos civil service grade to the public service management salary guide Where salary data were not available as was the case for some private organizationsmdasheg CHAZmdash the team used the equivalent civil service salary grade
Storage was costed directly using a building cost of KW2000000 per m2 (US$2000) and a depreciation rate of 5 percent which is the standard rates used for 20-year straight-line depreciation It should be noted that GRZMOH uses a 2 percent rate implying a 50-year economic life for a building but the costing team considered the standard rate of 5 percent to be more appropriate In addition any labor costs associated with managing ARV stocks such as stocktaking and ordering were included under storage costs The cost of buffer stock and pipeline products were not included in the logistics costs although some discussion on the potential impact of these costs particularly for the Lusaka Main district is included later in the report
Costs were classified as transportation costs whether the cost was associated with the delivery of ARVs to a SDP or the cost was associated with a facilityrsquos pick-up of ARVs from a storage facility
Equipment costs were classified as being specific to each costed supply chain function where possible However in many cases these costs were embedded in the operating costs because the facility used the equipment for supply chain activities related to other commodities The total operating costs for the facility would then be multiplied by the percentage of space that the ARVs occupy in that facility so that not all the annual depreciation would be charged to the ARV logistics function but that cost would still be accounted for Table 4 lists the documents used to obtain supply chain costs
9
Table 4 Data Sources for Costing Inputs
Data Source Costing Data Obtained
Monthly expenditure reports Operating costs for each SDP
Supply Chain Manager Requisitionissue voucher monthly reports
Dispensary daily register
ARV quantities (unitspacks) issued to all health centers Level 3 facilities districts CIDRZ and CHAZ
ARV quantities dispensed number of patients per day to which ARVs are dispensed at SDP level
Annual reports Operating costs for MSL and all Level 3 facilities
Summary indicators of the costs of the ARV supply chain are presented for each of the facilities visited specifically the total value and volume of ARVs that passed through these facilities in 2008 as well as the costs of ARV commodity procurement storage and transportation incurred by these facilities The costing data covers the 2008 calendar year However some facilities were not able to provide all the data from 2008 in which case the closest 12 consecutive months were used eg October 2007ndashOctober 2008
Each tier of the supply chain shown in Table 2 is discussed in terms of each of the functions that the facilities perform within that tier and the relevant comparisons To interpret the cost data that have been collected Table 5 shows the indicators that the Supply Chain Costing Tool calculated
Table 5 Supply Chain Costs Comparative Indicators Definitions and Formula
Indicator Definition Formula
Cost per $ of annual pass through
The total cost incurred by a facility when undertaking all its
Total costs incurred by the facility for all the supply chain functions it
supply chain functionsmdashthe total performs in one year ($) value of commodities passing through it in one year Care must
Total $ value of ARVs passing through the facility
X 1000
be taken in its interpretation in one year because some facilities undertake several functions while others perform a single function
Cost per m3 of annual The total cost incurred by a Total costs incurred by the facility for pass through facility when undertaking all its
supply chain functionsmdashthe total volume of commodities that pass through it in one year Care must be taken in its interpretation because some facilities undertake several functions while others perform a single function
Total volume of ARVs passing through the facility
in one year
X
all the supply chain functions it performs in one year ($)
1000
Procurement costs per The total cost incurred by a Total costs incurred by the facility to conduct $ of annual pass through
facility when undertaking procurementmdashthe total value of the procured commodities that pass through it in one year
procurement activities in one year ($)
Total value of ARVs procured by the facility in one year ($)
X 1000
10
Indicator Definition Formula
Storage costs per m3 of annual pass through
The total cost incurred by a facility for storagemdashthe total volume of the procured commodities that pass through it procured in one year
Total costs incurred by the facility to conduct storage activities in one year ($)
Total volume of ARVs procured by the facility in one year (m3)
X 1000
Transportation costs per m3 of annual pass through
The total cost incurred by a facility for transportationmdashthe total volume of procured commodities that pass through it in one year
Total costs incurred by the facility to conduct transportation activities in one year ($)
Total volume of ARVs procured by the facility in one year (m3)
X 1000
of delivered commodities value required for supply chain logistics
The total cost incurred by the supply chain activities as a percentage of the value of (SDP) delivered commodities
Total costs incurred by the supply chain to deliver a one year supply of ARVS ($)
Total value of ARVs delivered to an SDP in one year ($)
X 100
The first two indicators can be used to determine the overall supply chain costs for a given value or volume of delivered ARVs when used in combination For example the results for the Ndola district are presented by function but they are also aggregated when the supply chain costs for the annual delivered valuevolume of ARVs are estimated for that district The supply chain costs at each tier of the supply chain are combined from Tier 1 through Tier 2 all the way down to each of the Tier 3 SDPs which are located in the Ndola district
Not all of the indicators in Table 5 are relevant for every facility included in the costing study for example only two facilities in the sample SCMS and the GRZrsquos Medical Drug Procurement Office undertook procurement activities in the period being costed (2008) CHAZ also procured drugs during 2008 but their procurement costs are not included in the analysis because they did not provide any cost data for that activity The procurement function is analyzed in terms of costs per dollar value because this is the basis upon which many of the fees associated with procurement (eg freight or handling) are charged Similarly storage and transport are analyzed in terms of costs per m3 stored or transported as well as the per dollar value Storage functions are further divided in terms of the cost of the labor required to carry storage in each facility and the percentage of storage facilities costs that are labor costs As noted above while all facilitiesrsquo costs are presented in terms of total costs per dollar and m3 care should be taken to ensure that the appropriate comparisons are made For example comparing the total costs of the Medical Drug Procurement office with the total costs for MSL would be inappropriate because MSL conducts entirely different functions whereas a comparison of SCMS costs with those of the GRZrsquos Medical Drug Procurement office would be appropriate as both facilities perform only procurement functions
11
Data Collection for Costing out the Zambia ARV Supply Chain A detailed HIVAIDS Commodity Security (HACS) assessment was conducted in 2007 for Zambia This document was an excellent source of information for the costing team The HACS clearly outlined all the partnerspartner roles in Zambiarsquos ART program Typically the types of people that are able to provide a detailed big picture view of this type of program would be the head of the procurement unit in a MOH the clinical program director of the national HIVAIDS treatment program the head of the countryrsquos central medical store (or equivalent) as well as the program managers in donor-funded partner institutions like the USAID | DELIVER PROJECT
12
Results of Zambia ARV Supply Chain Costs
The results of the Zambia ARV supply chain costing study are presentedmdash
in summary for all the facilities in the sample
in detail for each of the functions (procurement storage and transportation) that occur at each tier of the supply chain
as comparisons between the appropriate facilities ie the facilities performing the same function
Summary Estimates of ARV Volumes Values and Flows
Prior to adding any costing information it is important to understand how much of a commodity flows through the supply chain and where those flows go This analysis combines the data collected about the structure of the supply chain and the partners involved in the supply chain operations with the commodity quantification data on commodity types volumes quantities and flows After the sample facilities names descriptions and functions have been entered into the costing tool the tool merges the commodity database data with issues data (obtained from Supply Chain Manager software) to produce a summary of the volume of ARVs flowing through the system and the value of the ARVs flowing through each tier and facility of the system Table 5 shows the total volumes and value of ARVs flowing through the facilities in Lusaka Mpongwe and Ndola A caveat is that other partners procuring ARVs in Zambia were not included in this sample table 6 is not a country summary but it is a summary of the sampled facilities
13
Table 6 Summary Figures for Value and Volume of ARVs flowing through facilities in the costing exercise sample
Facility No
Facility Name Tier Classification
Facility Type Total Value of Commodities (US$ annual)
Total Volume of Commodities (m3 annual)
1 Procurement and Supply Unit Ministry of Health Tier 1 MOH 3531848 24277
2 Medical Stores Limited Tier 1 MOH 31983921 110990
3 Churches Health Association of Zambia (CHAZ) Tier 1 Partner 2083755 7420
4 Ngansa Pharmaceuticals Ltd Tier 1 Partner 13029840 44087
5 Lusaka Main DHO Tier 2 District Health Office 13029840 44087
6 Kara Clinic Lusaka Tier 3 Health Centre 498588 1440
7 Mtendere Health Centre Lusaka Main Tier 3 Health Centre 450677 1379
8 Chilenje Lusaka Main Tier 3 Health Centre 268909 719
9 Bauleni Health Centre Lusaka Main Tier 3 Health Centre 214773 782
10 Mpongwe DHO Mpongwe Mission Hospital Tier 2 District Health Office 334786 1062
11 Mikata Health Centre Tier 3 Health Centre 6246 039
12 Ndola DHO Tier 2 District Health Office 1472899 4517
13 Arthur Davison Childrenrsquos Hospital Ndola Tier 3 Level 3 151222 843
14 Ndola Central Hospital Ndola Tier 3 Level 3 943578 2676
15 Lubuto Health Centre Ndola Tier 3 Health Centre 639993 1992
16 Kavu Rural Health Centre Ndola Tier 3 Health Centre 58184 205
17 St Theresas Hospital Mpongwe Tier 3 Level 1 209237 546
18 CIDRZ EGPAF Tier 1 Partner 13029840 44087
19 SCMS and USAID | DELIVER PROJECT Tier 1 Partner 29758677 80393
14
Figure 4 combines these summary data with the issues data obtained from Supply Chain Manager to show the flow of ARVs through the three tiers of sample facilities by value (US$) The three facilities in the sample that perform procurement activities are SCMS MOHGRZ and CHAZ SCMS MOH CHAZ and MSL are classified as Tier 1 facilities in the analysis because they operate at the national level (as opposed to the district level such as Ngansa and EGPAFCIDRZ) ARVs arriving in the country are delivered to either the MSL or CHAZ storage facilities these facilities distribute commodities to both Tier 2 storage facilities and Tier 3 SDP facilities The italicized facilities are ART SDPs that receive ARVs directly by-passing any district level storage facilities
For the Ndola district and its facilities after the ARVs are procured they are stored at the MSL and then transported by MSL to the DHO storage facility (Tier 2) or to the large Level 3 facilities (Tier 3) such as the Ndola mission and Arthur Davison This is an example of the MSL-DHO model of delivery as the DHO then is responsible for the onward delivery to non-Level 3 SDPs in Tier 3 This model of distribution is the most common in Zambia and it applies to most of the 72 districts The MSL-NgansaCIDRZ supply chain process is a modification of the MSL-DHO model with the Ngansa storage facility as the Tier 2 storage facility it is used in just one district Lusaka Main As earlier noted Lusaka has a very high number of ART patients and the DHO does not have the space to store the required quantity of ARV supply in its storage facility (Figure 4 shows that a very high proportion of all the countryrsquos ARV supply goes to the Lusaka Main district) The third model the parallel supply chain structure run by CHAZ is also clearly shown in figure 4 it shows that it distributes just over 5 percent of the value of all the ARVs in the supply chain
Figure 4 Value of ARVs through the Tiers (Sampled Facilities Only) in US$2008
Because the volume of the commodities being transported is most likely to drive storage and transportation costs within a supply chain system the flow of ARVs through the sampled ARV supply chain facilities is also presented in terms of its volume Figure 5 combines these summary data with the issues data obtained from Supply Chain Manager (logistics information system) to show the flow of ARVs through the sample facilities by volume
15
Figure 5 Volume of ARVs through the Tiers (Sampled Facilities Only) in m3 2008
ARV Commodity Flows (m3)
Tier 1 SCMS MoH CHAZ 80393 24277 7420
Tier 1 MSL CHAZ 110990 7420
Tier 2 NgansaCIDRZLusaka DHMT Ndola DHMT Mpongwe DHMT 44087 4517 Mpongwe Mission Hospital
1062
Tier 3 Ndola Central Hospital Ndola Bauleni Health Centre Lusaka Main Lubuto Health Centre Ndola Mikata Health Centre St Theresas Hospital Mpongwe 4517 782 1992 039 546
Arthur Davison Childrens Hospital Ndola Mtendere Health Centre Lusaka Main Kavu Rural Health Centre Ndola 843 1379 205
Chilenje Lusaka Main 719
Kara Clinic Lusaka 1440
Notes a SCMS procured the majority of Zambiarsquos ARVs procured in 2008 Between SCMS MOH and CHAZ almost all the procurement of ARVs for the public sector ART program was captured in the costing exercise so this figure is a good approximation of both total and sample costs b CHAZ appears twice in this flowchart because the total figure for CHAZ captures both its procurement and storage costs Because the financial information was incomplete it was not possible to divide the operating costs between the procurement and storage function for CHAZ therefore only the total cost is shown here c SCMS MOH and other donors procure the MSL storesrsquo ARVs however because the bulk of ARVs in 2008 were SMCS and MOHndashfunded this figure is a good approximation of both total and sample costs
d This figure is the sum of the total costs for each of the facilities that perform logistics function at the Tier 2 level of the supply chain for the Lusaka Main district The individual figures are $52257 $37833 and $8646 for Ngansa CIDRZ and the Lusaka DHMT respectively e These facilities are supplied directly from MSL not through their respective district offices f CHAZ supplies St Theresarsquos but also incurs transportation costs because it must often make extra trips to Lusaka to pick up ARVs
The flowcharts present value and volume data in an intuitive way that shows the big-picture of where the majority of ARVs go and who handles them For example from figure 5 it is clear that beyond the MSL storage facility the Ngansa facility in Lusaka stores nearly half the total volume of ARVs that passed through the ARV supply chain in 2008 CIDRZ fulfills the transport function for this district it is very important to understand CIDRZrsquos costs for policysupply chain design purposes A reasonable question might be whether or not it would be more efficient for MSL to perform the transportation function in Lusaka Main because they already distribute other commodities to that district or whether the CIDRZ dedicated ARV transportation model is the more efficient choice
In addition the role played by Ngansa is substantial because unlike the Ndola facility where the monthly shipment of ARVs is only stored for 2ndash3 days Ngansa serves as a storage facility for each of the Lusaka facilities which means that it stores up to three months of stock for each Lusaka facility Another interesting observation from figure 5 is the substantial volume of ARVs that go to the Lubuto health center Having observed that Lusaka is the most densely populated district it is interesting to note that the Lubuto health center which would be classified as at least peri-urban takes delivery of volumes of ARVs that are substantially higher than a Level 3 facility in the same district the Arthur Davison Childrenrsquos Hospital and substantially higher than any other health center in the sample The closest facility in terms of value and volume is the Kara Clinic in Lusaka which is also the only facility in the sample that is a dedicated HIV and AIDS SDP ie it provides HIV services only On closer examination it was found that the ordered quantity for a single type of
16
ARV drug more than quadrupled over the course of 2008 prompting a further examination of the facilities ordering history
17
18
Supply Chain Cost Estimates
The total supply chain costs for each of the facilities in the costing exercise sample are shown in appendices 3ndash6 These costs were estimated by facility they are the sum of each facilityrsquos procurement storage transport and operating costs It should be noted that costs are shown by facility and therefore not necessarily comparable because not all facilities perform all supply chain functions
Supply Chain Cost Estimates Disaggregated by Tier and Function While the summary data provides a lot of useful information and context it is necessary to examine the costs in more detail by tier and function These data are analyzed both in terms of the total cost of each function and in terms of some supply chain cost metrics (see Table 5) These metrics can be used to compare the costs of undertaking each of the costed functions at each level of the Zambian supply chain This would be of particular interest where more than one facility is undertaking the same function
Tier 1 Ministry of HealthGRZ and National Partners As observed in the notes accompanying table 6 the sample facilitiesrsquo costs in some cases are a good approximation of the costs for isolated parts of the entire system Specifically it is noted that SCMS MOH and CHAZ together procure most of the ARVs procured in Zambia in 2008 (in 2008 CHAIUNITAID funded and procured the remaining 25 percent) Therefore the sum of the individual procurement costs for each of these facilities would be a reasonable approximation of the procurement cost for the entire system Similarly MSL and CHAZ provide all the storage that occurs at Tier 1 of the ARV system and therefore the sum of their costs is a good approximation of the storage costs for the entire system Finally the sample included the MSL which distributes to the majority of the ARV recipient facilities in Tiers 2 and 3 with the exception of those facilities that receive commodities transported by CHAZ and CIDRZ Therefore combining the costs of all the Tier 1 facilities provides a reasonable estimate of the entire Tier 1 costs for the Zambian ARV system (see Table 7) detailed cost breakdowns can be found in Appendix 3
Table 7 Estimate Total Costs of the Zambian ARV Supply ChainmdashTier 1
Facility Logistics Functions Performed Total Cost (US$)
SCMS and USAID | DELIVER PROJECT
Procurementsystem strengthening management support including training
2003071
GRZMOH Procurement 223955
MSL Storagetransport 303556
CHAZ Procurementstoragetransport 222712
Total Tier 1 Costs 2753294
Total value of commodities procured 35374280
19
Note The SCMS costs included in this figure include SCMS costs incurred outside Zambia at the SCMS office in the US The activities covered in this cost include forecasting and demand planning functions not carried out by GRZ Other activities covered include reviewing tenders and negotiating contracts activities that GRZ carries out Therefore SCMS costs cover activities that are similar but not directly comparable to those of GRZrsquos procurement office
Procurement As noted earlier there are several partners operating in Tier 1 of the supply chain The pilot did not include all the Tier 1 partners in the sample (note that the sum of SCMS and GRZ procurement is less than the flow through MSL see Figure 4) GRZrsquos Drug Procurement Office SCMS and CHAZ were the sample facilities that carried out procurement activities (Some partners who conduct procurement activities such as UNITAID and EGPAF were not included in the costing analysis as mentioned earlier although the costing team did visit the country director for EGPAF as part of the preparation process) It was confirmed that neither CIDRZ nor EGPAF undertook any scheduled procurement of ARVs in 2008 although an emergency procurement of Trimmune for children was procured in February 2008 No further details of this procurement were available other than that it was a direct purchase from the local CIPLA agent
SCMS did approximately 60 percent of the procurement in 2008 This figure could change from year to year For example the Global Fund will restart funding to Zambia in 2009 GRZ through the Drug Procurement Office will do the procurement Unfortunately CHAZ was unable to provide any of the data that the costing team requested to determine procurement and operating costs CHAZ contracts with Crown Agents Inc to do its procurement For the procurement costs we used a proxy figure of 5 percent for the handling fee charged by Crown Agents Inc This estimate is a bench mark used by Crown Agents Inc for other procurement actions and does not reflect the actual cost but instead provides a comparison point
The procurement costs for SCMS and GRZ are quite similar but they reflect very different cost structures SCMS spends $67 to procure a $1000 worth of ARVs compared to $63 for GRZ It should be noted that a direct comparison is not strictly possible because of the significant differences between the two SCMS is a global procurement program funded by the US government the project has access to globally negotiated contracts with international suppliers benefiting from economies of scale Its costs reflect the higher levels of US and Zambianndashbased management around the procurement process including the forecasting and tracking of commodities negotiation of global contracts with manufacturers product quality assurance and design and application of an ERP-based management information system (MIS) to track procurement and international freight and insurance These are procurement realitiesmdash arrangements that are not presently available to the MOHrsquos procurement function
By comparison GRZ procured a relatively small amount (both for value and volume) of ARVS in 2008 It is subject to a handling fee of 2ndash3 percent on each procurement to move commodities from their point of entry into the country to MSL this fee alone amounted to just over $105000 in 2008 This fee is on top of the freight charges included in the procurement price paid by GRZ The smaller volume of procurement means that GRZ does not achieve economies of scale so its costs are comparatively higher than SCMS because it performs fewer supply chain procurement activities For example it does not incur costs associated with quantification procurement planning quality assurance and procurement execution costs which are performed by SCMS because the project has the relevant technical capacity
Storage Only MSL and CHAZ perform storage functions at the national level their costs are shown in table 6 Commodities procured by CHAZ are stored at the CHAZ warehouse in Lusaka CHAZ staff were able to provide some information on the size and number of staff working in the storage facilities The CHAZ costs can be compared with those for MSL they appear to be substantially higher when the storage cost per volume figure of US$477 per m3 when compared
20
with the MSL costs of US$226 per m3 MSL operates a much larger store with approximately 8000 m3 storage capacity compared to CHAZrsquos 450 m3 It should be noted that the storage costs discussed here do not include operating costs which have been accounted for separately in Appendix 3 These storage costs do not include the cost of inventory held
Transport Only MSL and CHAZ perform transport functions in Tier 1 The costs for MSL were estimated after determining the cost for its entire transportation operation which conveys essential drugs HIV test kits and many other commodities in addition to ARVs The costs attributed to ARV logistics were determined using the ratio of the total volume of ARVs transported by MSL over the total volume of commodities transported by MSL (which required the assumption that all MSL trucks depart MSL fully loaded) The ARV transportation costs for MSL of $27783 is 7 percent of the total transport costs of MSL in 2008 which is $25 per m3 transported (again excluding operating costs) CHAZ could not provide much information on its transportation operations beyond the length of each ARV distribution trip the number of trips per month and the per diem for the driver and officers required for each trip The costing team had to assume that the salaries of these two staff members are comparable to MSL staff CHAZ was also unable to provide a distribution schedule operating costs or the numbers and cost prices of the vehicles used therefore a depreciation charge on the equipment could not be estimated Using only these limited data the costing team estimates that CHAZ spends approximately $1120 to transport one m3 of ARVs This estimate is substantially higher than MSL and does not include any depreciation charges on vehicles or maintenance charges CHAZ supports a total of 22 ART sites including those in the Mpongwe district which were included in this analysis The costing team determined that CHAZ charges the Zambian National AIDS Network (ZNAN) a 2 percent fee to cover its costs of transporting ARVs from its warehouse to ZNAN-supported facilities in Lusaka but the team was unable to obtain any other details about how often and what volume of commodities was delivered to these facilities in 2008 Given that CHAZ has estimated transport costs equal to 4 percent of the value of the ARVs that passed through it in 2008 this analysis suggested that CHAZ is to a certain extent subsidizing its transportation of ZNANrsquos ARVs
Tier 2 District Health Offices and Tier 3 Health Centers Facilities The section describes the supply chain costs within each of the three districts that were part of this studymdashLusaka Main Mpongwe and Ndolamdashand their facility costs Cost comparisons are made where appropriate It should be noted that in the diagrams that follow we adopt a cumulative approach to indicating the supply chain costs for getting the product to the SDP These costs show the total cost of the procurement and storage costs incurred on commodities at the Tier 1 and Tier 2 facilities plus the storage and distribution costs incurred at the Tier 3 facilities So for example in the Lusaka Main district the total supply chain costs of getting the product to the Kara Clinic was $7205 which is equivalent to 98 percent of the cost of the commodities delivered
Lusaka Main District Lusaka Main is one of the four districts that make up the Lusaka Province It is the largest of these districts in terms of it ARV consumption The supply chain costs for the district are shown in figure 6
21
Figure 6 Lusaka Main District Total Supply Chain Costs of Delivery at SDP
SCMSGRZ_MOH Total Costs $2227026 Costs per $1000 $6690
NgansaCIDRZLusaka Main DHMT Total Costs per $1000 $103790 Costs per $1000 $758
MSL Total Costs per $1000 $303556 Costs per $1000 $949
Procurement No procurement activities occurred at any of the Tier 2 facilities in this sample Emergency procurements may have occurred during 2008 but those interviewed did not consider these orders to be substantial EGPAFCIDRZ was the only facility with the capacity and funding to make an emergency procurement The procurement costs listed relate to the costs incurred in procuring the product through SCMS and GRZ
Storage The Lusaka Main district has the highest number of registered ART patients and consumes the largest quantity of ARVs of any of the districts The districtrsquos facilities have very limited storage capacity and are unable to keep more than a weekrsquos supply of ARVs in stock therefore they need deliveries every week The lack of storage and the fact that these facilities receive supplies weekly implies that the cost of inventory for this district which consumes approximately 40 percent of the entire nationrsquos annual supply of ARVs is relatively low when compared to other districts where facilities store up to three months of inventory To assist these facilities a donor partner EGPAFCIDRZ funds the storage and transport of the districtrsquos ARV requirements CIDRZ does not have a storage facility of its own and therefore contracts with a private facility the Ngansa Pharmaceutical Company to store the districtrsquos ARV supplies An estimated contract value of $50000 per year was given but actual contract details were not obtainable from either CIDRZ or Ngansa This analysis estimates Ngansarsquos costs at $52257 for 2008 (see appendix 4) The Ngansa stores a three-months supply of ARVs for each of the districtrsquos ART sites thereby serving as an extension of their storage facilities MSL delivers ARVs to Ngansa a CIDRZ vehicle makes deliveries according to the supply vouchers received by the Ngansa facility from the health centers It is estimated that the Ngansa facility storage costs are $87 per m3 stored It should be noted that the storage costs associated with the Lusaka Main DHO only include labor costs because three officers at this DHO support the ordering and management of ARVs for all the districts ART sites
Kara Clinic Chilenje CH Mtendere HC Bauleni Rural HC Total Costs $7205 Total Costs $3856 Total Costs $4591 Total Costs $3210
Delivered Costs per $1000 Delivered Costs per $1000 Delivered Costs per $1000 Delivered Costs per $1000 Total $98 Total $98 Total $94 Total $99 Procurement 68 Procurement 68 Procurement 71 Procurement 68 Storage 25 Storage 26 Storage 22 Storage 26 Transport 4 Transport 4 Transport 4 Transport 4 Operating 4 Operating 3 Operating 3 Operating 2
22
As previously mentioned the facilities in the Lusaka Main district have very limited storage capacity and therefore very small storage costs in terms of the cost of space However because storage costs include the cost of labor activities associated with storage such as stocktaking and ordering the total storage costs are much larger than just the cost of space and it accounts for approximately 30 percent of the total delivered cost in the Lusaka Main district
Transportation Using ARV dedicated staff and vehicle CIDRZ does all the transportation of ARVs in the Lusaka Main district MSL delivers ARVs to Ngansa then CIDRZ delivers them to facilities every week It is estimated that each m3 delivered by CIDRZ in 2008 cost $86 (including operating costs) CIDRZ provided the costing team with a detailed list of monthly expenditures for their transportation activities None of the facilities in the district reported picking up their ARVs from Ngansa during 2008
Mpongwe District The facilities visited in Mpongwe district are part of the CHAZ supply chain for ARVs CHAZ supplies these facilities using the CHAZ vehicles from its warehouse in Lusaka See figure 7 for a summary of ARV supply chain costs for the Mpongwe district
Figure 7 Mpongwe District Total Supply Chain Costs of Delivery at SDP
CHAZ Procurement Total Costs $104188 Costs per $1000 $5000
CHAZ Storage and Transport Total Costs $118524 Total Costs per $1000 $5700
Mpongwe DHO Mpongwe Mission Hospital Total Costs $2997 Total Costs per $1000 $001
Mikata Health Centre HC Total Costs $1056
Delivered Costs per $1000 Total $107 Procurement 47 Storage 16 Transport 30 Operating lt1
St Theresarsquos Total Costs $2599
Delivered Costs per $1000 Total $8991 Procurement 56 Storage lt1 Transport 4438 Operating lt1
23
Procurement Procurement is not undertaken at the DHO level in this facility CHAZ procures on their behalf and delivers their ARVs to the Mpongwe Mission Hospital As noted earlier we only used the 5 percent proxy procurement charge for Crown Agents Inc procuring for CHAZ The procurement costs do not include any management costs for CHAZ therefore the procurement share of delivered costs is lower at 48 percent and 56 percent for Mikata and St Theresarsquos Mission Hospital respectively
Storage The district does not have a storage facility for ARVs they use the Mpongwe Mission Hospitalrsquos ARV storeroom therefore the hospital is costed here as part of the district level rather than as a SDP When the costing team visited it during the pilot this storage facility had recently been renovated The ART sites in this district are low-volume rural sites (less than 50 patients a day) therefore some of the storage costs in these facilities are particularly low The smallest facility visited at Mikata stored all their ARVs on two shelves in a storage room with each shelf measuring just 6 times 36 inches
Transportation The district has vehicles for distribution but its resources are limited so the ART facilitiesrsquo personnel find their own way to the mission hospital and if there is transport available they are taken back to their facility If the facility cannot transport them they use whatever means are available
The costing team visited one rural satellite site in this district the Mikata Health Centre This small facility sends an aide on a bicycle to pick up supplies from the mission hospital a ride that takes approximately 45 minutes During 2008 the transportation costs were about $36 For St Theresarsquos where ARVs must be picked up from the CHAZ facility in Lusaka 3ndash4 times a year the transportation costs were about $154 per m3 a year or a total of $839 These two instances where the Tier 1 or Tier 2 facility does not or is unable to perform the transportation function is approximately 38 and 45 percent for the total ARV supply chain costs at Mikata and St Theresarsquos respectively
Ndola District The Ndola district and all three Level 3 facilities receive their ARV supplies directly from MSL The district has its own warehouse facilities on the grounds of the DHO which then uses district vehicles to deliver to health centers The ARVs stay in the district warehouse for only 2ndash3 days before being delivered to the SDPs Level 3 facilities receive their ARVs directly from MSL The Arthur Davison Childrenrsquos Hospital and the Ndola Central Hospital being Level 3 health facilities receive their ARVs directly from MSL they reported to the costing team that they do not have to make any trips to Lusaka to obtain ARVs
Procurement No procurement activities occur at either the Tier 2 or Tier 3 facilities in Ndola However for delivered costs procurement accounts for approximately three-fourths of the costs (Kavu at 43 percent is the exception due to its relatively high storage costs)
Storage Ndola has SDPs or sites that represent both urban high-volume facilities such as the Ndola Central a peri-urban high-volume facility such as Lubuto and a rural low-volume facility Kavu Arthur Davison and Ndola Central are multi-story referral hospitals Despite its size and being a tertiary referral institution the Arthur Davison Childrenrsquos Hospital runs a relatively small ART clinic with volumes much lower than some of the health centers in Lusaka Main However its storage costs are higher than those in Lusaka because of storage labor which is discussed further under General Observations The Ndola Central Hospital runs the largest ART clinic in the sample and therefore has substantial operating costs Only 01 percent of the total operating costs were attributed to ARV for these large institutions because the storage space for ARVs is very small
24
compared to the size of the entire facility Operating costs for Arthur Davison were also 01 percent of the facilityrsquos total operating costs The relatively high storage costs at the Kavu facility were driven by labor because the ARVs in that facility were managed by two pharmacy technicians at 41 percent level of effort each as compared to Lubuto where ARVs are managed by a single dispenser (see Appendix 5) The storage costs are therefore not driven by the actual storage capacity because these were 605 m2 at Arthur Davison and 2122 m2 at Ndola Central but both cases still amounted to 10 percent of total delivered cost Several facilities are in the process of or have already assigned designated storage rooms for ARV drugs However given the small costs associated with actual storage space it is not anticipated that these costs will add substantially to the overall supply chain costs See figure 8
Figure 8 Ndola District District Total Supply Chain Costs of Delivery at SDP (US$)
SCMSGRZ_MOH Total Costs $2227026 Total Costs per $1000 $6690
MSL Total Costs $303556 Total Costs per $1000 $949
Ndola DHMT Total Costs per $1000 $10365 Total Costs per $1000 $704
Transportation ARVs are delivered by MSL directly to Arthur Davison and Ndola Central it is noted that transport accounts for a low percentage of the final delivered cost to these facilities For the other four facilities that dispense ARVs in Ndola the drugs are delivered by MSL to the Ndola DHO which then delivers them directly to facilities within 1ndash2 days of arriving in the Ndola district warehouse While the Lubuto facility did not report having to pick up their own ARVs during 2008 the Kavu facility did report having to regularly do so during 2008 its fuel costs were then reimbursed by the Ndola DHO
Cross District Comparisons Table 7 summarizes the delivered costs in each of the SDPs visited expressed as a percentage of the value of the commodities delivered For the Lusaka Main district these costs are between 94 percent and 99 percent with the highest cost for the Bauleni rural health clinic (HC) The range is greater for the Ndola districtmdashbetween 76 percent and 161 percent with the highest cost reflecting
Lubuto HC Kavu HC Arthur Davison Ndola Central Total Costs $3194 Total Costs $4522 Childrenrsquos Hospital Mission Hospital
Total Costs $8520 Total Costs $18951 Delivered Costs per $1000 Delivered Costs per $1000 Total $8842 Total $161 Delivered Costs per $1000 Delivered Costs per $1000 Procurement 76 Procurement 42 Total $76 Total $76 Storage 18 Storage 51 Procurement 88 Procurement 88 Transport 4 Transport 5 Storage 10 Storage 10 Operating 3 Operating 2 Transport 1 Transport 1
Operating 1 Operating 1
25
higher storage and distribution costs for Kavu HC as mentioned earlier For Mpongwe the range is 104 percentndash90 percent although these include the 5 percent proxy procurement costs and no CHAZ operating costs (note that the CHAZ costs were not provided) so these costs would likely be higher
Table 8 Cross-Facility Comparison as Percentage of Delivered Costs
Lusaka Main District
Delivered Supply Chain Costs as a of Commodity Value
Mpongwe District
Delivered Supply Chain Costs as a of Commodity Value
Ndola District
Delivered Supply Chain Costs as a of Commodity Value
Bauleni Rural HC 99 Mikata HC 107 Kavu HC 161
Kara Clinic 98 St Theresarsquos Hospital
90 Lubuto HC 88
Chilenje 98 Arthur Davison 76
Mttendere HC 94 Ndolsa Central Mission Hospital
76
Limitations The analysis has a number of limitations The analysis does not represent a large enough sample to generalize the results for all 181 ART facilities Therefore it does not provide a costing estimate for the whole system but rather an incomplete costing of each of the systems that deliver ARVs to the three districts studied Most of the country follows the system in use in the Ndola district where procurement is done by the GRZ SCMS project and CHAI on behalf of the GRZ or another partner the commodities are shipped to MSL which then delivers to the DHO stores and hospitals The SDPs are responsible for dispensing ARVs The Ndola analysis provides some insight into how the rest of the country functions but for several reasons it cannot be said to be representative of all districts Ndola is relatively close to MSL in Lusaka and the road networks to reach it are extremely good This contrasts with many regions in Zambia which are up to 18 hours from Lusaka and even longer in the rainy season when road conditions deteriorate To reach facilities some regions require boat trips For these reasons the logistics process may differ in other districts with important costing consequences that would be missed if an attempt was made to generalize this analysis Therefore it is reasonable to expect that while transportation costs account for less than 5 percent of the delivered supply chain costs in Ndola for example the same indicator for other districts is going to be higher
Although CHAZ procures only a small percentage of the total amount of ARVs used in the ART program it would have been beneficial if we had been able to estimate the comparative metrics on cost per m3 and cost per $1000 of ARVs distributed through this supply chain to determine how the parallel systems perform cost-wise as compared to the MSL-led system
It must be noted that the sample facilities included in this pilot are not generalized for the rest of Zambia because the rural facilities were relatively easy to access compared to other rural ART sites in the country where the roads are inaccessible in the rainy season or sites that must regularly be accessed by boat
26
System-wide Observations and Conclusions
Procurement Costs Overall in the costing sample by weighted average procurement accounts for 76 percent of the total delivered costs per $1000 of ARVs across the 11 SDPs Procurement costs per $1000 of ARVs procured were $63 $67 and $50 at GRZ SCMS and CHAZ respectively It should be noted that the CHAZ estimate incorporates only a 5 percent handling fee to Crown Agents Inc and no operating costs unlike SCMS and GRZ This mean that the costs estimated for CHAZ will likely be higher if the full costs were included in this assessment These procurement costs are driven by the percentage handling fee charged these fees do not represent identical services across the three procuring facilities GRZ pays this fee in-country to get commodities from their point of delivery to MSL The SCMS handling fee accounts for the cost of out-of-country operations by SCMS in the US plus the in-country SCMS management team As noted CHAZ did not provide operating costs Procurement costs represent the major part of the supply chain costs identified Scope for possible savings in procurement costs should be examined but not at the expense of program management forecasting or quality control USAID funding of procurement plays a critical role in ensuring product availability and HIV and AIDS commodity security
Storage Costs With the very low depreciation rates applied by the Zambian accounting system storage costs are driven by the labor costs associated with the logistics management of ARVs The labor costs associated with the management of the ARV supply chain represent more than 80 percent in all Tier 3 facilities (see annexes 4-6) The majority of the storage costs were between $3000ndash$4000 in facilities where a pharmacy technician handled the ARV logistics regardless of the number of clients or volume of ARVs being stored but the costs rose to $4500ndash$11141 when pharmacists manage the logistics Consequently much of the variation between storage costs in Level 3 and health center facilities is due to pharmacists versus pharmacy technicians rather than to the difference in the costs of the physical storage space at these facilities
All the Ndola SDPs had labor costs that accounted for 97 percent or more of their storage costs Ndola Central Hospital and Luboto had annual volumes of 27 m3 and 20 m3 respectively but storage costs of $11141 and $3150 respectively Ndola Central uses three pharmacists at varying levels of effort while Lubuto uses one pharmacist technician Similarly Arthur Davison uses a pharmacist and a pharmacy technician for eight m3 of ARVs at a cost of $4526 while three public facilities in Lusaka have an average volume of 10 m3 with an average storage cost of $3625 each using a single pharmacy technician It would be useful to examine whether the staff assigned to different facilities are performing other functions and whether the logistics management function can be performed effectively by lower-cost pharmacy technicians rather than the more expensive and scarcer pharmacists Does the quality of record keeping or the level of product availability
27
improve with pharmacists rather than pharmacy technicians Do the pharmacy technicians require a larger investment in staff training
An additional observation on storage costs is that there are significant economies of scale in the logistic management function For example Mikata in Mpongwe is issued just 03 m3 of ARVs a year while the Mpongwe Mission Hospital is issued 43 m3 but the Mikata ARV management requires 20 percent of one personrsquos level of effort (LOE) while the mission hospital uses a single person at 40 percent This means twice the LOE is used at Mpongwe for more than ten times the volume of product This observation may be due to the fact that the ARV logistics system is parallel to the essential medicines logistics management and requires its own training and stocktaking activities which usually results in each facility having a dedicated member of staff regardless of the volume of ARVs being managed Therefore there may be a trade off between cost efficiency and performance that needs to be considered if changes were to be made to the system
An additional cost incurred by SCMS in Tier 1 is the cost for training all the staff who work in the ARV supply chain in Zambia This cost was $190915 in 2008 Of this $177248 was the cost of running the nine training workshops during 2008 (including training materials and per diem) During the course of the costing data collection it was noted in several facilities that staff turnover was a significant problem Civil service staff can be transferred between facilities and may not necessarily be transferred to ARV logistics duties at their next posting Therefore the cost of training must be considered as an on-going cost to the ARV supply chain rather than merely a start-up cost
Ndola has SDPs or sites that represent both urban high-volume facilities such as the Ndola Central a peri-urban high-volume facility such as Lubuto and a rural low-volume facility Kavu The storage costs are clearly not driven by the actual storage capacity because these were 605 m2 at Arthur Davison 2122 m2 at Ndola Central 980 m2 at the Lubuto facility and 600 m2 at Kavu but Arthur Davison had higher storage costs than Kavu and Lubuto
Few of the health facilities visited in this study had computers available to assist in their logistics management but Ndola Central Hospital Arthur Davison Childrenrsquos Hospital Lubuto Health Center and Kavu Health Center had received computers and air-conditioners to support their storage cooling The total value of these donations was about $5000
Transportation Costs Of the facilities with transportation costs at Tier 1 and Tier 2 MSL transports the largest volume of ARVs 1110 m3 at a cost of $25 per m3 CIDRZ transports 441 m3 at a cost of $86 per m3 and Ndola DHO transports 45 m3 at $78 per m3 Recall that CIDRZ transportation is dedicated to ARVs whereas MSLrsquos transportation operations are integrated with other commodities It is also important to note that the CIDRZ delivery occurs only within Lusaka Mainmdashapproximately a 10 km radius whereas the MSLrsquos two distribution routes that deliver to Ndola cover 750 km each way For delivered costs 17 percent of the total delivered cost for Lusaka Main was for transportation compared to 5 percent or less in Ndola (results for Mpongwe are only for a single very small rural facility) These findings suggest that integrated delivery can be cost efficient In addition this analysis highlights the importance of differentiating between a literal transportation cost that counts fuel by distance measures versus using an aggregated cost of the total transportation functionmdashin this case carried out by MSLmdashand then proportion costs by volume It was considered appropriate for this analysis to proportion costs by volume to get the true cost because MSL implements an integrated transportation system Transportation costs estimated in terms of fuel by distance would have given substantially higher costs being ascribed to MSL for supplying Ndola compared to Lusaka Main
28
costs because of the distances involved In fact MSL costs should be lower given their economies of scale Also a literal estimate would not account for non-divisables such as driverrsquos time which would be costed according to days traveled where in reality drivers must be paid monthly salaries regardless of the distances they drive
While all the Lusaka Main facilities reported that they did not need to pick up their ARVs at any time in 2008 this was not the case in Mpongwe and Ndola Where facilities have to make some trips to pick up their supplies the costs are much higher than they would have been if MSL or CIDRZ had delivered them (estimating costs for CHAZ was difficult because of the limited data) For example St Theresarsquos transportation costs are estimated at $154 per m3 (issued 033 m3 in 2008) and Kavursquos are $154 per m3 (issued 5 m3 in 2008) Kavu spends substantially more to pick up ARVs ($154 per m3) from Ndola than the Ndola DHO spends to deliver ARVs to facilities ($78 per m3) (see Appendix 5 for details) No facilities that had to pick up their ARVs complained that it was inconvenient but this is likely to be a sample bias as the costing team visited facilities that were easily accessible Had the team visited less accessible facilities it is likely that the costs and inconvenience of ARVs not being consistently delivered would be much greater It is important to consider the cost of facilities picking up their own ARVs across the system in aggregate could be substantial particularly for the less accessible sites where the choice could be between expensive transportation costs or stockouts which have a detrimental impact on ART patients These results suggest that increased support at the DHO level to both ensure delivery of ARVs and lower transportation costs for the system
29
30
Conclusions
This costing exercise was conducted to assess the supply chain costs of operating Zambiarsquos ART program Comparisons of costs have been made between the different models of supply between high- and low-volume facilities and between rural and urban facilities In summary due to economies of scale the MSL-DHO model which covers most of Zambia geographically and the MSL-NgansaCIDRZ model which covers accounts for half of all the ARVs issued have similar costs The study was unable to make firm conclusions about the third modelmdashthe supply chain run by CHAZmdashbut the analysis provides no evidence that this supply chain given its size must be costlier than the other two models Similarly it was found that high-volume facilities tend to have lower delivered costs than low-volume facilities but this finding may be subject to some selection bias because the high-volume facilities in the sample were usually found in Lusaka and therefore had much shorter transportation distances to cover Notwithstanding the higher frequency of deliveries to the Lusaka facilities the total distances covered are significantly shorter than those required to deliver ARVs to the facilities in Mpongwe and Ndola In addition because urban facilities tend to dispense to larger numbers of patients per day than rural facilities costs tended to be lower It is important to note that at least for the two large urban facilities included in this sample some of these cost differences are due to the labor costs of the more skilled staff that tend to manage the ARVs in these facilities This costing did not combine costs with effectiveness measures such as those obtained in a LIAT study of a supply chain system Therefore it cannot be determine whether the differences in costs will lead to differences in effectiveness of the supply chain such as whether higher labors costs for more skilled ARV managers results in fewer stockouts such an analysis could be beneficial to logistics managers In future studies using the supply chain costing tool this limitation will be addressed
In the private sector logistics costs tend to be presented in terms of the cost of getting a commodity where it needs to be as a percentage of the value of the good There has been some discussion that because ARVs are costly relative to many other commodities in the health sector the fee for their handlinglogistics should be lower because the fee is based on the value of the goods This report finds that for the two provinces with complete data the cost of delivering the good ranges between 8ndash16 percent of the value of the commodities and that procurement accounts for the largest portion of these costs
This has implications when setting handling fees and pricing policies in countries with several supply chain options It also suggests that where logisticshandling fees are charged based on the value of the goods costing studies are required to ensure that the fee is appropriately set and to ensure that adequate resources can be provided to execute the supply chain strategy successfully
31
32
Appendices
Appendix 1 ARV Average Prices for Commodities Procured in 2008 (PipeLine 40 Zambia MSL)
Appendix 2 Sample Facilities by Criteria
Appendix 3 Tier 1 Sample Facilities Supply Chain Costs (US$)
Appendix 4 Lusaka Main District Supply Chain Costs (US$)
Appendix 5 Mpongwe District Supply Chain Costs (US$)
Appendix 6 Ndola District Supply Chain Costs (US$)
Appendix 7 Estimating Total Delivered Costs for Ndola District
Appendix 8 Estimating Total Delivered Costs for Lusaka Main District
Appendix 9 Estimating Total Delivered Costs for Mpongwe District
Appendix 10 Estimating Sample Weighted Average Total Delivered Costs
Appendix 11 List of Data Inputs Required for Estimating the Cost of a Supply Chain
Appendix 12 Contact List
33
34
Appendix 1
ARV Average Prices for Commodities Procured in 2008 (PipeLine 40 Zambia MSL) Name Procurement
size (total for 2008) in units
Procurement Price (for each procurement
Unit Price (average unit price across all procurements in 2008)
Abacavir 10mgml 240ml - $ - na
Abacavir 20mgml 240ml 6062 $ 104330 $ 1721
Abacavir 300mg 60 Tabs 8254 $ 227150 $ 2752
Didanosine 25mg Tabs1 - $ - na
Didanosine 50mg 60 Tabs1 - $ - na
Didanosine 100mg 60 Tabs 10808 $ 83582 $ 773
Efavirenz 200mg 90 Caps 8602 $ 134302 $ 1561
Efavirenz 50mg 30 Caps 18296 $ 48798 $ 267
Efavirenz 600mg 30 Tabs 1014816 $ 12574111 $ 1239
Lamivudine 10mgml 100ml2 94565 $ 211193 $ 223
Lamivudine 10mgml 240ml 94565 $ 211193 $ 223
Lamivudine 150mgml 60 Tabs 34000 $ 209924 $ 617
LamivudineStavudine 15030mg 60 Tabs 355000 $ 2554800 $ 720
LamivudineStavudine 15030mg 30 Tabs3 355000 $ 1277400 $ 360
LamivudineStavudine 40150mg 60 Tabs3 355000 $ 2554800 $ 720
LamivudineStavudineNevirapine 15030200mg 60 Tabs
481011 $ 3364680 $ 700
LamivudineStavudineNevirapine 15040200mg 60 Tabs
22289 $ 167168 $ 750
LamivudineStavudineNevirapine 3065mg 60 Tabs
11919 $ 29320 $ 246
35
Name Procurement size (total for 2008) in units
Procurement Price (for each procurement
Unit Price (average unit price across all procurements in 2008)
LamivudineStavudineNevirapine 6012200mg 60 Tabs
17868 $ 88267 $ 494
LamivudineZidovudine 150300mg 60 Tabs 466746 $ 4517090 $ 968
LopinavirRitonavir 8020mgml 300ml 2636 $ 108340 $ 4110
LopinavirRitonavir 20050mg 120 Tabs 27828 $ 1546832 $ 5559
Nevirapine 10mgml 100ml4 77574 $ 192493 $ 248
Nevirapine 10mgml 240ml 77574 $ 192493 $ 248
Nevirapine 10mgml 25ml4 77574 $ 192493 $ 248
Nevirapine 200mg 60 Tabs 725582 $ 2698518 $ 372
Stavudine 15mg 60 Caps 23184 $ 39040 $ 168
Stavudine 1mgml 200ml 50000 $ 79600 $ 159
Stavudine 20mg 60 Caps 21384 $ 41162 $ 192
Stavudine 30mg Caps5 21384 $ 41162 $ 192
Stavudine 40mg Caps5 21384 $ 41162 $ 192
TenofovirEmtricitabine 300200mg 30 Tabs 787250 $ 17450084 $ 2217
Zidovudine 10mgml 100 ml6 54200 $ 81450 $ 150
Zidovudine 10mgml 240 ml 54200 $ 81450 $ 150
Zidovudine 100mg 100 Caps 17356 $ 110817 $ 638
Zidovudine 300mg 60 Tabs 11700 $ 84240 $ 720
Tenofovir 300mg Tabs7 787250 $ 17450084 $ 2217
Indinavir 400mg Tabs8 27828 $ 1546832 $ 5559 1Not procured during 2008 and none distributed to facilities during 2008 2Lamivudine 10mgml 100ml not procured during 2008 but some quantity was distributed to facilities therefore prices take to be the same as the 240ml presentation 3LamivudineStavudine 15030mg 30 Tabs3 not procured during 2008 but some quantity was distributed to facilities therefore prices take to be the same or directly proportional to the LamivudineStavudine 15030mg 60 Tabs presentation 4Nevirapine 10mgml 100ml not procured during 2008 but some quantity was distributed to facilities therefore prices take to be the same as the 240ml presentation 5Stavudine 30mg Cap not procured during 2008 but some quantity was distributed to facilities therefore prices take to be the same as the 20mg presentation 6Zidovudine 10mgml 100 ml not procured during 2008 but some quantity was distributed to facilities therefore prices take to be the same as the 240ml presentation 7Tenofovir 300mg Tab procured by CHAZ during 2008 and some quantity was distributed to facilities Price taken to be the same as the TenofovirEmtricitabine 300200mg 30 Tabs presentation
8 Indinavir 400mg Tabs not procured during 2008 but some quantity was distributed to facilities therefore prices take to be the same as LopinavirRitonavir 20050mg since Ritonovir also a Protease Inhibitor not available in Zambiarsquos ARV system in a lsquonon-combinationrsquo form
36
Appendix 2
Sample Facilities by Criteria Facility Name Supply Chain Flow Volume Rural
Urban
Drug Procurement Office Ministry of Health MSL ndash DHO MSL ndash NgansaCIDRZ
Both Both
Medical Stores Limited MSL ndash DHO MSL ndash NgansaCIDRZ
Both Both
SCMS USAID | DELIVER PROJECT MSL ndash DHO MSL ndash NgansaCIDRZ
Both Both
CHAZ Church Health Association Zambia CHAZ Both Both
Ngansa Pharmaceuticals Ltd MSL ndash DHO MSL ndash NgansaCIDRZ
Both Both
(CIDRZ) Center for Infectious Disease Research in Zambia
MSL ndash DHO MSL ndash NgansaCIDRZ
Both Both
Lusaka Main DHMT MSL ndash DHO MSL ndash NgansaCIDRZ
High Urban
Kara Clinic Lusaka MSL ndash DHO MSL ndash NgansaCIDRZ
High Urban
Mtendere Health Centre Lusaka Main MSL ndash DHO MSL ndash NgansaCIDRZ
High Urban
Chilenje Lusaka Main MSL ndash DHO MSL ndash NgansaCIDRZ
High Urban
Bauleni Health Centre Lusaka Main MSL ndash DHO MSL ndash NgansaCIDRZ
High Urban
Mpongwe DHMT CHAZ High Rural
Mpongwe Mission Hospital CHAZ High Rural
Mikata Health Centre Mpongwe CHAZ Low Rural
St Theresas Hospital Mpongwe CHAZ High Rural
Ndola DHMT MSL ndash DHO High Urban
Arthur Davison Childrenrsquos Hospital Ndola MSL ndashHospital High Urban
Ndola Central Hospital Ndola MSL ndash Hospital High Urban
Lubotu Health Centre Ndola MSL ndash DHO ndash Health Center Low Rural
Kavu Rural Health Centre Ndola MSL ndash DHO (Health Center picks up)
Low Rural
37
38
Appendix 3
Tier 1 Sample Facilities (US$) Procurement
and Supply Unit Ministry of Health
Medical Stores Limited
CHAZ Churches Health Association Zambia
SCMSDELIVER PROJECT
Total value of commodities passing through
$35318848 $31983921 $2083755 $29758677
Total volume of commodities passing through (m3)
243 1110 74 804
Procurement Costs 173955 NA 104188 2003071
Storage Costs NA 250732 35394 NA
Transport Costs NA 27783 831301 NA
Operating Costs 50000 25041 ND 0
Total Costs 223955 303556 222712 2003071
Cost per $ of annual pass through
6341 949 10688 6731
Cost per m3 of annual pass through
923 273 3002 2492
Procurement Cost per $1000 of ARVs
4925 0 ND 6731
Storage Cost per m3 of annual pass through
NA 226 477 NA
Storage Labor Cost NA 89810 26545 NA
LaborTotal Storage Costs NA 36 75 NA
Cost per m3 transported NA 25 1120 NA
Notes Function costs do not include operating costs NA Not Applicable if facility does not perform that function ND No data or incomplete data available to costing team 1CHAZ were only able to provide limited data on transport costs but nothing on procurement or storage other than the size of their storage facility
39
40
Appendix 4 Lusaka Main District Supply Chain Costs (US$)
(CIDRZ) Center for Infectious Disease Research in Zambia
Ngansa Pharm Ltd
Lusaka Main DHMT
Kara Clinic Lusaka
Mtendere Health Centre Lusaka Main
Chilenje Lusaka Main
Bauleni Health Centre Lusaka Main
Total value of commodities passing through
$13029840 $13029840 $13029840 $498588 $450677 $268909 $214773
Total volume of commodities passing through (m3)
441 441 441 14 14 7 8
Procurement Costs NA NA NA NA NA NA NA
Storage Costs See Ngansa 38577 8646 6316 4124 3608 3143
Transport Costs 37833 See CIDRZ 0 0 0 0 0
Operating Costs 0 13700 0 889 467 248 67
Total Costs 37833 52257 8646 7205 4591 3857 3210
Number of patient ARV prescriptions filled a day
NA NA NA 17003 80-150 80-150 45
Procurement Cost per $1000 of ARVs
NA NA NA NA NA NA NA
Storage Cost per m3 of annual pass through
See Ngansa 87 20 439 299 502 402
Storage Labor Cost See Ngansa 34332 8646 6080 3776 3558 3049
LaborTotal Storage Costs
See Ngansa 89 100 96 92 99 97
Cost per m3 transported 86 0 0 0 0 0 0
Notes Function costs do not include operating costs NA Not Applicable if facility does not perform that function ND No data or incomplete data available to costing team 1Lusaka Main DHO has no storage facilities for ARVs but has staff that perform monitoring activities and support health facilities with ordering activities 2CIDRZ a large organization that provides a very wide range of support to the ARV program performs the transportation function getting ARVs from Ngansa to the Lusaka Main health facilities all CIDRZ costs captured under transport and their operating costs are assumed to be minimal 3 Number of registered patients on ART
41
42
Appendix 5
Mpongwe District Supply Chain Costs (US$)
Mpongwe DHMT
Mpongwe Mission Hospital
Mikata Health Centre
St Theresas Hospital Mpongwe
Total value of commodities passing through
$334786 $107738 $6246 $209237
Total volume of commodities passing through (m3)
11 4 039 8
Procurement Costs 0 0 0 0
Storage Costs NA 2631 976 1114
Transport Costs 0 943 36 839
Operating Costs 0 272 44 646
Total Costs 0 2998 1056 2599
Number of patient ARV prescriptions filled a day
- 25-40 3-5 70-80
Procurement Cost per $1000 of ARVs
0 0 0 0
Storage Cost per m3
of annual pass through NA 604 2530 204
Storage Labor Cost 0 2033 973 980
LaborTotal Storage Costs
NA 77 100 88
Cost per m3
transported 0 22 92 154
Notes Function costs do not include operating costs
NA Not Applicable if facility does not perform that function
ND No data or incomplete data available to costing team 1Mpongwe DHO does not have storage facilities for ARVs The ARVs are delivered directly to the Mpongwe Mission hospital where a pharmaceutical technician manages them 2The Mpongwe DHO Officer provided costs for the transportation activities performed by the DHO However there was no distribution schedule available At the Mpongwe Mission Hospital the costing team was informed that health facilities pick up their supplies from the hospital (hence the costs observed at Mikata) and if there is a vehicle available they may be taken back to their facility by a DHO vehicle The costing team is there unable to determine costs since this activity is random and unrecorded 3These costs are related to the faxing of supply vouchers to the LMU of SCMS monthly
43
44
Appendix 6
Ndola District Supply Chain Costing Statistics Ndola DHMT Arthur
Davison Childrens Hospital Ndola
Ndola Central Hospital Ndola
Lubuto Health Centre Ndola
Kavu Rural Health Centre Ndola
Total value of commodities passing through
$1472899 $151222 $943578 $639993 $58184
Total volume of commodities passing through (m3)
45 8 27 20 2
Procurement Costs NA NA NA NA NA
Storage Costs 4176 4526 11141 3150 4164
Transport Costs 3521 NA NA 0 315
Operating Costs 2668 3994 7810 44 46
Total Costs 10365 8520 18951 3194 4522
Cost per $ of annual pass through
070 557 197 047 777
Cost per m3 of annual pass through
228 1000 696 153 2207
Number of patient ARV prescriptions filled a day
NA 40-50 150-200 80-90 30-35
Procurement Cost per $1000 of ARVs
000 000 000 000 000
Storage Cost per m3 of annual pass through
92 537 416 158 2032
Storage Labor Cost 4071 4367 10585 2893 4158
LaborTotal Storage Costs 97 96 95 92 100
Cost per m3 transported 78 0 0 0 154 Notes NA Not Applicable if facility does not perform that function
ND No data or incomplete data available to costing team
45
46
Appendix 7
Estimating Total Delivered Costs ndash Ndola District Procurement Unit SCMS Total
Value of Commodity Volume of Commodity Procurement costs Operating Costs Total
3531884 $ 243
173955$ 50000$
223955$
per $1000
4925$ 1416$ 6341$
29758677 $ 804
200307149 $ $
2003071 $
per $1000
6731$ $
6731$
33290561 $ 1047
2177026 $ $
2227026 $
per $1000
6539$ 150$
6690$
Tier 1 MSL Value of Commodity $ 31983921 Volume of Commodity 1110 Logistics Costs per $1000 Storage $ 250732 $ 784 Inventory $ - $ -Transport $ 27783 $ 087 Operating $ 25041 $ 078 Total $ 303556 $ 949
Tier 2 Ndola DHMT Value of Commodity $ 1472899 Volume of Commodity 4517 Logistics Costs per $1000 Storage $ 4176 $ 284 Inventory $ - $ -Transport $ 3521 $ 239 Operating $ 2668 $ 181 Total $ 10365 $ 704
Tier 3 Lubuto HC Kavu Rural HC Ndola Central Hospital Arthur Davison Value of Commodity $ 639993 $ 58184 $943578 $151222 Volume of Commodity 20 2 27 8 Logistics Costs per $1000 per $1000 per $1000 per $1000 Storage $ 3150 $ 492 $ 4161 $ 7151 $ 11141 $ 001 $ 4526 $ 003 Inventory $ - $ - $ - $ - $ - $ - $ - $ -Transport $ - $ - $ 315 $ 541 $ - $ - $ - $ -Operating $ 44 $ 007 $ 46 $ 079 $ 7810 $ 001 $ 3994 $ 003 Total $ 3194 $ 499 $ 4522 $ 7772 $ 1895100 $ 002 $ 8520 $ 006
SDP Lubuto HC Kavu Rural HC Ndola Central Hospital Arthur Davison Delivered Cost by Function Procurement Costs Logistics Costs Storage Inventory Transport Operating Total
76
18 0 4 3
100 Value
per $1000 6690$
1560$ -$
326$ 266$
8842$ 88
42
51 0 5 2
100 Value
per $1000 6690$
8219$ -$
867$ 338$
16114$ 161
88
10 0 1 1
100 Value
per $1000 6690$
785$ -$
087$ 079$
7641$ 76
88
10 0 1 1
100 Value
per $1000 6690$
787$ -$
087$ 081$
7644$ 76
47
48
Appendix 8
Estimating Total Delivered Costs ndash Lusaka Main District
Procurement Unit SCMS Total
Value of Commodity Volume of Commodity Procurement costs Operating Costs Total
3531884 $ 243
173955$ 50000$
223955$
per $1000
4925$ 1416$ 6341$
29758677 $ 804
$ 200307149 $
2003071 $
per $1000
6731$ 441$
7172$
$ 33290561 1047
2177026 $ 50000$
2227026 $
per $1000
6539$ 150$
6690$
Tier 1 MSL Value of Commodity $ 31983921 Volume of Commodity 1110 Logistics Costs per $1000 Storage $ 250732 $ 784 Inventory $ - $ -Transport $ 27783 $ 087 Operating $ 25041 $ 078 Total $ 303556 $ 949
Tier 2 Value of Commodity Volume of Commodity Logistics Costs Storage Inventory Transport Operating Total
Lusaka MainNgansaCIDRZ $ 13029840
441 per $1000
$ 52257 $ 401 $ - $ -$ 37833 $ 290 $ 13700 $ 105
$ 797$ 103790
Tier 3 Kara Clinic Chilenje Rural HC Mtendere Clinic Bauleni Rural HC Value of Commodity $ 498588 $ 268909 $ 450677 $ 214773 Volume of Commodity 14 7 14 7 Logistics Costs per $1000 per $1000 per $1000 per $1000 Storage $ 6316 $ 1267 $ 3608 $ 1342 $ 4124 $ 915 $ 3143 $ 1169 Inventory $ - $ - $ - $ - $ - $ - $ - $ -Transport $ - $ - $ - $ - $ - $ - $ - $ -Operating $ 889 $ 178 $ 248 $ 092 $ 467 $ 104 $ 67 $ 025 Total $ 7205 $ 1445 $ 3856 $ 1434 $ 4591 $ 1019 $ 3210 $ 1194
SDP Kara Clinic Chilenje Rural HC Mtendere Clinic Bauleni Rural HC Delivered Cost by Function Procurement Costs Logistics Costs Storage Inventory Transport Operating Total
68
25 0 4 4
100 Value
per $1000 6690$
2413$ -$
377 $ 362 $
9842$ 98
68
25 0 4 3
100 Value
per $1000 6690$
2488$ -$
377$ 276$
9830$ 98
71
22 0 4 3
100 Value
per $1000 6690$
2061$ -$
377$ 287$
9415$ 94
68
26 0 4 2
100 Value
per $1000 6690$
2610$ -$
377$ 215$
9891$ 99
49
50
Appendix 9 Estimating Total Delivered Costs ndash Mpongwe Main District Value of Commodity Volume of Commodity Procurement costs Operating Costs Total
Tier 1 Value of Commodity Volume of CommodityLogistics Costs Storage Inventory Transport Operating Total
Tier 2 Value of Commodity Volume of Commodity Logistics Costs Storage Inventory Transport Operating Total
Tier 3 Value of Commodity Volume of Commodity Logistics Costs Storage Inventory Transport Operating Total
SDP Delivered Cost by Function Procurement Costs Logistics Costs Storage Inventory Transport Operating Total
CHAZ per $1000
2083755 $ 74
104188$ 50$ -$
104188$ 50$
CHAZ 2083755 $
35394$ 17$ -$ 0
83130$ 40$ -$ 0
118524$ 57$
Mpongwe DHMTMpongwe Mission Hospital 334786$
11 per $1000
2631$ 001$ -$ -$ 94 $ 000$
272$ 000$ 2997$ 001$
St Theresas Mikata Health Centre 209237 6246$
5 039 per $1000 per $1000
1114$ 001$ 976$ 016$ -$ -$ -$ -$ 839$ 000$ 36$ 001$ 646$ 000$ 44$ 001$
2599$ 001$ 1056 017$
St Theresas Mikata Health Centre per $1000 per $1000
56 5000$ 47 5000$
001 00053$ 16 1715$ 000 -$ 0 -$
4438 398983$ 37 3990$ 000 00031$ 0 001$ 100 8991$ 100 10706$
Value 90 Value 107
51
52
Appendix 10
Estimating Total Delivered Costs ndash Weighted Average Calculations
Sample weighted average (SWA) by value
SWA for procurement costs
SWA for storage costs
SWA for transport costs
SWA for operation costs
SWA for Total Delivered Cost as a of Total Delivered Value of Commodities
Lubuto HC
19
14
3
1
164
Kavu Rural HC
2
1
1
0
027
Ndola Central Hospital
27
24
3
0
209
Arthur Davison
4
4
0
0
034
(cont) Kara Clinic Chilenje Rural HC Mtendere Clinic Bauleni Rural HC Mikata HC AVERAGE (TOTAL)
SWA by value 14 8 13 6 0 (100)
SWA for procurement costs 10 5 9 4 0 75
SWA for storage costs 3 2 3 2 0 17
SWA for transport costs 1 0 1 0 0 6
SWA for operation costs 2
SWA for Total Delivered Cost as a of Total Delivered Value of Commodities
143 077 123 062 002 896
Note CHAZ facilities not included due to the lack of available data on procurement costs
53
54
Appendix 11
USAID | DELIVER PROJECT Supply Chain Costing Tool Pilot List of Data inputs required for estimating the Cost of a Supply Chain
TC Total Cost All costs assumed to be annual
SC Supply Chain
Information Systems At present it is assumed that these costs will fall under labor costs under the procurement function rather than as a separate category This assumption may be re-assessed after the pilot exercise so placeholders are included at the end of the table
Quality Assurance At present it is assumed that these costs will fall under laborsupervisory costs under each of the procurement storage and transport categories rather than as a separate category This assumption may be re-assessed after the pilot exercise so placeholders are included at the end of the table
LOE Level of effort (as ) spent on HIV SC-related activities
55
Output Metric Notes User Input Metrics
Total Cost of Supply Chain TC Procurement +TC Storage +TC Transportation
(See above regarding information systems and quality assurance)
This is how the costs will be aggregated to obtain the total cost of procurementstoragetransportation at each tier of the system
Labor costs+ Non labor-operating costs + Capital costs + Other
TC Procurement
Labor cost Labor costs should be obtained from a standard civil service salary scale This way only the grade and LOE needs to be collected from each facility rather than having to include questions on salary
Personnel Types
Personnel Salary
Personnel Level of Effort spent on SC-related procurement activities ()
Personnel Benefits
Annual training expenditures related to SC procurement activities
Non-labor operating cost It is anticipated that these expenditures are available at the facility level Eg Average or annual expenditure on telephone calls Cost of space may be a capital cost if the value of the space is to be captured using the value of equivalent landbuilding rather than an equivalent rent
Telephones
Postage
Courier
Printing
Security
Supplies
Utilities
Costrent equivalent per sq feet per annum Area in sq feet allocated to procurement offices
Commodity Value If complete commodity data are available from the MSLPSU then it may not be necessary to collect them at the facility level unless there is reason to believe that the figures differ and there are costs associated eg wastage damage loss etc
Commodity Name
Commodity Quantity Procured
Unit price at which commodity X is procured
Custom Fees Commodity Prices
Custom rates (It may be that a single rate is used for all commodities and so this would simplify to a single percentage)
Taxes Commodity Prices
56
Output Metric Notes User Input Metrics
Insurance If applicable
Tax rate if applicable
Freight Fees Freight Rates if applicable
Commodity Prices
Freight rate specifically the rate charged for commodities up to the point of entry into the country only Rates may be based on price or volume
TC Storage
Labor Labor costs should be obtained from a standard civil service salary scale This way only the grade and LOE needs to be collected from each facility rather than having to include questions on salary
Personnel Types
Personnel Salary
Personnel LOE spent on SC-related storage activities ()
Personnel Benefits
Annual training expenditures
Non-labor operating cost It is anticipated that these expenditures are available at the facility level Eg Average or annual expenditure on telephone calls These non-costs do not include any capital costs which are captured in other sections
Telephones
Postage
Courier
Printing
Security
Supplies
Utilities
Fuel
Costrent equivalent per sq feet per annum Area in sq feet allocated to office space for storage-related personnel
Other expenses
Handling This equipment will count as capital costs For each of these items the quantity age and cost of the equipment will be collected and the depreciation calculated
Forklifts
Hand pallet trucks
Carts
Wheelbarrows
2-wheeler
Other
57
Output Metric Notes User Input Metrics
ShelvesRacks
Refrigerators
Cold room
Safevaults
Other
Supplies
Space Square meterage of storage space
Length (meters)
Breadth (pacesmetersfeet)
Value per square meter if no rent or payments currently made on the space then use rent of equivalent space in equivalent location
Percentage of space used for SC storage purposes and that is paid for out of the SC budget
TC Transportation
Note Specific maintenance costs to be estimated under operating costs and labor costs ie costs will be counted under rent and mechanic salaries and so on therefore there is no row for maintenance
Labor Labor costs should be obtained from a standard civil service salary scale This way only the grade and LOE needs to be collected from each facility rather than having to include questions on salary
Personnel Types
Personnel Salary
Personnel LOE
Personnel Benefits
Annual training
Non-labor operating cost It is anticipated that these expenditures are available at the facility level Eg Average or annual expenditure on telephone calls
Telephones
Fuel
Costrent equivalent per sq feet per annum Area in sq feet allocated to office space for storage-related personnel
Other expenses
Vehicles For each of these items the quantity age and cost of the equipment will be collected and the depreciation calculated
Vehicle Types
Vehicle Cost
Percent of time vehicle is used for SC transport purposes
58
Output Metric Notes User Input Metrics
Information Systems
Labor Labor costs should be obtained from a standard civil Personnel Types service salary scale This way only the grade and LOE Personnel Salary needs to be collected from each facility rather than having to include questions on salary Personnel LOE spent on SC-related storage activities ()
Personnel Benefits
Annual training expenditures
Quality Assurance
Labor Labor costs should be obtained from a standard civil service salary scale This way only the grade and LOE needs to be collected from each facility rather than having to include questions on salary
Personnel Types
Personnel Salary
Personnel LOE spent on SC-related storage activities ()
Personnel Benefits
Annual training expenditures
59
60
Appendix 12
Contact List Contact Title Organization
Albert Lupupa Chief Purchasing and Supplies Officer
Drug Procurement Office Ministry of Health
Tom Brown Director of Logistics Medical Stores Limited
Mulenga Muleba Deputy Country Manager Crown Agents - Zambia
Edward Kabwe Director of Finance and Administration
Medical Stores Limited
Abel Phiri Transport Manager Medical Stores Limited
Kwasi Torpey Director Technical Support ZPCT
Gail Bryant Senior Advisor Pharmaceutical Management
ZPCT
Yebo Gondwe ZPCT
Lona Mwenda Program Officer ZPCT
Kelly McCoy Project Manager CIHDZ
Joshua Kasimba CIHDZ
Chipupu Kandeke Manager Pharmaceutical Services CHAZ Church Health Association Zambia (CHAZ)
Shadreck Malupenga Logistics CHAZ Christian Health Association Zambia
Osward A Nyenda Manager Operations Ngansa Pharmaceuticals Ltd
Bjorn von Hofsten Director Pharmacist Ngansa Pharmaceuticals Ltd
Maxwell Kasonde Morgan Phiri District Pharmacy Programme Coordinators
Lusaka Main DHMT
Jack Menke Program Manager Kara Clinic Lusaka
Mrs Chileshe In-charge ARV Pharm Technician Mtendere Health Centre Lusaka Main
Happy Chiporu Mosia Muhango In-charge ARV Pharm Technician Chilenge Lusaka Main
Mrs Mtonge Lisa Siame In-charge ARV Pharm Technician Bauleni Health Centre Lusaka Main
Dr Isaac Banda Director Mpongwe DHMT
Gladys Mpagwe ARV Pharm Technician Mpongwe Mission Hospital
Florida Mumba Esther Zimba In-charge ARV Pharm Technician Mikata Health Centre
Sister Chanshi Director ARV Pharm Technician St Theresas Hospital
Mercy ZPCT Ndola
61
Contact Title Organization
Lilian Nyerbwa Manager Planning Ndola DHMT
James Simulwke Pharmacist Ndola DHMT
Chiryimba Musonda Pharmacist Technician Ndola DHMT
Ignatius Chikoti Assistant Accountant Ndola DHMT
Matthew Mwute Hanzooma Hatwiko
Head of Pharmacy Dispensing ARV Pharmacist
Arthur Davidson Childrenrsquos Hospital Ndola
Dr Dande Malawo Dr Masase Mwape Kunda Royd Ngoma
Executive Director Clinical Director Dispensing ARV Pharmacist Store Pharmacist
Ndola Central Mission Hospital
Mrs Mwambi Nurse In-Charge Lubutu Health Centre Ndola
Sister Elizabeth Njovu Nurse In-Charge Kavu Rural Health Centre Ndola
Deborah Connor Country Director EGPAF
Mbaweni Mwanza Deputy Director Finance and Administration
SCMS and USAID | DELIVER PROJECT
Peter Lisulo Senior Public Health Logistics Officer
SCMS and USAID | DELIVER PROJECT
Walter Proper Country Director SCMS and USAID | DELIVER PROJECT
Wendy Nicodemus Senior Technical Advisor SCMS and USAID | DELIVER PROJECT
Paul Kamuna Public Health Logistics Officer SCMS and USAID | DELIVER PROJECT
David Papworth Deputy Country Director SCMS and USAID | DELIVER PROJECT
62
For more information please visit deliverjsicom
USAID | DELIVER PROJECT
John Snow Inc
1616 Fort Myer Drive 11th Floor
Arlington VA 22209 USA
Phone 703-528-7474
Fax 703-528-7480
Email askdeliverjsicom
Internet deliverjsicom
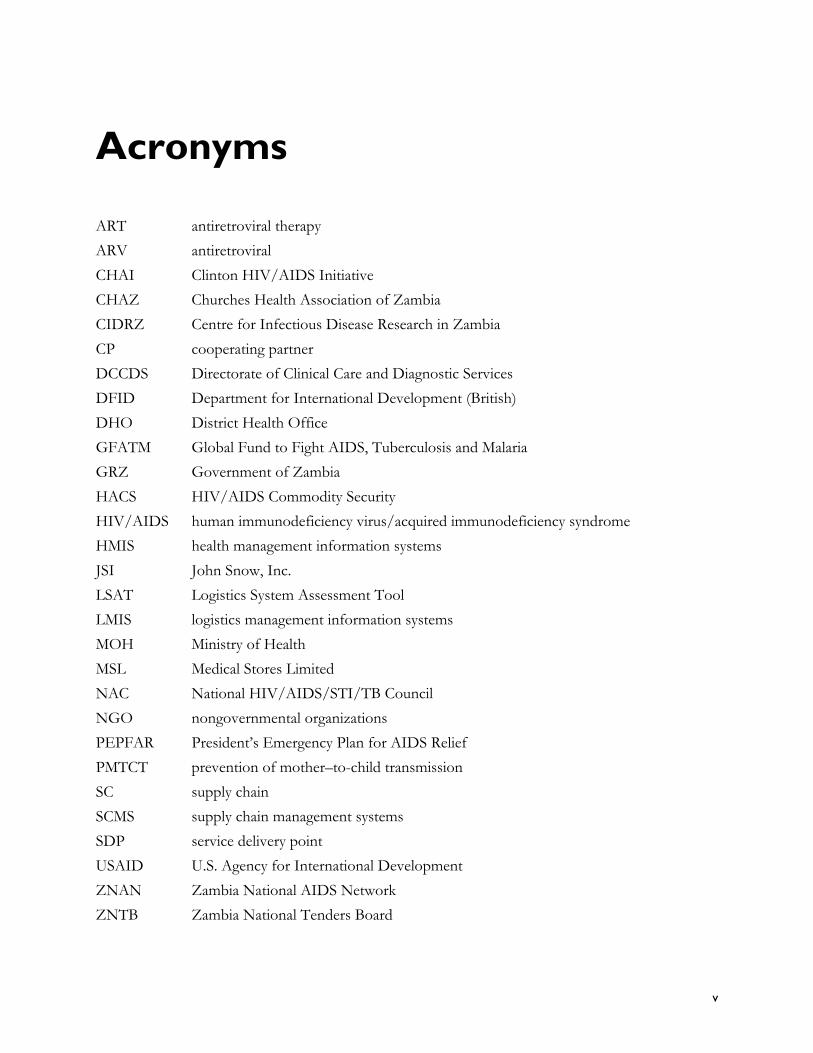
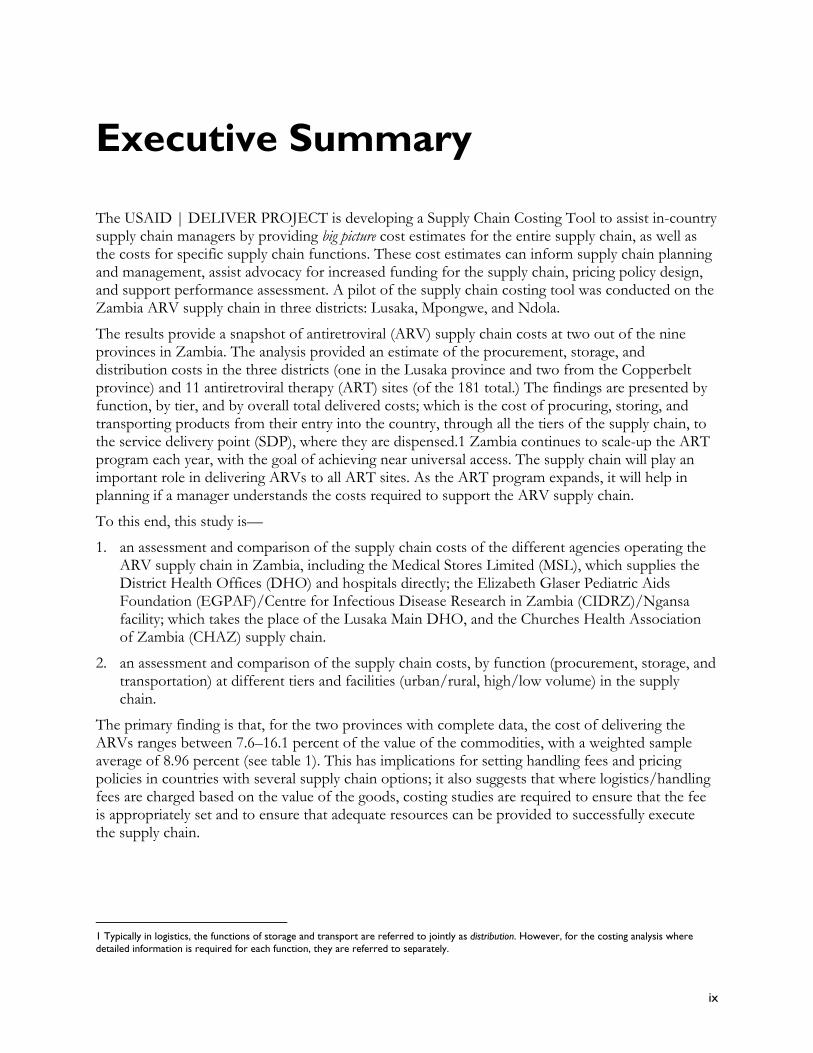
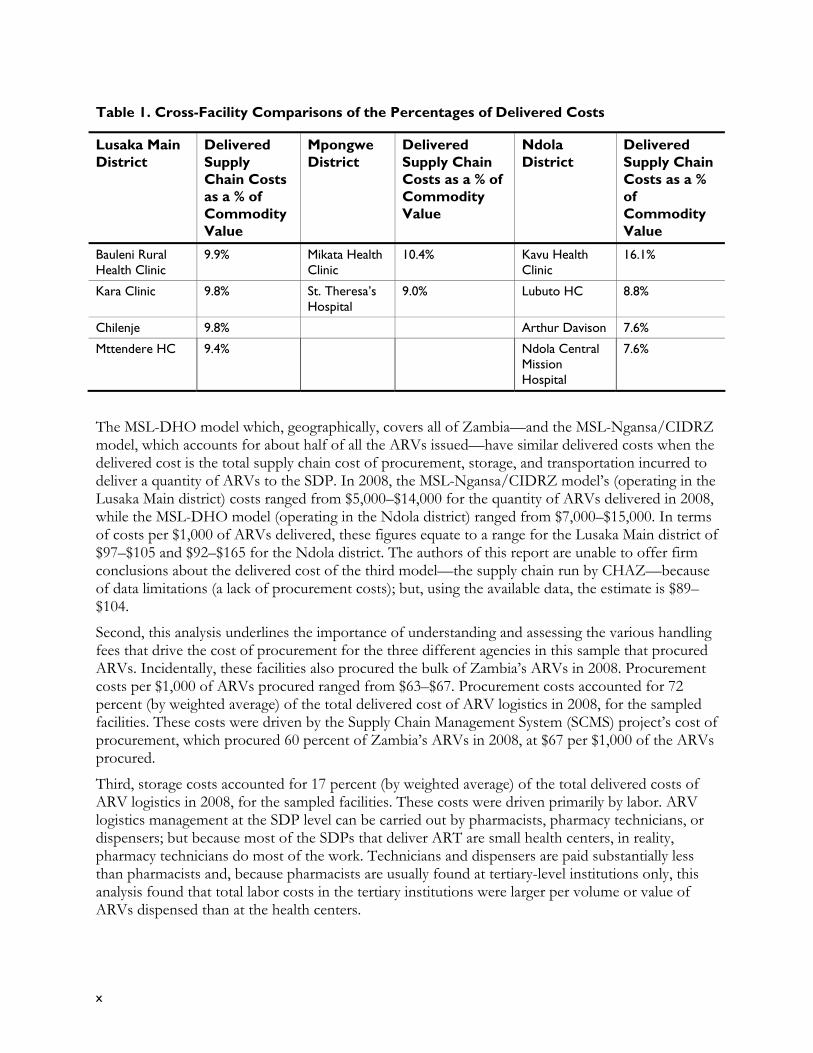
2
Costing Approach Overview Estimating public sector supply chain costs is complicated for a number of reasons Typically public supply chain inputs do not always have documented costs as financial accounts are not necessarily maintained by function The complexity of many public sector supply chains can also mean that multiple agencies or administrative units may have some responsibility in ensuring that commodities move along the supply chain It may not always be possible to capture each of these parts Finally the cost of the Ministry of Health (MOH) or donor management may not be captured as indirect or overhead costs
To address these complications we first define the supply chain cost function we then map the Zambian ARV supply chainmdashthe distribution tiers and functions We also derive estimates for key inputs using the Zambian civil service pay scales for staff time and accounting conventions for buildings and equipment depreciation
Supply Chain Cost Function A literature review (Baruwa and Islam 2008)2 conducted before this study began identified several relevant approaches to supply chain costing Figure 1 summarizes the different dimensions of a typical public sector supply chain that need to be captured It illustrates how different supply chain functions procurement storage and transportation can be spread across different administrative levelsmdashfrom the central to regional and district and to the service delivery point (SDP)
Figure 1 Supply Chain Costing Overview
Source (Raja Grace and Chesley 2000)3
2 Baruwa Elaine and Mursaleena Islam 2008 Literature Review of Costing Supply Chains and Logistics Systems Washington DC Abt Associates for the USAID | DELIVER PROJECT 3 Raja Sangeeta Cheri Grace and Andrew Chesley 2000 The Cost of Logistics Development and Application of a Logistics Cost Model for Public Sector Health Commodities in Ghana Arlington Va Family Planning Logistics Management (FPLM)John Snow Inc for the US Agency for International Development
3
Typically we would expect the supply chain cost to comprise direct labor storage inventory equipment transport and indirect management costs distributed across these functions and levels It should be stressed that this costing exercise estimates the costs of the existing system with its inherent strengths and weaknesses The tool does not estimate what costs should be if the system is working efficiently at full capacity It should also be stressed that we focused on the in-country costs and not international costs associated with various donor and implementing agencies
Mapping the Supply Chain To ensure that commodities reach the SDPs a number of agencies and partners are involved in the ARV supply chain in Zambia Each agency plays various roles in procuring storing and distributing ARVs The increase in attention from the Government of Zambia (GRZ) and donors to combating HIV and AIDS has led to an increase in the number of funding agencies for ARV drugs Each funding stream may use a different implementing agency and then a different procurement agency Distribution for the facilities in the costing exercise sample is undertaken through three key channelsmdash the MSL EGPAFCIDRZ and CHAZmdashwith products dispensed at public and nongovernmental organization (NGO) SDPs EGPAF funds many of the supply chain activities that CIDRZ performs and will be referenced as CIDRZ in the report because they are the implementing agency
Selective Sampling The sample sites were chosen to reflect both the costs of the various agencies who manage ARV supply chains in Zambia as well as to reflect both urban and rural regions The sample was not intended to be representative of the national ARV supply chain Consequently the analysis in this report represents the costs specific to the facilities visited and their upstream levels in the supply chain Results are aggregated where appropriate to draw conclusions that will be informative to both Zambiarsquos logistics program managers as well as to the donor partners providing technical assistance to these managers
To explore the variations within the supply chain three districts with different supply chain models were chosen for the analysis (see figure 2) Each of these districtrsquos logistics models are discussed in more detail in the Results section because these descriptions represent a qualitative output of the tool itself In summary two of the districts Lusaka Main and Ndola are supplied directly with ARVs stored and transported by MSL whereas the facilities evaluated in the final district Mpongwe are supplied by CHAZ which runs a parallel supply system that is not linked to the MSL at any point in the supply chain (There are other facilities in Mpongwe that the MSL supplies but we did not include them in this sample) Lusaka Main a district in the countryrsquos capital of Lusaka is a densely populated urban district with a very high number of registered patients on ART the highest of all the 72 districts in Zambia The capital is both a city and a province and it includes three other districts as well as Lusaka Main but Lusaka Main is by far the largest in terms of registered ART patients Ndola and Mpongwe are districts in the Copperbelt province of Zambia approximately three hours from Lusaka Ndola is urban but is much less densely populated than Lusaka while Mpongwe is a rural district
4
Figure 2 Map of Zambia showing Lusaka Main Ndola and Mpongwe districts
To collect information on supply chain costs the team selected a number of facilities which range from the MSL to health centers that handle ARV commodities A facility can also be a DHO or a partner such as the Supply Chain Management System (SCMS) project The term facility is used to describe an entity that would have procurement storage vehicle training or staff costs and is different from the term health facility which provides clients with ARVs
The Zambia health system categorizes health facilities into three levels Level 3 are large referral health facilities such as hospitals in urban centers Level 2 health facilities are provincial hospitals and Level 1 health facilities are found at the district level Additionally health centers are found below the district and are not classified into levels
Facilities within the three districts were chosen to ensure that as many of the different levels of the health facilities were included in the sample as possible Level 1 Level 3 facilities and health centers There were no Level 3 facilities in the Mpongwe district and no Level 2 facilities available in any of the districts
For the costing analysis the supply chain is divided into three tiersmdashthe primary or Tier 1 health facilities are national facilities that supplydistribute down the supply chain to Tier 2 and below Tier 2 facilities are district-level facilities In Zambia the provincial level is not recognized as a supply chain tier for the ARV drug supply chain but the provincial pharmacist provides oversight for the district supply chain Instead the 72 districts that make up the provinces are considered to be the Tier 2 facilities Each district has a DHO headed by a District Medical Officer (DMO) These districts may have their own storage facilities and act as pass through facilities where ARVs are only in storage for one to two days before being distributed to SDPs within the district Tier 3 facilities are health facilities that are SDPs Figure 3 illustrates how the Zambia supply chain is divided into three tiers for costing purposes
5
Figure 3 Zambia Supply Chain Structure as used by the Supply Chain Costing Tool
Table 2 lists the names and classifications of all the facilities visited during the study Tier 1 facilities comprise the organizations at the central level The MOH funds both the Drug Procurement Office and MSL The Drug Procurement Office sits within the Ministry of Health while MSL is funded with a grant from GRZ but is run by Crown Agents Inc under a management contract The SCMS and USAID | DELIVER PROJECT and CIDRZ are bilateral donor partners funded by USAID that provide technical assistance to GRZ CHAZ is a Zambian NGO that operates a parallel ARV supply chain supplying certain facilities within Zambia it also supports a number of publicNGO facilities These agencies comprise the Zambian ARV supply chain It should be noted that the Clinton Foundation and UNITAID funded and procured about 25 percent of the ARVs obtained in 2008 Their costs are included in their pricing the commodities they procure enter the supply chain when they are delivered to the MSL facility
In summary ARV drugs flow from Tier 1 facilities through Tier 2 down to Tier 3 facilities but with several exceptions (see the Results section) Individual facilities can perform one or all of the three functions in this analysis being assessed for costs procurement storage and transport Facility types refer to whether the facility is a public- or government-funded facility in which case it is the MOH a DHO or a public service delivery point such as a Level 3 facility or a health center If the facility is not public then it is a partner in the ARV supply chain that is an NGO or is donor funded eg Kara Clinic or SCMS It should be noted that Table 2 lists the facilities included in this analysis but is not a complete list of all the facilities in any of the tiers For example there are a total of six ART sites in the Ndola district the costing team visited four in addition to the Ndola DHO
In summary the study costed the supply chain functions of three Tier 1 facilities
the MOH and MSL which are government-funded facilities
CHAZ and SCMS which are classified as partners in the ARV supply chain because they are not government funded
five Tier 2 facilities which are the three DHOs (where CIDRZ and Ngansa assist the Lusaka Main DHO hence their classification in Tier 2 thus 3 facilities are lsquocountedrsquo as providing the DHO function in Lusaka Main)
6
eleven Tier 3 facilities which are all health facilities and SDPs for ART
See the annex for a full list of facilities and their sample criteria
Table 2 Facilities Included in the Sample by Tier Logistic Function and Facility Type
Facility Name Tier Classification
Facility Type
Pro
cure
Sto
re
Tra
nspo
rt
Central Level
Drug Procurement Office Ministry of Health Tier 1 MOH
Medical Stores Limited Tier 1 MOH
SCMSUSAID | DELIVER PROJECT Tier 1 Partner
Christian Health Association of Zambia (CHAZ)
Tier 1 Partner
Lusaka Main District
Ngansa Pharmaceuticals Ltd Tier 2 Partner
EGPAF(CIDRZ) Center for Infectious Disease Research in Zambia
Tier 2 Partner
Lusaka Main DHMT Tier 2 District Health Office
Kara Clinic Lusaka Tier 3 Health CentreNGO
Mtendere Health Centre Lusaka Main Tier 3 Health Centre
Chilenje Lusaka Main Tier 3 Health Centre
Bauleni Health Centre Lusaka Main Tier 3 Health Centre
Mpongwe District
Mpongwe DHOMission Hospital Tier 2 District Health Office
Mikata Health Centre Mpongwe Tier 3 Health Centre
St Theresas Hospital Mpongwe Tier 3 Level 1
Ndola District
Ndola DHMT Tier 2 District Health Office
Arthur Davison Childrenrsquos Hospital Ndola Tier 3 Level 3
Ndola Central Hospital Ndola Tier 3 Level 3
Lubuto Health Centre Ndola Tier 3 Health Centre
Kavu Rural Health Centre Ndola Tier 3 Health Centre
Data Collection Both qualitative and quantitative data collection methods were required to determine supply chain costs The tool required data from interviews with key informants and the collection of reports and
7
financial data Supply chain cost data came from a wide range of sources including logistics reports transport schedules expenditure reports and on-site interviews at each of the facilities sampled
It was necessary to understand the system in place prior to trying to determine the inputs and costs of running the system In the case of Zambia the USAID | DELIVER PROJECT office and previous analyses primarily the 2007 HACS report provided a clear description of the overall ARV supply chain and the roles played by the many partners who implement and support the program To supplement this the costing exercise required data be collected from each partner on the detailed day-to-day activities that each of these partners undertake
The interviewers (the costing team) used a discussion guide summarized in table 3 to obtain both quantitative and qualitative data from key informant interviews on key logistics functions
Table 3 Costing Tool Data Collection Discussion Guide Topics
Understanding the supply chain functions undertaken by the facility (ie procurement storage and transportation)
Outlining the process followed for each function (eg delivery schedules for transportation and the timingschedule of procurement functions)
Determining staffing and non-labor inputs for each function
Determining the costs of the staffing and non-labor inputs for each function
Obtaining and interpreting the facilityrsquos overhead costs
Obtaining the facilityrsquos overall target client number (eg MSLrsquos clients would be the DHOs the health centerrsquos clients would be the ARV patients)
Key Informant Interviews A range of respondents were interviewed to collect information For facilities in Tier 1 where the facility is large enough to have an administrative financial logisticsstorage and service delivery team it was necessary to meet with at least one person in each of those teams For example at MSL the costing team spoke to the head of each relevant department Using the facilityrsquos annual report and payroll documents the finance officer was interviewed to determine labor and operating costs the transport officer was interviewed to determine transport processes labor requirements distribution schedules and vehicle running costs and the warehouse manager was interviewed to determine the processes staffing levels and consumables required for carrying out storage activities In some Tier 1 facilities it was possible to obtain financial information from a technical staff member by giving the staff member a list of data requirements that would be forwarded to a financial team and then returned to the costing team
The tool classifies each partner as a facility and then asks the respondentrespondents at each facility which of the three primary functionsmdashprocurement storage or transportationmdash the facility carries out For example MSL does not conduct any procurement activities therefore no further questioning about procurement costs was necessary the interview then moved on to probe the MSLrsquos storage process In contrast the medical procurement office in the MOH does undertake
8
procurement activities therefore further details were obtained from the respondent at the facility around the procurement processmdashthe time it takes to complete a single procurement Following this data collection the costing team moved on to determine the staff involved and the inputs (and subsequent) costs associated with the process The interview ended because the medical procurement officersquos role in the ARV supply chain ends after the procured commodities are delivered to the MSL
In many cases notably for the facilities further down the supply chain such as health centers very few people were involved in the actual handling of ARVs It was necessary to only speak to the personnel in-charge to obtain permission to talk to staff Typically the ARV logistics staff would in most cases also be the ART dispenser usually a pharmacist or pharmaceutical technician For example the Mtendere Health Center in the Lusaka Main district employed a single pharmaceutical technician who was interviewed by the costing team The technician provided the necessary information required by the costing team for all the health facilitiesrsquo ARV logistics activities In this particular case the technician worked solely on ART logistics and ARV dispensing This was the case in most of the health centers that the costing team visited All the SDP facilitiesrsquo interviews were completed in less than two hours
Quantitative Data Quantitative data was obtained through financial reports financial expenditures Supply Chain Manager and interviews Each function was divided into a labor component an equipment cost component and a third other section to capture costs specific to the particular function To estimate staff time spent on managing ARV commodities they were asked to estimate the time spent each week or month on supply chainndashrelated tasks Salary data were then collected or obtained by matching each staff memberrsquos civil service grade to the public service management salary guide Where salary data were not available as was the case for some private organizationsmdasheg CHAZmdash the team used the equivalent civil service salary grade
Storage was costed directly using a building cost of KW2000000 per m2 (US$2000) and a depreciation rate of 5 percent which is the standard rates used for 20-year straight-line depreciation It should be noted that GRZMOH uses a 2 percent rate implying a 50-year economic life for a building but the costing team considered the standard rate of 5 percent to be more appropriate In addition any labor costs associated with managing ARV stocks such as stocktaking and ordering were included under storage costs The cost of buffer stock and pipeline products were not included in the logistics costs although some discussion on the potential impact of these costs particularly for the Lusaka Main district is included later in the report
Costs were classified as transportation costs whether the cost was associated with the delivery of ARVs to a SDP or the cost was associated with a facilityrsquos pick-up of ARVs from a storage facility
Equipment costs were classified as being specific to each costed supply chain function where possible However in many cases these costs were embedded in the operating costs because the facility used the equipment for supply chain activities related to other commodities The total operating costs for the facility would then be multiplied by the percentage of space that the ARVs occupy in that facility so that not all the annual depreciation would be charged to the ARV logistics function but that cost would still be accounted for Table 4 lists the documents used to obtain supply chain costs
9
Table 4 Data Sources for Costing Inputs
Data Source Costing Data Obtained
Monthly expenditure reports Operating costs for each SDP
Supply Chain Manager Requisitionissue voucher monthly reports
Dispensary daily register
ARV quantities (unitspacks) issued to all health centers Level 3 facilities districts CIDRZ and CHAZ
ARV quantities dispensed number of patients per day to which ARVs are dispensed at SDP level
Annual reports Operating costs for MSL and all Level 3 facilities
Summary indicators of the costs of the ARV supply chain are presented for each of the facilities visited specifically the total value and volume of ARVs that passed through these facilities in 2008 as well as the costs of ARV commodity procurement storage and transportation incurred by these facilities The costing data covers the 2008 calendar year However some facilities were not able to provide all the data from 2008 in which case the closest 12 consecutive months were used eg October 2007ndashOctober 2008
Each tier of the supply chain shown in Table 2 is discussed in terms of each of the functions that the facilities perform within that tier and the relevant comparisons To interpret the cost data that have been collected Table 5 shows the indicators that the Supply Chain Costing Tool calculated
Table 5 Supply Chain Costs Comparative Indicators Definitions and Formula
Indicator Definition Formula
Cost per $ of annual pass through
The total cost incurred by a facility when undertaking all its
Total costs incurred by the facility for all the supply chain functions it
supply chain functionsmdashthe total performs in one year ($) value of commodities passing through it in one year Care must
Total $ value of ARVs passing through the facility
X 1000
be taken in its interpretation in one year because some facilities undertake several functions while others perform a single function
Cost per m3 of annual The total cost incurred by a Total costs incurred by the facility for pass through facility when undertaking all its
supply chain functionsmdashthe total volume of commodities that pass through it in one year Care must be taken in its interpretation because some facilities undertake several functions while others perform a single function
Total volume of ARVs passing through the facility
in one year
X
all the supply chain functions it performs in one year ($)
1000
Procurement costs per The total cost incurred by a Total costs incurred by the facility to conduct $ of annual pass through
facility when undertaking procurementmdashthe total value of the procured commodities that pass through it in one year
procurement activities in one year ($)
Total value of ARVs procured by the facility in one year ($)
X 1000
10
Indicator Definition Formula
Storage costs per m3 of annual pass through
The total cost incurred by a facility for storagemdashthe total volume of the procured commodities that pass through it procured in one year
Total costs incurred by the facility to conduct storage activities in one year ($)
Total volume of ARVs procured by the facility in one year (m3)
X 1000
Transportation costs per m3 of annual pass through
The total cost incurred by a facility for transportationmdashthe total volume of procured commodities that pass through it in one year
Total costs incurred by the facility to conduct transportation activities in one year ($)
Total volume of ARVs procured by the facility in one year (m3)
X 1000
of delivered commodities value required for supply chain logistics
The total cost incurred by the supply chain activities as a percentage of the value of (SDP) delivered commodities
Total costs incurred by the supply chain to deliver a one year supply of ARVS ($)
Total value of ARVs delivered to an SDP in one year ($)
X 100
The first two indicators can be used to determine the overall supply chain costs for a given value or volume of delivered ARVs when used in combination For example the results for the Ndola district are presented by function but they are also aggregated when the supply chain costs for the annual delivered valuevolume of ARVs are estimated for that district The supply chain costs at each tier of the supply chain are combined from Tier 1 through Tier 2 all the way down to each of the Tier 3 SDPs which are located in the Ndola district
Not all of the indicators in Table 5 are relevant for every facility included in the costing study for example only two facilities in the sample SCMS and the GRZrsquos Medical Drug Procurement Office undertook procurement activities in the period being costed (2008) CHAZ also procured drugs during 2008 but their procurement costs are not included in the analysis because they did not provide any cost data for that activity The procurement function is analyzed in terms of costs per dollar value because this is the basis upon which many of the fees associated with procurement (eg freight or handling) are charged Similarly storage and transport are analyzed in terms of costs per m3 stored or transported as well as the per dollar value Storage functions are further divided in terms of the cost of the labor required to carry storage in each facility and the percentage of storage facilities costs that are labor costs As noted above while all facilitiesrsquo costs are presented in terms of total costs per dollar and m3 care should be taken to ensure that the appropriate comparisons are made For example comparing the total costs of the Medical Drug Procurement office with the total costs for MSL would be inappropriate because MSL conducts entirely different functions whereas a comparison of SCMS costs with those of the GRZrsquos Medical Drug Procurement office would be appropriate as both facilities perform only procurement functions
11
Data Collection for Costing out the Zambia ARV Supply Chain A detailed HIVAIDS Commodity Security (HACS) assessment was conducted in 2007 for Zambia This document was an excellent source of information for the costing team The HACS clearly outlined all the partnerspartner roles in Zambiarsquos ART program Typically the types of people that are able to provide a detailed big picture view of this type of program would be the head of the procurement unit in a MOH the clinical program director of the national HIVAIDS treatment program the head of the countryrsquos central medical store (or equivalent) as well as the program managers in donor-funded partner institutions like the USAID | DELIVER PROJECT
12
Results of Zambia ARV Supply Chain Costs
The results of the Zambia ARV supply chain costing study are presentedmdash
in summary for all the facilities in the sample
in detail for each of the functions (procurement storage and transportation) that occur at each tier of the supply chain
as comparisons between the appropriate facilities ie the facilities performing the same function
Summary Estimates of ARV Volumes Values and Flows
Prior to adding any costing information it is important to understand how much of a commodity flows through the supply chain and where those flows go This analysis combines the data collected about the structure of the supply chain and the partners involved in the supply chain operations with the commodity quantification data on commodity types volumes quantities and flows After the sample facilities names descriptions and functions have been entered into the costing tool the tool merges the commodity database data with issues data (obtained from Supply Chain Manager software) to produce a summary of the volume of ARVs flowing through the system and the value of the ARVs flowing through each tier and facility of the system Table 5 shows the total volumes and value of ARVs flowing through the facilities in Lusaka Mpongwe and Ndola A caveat is that other partners procuring ARVs in Zambia were not included in this sample table 6 is not a country summary but it is a summary of the sampled facilities
13
Table 6 Summary Figures for Value and Volume of ARVs flowing through facilities in the costing exercise sample
Facility No
Facility Name Tier Classification
Facility Type Total Value of Commodities (US$ annual)
Total Volume of Commodities (m3 annual)
1 Procurement and Supply Unit Ministry of Health Tier 1 MOH 3531848 24277
2 Medical Stores Limited Tier 1 MOH 31983921 110990
3 Churches Health Association of Zambia (CHAZ) Tier 1 Partner 2083755 7420
4 Ngansa Pharmaceuticals Ltd Tier 1 Partner 13029840 44087
5 Lusaka Main DHO Tier 2 District Health Office 13029840 44087
6 Kara Clinic Lusaka Tier 3 Health Centre 498588 1440
7 Mtendere Health Centre Lusaka Main Tier 3 Health Centre 450677 1379
8 Chilenje Lusaka Main Tier 3 Health Centre 268909 719
9 Bauleni Health Centre Lusaka Main Tier 3 Health Centre 214773 782
10 Mpongwe DHO Mpongwe Mission Hospital Tier 2 District Health Office 334786 1062
11 Mikata Health Centre Tier 3 Health Centre 6246 039
12 Ndola DHO Tier 2 District Health Office 1472899 4517
13 Arthur Davison Childrenrsquos Hospital Ndola Tier 3 Level 3 151222 843
14 Ndola Central Hospital Ndola Tier 3 Level 3 943578 2676
15 Lubuto Health Centre Ndola Tier 3 Health Centre 639993 1992
16 Kavu Rural Health Centre Ndola Tier 3 Health Centre 58184 205
17 St Theresas Hospital Mpongwe Tier 3 Level 1 209237 546
18 CIDRZ EGPAF Tier 1 Partner 13029840 44087
19 SCMS and USAID | DELIVER PROJECT Tier 1 Partner 29758677 80393
14
Figure 4 combines these summary data with the issues data obtained from Supply Chain Manager to show the flow of ARVs through the three tiers of sample facilities by value (US$) The three facilities in the sample that perform procurement activities are SCMS MOHGRZ and CHAZ SCMS MOH CHAZ and MSL are classified as Tier 1 facilities in the analysis because they operate at the national level (as opposed to the district level such as Ngansa and EGPAFCIDRZ) ARVs arriving in the country are delivered to either the MSL or CHAZ storage facilities these facilities distribute commodities to both Tier 2 storage facilities and Tier 3 SDP facilities The italicized facilities are ART SDPs that receive ARVs directly by-passing any district level storage facilities
For the Ndola district and its facilities after the ARVs are procured they are stored at the MSL and then transported by MSL to the DHO storage facility (Tier 2) or to the large Level 3 facilities (Tier 3) such as the Ndola mission and Arthur Davison This is an example of the MSL-DHO model of delivery as the DHO then is responsible for the onward delivery to non-Level 3 SDPs in Tier 3 This model of distribution is the most common in Zambia and it applies to most of the 72 districts The MSL-NgansaCIDRZ supply chain process is a modification of the MSL-DHO model with the Ngansa storage facility as the Tier 2 storage facility it is used in just one district Lusaka Main As earlier noted Lusaka has a very high number of ART patients and the DHO does not have the space to store the required quantity of ARV supply in its storage facility (Figure 4 shows that a very high proportion of all the countryrsquos ARV supply goes to the Lusaka Main district) The third model the parallel supply chain structure run by CHAZ is also clearly shown in figure 4 it shows that it distributes just over 5 percent of the value of all the ARVs in the supply chain
Figure 4 Value of ARVs through the Tiers (Sampled Facilities Only) in US$2008
Because the volume of the commodities being transported is most likely to drive storage and transportation costs within a supply chain system the flow of ARVs through the sampled ARV supply chain facilities is also presented in terms of its volume Figure 5 combines these summary data with the issues data obtained from Supply Chain Manager (logistics information system) to show the flow of ARVs through the sample facilities by volume
15
Figure 5 Volume of ARVs through the Tiers (Sampled Facilities Only) in m3 2008
ARV Commodity Flows (m3)
Tier 1 SCMS MoH CHAZ 80393 24277 7420
Tier 1 MSL CHAZ 110990 7420
Tier 2 NgansaCIDRZLusaka DHMT Ndola DHMT Mpongwe DHMT 44087 4517 Mpongwe Mission Hospital
1062
Tier 3 Ndola Central Hospital Ndola Bauleni Health Centre Lusaka Main Lubuto Health Centre Ndola Mikata Health Centre St Theresas Hospital Mpongwe 4517 782 1992 039 546
Arthur Davison Childrens Hospital Ndola Mtendere Health Centre Lusaka Main Kavu Rural Health Centre Ndola 843 1379 205
Chilenje Lusaka Main 719
Kara Clinic Lusaka 1440
Notes a SCMS procured the majority of Zambiarsquos ARVs procured in 2008 Between SCMS MOH and CHAZ almost all the procurement of ARVs for the public sector ART program was captured in the costing exercise so this figure is a good approximation of both total and sample costs b CHAZ appears twice in this flowchart because the total figure for CHAZ captures both its procurement and storage costs Because the financial information was incomplete it was not possible to divide the operating costs between the procurement and storage function for CHAZ therefore only the total cost is shown here c SCMS MOH and other donors procure the MSL storesrsquo ARVs however because the bulk of ARVs in 2008 were SMCS and MOHndashfunded this figure is a good approximation of both total and sample costs
d This figure is the sum of the total costs for each of the facilities that perform logistics function at the Tier 2 level of the supply chain for the Lusaka Main district The individual figures are $52257 $37833 and $8646 for Ngansa CIDRZ and the Lusaka DHMT respectively e These facilities are supplied directly from MSL not through their respective district offices f CHAZ supplies St Theresarsquos but also incurs transportation costs because it must often make extra trips to Lusaka to pick up ARVs
The flowcharts present value and volume data in an intuitive way that shows the big-picture of where the majority of ARVs go and who handles them For example from figure 5 it is clear that beyond the MSL storage facility the Ngansa facility in Lusaka stores nearly half the total volume of ARVs that passed through the ARV supply chain in 2008 CIDRZ fulfills the transport function for this district it is very important to understand CIDRZrsquos costs for policysupply chain design purposes A reasonable question might be whether or not it would be more efficient for MSL to perform the transportation function in Lusaka Main because they already distribute other commodities to that district or whether the CIDRZ dedicated ARV transportation model is the more efficient choice
In addition the role played by Ngansa is substantial because unlike the Ndola facility where the monthly shipment of ARVs is only stored for 2ndash3 days Ngansa serves as a storage facility for each of the Lusaka facilities which means that it stores up to three months of stock for each Lusaka facility Another interesting observation from figure 5 is the substantial volume of ARVs that go to the Lubuto health center Having observed that Lusaka is the most densely populated district it is interesting to note that the Lubuto health center which would be classified as at least peri-urban takes delivery of volumes of ARVs that are substantially higher than a Level 3 facility in the same district the Arthur Davison Childrenrsquos Hospital and substantially higher than any other health center in the sample The closest facility in terms of value and volume is the Kara Clinic in Lusaka which is also the only facility in the sample that is a dedicated HIV and AIDS SDP ie it provides HIV services only On closer examination it was found that the ordered quantity for a single type of
16
ARV drug more than quadrupled over the course of 2008 prompting a further examination of the facilities ordering history
17
18
Supply Chain Cost Estimates
The total supply chain costs for each of the facilities in the costing exercise sample are shown in appendices 3ndash6 These costs were estimated by facility they are the sum of each facilityrsquos procurement storage transport and operating costs It should be noted that costs are shown by facility and therefore not necessarily comparable because not all facilities perform all supply chain functions
Supply Chain Cost Estimates Disaggregated by Tier and Function While the summary data provides a lot of useful information and context it is necessary to examine the costs in more detail by tier and function These data are analyzed both in terms of the total cost of each function and in terms of some supply chain cost metrics (see Table 5) These metrics can be used to compare the costs of undertaking each of the costed functions at each level of the Zambian supply chain This would be of particular interest where more than one facility is undertaking the same function
Tier 1 Ministry of HealthGRZ and National Partners As observed in the notes accompanying table 6 the sample facilitiesrsquo costs in some cases are a good approximation of the costs for isolated parts of the entire system Specifically it is noted that SCMS MOH and CHAZ together procure most of the ARVs procured in Zambia in 2008 (in 2008 CHAIUNITAID funded and procured the remaining 25 percent) Therefore the sum of the individual procurement costs for each of these facilities would be a reasonable approximation of the procurement cost for the entire system Similarly MSL and CHAZ provide all the storage that occurs at Tier 1 of the ARV system and therefore the sum of their costs is a good approximation of the storage costs for the entire system Finally the sample included the MSL which distributes to the majority of the ARV recipient facilities in Tiers 2 and 3 with the exception of those facilities that receive commodities transported by CHAZ and CIDRZ Therefore combining the costs of all the Tier 1 facilities provides a reasonable estimate of the entire Tier 1 costs for the Zambian ARV system (see Table 7) detailed cost breakdowns can be found in Appendix 3
Table 7 Estimate Total Costs of the Zambian ARV Supply ChainmdashTier 1
Facility Logistics Functions Performed Total Cost (US$)
SCMS and USAID | DELIVER PROJECT
Procurementsystem strengthening management support including training
2003071
GRZMOH Procurement 223955
MSL Storagetransport 303556
CHAZ Procurementstoragetransport 222712
Total Tier 1 Costs 2753294
Total value of commodities procured 35374280
19
Note The SCMS costs included in this figure include SCMS costs incurred outside Zambia at the SCMS office in the US The activities covered in this cost include forecasting and demand planning functions not carried out by GRZ Other activities covered include reviewing tenders and negotiating contracts activities that GRZ carries out Therefore SCMS costs cover activities that are similar but not directly comparable to those of GRZrsquos procurement office
Procurement As noted earlier there are several partners operating in Tier 1 of the supply chain The pilot did not include all the Tier 1 partners in the sample (note that the sum of SCMS and GRZ procurement is less than the flow through MSL see Figure 4) GRZrsquos Drug Procurement Office SCMS and CHAZ were the sample facilities that carried out procurement activities (Some partners who conduct procurement activities such as UNITAID and EGPAF were not included in the costing analysis as mentioned earlier although the costing team did visit the country director for EGPAF as part of the preparation process) It was confirmed that neither CIDRZ nor EGPAF undertook any scheduled procurement of ARVs in 2008 although an emergency procurement of Trimmune for children was procured in February 2008 No further details of this procurement were available other than that it was a direct purchase from the local CIPLA agent
SCMS did approximately 60 percent of the procurement in 2008 This figure could change from year to year For example the Global Fund will restart funding to Zambia in 2009 GRZ through the Drug Procurement Office will do the procurement Unfortunately CHAZ was unable to provide any of the data that the costing team requested to determine procurement and operating costs CHAZ contracts with Crown Agents Inc to do its procurement For the procurement costs we used a proxy figure of 5 percent for the handling fee charged by Crown Agents Inc This estimate is a bench mark used by Crown Agents Inc for other procurement actions and does not reflect the actual cost but instead provides a comparison point
The procurement costs for SCMS and GRZ are quite similar but they reflect very different cost structures SCMS spends $67 to procure a $1000 worth of ARVs compared to $63 for GRZ It should be noted that a direct comparison is not strictly possible because of the significant differences between the two SCMS is a global procurement program funded by the US government the project has access to globally negotiated contracts with international suppliers benefiting from economies of scale Its costs reflect the higher levels of US and Zambianndashbased management around the procurement process including the forecasting and tracking of commodities negotiation of global contracts with manufacturers product quality assurance and design and application of an ERP-based management information system (MIS) to track procurement and international freight and insurance These are procurement realitiesmdash arrangements that are not presently available to the MOHrsquos procurement function
By comparison GRZ procured a relatively small amount (both for value and volume) of ARVS in 2008 It is subject to a handling fee of 2ndash3 percent on each procurement to move commodities from their point of entry into the country to MSL this fee alone amounted to just over $105000 in 2008 This fee is on top of the freight charges included in the procurement price paid by GRZ The smaller volume of procurement means that GRZ does not achieve economies of scale so its costs are comparatively higher than SCMS because it performs fewer supply chain procurement activities For example it does not incur costs associated with quantification procurement planning quality assurance and procurement execution costs which are performed by SCMS because the project has the relevant technical capacity
Storage Only MSL and CHAZ perform storage functions at the national level their costs are shown in table 6 Commodities procured by CHAZ are stored at the CHAZ warehouse in Lusaka CHAZ staff were able to provide some information on the size and number of staff working in the storage facilities The CHAZ costs can be compared with those for MSL they appear to be substantially higher when the storage cost per volume figure of US$477 per m3 when compared
20
with the MSL costs of US$226 per m3 MSL operates a much larger store with approximately 8000 m3 storage capacity compared to CHAZrsquos 450 m3 It should be noted that the storage costs discussed here do not include operating costs which have been accounted for separately in Appendix 3 These storage costs do not include the cost of inventory held
Transport Only MSL and CHAZ perform transport functions in Tier 1 The costs for MSL were estimated after determining the cost for its entire transportation operation which conveys essential drugs HIV test kits and many other commodities in addition to ARVs The costs attributed to ARV logistics were determined using the ratio of the total volume of ARVs transported by MSL over the total volume of commodities transported by MSL (which required the assumption that all MSL trucks depart MSL fully loaded) The ARV transportation costs for MSL of $27783 is 7 percent of the total transport costs of MSL in 2008 which is $25 per m3 transported (again excluding operating costs) CHAZ could not provide much information on its transportation operations beyond the length of each ARV distribution trip the number of trips per month and the per diem for the driver and officers required for each trip The costing team had to assume that the salaries of these two staff members are comparable to MSL staff CHAZ was also unable to provide a distribution schedule operating costs or the numbers and cost prices of the vehicles used therefore a depreciation charge on the equipment could not be estimated Using only these limited data the costing team estimates that CHAZ spends approximately $1120 to transport one m3 of ARVs This estimate is substantially higher than MSL and does not include any depreciation charges on vehicles or maintenance charges CHAZ supports a total of 22 ART sites including those in the Mpongwe district which were included in this analysis The costing team determined that CHAZ charges the Zambian National AIDS Network (ZNAN) a 2 percent fee to cover its costs of transporting ARVs from its warehouse to ZNAN-supported facilities in Lusaka but the team was unable to obtain any other details about how often and what volume of commodities was delivered to these facilities in 2008 Given that CHAZ has estimated transport costs equal to 4 percent of the value of the ARVs that passed through it in 2008 this analysis suggested that CHAZ is to a certain extent subsidizing its transportation of ZNANrsquos ARVs
Tier 2 District Health Offices and Tier 3 Health Centers Facilities The section describes the supply chain costs within each of the three districts that were part of this studymdashLusaka Main Mpongwe and Ndolamdashand their facility costs Cost comparisons are made where appropriate It should be noted that in the diagrams that follow we adopt a cumulative approach to indicating the supply chain costs for getting the product to the SDP These costs show the total cost of the procurement and storage costs incurred on commodities at the Tier 1 and Tier 2 facilities plus the storage and distribution costs incurred at the Tier 3 facilities So for example in the Lusaka Main district the total supply chain costs of getting the product to the Kara Clinic was $7205 which is equivalent to 98 percent of the cost of the commodities delivered
Lusaka Main District Lusaka Main is one of the four districts that make up the Lusaka Province It is the largest of these districts in terms of it ARV consumption The supply chain costs for the district are shown in figure 6
21
Figure 6 Lusaka Main District Total Supply Chain Costs of Delivery at SDP
SCMSGRZ_MOH Total Costs $2227026 Costs per $1000 $6690
NgansaCIDRZLusaka Main DHMT Total Costs per $1000 $103790 Costs per $1000 $758
MSL Total Costs per $1000 $303556 Costs per $1000 $949
Procurement No procurement activities occurred at any of the Tier 2 facilities in this sample Emergency procurements may have occurred during 2008 but those interviewed did not consider these orders to be substantial EGPAFCIDRZ was the only facility with the capacity and funding to make an emergency procurement The procurement costs listed relate to the costs incurred in procuring the product through SCMS and GRZ
Storage The Lusaka Main district has the highest number of registered ART patients and consumes the largest quantity of ARVs of any of the districts The districtrsquos facilities have very limited storage capacity and are unable to keep more than a weekrsquos supply of ARVs in stock therefore they need deliveries every week The lack of storage and the fact that these facilities receive supplies weekly implies that the cost of inventory for this district which consumes approximately 40 percent of the entire nationrsquos annual supply of ARVs is relatively low when compared to other districts where facilities store up to three months of inventory To assist these facilities a donor partner EGPAFCIDRZ funds the storage and transport of the districtrsquos ARV requirements CIDRZ does not have a storage facility of its own and therefore contracts with a private facility the Ngansa Pharmaceutical Company to store the districtrsquos ARV supplies An estimated contract value of $50000 per year was given but actual contract details were not obtainable from either CIDRZ or Ngansa This analysis estimates Ngansarsquos costs at $52257 for 2008 (see appendix 4) The Ngansa stores a three-months supply of ARVs for each of the districtrsquos ART sites thereby serving as an extension of their storage facilities MSL delivers ARVs to Ngansa a CIDRZ vehicle makes deliveries according to the supply vouchers received by the Ngansa facility from the health centers It is estimated that the Ngansa facility storage costs are $87 per m3 stored It should be noted that the storage costs associated with the Lusaka Main DHO only include labor costs because three officers at this DHO support the ordering and management of ARVs for all the districts ART sites
Kara Clinic Chilenje CH Mtendere HC Bauleni Rural HC Total Costs $7205 Total Costs $3856 Total Costs $4591 Total Costs $3210
Delivered Costs per $1000 Delivered Costs per $1000 Delivered Costs per $1000 Delivered Costs per $1000 Total $98 Total $98 Total $94 Total $99 Procurement 68 Procurement 68 Procurement 71 Procurement 68 Storage 25 Storage 26 Storage 22 Storage 26 Transport 4 Transport 4 Transport 4 Transport 4 Operating 4 Operating 3 Operating 3 Operating 2
22
As previously mentioned the facilities in the Lusaka Main district have very limited storage capacity and therefore very small storage costs in terms of the cost of space However because storage costs include the cost of labor activities associated with storage such as stocktaking and ordering the total storage costs are much larger than just the cost of space and it accounts for approximately 30 percent of the total delivered cost in the Lusaka Main district
Transportation Using ARV dedicated staff and vehicle CIDRZ does all the transportation of ARVs in the Lusaka Main district MSL delivers ARVs to Ngansa then CIDRZ delivers them to facilities every week It is estimated that each m3 delivered by CIDRZ in 2008 cost $86 (including operating costs) CIDRZ provided the costing team with a detailed list of monthly expenditures for their transportation activities None of the facilities in the district reported picking up their ARVs from Ngansa during 2008
Mpongwe District The facilities visited in Mpongwe district are part of the CHAZ supply chain for ARVs CHAZ supplies these facilities using the CHAZ vehicles from its warehouse in Lusaka See figure 7 for a summary of ARV supply chain costs for the Mpongwe district
Figure 7 Mpongwe District Total Supply Chain Costs of Delivery at SDP
CHAZ Procurement Total Costs $104188 Costs per $1000 $5000
CHAZ Storage and Transport Total Costs $118524 Total Costs per $1000 $5700
Mpongwe DHO Mpongwe Mission Hospital Total Costs $2997 Total Costs per $1000 $001
Mikata Health Centre HC Total Costs $1056
Delivered Costs per $1000 Total $107 Procurement 47 Storage 16 Transport 30 Operating lt1
St Theresarsquos Total Costs $2599
Delivered Costs per $1000 Total $8991 Procurement 56 Storage lt1 Transport 4438 Operating lt1
23
Procurement Procurement is not undertaken at the DHO level in this facility CHAZ procures on their behalf and delivers their ARVs to the Mpongwe Mission Hospital As noted earlier we only used the 5 percent proxy procurement charge for Crown Agents Inc procuring for CHAZ The procurement costs do not include any management costs for CHAZ therefore the procurement share of delivered costs is lower at 48 percent and 56 percent for Mikata and St Theresarsquos Mission Hospital respectively
Storage The district does not have a storage facility for ARVs they use the Mpongwe Mission Hospitalrsquos ARV storeroom therefore the hospital is costed here as part of the district level rather than as a SDP When the costing team visited it during the pilot this storage facility had recently been renovated The ART sites in this district are low-volume rural sites (less than 50 patients a day) therefore some of the storage costs in these facilities are particularly low The smallest facility visited at Mikata stored all their ARVs on two shelves in a storage room with each shelf measuring just 6 times 36 inches
Transportation The district has vehicles for distribution but its resources are limited so the ART facilitiesrsquo personnel find their own way to the mission hospital and if there is transport available they are taken back to their facility If the facility cannot transport them they use whatever means are available
The costing team visited one rural satellite site in this district the Mikata Health Centre This small facility sends an aide on a bicycle to pick up supplies from the mission hospital a ride that takes approximately 45 minutes During 2008 the transportation costs were about $36 For St Theresarsquos where ARVs must be picked up from the CHAZ facility in Lusaka 3ndash4 times a year the transportation costs were about $154 per m3 a year or a total of $839 These two instances where the Tier 1 or Tier 2 facility does not or is unable to perform the transportation function is approximately 38 and 45 percent for the total ARV supply chain costs at Mikata and St Theresarsquos respectively
Ndola District The Ndola district and all three Level 3 facilities receive their ARV supplies directly from MSL The district has its own warehouse facilities on the grounds of the DHO which then uses district vehicles to deliver to health centers The ARVs stay in the district warehouse for only 2ndash3 days before being delivered to the SDPs Level 3 facilities receive their ARVs directly from MSL The Arthur Davison Childrenrsquos Hospital and the Ndola Central Hospital being Level 3 health facilities receive their ARVs directly from MSL they reported to the costing team that they do not have to make any trips to Lusaka to obtain ARVs
Procurement No procurement activities occur at either the Tier 2 or Tier 3 facilities in Ndola However for delivered costs procurement accounts for approximately three-fourths of the costs (Kavu at 43 percent is the exception due to its relatively high storage costs)
Storage Ndola has SDPs or sites that represent both urban high-volume facilities such as the Ndola Central a peri-urban high-volume facility such as Lubuto and a rural low-volume facility Kavu Arthur Davison and Ndola Central are multi-story referral hospitals Despite its size and being a tertiary referral institution the Arthur Davison Childrenrsquos Hospital runs a relatively small ART clinic with volumes much lower than some of the health centers in Lusaka Main However its storage costs are higher than those in Lusaka because of storage labor which is discussed further under General Observations The Ndola Central Hospital runs the largest ART clinic in the sample and therefore has substantial operating costs Only 01 percent of the total operating costs were attributed to ARV for these large institutions because the storage space for ARVs is very small
24
compared to the size of the entire facility Operating costs for Arthur Davison were also 01 percent of the facilityrsquos total operating costs The relatively high storage costs at the Kavu facility were driven by labor because the ARVs in that facility were managed by two pharmacy technicians at 41 percent level of effort each as compared to Lubuto where ARVs are managed by a single dispenser (see Appendix 5) The storage costs are therefore not driven by the actual storage capacity because these were 605 m2 at Arthur Davison and 2122 m2 at Ndola Central but both cases still amounted to 10 percent of total delivered cost Several facilities are in the process of or have already assigned designated storage rooms for ARV drugs However given the small costs associated with actual storage space it is not anticipated that these costs will add substantially to the overall supply chain costs See figure 8
Figure 8 Ndola District District Total Supply Chain Costs of Delivery at SDP (US$)
SCMSGRZ_MOH Total Costs $2227026 Total Costs per $1000 $6690
MSL Total Costs $303556 Total Costs per $1000 $949
Ndola DHMT Total Costs per $1000 $10365 Total Costs per $1000 $704
Transportation ARVs are delivered by MSL directly to Arthur Davison and Ndola Central it is noted that transport accounts for a low percentage of the final delivered cost to these facilities For the other four facilities that dispense ARVs in Ndola the drugs are delivered by MSL to the Ndola DHO which then delivers them directly to facilities within 1ndash2 days of arriving in the Ndola district warehouse While the Lubuto facility did not report having to pick up their own ARVs during 2008 the Kavu facility did report having to regularly do so during 2008 its fuel costs were then reimbursed by the Ndola DHO
Cross District Comparisons Table 7 summarizes the delivered costs in each of the SDPs visited expressed as a percentage of the value of the commodities delivered For the Lusaka Main district these costs are between 94 percent and 99 percent with the highest cost for the Bauleni rural health clinic (HC) The range is greater for the Ndola districtmdashbetween 76 percent and 161 percent with the highest cost reflecting
Lubuto HC Kavu HC Arthur Davison Ndola Central Total Costs $3194 Total Costs $4522 Childrenrsquos Hospital Mission Hospital
Total Costs $8520 Total Costs $18951 Delivered Costs per $1000 Delivered Costs per $1000 Total $8842 Total $161 Delivered Costs per $1000 Delivered Costs per $1000 Procurement 76 Procurement 42 Total $76 Total $76 Storage 18 Storage 51 Procurement 88 Procurement 88 Transport 4 Transport 5 Storage 10 Storage 10 Operating 3 Operating 2 Transport 1 Transport 1
Operating 1 Operating 1
25
higher storage and distribution costs for Kavu HC as mentioned earlier For Mpongwe the range is 104 percentndash90 percent although these include the 5 percent proxy procurement costs and no CHAZ operating costs (note that the CHAZ costs were not provided) so these costs would likely be higher
Table 8 Cross-Facility Comparison as Percentage of Delivered Costs
Lusaka Main District
Delivered Supply Chain Costs as a of Commodity Value
Mpongwe District
Delivered Supply Chain Costs as a of Commodity Value
Ndola District
Delivered Supply Chain Costs as a of Commodity Value
Bauleni Rural HC 99 Mikata HC 107 Kavu HC 161
Kara Clinic 98 St Theresarsquos Hospital
90 Lubuto HC 88
Chilenje 98 Arthur Davison 76
Mttendere HC 94 Ndolsa Central Mission Hospital
76
Limitations The analysis has a number of limitations The analysis does not represent a large enough sample to generalize the results for all 181 ART facilities Therefore it does not provide a costing estimate for the whole system but rather an incomplete costing of each of the systems that deliver ARVs to the three districts studied Most of the country follows the system in use in the Ndola district where procurement is done by the GRZ SCMS project and CHAI on behalf of the GRZ or another partner the commodities are shipped to MSL which then delivers to the DHO stores and hospitals The SDPs are responsible for dispensing ARVs The Ndola analysis provides some insight into how the rest of the country functions but for several reasons it cannot be said to be representative of all districts Ndola is relatively close to MSL in Lusaka and the road networks to reach it are extremely good This contrasts with many regions in Zambia which are up to 18 hours from Lusaka and even longer in the rainy season when road conditions deteriorate To reach facilities some regions require boat trips For these reasons the logistics process may differ in other districts with important costing consequences that would be missed if an attempt was made to generalize this analysis Therefore it is reasonable to expect that while transportation costs account for less than 5 percent of the delivered supply chain costs in Ndola for example the same indicator for other districts is going to be higher
Although CHAZ procures only a small percentage of the total amount of ARVs used in the ART program it would have been beneficial if we had been able to estimate the comparative metrics on cost per m3 and cost per $1000 of ARVs distributed through this supply chain to determine how the parallel systems perform cost-wise as compared to the MSL-led system
It must be noted that the sample facilities included in this pilot are not generalized for the rest of Zambia because the rural facilities were relatively easy to access compared to other rural ART sites in the country where the roads are inaccessible in the rainy season or sites that must regularly be accessed by boat
26
System-wide Observations and Conclusions
Procurement Costs Overall in the costing sample by weighted average procurement accounts for 76 percent of the total delivered costs per $1000 of ARVs across the 11 SDPs Procurement costs per $1000 of ARVs procured were $63 $67 and $50 at GRZ SCMS and CHAZ respectively It should be noted that the CHAZ estimate incorporates only a 5 percent handling fee to Crown Agents Inc and no operating costs unlike SCMS and GRZ This mean that the costs estimated for CHAZ will likely be higher if the full costs were included in this assessment These procurement costs are driven by the percentage handling fee charged these fees do not represent identical services across the three procuring facilities GRZ pays this fee in-country to get commodities from their point of delivery to MSL The SCMS handling fee accounts for the cost of out-of-country operations by SCMS in the US plus the in-country SCMS management team As noted CHAZ did not provide operating costs Procurement costs represent the major part of the supply chain costs identified Scope for possible savings in procurement costs should be examined but not at the expense of program management forecasting or quality control USAID funding of procurement plays a critical role in ensuring product availability and HIV and AIDS commodity security
Storage Costs With the very low depreciation rates applied by the Zambian accounting system storage costs are driven by the labor costs associated with the logistics management of ARVs The labor costs associated with the management of the ARV supply chain represent more than 80 percent in all Tier 3 facilities (see annexes 4-6) The majority of the storage costs were between $3000ndash$4000 in facilities where a pharmacy technician handled the ARV logistics regardless of the number of clients or volume of ARVs being stored but the costs rose to $4500ndash$11141 when pharmacists manage the logistics Consequently much of the variation between storage costs in Level 3 and health center facilities is due to pharmacists versus pharmacy technicians rather than to the difference in the costs of the physical storage space at these facilities
All the Ndola SDPs had labor costs that accounted for 97 percent or more of their storage costs Ndola Central Hospital and Luboto had annual volumes of 27 m3 and 20 m3 respectively but storage costs of $11141 and $3150 respectively Ndola Central uses three pharmacists at varying levels of effort while Lubuto uses one pharmacist technician Similarly Arthur Davison uses a pharmacist and a pharmacy technician for eight m3 of ARVs at a cost of $4526 while three public facilities in Lusaka have an average volume of 10 m3 with an average storage cost of $3625 each using a single pharmacy technician It would be useful to examine whether the staff assigned to different facilities are performing other functions and whether the logistics management function can be performed effectively by lower-cost pharmacy technicians rather than the more expensive and scarcer pharmacists Does the quality of record keeping or the level of product availability
27
improve with pharmacists rather than pharmacy technicians Do the pharmacy technicians require a larger investment in staff training
An additional observation on storage costs is that there are significant economies of scale in the logistic management function For example Mikata in Mpongwe is issued just 03 m3 of ARVs a year while the Mpongwe Mission Hospital is issued 43 m3 but the Mikata ARV management requires 20 percent of one personrsquos level of effort (LOE) while the mission hospital uses a single person at 40 percent This means twice the LOE is used at Mpongwe for more than ten times the volume of product This observation may be due to the fact that the ARV logistics system is parallel to the essential medicines logistics management and requires its own training and stocktaking activities which usually results in each facility having a dedicated member of staff regardless of the volume of ARVs being managed Therefore there may be a trade off between cost efficiency and performance that needs to be considered if changes were to be made to the system
An additional cost incurred by SCMS in Tier 1 is the cost for training all the staff who work in the ARV supply chain in Zambia This cost was $190915 in 2008 Of this $177248 was the cost of running the nine training workshops during 2008 (including training materials and per diem) During the course of the costing data collection it was noted in several facilities that staff turnover was a significant problem Civil service staff can be transferred between facilities and may not necessarily be transferred to ARV logistics duties at their next posting Therefore the cost of training must be considered as an on-going cost to the ARV supply chain rather than merely a start-up cost
Ndola has SDPs or sites that represent both urban high-volume facilities such as the Ndola Central a peri-urban high-volume facility such as Lubuto and a rural low-volume facility Kavu The storage costs are clearly not driven by the actual storage capacity because these were 605 m2 at Arthur Davison 2122 m2 at Ndola Central 980 m2 at the Lubuto facility and 600 m2 at Kavu but Arthur Davison had higher storage costs than Kavu and Lubuto
Few of the health facilities visited in this study had computers available to assist in their logistics management but Ndola Central Hospital Arthur Davison Childrenrsquos Hospital Lubuto Health Center and Kavu Health Center had received computers and air-conditioners to support their storage cooling The total value of these donations was about $5000
Transportation Costs Of the facilities with transportation costs at Tier 1 and Tier 2 MSL transports the largest volume of ARVs 1110 m3 at a cost of $25 per m3 CIDRZ transports 441 m3 at a cost of $86 per m3 and Ndola DHO transports 45 m3 at $78 per m3 Recall that CIDRZ transportation is dedicated to ARVs whereas MSLrsquos transportation operations are integrated with other commodities It is also important to note that the CIDRZ delivery occurs only within Lusaka Mainmdashapproximately a 10 km radius whereas the MSLrsquos two distribution routes that deliver to Ndola cover 750 km each way For delivered costs 17 percent of the total delivered cost for Lusaka Main was for transportation compared to 5 percent or less in Ndola (results for Mpongwe are only for a single very small rural facility) These findings suggest that integrated delivery can be cost efficient In addition this analysis highlights the importance of differentiating between a literal transportation cost that counts fuel by distance measures versus using an aggregated cost of the total transportation functionmdashin this case carried out by MSLmdashand then proportion costs by volume It was considered appropriate for this analysis to proportion costs by volume to get the true cost because MSL implements an integrated transportation system Transportation costs estimated in terms of fuel by distance would have given substantially higher costs being ascribed to MSL for supplying Ndola compared to Lusaka Main
28
costs because of the distances involved In fact MSL costs should be lower given their economies of scale Also a literal estimate would not account for non-divisables such as driverrsquos time which would be costed according to days traveled where in reality drivers must be paid monthly salaries regardless of the distances they drive
While all the Lusaka Main facilities reported that they did not need to pick up their ARVs at any time in 2008 this was not the case in Mpongwe and Ndola Where facilities have to make some trips to pick up their supplies the costs are much higher than they would have been if MSL or CIDRZ had delivered them (estimating costs for CHAZ was difficult because of the limited data) For example St Theresarsquos transportation costs are estimated at $154 per m3 (issued 033 m3 in 2008) and Kavursquos are $154 per m3 (issued 5 m3 in 2008) Kavu spends substantially more to pick up ARVs ($154 per m3) from Ndola than the Ndola DHO spends to deliver ARVs to facilities ($78 per m3) (see Appendix 5 for details) No facilities that had to pick up their ARVs complained that it was inconvenient but this is likely to be a sample bias as the costing team visited facilities that were easily accessible Had the team visited less accessible facilities it is likely that the costs and inconvenience of ARVs not being consistently delivered would be much greater It is important to consider the cost of facilities picking up their own ARVs across the system in aggregate could be substantial particularly for the less accessible sites where the choice could be between expensive transportation costs or stockouts which have a detrimental impact on ART patients These results suggest that increased support at the DHO level to both ensure delivery of ARVs and lower transportation costs for the system
29
30
Conclusions
This costing exercise was conducted to assess the supply chain costs of operating Zambiarsquos ART program Comparisons of costs have been made between the different models of supply between high- and low-volume facilities and between rural and urban facilities In summary due to economies of scale the MSL-DHO model which covers most of Zambia geographically and the MSL-NgansaCIDRZ model which covers accounts for half of all the ARVs issued have similar costs The study was unable to make firm conclusions about the third modelmdashthe supply chain run by CHAZmdashbut the analysis provides no evidence that this supply chain given its size must be costlier than the other two models Similarly it was found that high-volume facilities tend to have lower delivered costs than low-volume facilities but this finding may be subject to some selection bias because the high-volume facilities in the sample were usually found in Lusaka and therefore had much shorter transportation distances to cover Notwithstanding the higher frequency of deliveries to the Lusaka facilities the total distances covered are significantly shorter than those required to deliver ARVs to the facilities in Mpongwe and Ndola In addition because urban facilities tend to dispense to larger numbers of patients per day than rural facilities costs tended to be lower It is important to note that at least for the two large urban facilities included in this sample some of these cost differences are due to the labor costs of the more skilled staff that tend to manage the ARVs in these facilities This costing did not combine costs with effectiveness measures such as those obtained in a LIAT study of a supply chain system Therefore it cannot be determine whether the differences in costs will lead to differences in effectiveness of the supply chain such as whether higher labors costs for more skilled ARV managers results in fewer stockouts such an analysis could be beneficial to logistics managers In future studies using the supply chain costing tool this limitation will be addressed
In the private sector logistics costs tend to be presented in terms of the cost of getting a commodity where it needs to be as a percentage of the value of the good There has been some discussion that because ARVs are costly relative to many other commodities in the health sector the fee for their handlinglogistics should be lower because the fee is based on the value of the goods This report finds that for the two provinces with complete data the cost of delivering the good ranges between 8ndash16 percent of the value of the commodities and that procurement accounts for the largest portion of these costs
This has implications when setting handling fees and pricing policies in countries with several supply chain options It also suggests that where logisticshandling fees are charged based on the value of the goods costing studies are required to ensure that the fee is appropriately set and to ensure that adequate resources can be provided to execute the supply chain strategy successfully
31
32
Appendices
Appendix 1 ARV Average Prices for Commodities Procured in 2008 (PipeLine 40 Zambia MSL)
Appendix 2 Sample Facilities by Criteria
Appendix 3 Tier 1 Sample Facilities Supply Chain Costs (US$)
Appendix 4 Lusaka Main District Supply Chain Costs (US$)
Appendix 5 Mpongwe District Supply Chain Costs (US$)
Appendix 6 Ndola District Supply Chain Costs (US$)
Appendix 7 Estimating Total Delivered Costs for Ndola District
Appendix 8 Estimating Total Delivered Costs for Lusaka Main District
Appendix 9 Estimating Total Delivered Costs for Mpongwe District
Appendix 10 Estimating Sample Weighted Average Total Delivered Costs
Appendix 11 List of Data Inputs Required for Estimating the Cost of a Supply Chain
Appendix 12 Contact List
33
34
Appendix 1
ARV Average Prices for Commodities Procured in 2008 (PipeLine 40 Zambia MSL) Name Procurement
size (total for 2008) in units
Procurement Price (for each procurement
Unit Price (average unit price across all procurements in 2008)
Abacavir 10mgml 240ml - $ - na
Abacavir 20mgml 240ml 6062 $ 104330 $ 1721
Abacavir 300mg 60 Tabs 8254 $ 227150 $ 2752
Didanosine 25mg Tabs1 - $ - na
Didanosine 50mg 60 Tabs1 - $ - na
Didanosine 100mg 60 Tabs 10808 $ 83582 $ 773
Efavirenz 200mg 90 Caps 8602 $ 134302 $ 1561
Efavirenz 50mg 30 Caps 18296 $ 48798 $ 267
Efavirenz 600mg 30 Tabs 1014816 $ 12574111 $ 1239
Lamivudine 10mgml 100ml2 94565 $ 211193 $ 223
Lamivudine 10mgml 240ml 94565 $ 211193 $ 223
Lamivudine 150mgml 60 Tabs 34000 $ 209924 $ 617
LamivudineStavudine 15030mg 60 Tabs 355000 $ 2554800 $ 720
LamivudineStavudine 15030mg 30 Tabs3 355000 $ 1277400 $ 360
LamivudineStavudine 40150mg 60 Tabs3 355000 $ 2554800 $ 720
LamivudineStavudineNevirapine 15030200mg 60 Tabs
481011 $ 3364680 $ 700
LamivudineStavudineNevirapine 15040200mg 60 Tabs
22289 $ 167168 $ 750
LamivudineStavudineNevirapine 3065mg 60 Tabs
11919 $ 29320 $ 246
35
Name Procurement size (total for 2008) in units
Procurement Price (for each procurement
Unit Price (average unit price across all procurements in 2008)
LamivudineStavudineNevirapine 6012200mg 60 Tabs
17868 $ 88267 $ 494
LamivudineZidovudine 150300mg 60 Tabs 466746 $ 4517090 $ 968
LopinavirRitonavir 8020mgml 300ml 2636 $ 108340 $ 4110
LopinavirRitonavir 20050mg 120 Tabs 27828 $ 1546832 $ 5559
Nevirapine 10mgml 100ml4 77574 $ 192493 $ 248
Nevirapine 10mgml 240ml 77574 $ 192493 $ 248
Nevirapine 10mgml 25ml4 77574 $ 192493 $ 248
Nevirapine 200mg 60 Tabs 725582 $ 2698518 $ 372
Stavudine 15mg 60 Caps 23184 $ 39040 $ 168
Stavudine 1mgml 200ml 50000 $ 79600 $ 159
Stavudine 20mg 60 Caps 21384 $ 41162 $ 192
Stavudine 30mg Caps5 21384 $ 41162 $ 192
Stavudine 40mg Caps5 21384 $ 41162 $ 192
TenofovirEmtricitabine 300200mg 30 Tabs 787250 $ 17450084 $ 2217
Zidovudine 10mgml 100 ml6 54200 $ 81450 $ 150
Zidovudine 10mgml 240 ml 54200 $ 81450 $ 150
Zidovudine 100mg 100 Caps 17356 $ 110817 $ 638
Zidovudine 300mg 60 Tabs 11700 $ 84240 $ 720
Tenofovir 300mg Tabs7 787250 $ 17450084 $ 2217
Indinavir 400mg Tabs8 27828 $ 1546832 $ 5559 1Not procured during 2008 and none distributed to facilities during 2008 2Lamivudine 10mgml 100ml not procured during 2008 but some quantity was distributed to facilities therefore prices take to be the same as the 240ml presentation 3LamivudineStavudine 15030mg 30 Tabs3 not procured during 2008 but some quantity was distributed to facilities therefore prices take to be the same or directly proportional to the LamivudineStavudine 15030mg 60 Tabs presentation 4Nevirapine 10mgml 100ml not procured during 2008 but some quantity was distributed to facilities therefore prices take to be the same as the 240ml presentation 5Stavudine 30mg Cap not procured during 2008 but some quantity was distributed to facilities therefore prices take to be the same as the 20mg presentation 6Zidovudine 10mgml 100 ml not procured during 2008 but some quantity was distributed to facilities therefore prices take to be the same as the 240ml presentation 7Tenofovir 300mg Tab procured by CHAZ during 2008 and some quantity was distributed to facilities Price taken to be the same as the TenofovirEmtricitabine 300200mg 30 Tabs presentation
8 Indinavir 400mg Tabs not procured during 2008 but some quantity was distributed to facilities therefore prices take to be the same as LopinavirRitonavir 20050mg since Ritonovir also a Protease Inhibitor not available in Zambiarsquos ARV system in a lsquonon-combinationrsquo form
36
Appendix 2
Sample Facilities by Criteria Facility Name Supply Chain Flow Volume Rural
Urban
Drug Procurement Office Ministry of Health MSL ndash DHO MSL ndash NgansaCIDRZ
Both Both
Medical Stores Limited MSL ndash DHO MSL ndash NgansaCIDRZ
Both Both
SCMS USAID | DELIVER PROJECT MSL ndash DHO MSL ndash NgansaCIDRZ
Both Both
CHAZ Church Health Association Zambia CHAZ Both Both
Ngansa Pharmaceuticals Ltd MSL ndash DHO MSL ndash NgansaCIDRZ
Both Both
(CIDRZ) Center for Infectious Disease Research in Zambia
MSL ndash DHO MSL ndash NgansaCIDRZ
Both Both
Lusaka Main DHMT MSL ndash DHO MSL ndash NgansaCIDRZ
High Urban
Kara Clinic Lusaka MSL ndash DHO MSL ndash NgansaCIDRZ
High Urban
Mtendere Health Centre Lusaka Main MSL ndash DHO MSL ndash NgansaCIDRZ
High Urban
Chilenje Lusaka Main MSL ndash DHO MSL ndash NgansaCIDRZ
High Urban
Bauleni Health Centre Lusaka Main MSL ndash DHO MSL ndash NgansaCIDRZ
High Urban
Mpongwe DHMT CHAZ High Rural
Mpongwe Mission Hospital CHAZ High Rural
Mikata Health Centre Mpongwe CHAZ Low Rural
St Theresas Hospital Mpongwe CHAZ High Rural
Ndola DHMT MSL ndash DHO High Urban
Arthur Davison Childrenrsquos Hospital Ndola MSL ndashHospital High Urban
Ndola Central Hospital Ndola MSL ndash Hospital High Urban
Lubotu Health Centre Ndola MSL ndash DHO ndash Health Center Low Rural
Kavu Rural Health Centre Ndola MSL ndash DHO (Health Center picks up)
Low Rural
37
38
Appendix 3
Tier 1 Sample Facilities (US$) Procurement
and Supply Unit Ministry of Health
Medical Stores Limited
CHAZ Churches Health Association Zambia
SCMSDELIVER PROJECT
Total value of commodities passing through
$35318848 $31983921 $2083755 $29758677
Total volume of commodities passing through (m3)
243 1110 74 804
Procurement Costs 173955 NA 104188 2003071
Storage Costs NA 250732 35394 NA
Transport Costs NA 27783 831301 NA
Operating Costs 50000 25041 ND 0
Total Costs 223955 303556 222712 2003071
Cost per $ of annual pass through
6341 949 10688 6731
Cost per m3 of annual pass through
923 273 3002 2492
Procurement Cost per $1000 of ARVs
4925 0 ND 6731
Storage Cost per m3 of annual pass through
NA 226 477 NA
Storage Labor Cost NA 89810 26545 NA
LaborTotal Storage Costs NA 36 75 NA
Cost per m3 transported NA 25 1120 NA
Notes Function costs do not include operating costs NA Not Applicable if facility does not perform that function ND No data or incomplete data available to costing team 1CHAZ were only able to provide limited data on transport costs but nothing on procurement or storage other than the size of their storage facility
39
40
Appendix 4 Lusaka Main District Supply Chain Costs (US$)
(CIDRZ) Center for Infectious Disease Research in Zambia
Ngansa Pharm Ltd
Lusaka Main DHMT
Kara Clinic Lusaka
Mtendere Health Centre Lusaka Main
Chilenje Lusaka Main
Bauleni Health Centre Lusaka Main
Total value of commodities passing through
$13029840 $13029840 $13029840 $498588 $450677 $268909 $214773
Total volume of commodities passing through (m3)
441 441 441 14 14 7 8
Procurement Costs NA NA NA NA NA NA NA
Storage Costs See Ngansa 38577 8646 6316 4124 3608 3143
Transport Costs 37833 See CIDRZ 0 0 0 0 0
Operating Costs 0 13700 0 889 467 248 67
Total Costs 37833 52257 8646 7205 4591 3857 3210
Number of patient ARV prescriptions filled a day
NA NA NA 17003 80-150 80-150 45
Procurement Cost per $1000 of ARVs
NA NA NA NA NA NA NA
Storage Cost per m3 of annual pass through
See Ngansa 87 20 439 299 502 402
Storage Labor Cost See Ngansa 34332 8646 6080 3776 3558 3049
LaborTotal Storage Costs
See Ngansa 89 100 96 92 99 97
Cost per m3 transported 86 0 0 0 0 0 0
Notes Function costs do not include operating costs NA Not Applicable if facility does not perform that function ND No data or incomplete data available to costing team 1Lusaka Main DHO has no storage facilities for ARVs but has staff that perform monitoring activities and support health facilities with ordering activities 2CIDRZ a large organization that provides a very wide range of support to the ARV program performs the transportation function getting ARVs from Ngansa to the Lusaka Main health facilities all CIDRZ costs captured under transport and their operating costs are assumed to be minimal 3 Number of registered patients on ART
41
42
Appendix 5
Mpongwe District Supply Chain Costs (US$)
Mpongwe DHMT
Mpongwe Mission Hospital
Mikata Health Centre
St Theresas Hospital Mpongwe
Total value of commodities passing through
$334786 $107738 $6246 $209237
Total volume of commodities passing through (m3)
11 4 039 8
Procurement Costs 0 0 0 0
Storage Costs NA 2631 976 1114
Transport Costs 0 943 36 839
Operating Costs 0 272 44 646
Total Costs 0 2998 1056 2599
Number of patient ARV prescriptions filled a day
- 25-40 3-5 70-80
Procurement Cost per $1000 of ARVs
0 0 0 0
Storage Cost per m3
of annual pass through NA 604 2530 204
Storage Labor Cost 0 2033 973 980
LaborTotal Storage Costs
NA 77 100 88
Cost per m3
transported 0 22 92 154
Notes Function costs do not include operating costs
NA Not Applicable if facility does not perform that function
ND No data or incomplete data available to costing team 1Mpongwe DHO does not have storage facilities for ARVs The ARVs are delivered directly to the Mpongwe Mission hospital where a pharmaceutical technician manages them 2The Mpongwe DHO Officer provided costs for the transportation activities performed by the DHO However there was no distribution schedule available At the Mpongwe Mission Hospital the costing team was informed that health facilities pick up their supplies from the hospital (hence the costs observed at Mikata) and if there is a vehicle available they may be taken back to their facility by a DHO vehicle The costing team is there unable to determine costs since this activity is random and unrecorded 3These costs are related to the faxing of supply vouchers to the LMU of SCMS monthly
43
44
Appendix 6
Ndola District Supply Chain Costing Statistics Ndola DHMT Arthur
Davison Childrens Hospital Ndola
Ndola Central Hospital Ndola
Lubuto Health Centre Ndola
Kavu Rural Health Centre Ndola
Total value of commodities passing through
$1472899 $151222 $943578 $639993 $58184
Total volume of commodities passing through (m3)
45 8 27 20 2
Procurement Costs NA NA NA NA NA
Storage Costs 4176 4526 11141 3150 4164
Transport Costs 3521 NA NA 0 315
Operating Costs 2668 3994 7810 44 46
Total Costs 10365 8520 18951 3194 4522
Cost per $ of annual pass through
070 557 197 047 777
Cost per m3 of annual pass through
228 1000 696 153 2207
Number of patient ARV prescriptions filled a day
NA 40-50 150-200 80-90 30-35
Procurement Cost per $1000 of ARVs
000 000 000 000 000
Storage Cost per m3 of annual pass through
92 537 416 158 2032
Storage Labor Cost 4071 4367 10585 2893 4158
LaborTotal Storage Costs 97 96 95 92 100
Cost per m3 transported 78 0 0 0 154 Notes NA Not Applicable if facility does not perform that function
ND No data or incomplete data available to costing team
45
46
Appendix 7
Estimating Total Delivered Costs ndash Ndola District Procurement Unit SCMS Total
Value of Commodity Volume of Commodity Procurement costs Operating Costs Total
3531884 $ 243
173955$ 50000$
223955$
per $1000
4925$ 1416$ 6341$
29758677 $ 804
200307149 $ $
2003071 $
per $1000
6731$ $
6731$
33290561 $ 1047
2177026 $ $
2227026 $
per $1000
6539$ 150$
6690$
Tier 1 MSL Value of Commodity $ 31983921 Volume of Commodity 1110 Logistics Costs per $1000 Storage $ 250732 $ 784 Inventory $ - $ -Transport $ 27783 $ 087 Operating $ 25041 $ 078 Total $ 303556 $ 949
Tier 2 Ndola DHMT Value of Commodity $ 1472899 Volume of Commodity 4517 Logistics Costs per $1000 Storage $ 4176 $ 284 Inventory $ - $ -Transport $ 3521 $ 239 Operating $ 2668 $ 181 Total $ 10365 $ 704
Tier 3 Lubuto HC Kavu Rural HC Ndola Central Hospital Arthur Davison Value of Commodity $ 639993 $ 58184 $943578 $151222 Volume of Commodity 20 2 27 8 Logistics Costs per $1000 per $1000 per $1000 per $1000 Storage $ 3150 $ 492 $ 4161 $ 7151 $ 11141 $ 001 $ 4526 $ 003 Inventory $ - $ - $ - $ - $ - $ - $ - $ -Transport $ - $ - $ 315 $ 541 $ - $ - $ - $ -Operating $ 44 $ 007 $ 46 $ 079 $ 7810 $ 001 $ 3994 $ 003 Total $ 3194 $ 499 $ 4522 $ 7772 $ 1895100 $ 002 $ 8520 $ 006
SDP Lubuto HC Kavu Rural HC Ndola Central Hospital Arthur Davison Delivered Cost by Function Procurement Costs Logistics Costs Storage Inventory Transport Operating Total
76
18 0 4 3
100 Value
per $1000 6690$
1560$ -$
326$ 266$
8842$ 88
42
51 0 5 2
100 Value
per $1000 6690$
8219$ -$
867$ 338$
16114$ 161
88
10 0 1 1
100 Value
per $1000 6690$
785$ -$
087$ 079$
7641$ 76
88
10 0 1 1
100 Value
per $1000 6690$
787$ -$
087$ 081$
7644$ 76
47
48
Appendix 8
Estimating Total Delivered Costs ndash Lusaka Main District
Procurement Unit SCMS Total
Value of Commodity Volume of Commodity Procurement costs Operating Costs Total
3531884 $ 243
173955$ 50000$
223955$
per $1000
4925$ 1416$ 6341$
29758677 $ 804
$ 200307149 $
2003071 $
per $1000
6731$ 441$
7172$
$ 33290561 1047
2177026 $ 50000$
2227026 $
per $1000
6539$ 150$
6690$
Tier 1 MSL Value of Commodity $ 31983921 Volume of Commodity 1110 Logistics Costs per $1000 Storage $ 250732 $ 784 Inventory $ - $ -Transport $ 27783 $ 087 Operating $ 25041 $ 078 Total $ 303556 $ 949
Tier 2 Value of Commodity Volume of Commodity Logistics Costs Storage Inventory Transport Operating Total
Lusaka MainNgansaCIDRZ $ 13029840
441 per $1000
$ 52257 $ 401 $ - $ -$ 37833 $ 290 $ 13700 $ 105
$ 797$ 103790
Tier 3 Kara Clinic Chilenje Rural HC Mtendere Clinic Bauleni Rural HC Value of Commodity $ 498588 $ 268909 $ 450677 $ 214773 Volume of Commodity 14 7 14 7 Logistics Costs per $1000 per $1000 per $1000 per $1000 Storage $ 6316 $ 1267 $ 3608 $ 1342 $ 4124 $ 915 $ 3143 $ 1169 Inventory $ - $ - $ - $ - $ - $ - $ - $ -Transport $ - $ - $ - $ - $ - $ - $ - $ -Operating $ 889 $ 178 $ 248 $ 092 $ 467 $ 104 $ 67 $ 025 Total $ 7205 $ 1445 $ 3856 $ 1434 $ 4591 $ 1019 $ 3210 $ 1194
SDP Kara Clinic Chilenje Rural HC Mtendere Clinic Bauleni Rural HC Delivered Cost by Function Procurement Costs Logistics Costs Storage Inventory Transport Operating Total
68
25 0 4 4
100 Value
per $1000 6690$
2413$ -$
377 $ 362 $
9842$ 98
68
25 0 4 3
100 Value
per $1000 6690$
2488$ -$
377$ 276$
9830$ 98
71
22 0 4 3
100 Value
per $1000 6690$
2061$ -$
377$ 287$
9415$ 94
68
26 0 4 2
100 Value
per $1000 6690$
2610$ -$
377$ 215$
9891$ 99
49
50
Appendix 9 Estimating Total Delivered Costs ndash Mpongwe Main District Value of Commodity Volume of Commodity Procurement costs Operating Costs Total
Tier 1 Value of Commodity Volume of CommodityLogistics Costs Storage Inventory Transport Operating Total
Tier 2 Value of Commodity Volume of Commodity Logistics Costs Storage Inventory Transport Operating Total
Tier 3 Value of Commodity Volume of Commodity Logistics Costs Storage Inventory Transport Operating Total
SDP Delivered Cost by Function Procurement Costs Logistics Costs Storage Inventory Transport Operating Total
CHAZ per $1000
2083755 $ 74
104188$ 50$ -$
104188$ 50$
CHAZ 2083755 $
35394$ 17$ -$ 0
83130$ 40$ -$ 0
118524$ 57$
Mpongwe DHMTMpongwe Mission Hospital 334786$
11 per $1000
2631$ 001$ -$ -$ 94 $ 000$
272$ 000$ 2997$ 001$
St Theresas Mikata Health Centre 209237 6246$
5 039 per $1000 per $1000
1114$ 001$ 976$ 016$ -$ -$ -$ -$ 839$ 000$ 36$ 001$ 646$ 000$ 44$ 001$
2599$ 001$ 1056 017$
St Theresas Mikata Health Centre per $1000 per $1000
56 5000$ 47 5000$
001 00053$ 16 1715$ 000 -$ 0 -$
4438 398983$ 37 3990$ 000 00031$ 0 001$ 100 8991$ 100 10706$
Value 90 Value 107
51
52
Appendix 10
Estimating Total Delivered Costs ndash Weighted Average Calculations
Sample weighted average (SWA) by value
SWA for procurement costs
SWA for storage costs
SWA for transport costs
SWA for operation costs
SWA for Total Delivered Cost as a of Total Delivered Value of Commodities
Lubuto HC
19
14
3
1
164
Kavu Rural HC
2
1
1
0
027
Ndola Central Hospital
27
24
3
0
209
Arthur Davison
4
4
0
0
034
(cont) Kara Clinic Chilenje Rural HC Mtendere Clinic Bauleni Rural HC Mikata HC AVERAGE (TOTAL)
SWA by value 14 8 13 6 0 (100)
SWA for procurement costs 10 5 9 4 0 75
SWA for storage costs 3 2 3 2 0 17
SWA for transport costs 1 0 1 0 0 6
SWA for operation costs 2
SWA for Total Delivered Cost as a of Total Delivered Value of Commodities
143 077 123 062 002 896
Note CHAZ facilities not included due to the lack of available data on procurement costs
53
54
Appendix 11
USAID | DELIVER PROJECT Supply Chain Costing Tool Pilot List of Data inputs required for estimating the Cost of a Supply Chain
TC Total Cost All costs assumed to be annual
SC Supply Chain
Information Systems At present it is assumed that these costs will fall under labor costs under the procurement function rather than as a separate category This assumption may be re-assessed after the pilot exercise so placeholders are included at the end of the table
Quality Assurance At present it is assumed that these costs will fall under laborsupervisory costs under each of the procurement storage and transport categories rather than as a separate category This assumption may be re-assessed after the pilot exercise so placeholders are included at the end of the table
LOE Level of effort (as ) spent on HIV SC-related activities
55
Output Metric Notes User Input Metrics
Total Cost of Supply Chain TC Procurement +TC Storage +TC Transportation
(See above regarding information systems and quality assurance)
This is how the costs will be aggregated to obtain the total cost of procurementstoragetransportation at each tier of the system
Labor costs+ Non labor-operating costs + Capital costs + Other
TC Procurement
Labor cost Labor costs should be obtained from a standard civil service salary scale This way only the grade and LOE needs to be collected from each facility rather than having to include questions on salary
Personnel Types
Personnel Salary
Personnel Level of Effort spent on SC-related procurement activities ()
Personnel Benefits
Annual training expenditures related to SC procurement activities
Non-labor operating cost It is anticipated that these expenditures are available at the facility level Eg Average or annual expenditure on telephone calls Cost of space may be a capital cost if the value of the space is to be captured using the value of equivalent landbuilding rather than an equivalent rent
Telephones
Postage
Courier
Printing
Security
Supplies
Utilities
Costrent equivalent per sq feet per annum Area in sq feet allocated to procurement offices
Commodity Value If complete commodity data are available from the MSLPSU then it may not be necessary to collect them at the facility level unless there is reason to believe that the figures differ and there are costs associated eg wastage damage loss etc
Commodity Name
Commodity Quantity Procured
Unit price at which commodity X is procured
Custom Fees Commodity Prices
Custom rates (It may be that a single rate is used for all commodities and so this would simplify to a single percentage)
Taxes Commodity Prices
56
Output Metric Notes User Input Metrics
Insurance If applicable
Tax rate if applicable
Freight Fees Freight Rates if applicable
Commodity Prices
Freight rate specifically the rate charged for commodities up to the point of entry into the country only Rates may be based on price or volume
TC Storage
Labor Labor costs should be obtained from a standard civil service salary scale This way only the grade and LOE needs to be collected from each facility rather than having to include questions on salary
Personnel Types
Personnel Salary
Personnel LOE spent on SC-related storage activities ()
Personnel Benefits
Annual training expenditures
Non-labor operating cost It is anticipated that these expenditures are available at the facility level Eg Average or annual expenditure on telephone calls These non-costs do not include any capital costs which are captured in other sections
Telephones
Postage
Courier
Printing
Security
Supplies
Utilities
Fuel
Costrent equivalent per sq feet per annum Area in sq feet allocated to office space for storage-related personnel
Other expenses
Handling This equipment will count as capital costs For each of these items the quantity age and cost of the equipment will be collected and the depreciation calculated
Forklifts
Hand pallet trucks
Carts
Wheelbarrows
2-wheeler
Other
57
Output Metric Notes User Input Metrics
ShelvesRacks
Refrigerators
Cold room
Safevaults
Other
Supplies
Space Square meterage of storage space
Length (meters)
Breadth (pacesmetersfeet)
Value per square meter if no rent or payments currently made on the space then use rent of equivalent space in equivalent location
Percentage of space used for SC storage purposes and that is paid for out of the SC budget
TC Transportation
Note Specific maintenance costs to be estimated under operating costs and labor costs ie costs will be counted under rent and mechanic salaries and so on therefore there is no row for maintenance
Labor Labor costs should be obtained from a standard civil service salary scale This way only the grade and LOE needs to be collected from each facility rather than having to include questions on salary
Personnel Types
Personnel Salary
Personnel LOE
Personnel Benefits
Annual training
Non-labor operating cost It is anticipated that these expenditures are available at the facility level Eg Average or annual expenditure on telephone calls
Telephones
Fuel
Costrent equivalent per sq feet per annum Area in sq feet allocated to office space for storage-related personnel
Other expenses
Vehicles For each of these items the quantity age and cost of the equipment will be collected and the depreciation calculated
Vehicle Types
Vehicle Cost
Percent of time vehicle is used for SC transport purposes
58
Output Metric Notes User Input Metrics
Information Systems
Labor Labor costs should be obtained from a standard civil Personnel Types service salary scale This way only the grade and LOE Personnel Salary needs to be collected from each facility rather than having to include questions on salary Personnel LOE spent on SC-related storage activities ()
Personnel Benefits
Annual training expenditures
Quality Assurance
Labor Labor costs should be obtained from a standard civil service salary scale This way only the grade and LOE needs to be collected from each facility rather than having to include questions on salary
Personnel Types
Personnel Salary
Personnel LOE spent on SC-related storage activities ()
Personnel Benefits
Annual training expenditures
59
60
Appendix 12
Contact List Contact Title Organization
Albert Lupupa Chief Purchasing and Supplies Officer
Drug Procurement Office Ministry of Health
Tom Brown Director of Logistics Medical Stores Limited
Mulenga Muleba Deputy Country Manager Crown Agents - Zambia
Edward Kabwe Director of Finance and Administration
Medical Stores Limited
Abel Phiri Transport Manager Medical Stores Limited
Kwasi Torpey Director Technical Support ZPCT
Gail Bryant Senior Advisor Pharmaceutical Management
ZPCT
Yebo Gondwe ZPCT
Lona Mwenda Program Officer ZPCT
Kelly McCoy Project Manager CIHDZ
Joshua Kasimba CIHDZ
Chipupu Kandeke Manager Pharmaceutical Services CHAZ Church Health Association Zambia (CHAZ)
Shadreck Malupenga Logistics CHAZ Christian Health Association Zambia
Osward A Nyenda Manager Operations Ngansa Pharmaceuticals Ltd
Bjorn von Hofsten Director Pharmacist Ngansa Pharmaceuticals Ltd
Maxwell Kasonde Morgan Phiri District Pharmacy Programme Coordinators
Lusaka Main DHMT
Jack Menke Program Manager Kara Clinic Lusaka
Mrs Chileshe In-charge ARV Pharm Technician Mtendere Health Centre Lusaka Main
Happy Chiporu Mosia Muhango In-charge ARV Pharm Technician Chilenge Lusaka Main
Mrs Mtonge Lisa Siame In-charge ARV Pharm Technician Bauleni Health Centre Lusaka Main
Dr Isaac Banda Director Mpongwe DHMT
Gladys Mpagwe ARV Pharm Technician Mpongwe Mission Hospital
Florida Mumba Esther Zimba In-charge ARV Pharm Technician Mikata Health Centre
Sister Chanshi Director ARV Pharm Technician St Theresas Hospital
Mercy ZPCT Ndola
61
Contact Title Organization
Lilian Nyerbwa Manager Planning Ndola DHMT
James Simulwke Pharmacist Ndola DHMT
Chiryimba Musonda Pharmacist Technician Ndola DHMT
Ignatius Chikoti Assistant Accountant Ndola DHMT
Matthew Mwute Hanzooma Hatwiko
Head of Pharmacy Dispensing ARV Pharmacist
Arthur Davidson Childrenrsquos Hospital Ndola
Dr Dande Malawo Dr Masase Mwape Kunda Royd Ngoma
Executive Director Clinical Director Dispensing ARV Pharmacist Store Pharmacist
Ndola Central Mission Hospital
Mrs Mwambi Nurse In-Charge Lubutu Health Centre Ndola
Sister Elizabeth Njovu Nurse In-Charge Kavu Rural Health Centre Ndola
Deborah Connor Country Director EGPAF
Mbaweni Mwanza Deputy Director Finance and Administration
SCMS and USAID | DELIVER PROJECT
Peter Lisulo Senior Public Health Logistics Officer
SCMS and USAID | DELIVER PROJECT
Walter Proper Country Director SCMS and USAID | DELIVER PROJECT
Wendy Nicodemus Senior Technical Advisor SCMS and USAID | DELIVER PROJECT
Paul Kamuna Public Health Logistics Officer SCMS and USAID | DELIVER PROJECT
David Papworth Deputy Country Director SCMS and USAID | DELIVER PROJECT
62
For more information please visit deliverjsicom
USAID | DELIVER PROJECT
John Snow Inc
1616 Fort Myer Drive 11th Floor
Arlington VA 22209 USA
Phone 703-528-7474
Fax 703-528-7480
Email askdeliverjsicom
Internet deliverjsicom
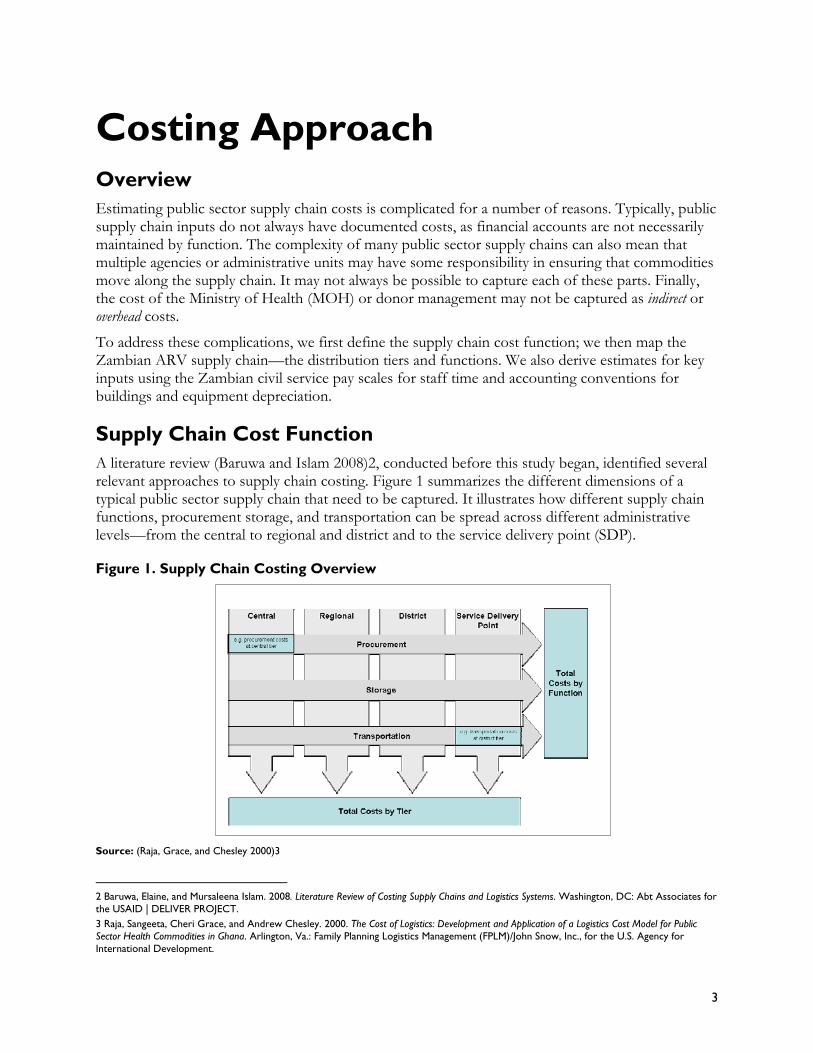
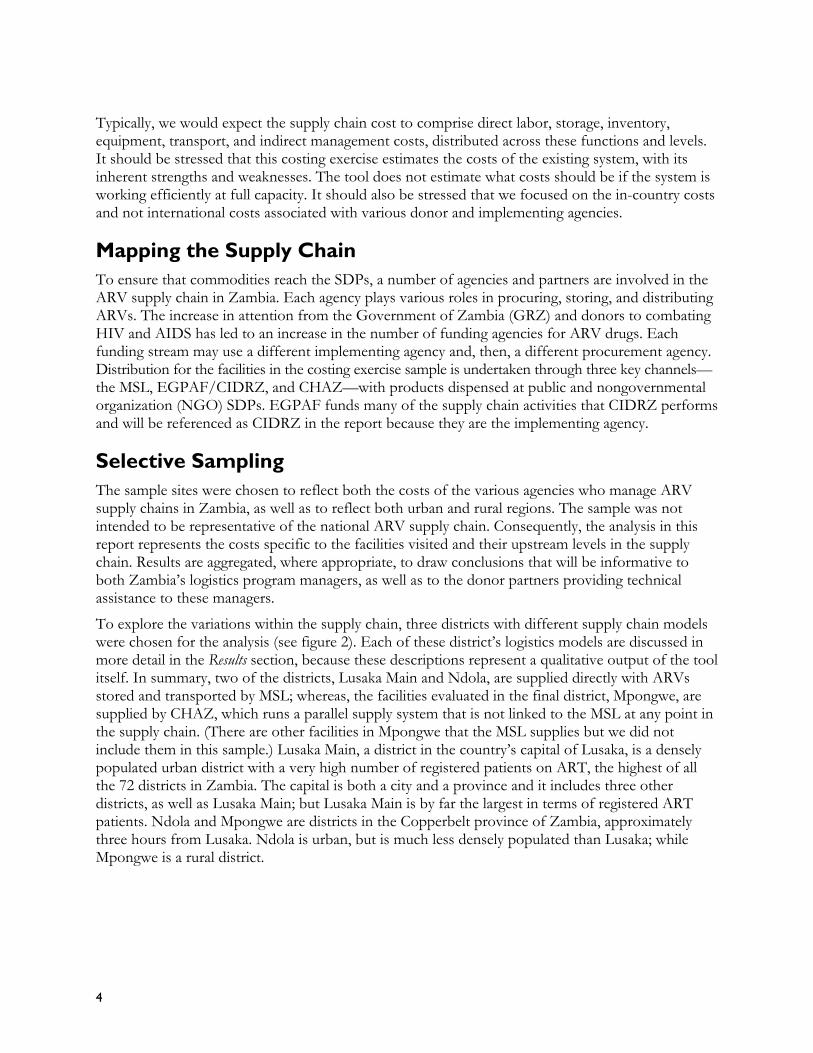
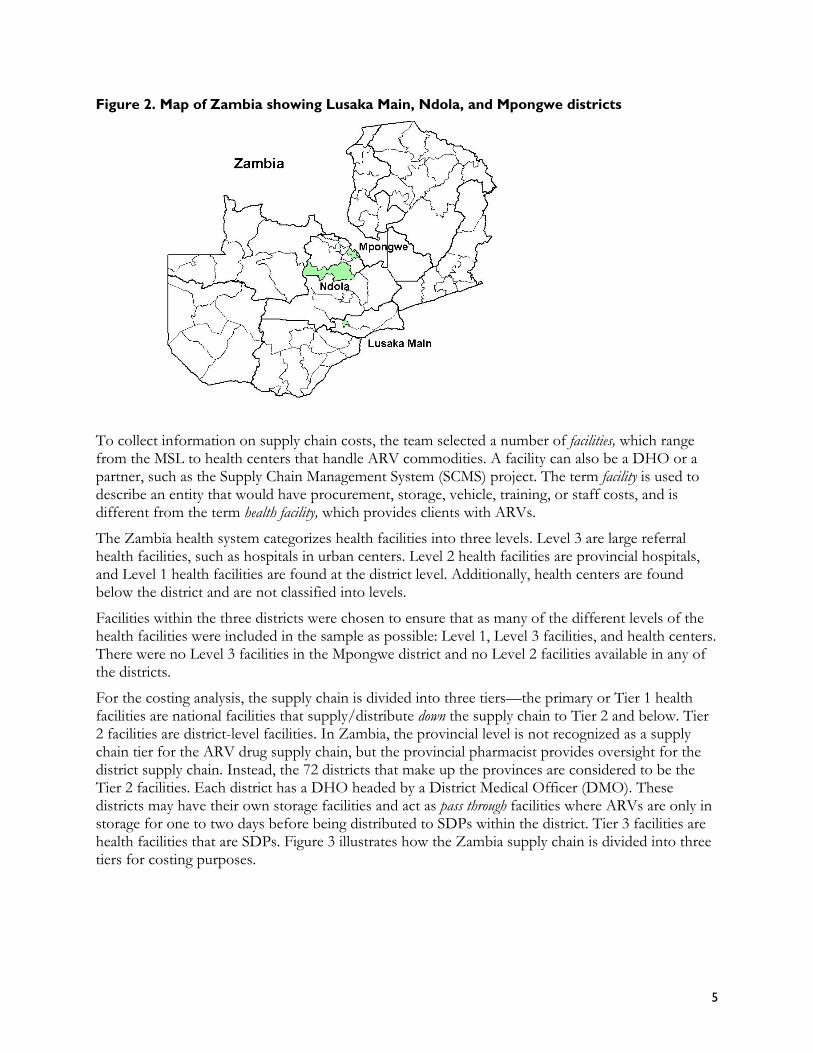
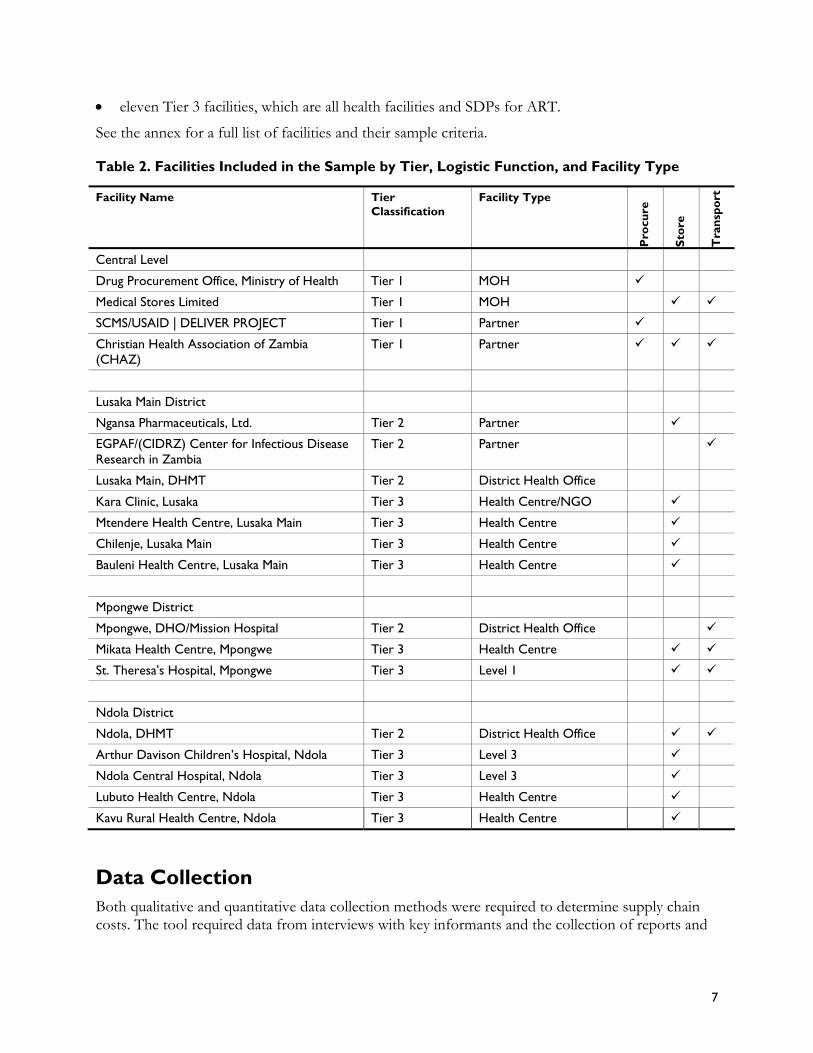
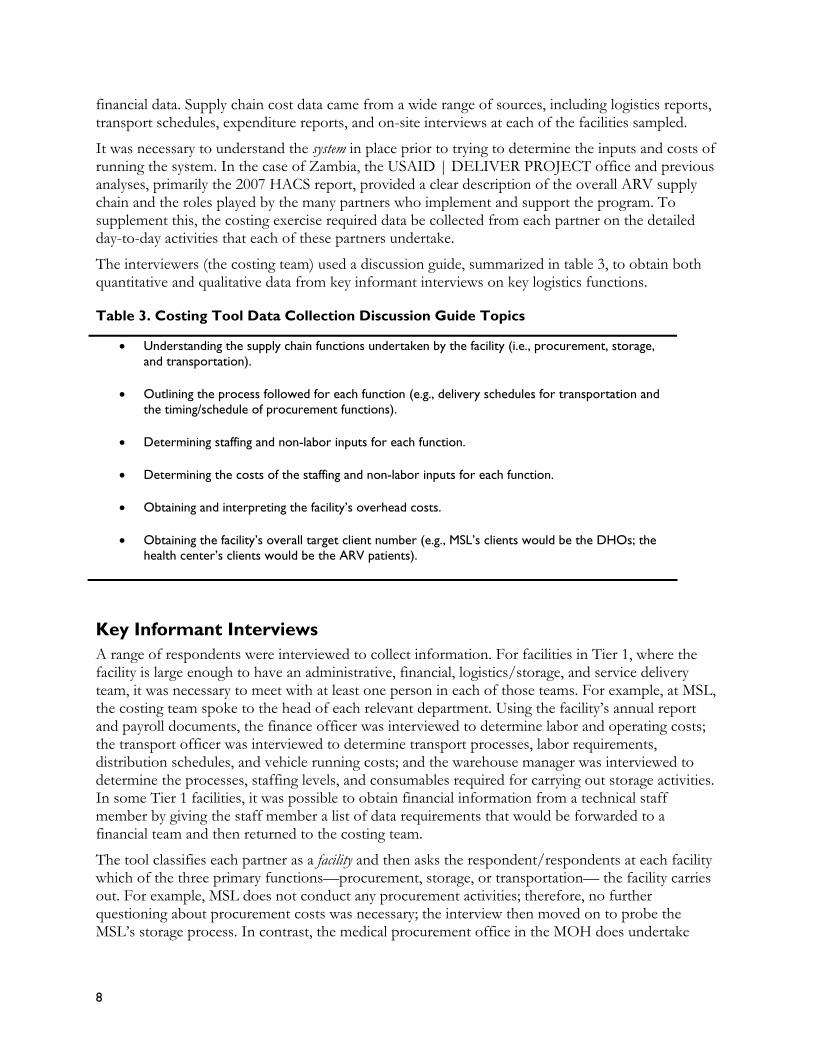
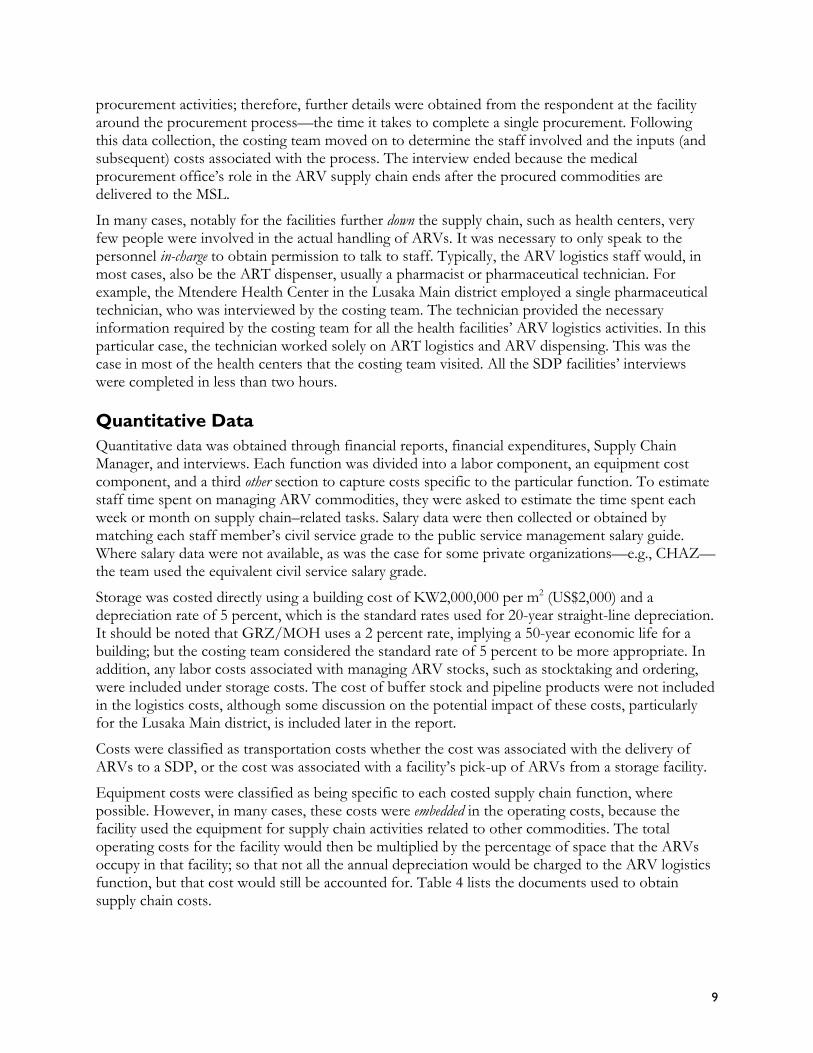
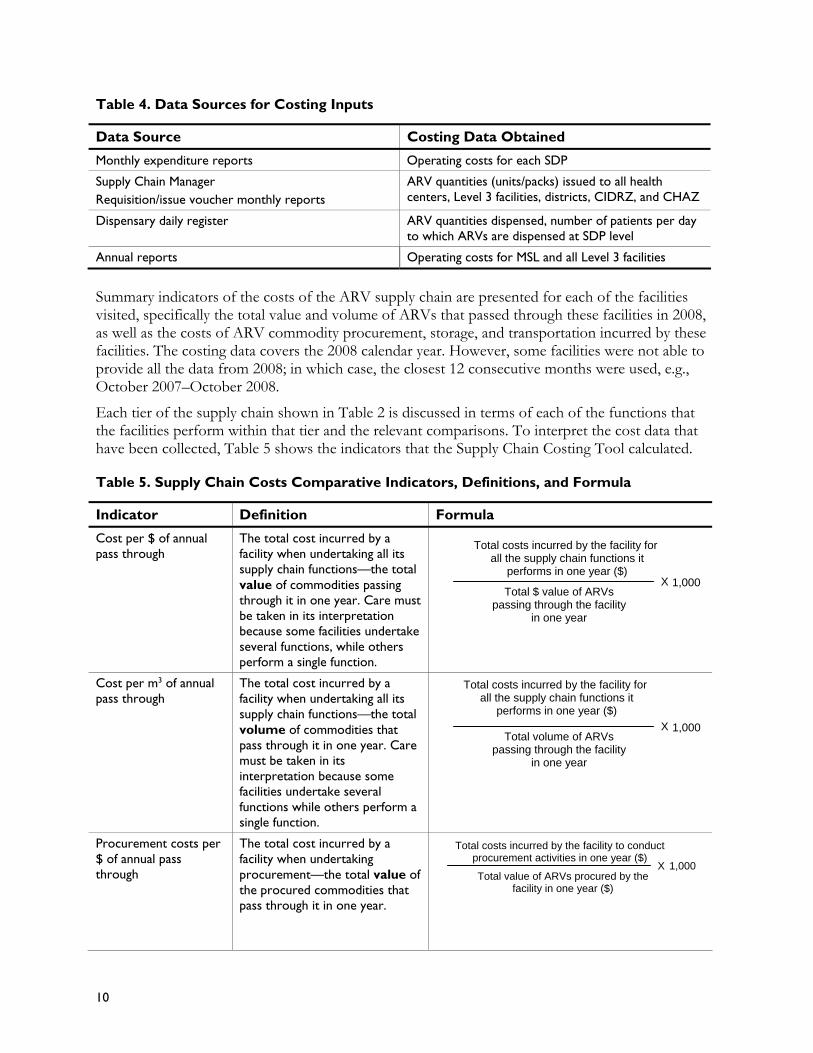
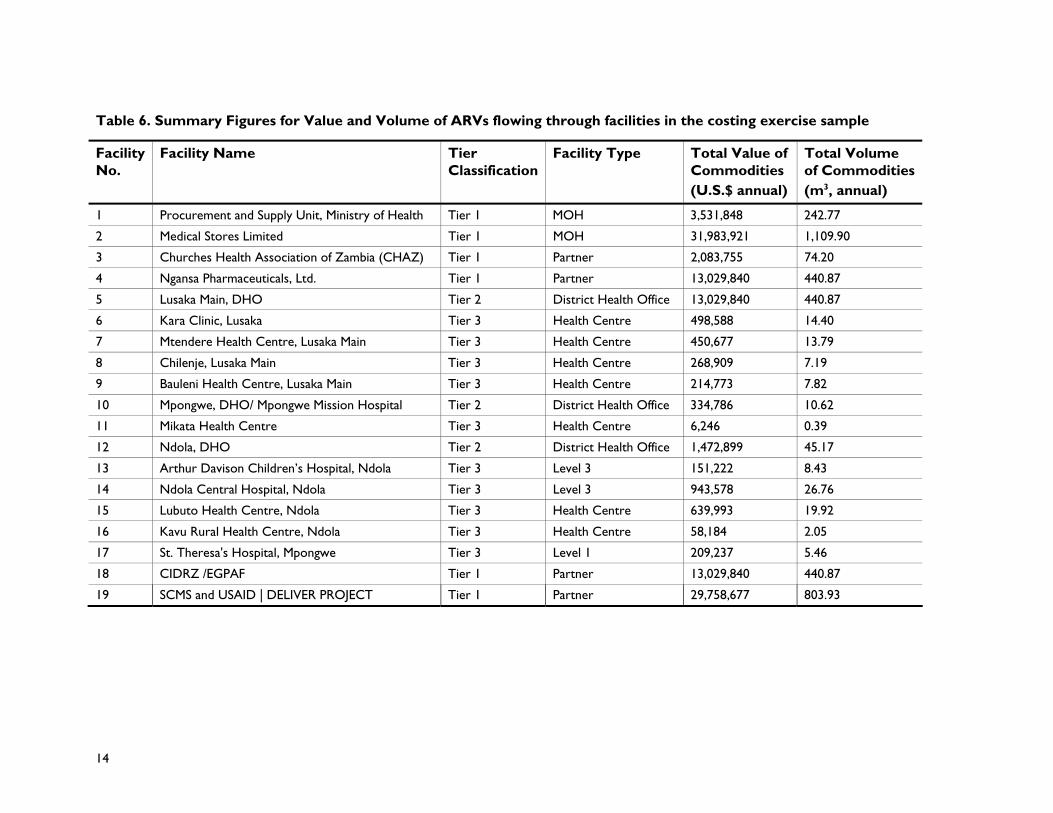
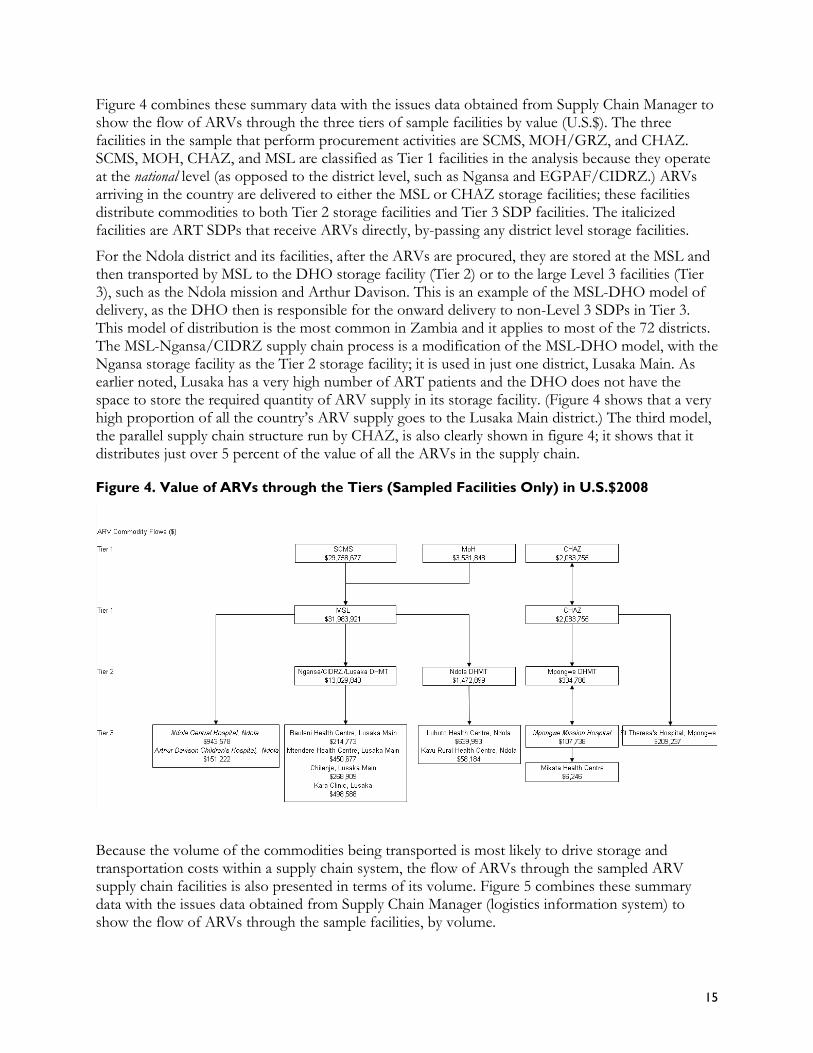
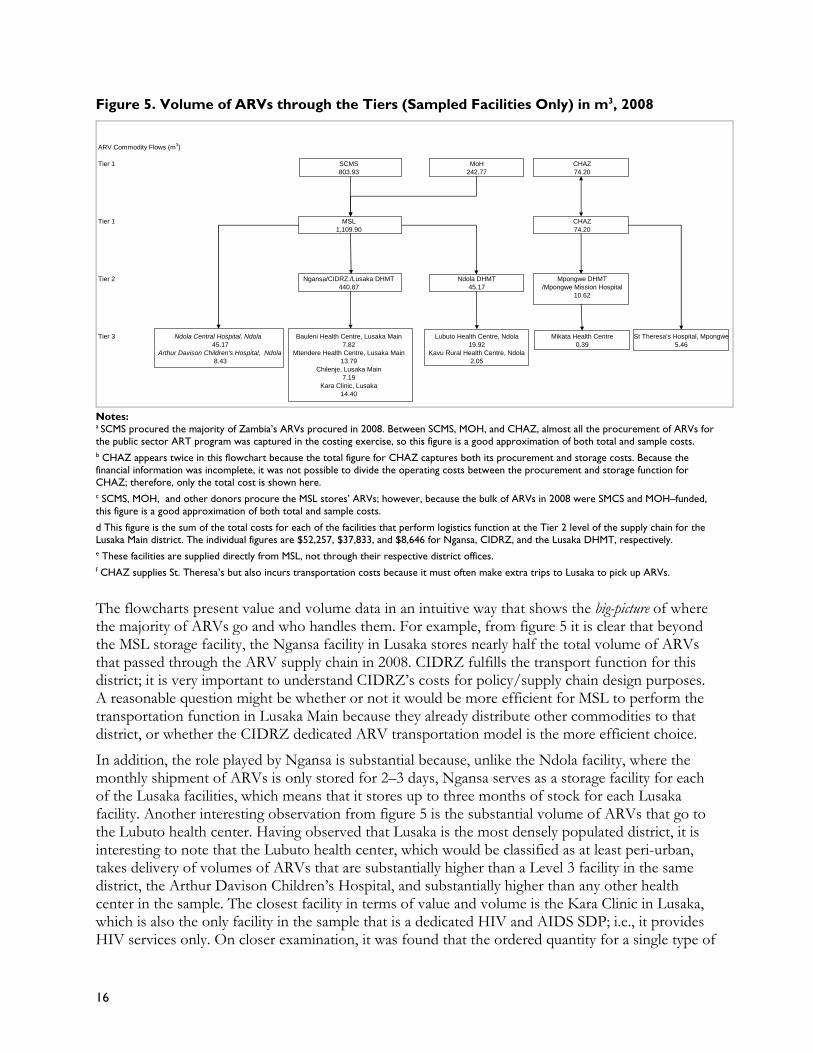
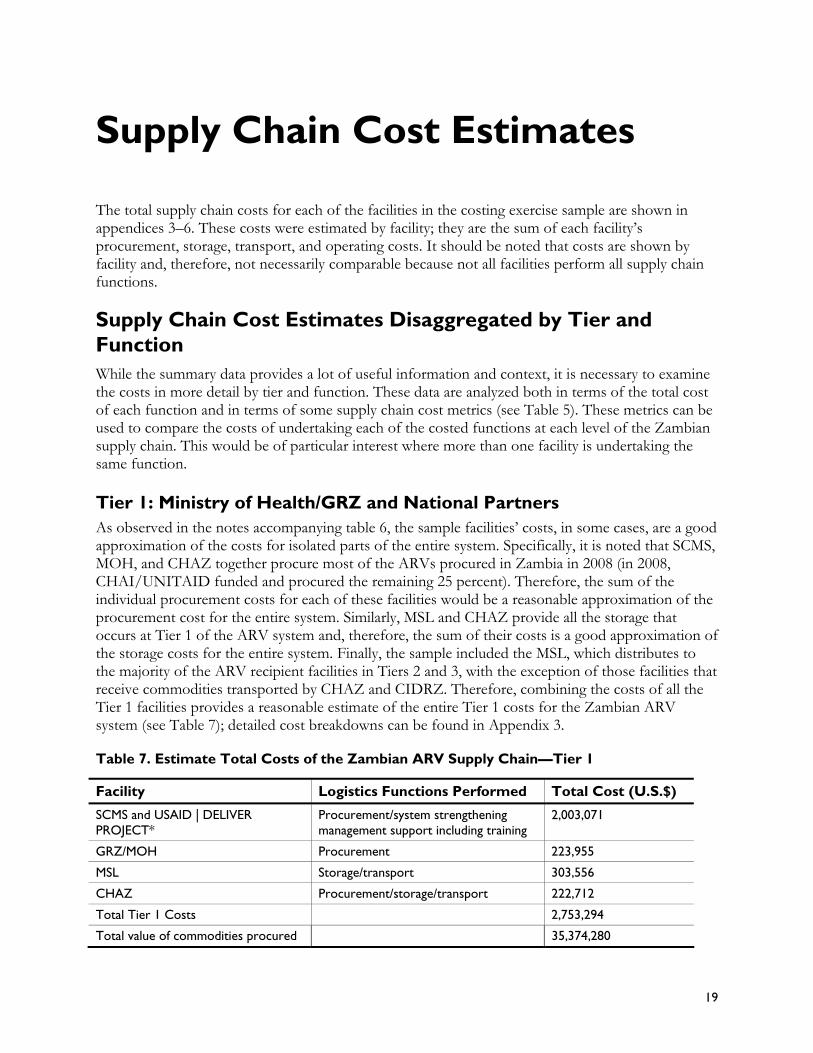
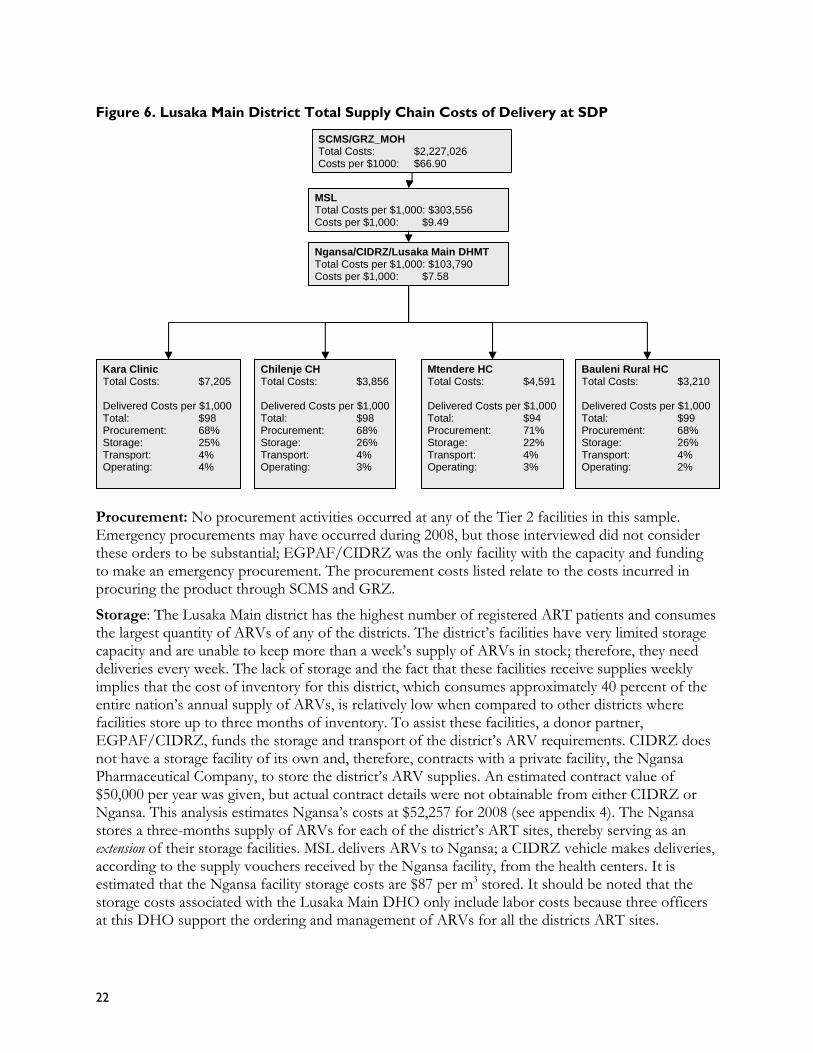
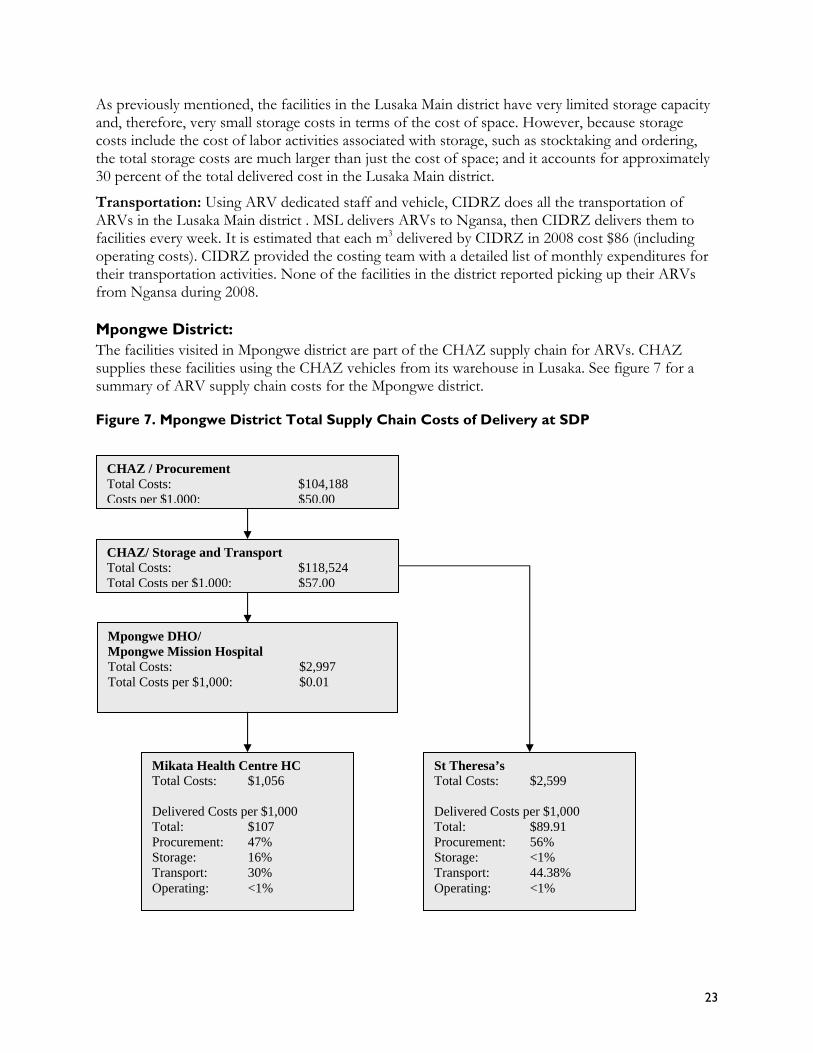
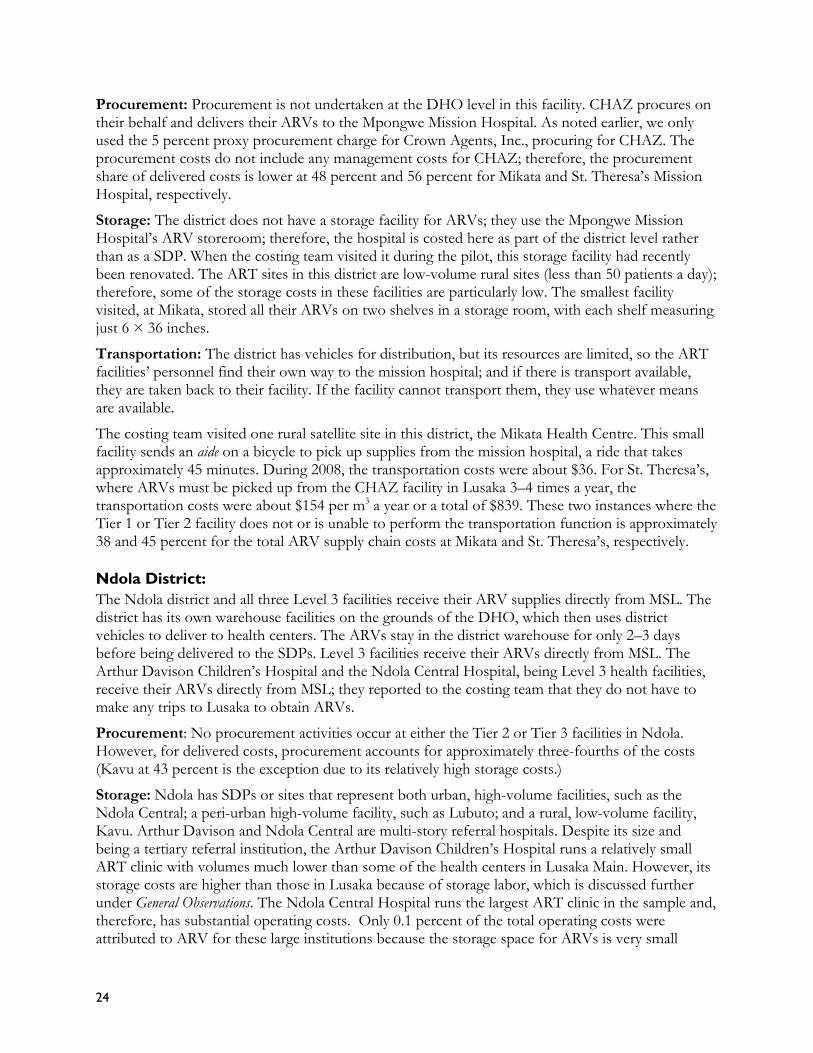
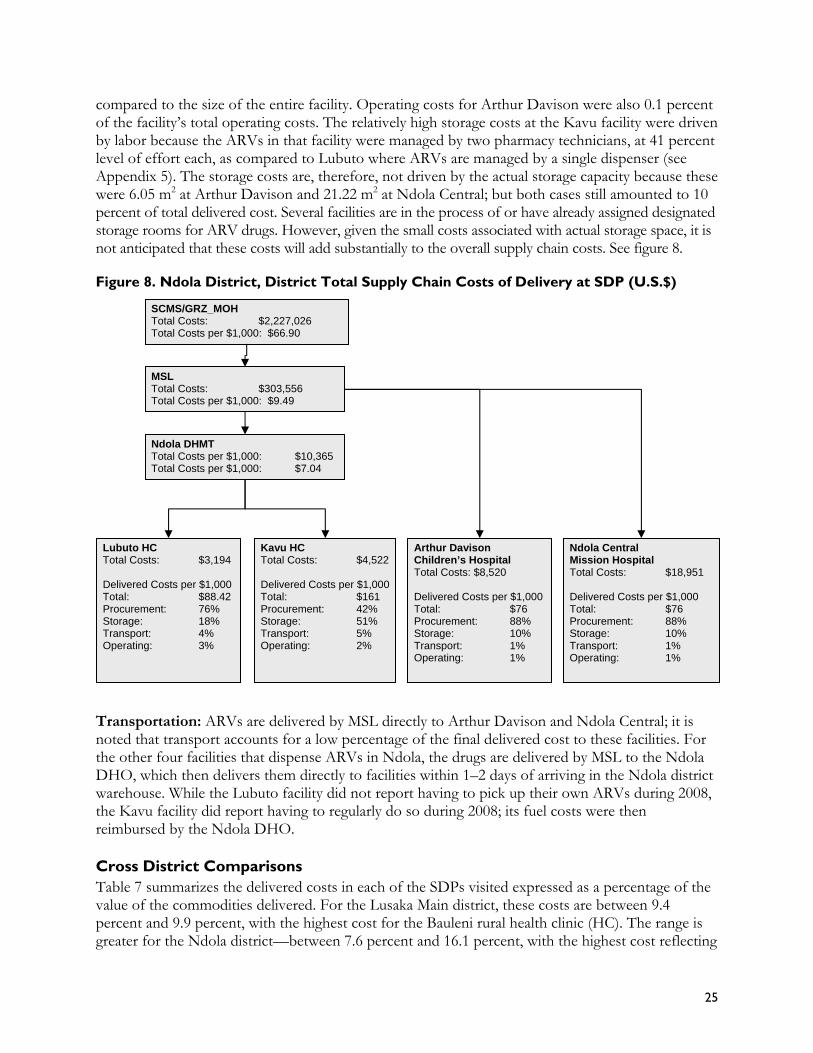
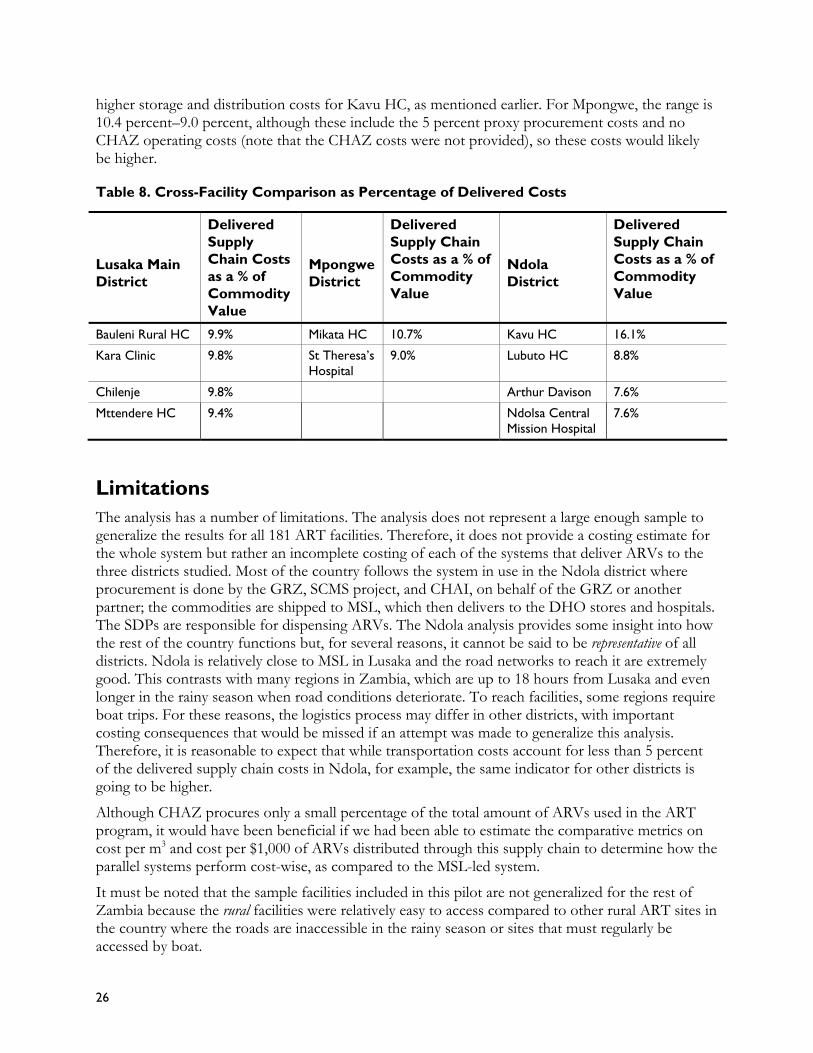
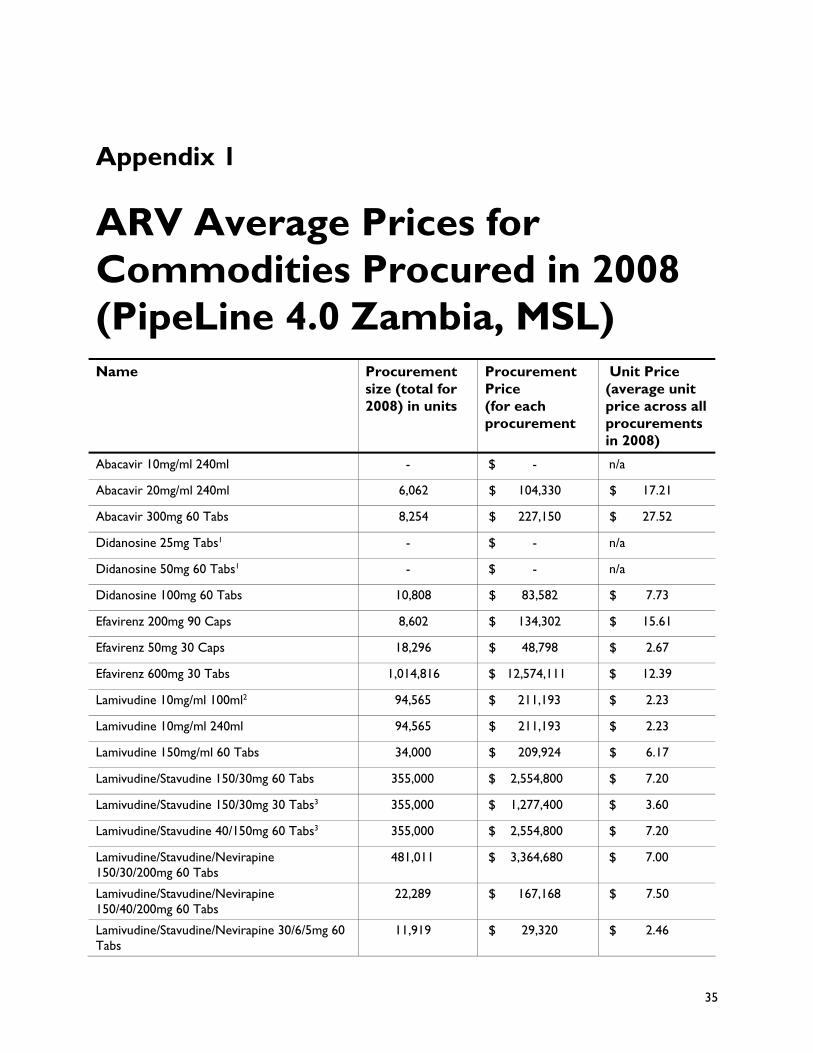
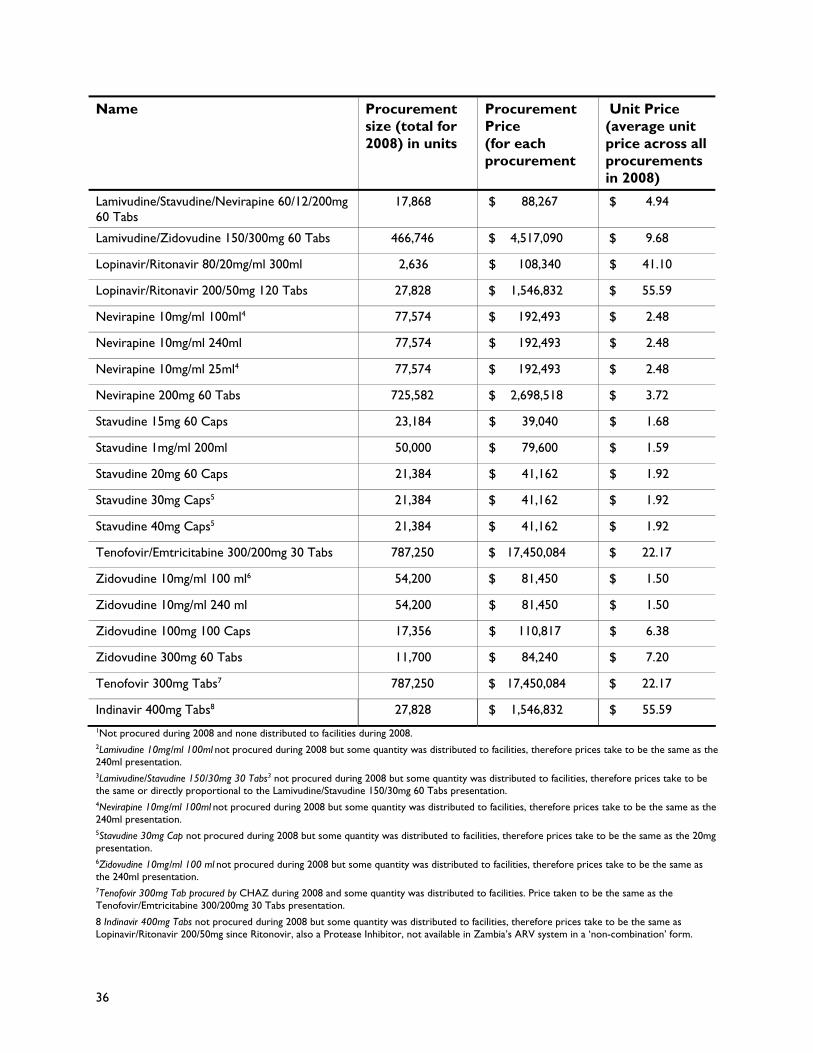
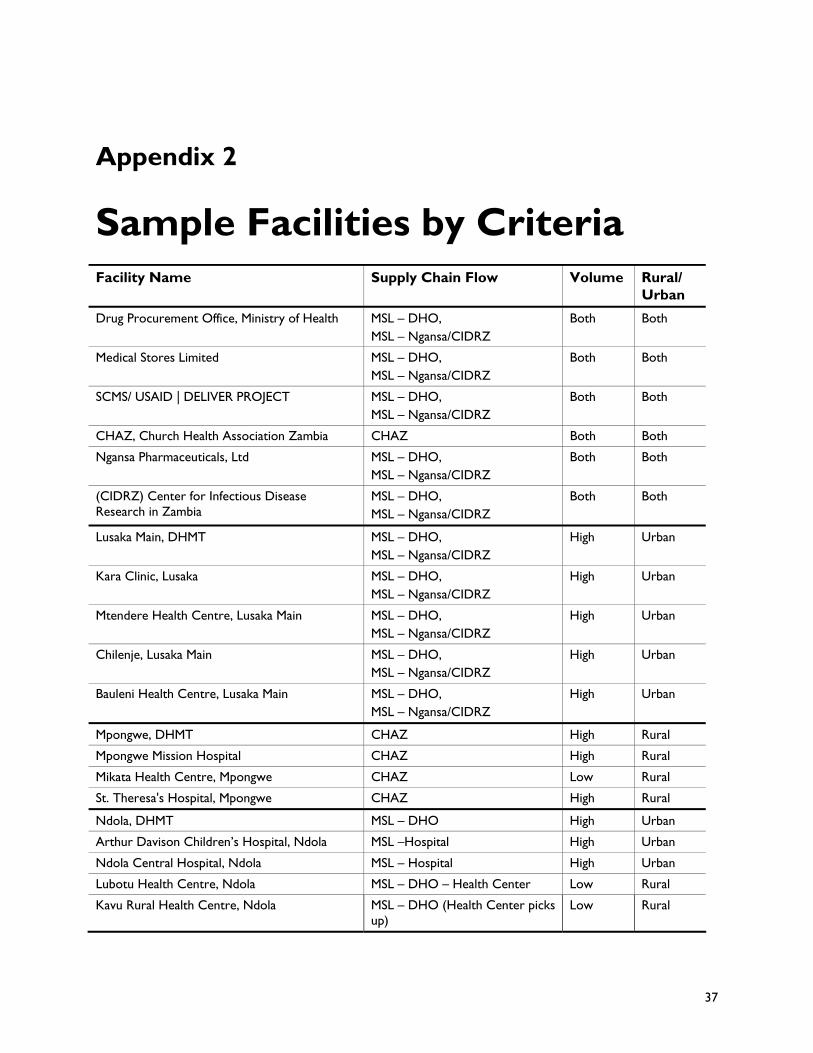
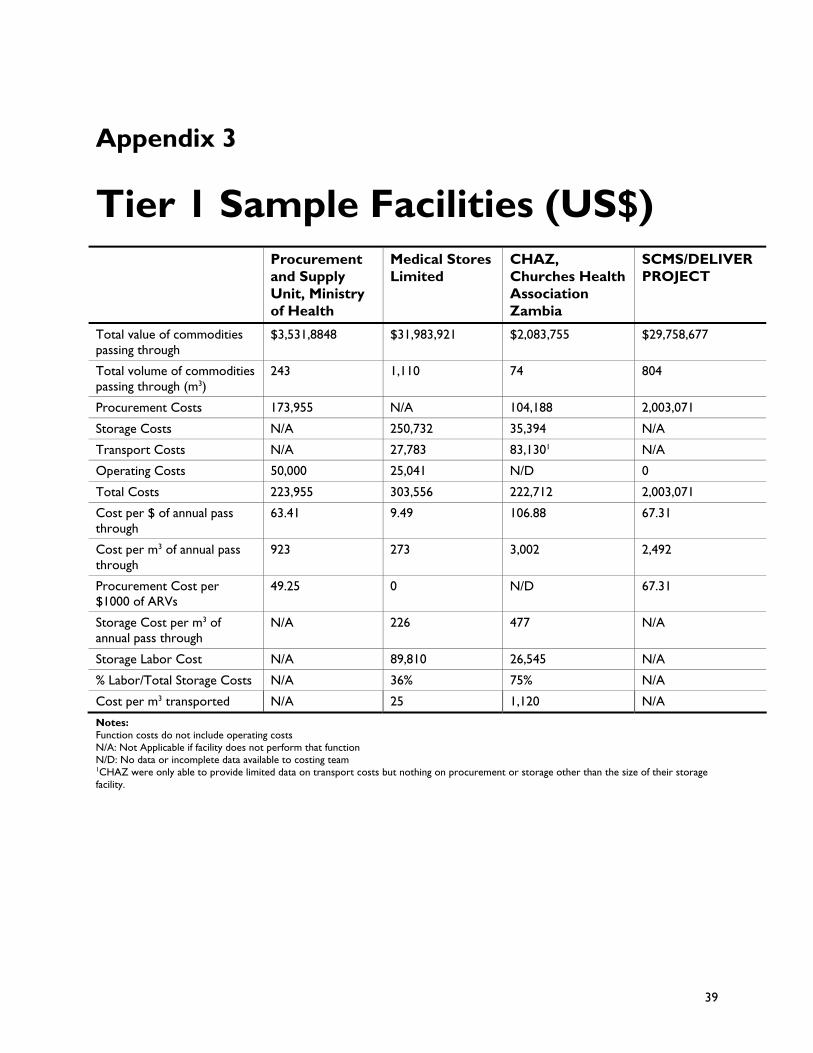
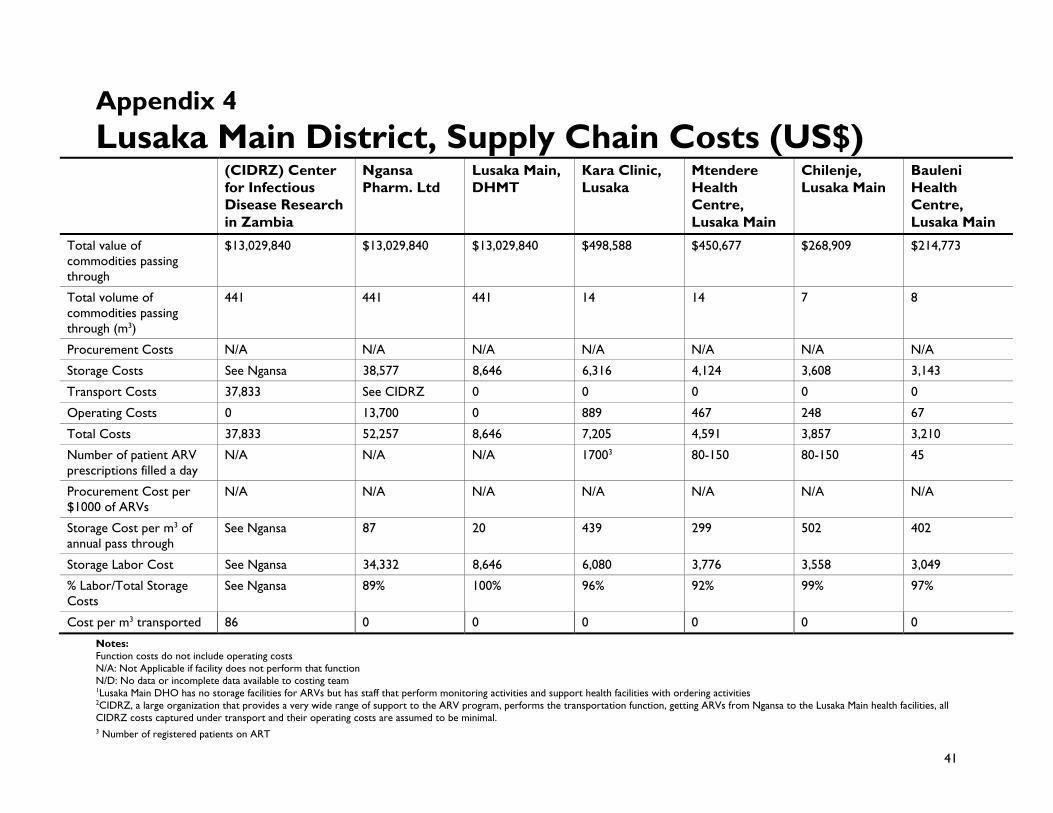
42
Appendix 5
Mpongwe District Supply Chain Costs (US$)
Mpongwe DHMT
Mpongwe Mission Hospital
Mikata Health Centre
St Theresas Hospital Mpongwe
Total value of commodities passing through
$334786 $107738 $6246 $209237
Total volume of commodities passing through (m3)
11 4 039 8
Procurement Costs 0 0 0 0
Storage Costs NA 2631 976 1114
Transport Costs 0 943 36 839
Operating Costs 0 272 44 646
Total Costs 0 2998 1056 2599
Number of patient ARV prescriptions filled a day
- 25-40 3-5 70-80
Procurement Cost per $1000 of ARVs
0 0 0 0
Storage Cost per m3
of annual pass through NA 604 2530 204
Storage Labor Cost 0 2033 973 980
LaborTotal Storage Costs
NA 77 100 88
Cost per m3
transported 0 22 92 154
Notes Function costs do not include operating costs
NA Not Applicable if facility does not perform that function
ND No data or incomplete data available to costing team 1Mpongwe DHO does not have storage facilities for ARVs The ARVs are delivered directly to the Mpongwe Mission hospital where a pharmaceutical technician manages them 2The Mpongwe DHO Officer provided costs for the transportation activities performed by the DHO However there was no distribution schedule available At the Mpongwe Mission Hospital the costing team was informed that health facilities pick up their supplies from the hospital (hence the costs observed at Mikata) and if there is a vehicle available they may be taken back to their facility by a DHO vehicle The costing team is there unable to determine costs since this activity is random and unrecorded 3These costs are related to the faxing of supply vouchers to the LMU of SCMS monthly
43
44
Appendix 6
Ndola District Supply Chain Costing Statistics Ndola DHMT Arthur
Davison Childrens Hospital Ndola
Ndola Central Hospital Ndola
Lubuto Health Centre Ndola
Kavu Rural Health Centre Ndola
Total value of commodities passing through
$1472899 $151222 $943578 $639993 $58184
Total volume of commodities passing through (m3)
45 8 27 20 2
Procurement Costs NA NA NA NA NA
Storage Costs 4176 4526 11141 3150 4164
Transport Costs 3521 NA NA 0 315
Operating Costs 2668 3994 7810 44 46
Total Costs 10365 8520 18951 3194 4522
Cost per $ of annual pass through
070 557 197 047 777
Cost per m3 of annual pass through
228 1000 696 153 2207
Number of patient ARV prescriptions filled a day
NA 40-50 150-200 80-90 30-35
Procurement Cost per $1000 of ARVs
000 000 000 000 000
Storage Cost per m3 of annual pass through
92 537 416 158 2032
Storage Labor Cost 4071 4367 10585 2893 4158
LaborTotal Storage Costs 97 96 95 92 100
Cost per m3 transported 78 0 0 0 154 Notes NA Not Applicable if facility does not perform that function
ND No data or incomplete data available to costing team
45
46
Appendix 7
Estimating Total Delivered Costs ndash Ndola District Procurement Unit SCMS Total
Value of Commodity Volume of Commodity Procurement costs Operating Costs Total
3531884 $ 243
173955$ 50000$
223955$
per $1000
4925$ 1416$ 6341$
29758677 $ 804
200307149 $ $
2003071 $
per $1000
6731$ $
6731$
33290561 $ 1047
2177026 $ $
2227026 $
per $1000
6539$ 150$
6690$
Tier 1 MSL Value of Commodity $ 31983921 Volume of Commodity 1110 Logistics Costs per $1000 Storage $ 250732 $ 784 Inventory $ - $ -Transport $ 27783 $ 087 Operating $ 25041 $ 078 Total $ 303556 $ 949
Tier 2 Ndola DHMT Value of Commodity $ 1472899 Volume of Commodity 4517 Logistics Costs per $1000 Storage $ 4176 $ 284 Inventory $ - $ -Transport $ 3521 $ 239 Operating $ 2668 $ 181 Total $ 10365 $ 704
Tier 3 Lubuto HC Kavu Rural HC Ndola Central Hospital Arthur Davison Value of Commodity $ 639993 $ 58184 $943578 $151222 Volume of Commodity 20 2 27 8 Logistics Costs per $1000 per $1000 per $1000 per $1000 Storage $ 3150 $ 492 $ 4161 $ 7151 $ 11141 $ 001 $ 4526 $ 003 Inventory $ - $ - $ - $ - $ - $ - $ - $ -Transport $ - $ - $ 315 $ 541 $ - $ - $ - $ -Operating $ 44 $ 007 $ 46 $ 079 $ 7810 $ 001 $ 3994 $ 003 Total $ 3194 $ 499 $ 4522 $ 7772 $ 1895100 $ 002 $ 8520 $ 006
SDP Lubuto HC Kavu Rural HC Ndola Central Hospital Arthur Davison Delivered Cost by Function Procurement Costs Logistics Costs Storage Inventory Transport Operating Total
76
18 0 4 3
100 Value
per $1000 6690$
1560$ -$
326$ 266$
8842$ 88
42
51 0 5 2
100 Value
per $1000 6690$
8219$ -$
867$ 338$
16114$ 161
88
10 0 1 1
100 Value
per $1000 6690$
785$ -$
087$ 079$
7641$ 76
88
10 0 1 1
100 Value
per $1000 6690$
787$ -$
087$ 081$
7644$ 76
47
48
Appendix 8
Estimating Total Delivered Costs ndash Lusaka Main District
Procurement Unit SCMS Total
Value of Commodity Volume of Commodity Procurement costs Operating Costs Total
3531884 $ 243
173955$ 50000$
223955$
per $1000
4925$ 1416$ 6341$
29758677 $ 804
$ 200307149 $
2003071 $
per $1000
6731$ 441$
7172$
$ 33290561 1047
2177026 $ 50000$
2227026 $
per $1000
6539$ 150$
6690$
Tier 1 MSL Value of Commodity $ 31983921 Volume of Commodity 1110 Logistics Costs per $1000 Storage $ 250732 $ 784 Inventory $ - $ -Transport $ 27783 $ 087 Operating $ 25041 $ 078 Total $ 303556 $ 949
Tier 2 Value of Commodity Volume of Commodity Logistics Costs Storage Inventory Transport Operating Total
Lusaka MainNgansaCIDRZ $ 13029840
441 per $1000
$ 52257 $ 401 $ - $ -$ 37833 $ 290 $ 13700 $ 105
$ 797$ 103790
Tier 3 Kara Clinic Chilenje Rural HC Mtendere Clinic Bauleni Rural HC Value of Commodity $ 498588 $ 268909 $ 450677 $ 214773 Volume of Commodity 14 7 14 7 Logistics Costs per $1000 per $1000 per $1000 per $1000 Storage $ 6316 $ 1267 $ 3608 $ 1342 $ 4124 $ 915 $ 3143 $ 1169 Inventory $ - $ - $ - $ - $ - $ - $ - $ -Transport $ - $ - $ - $ - $ - $ - $ - $ -Operating $ 889 $ 178 $ 248 $ 092 $ 467 $ 104 $ 67 $ 025 Total $ 7205 $ 1445 $ 3856 $ 1434 $ 4591 $ 1019 $ 3210 $ 1194
SDP Kara Clinic Chilenje Rural HC Mtendere Clinic Bauleni Rural HC Delivered Cost by Function Procurement Costs Logistics Costs Storage Inventory Transport Operating Total
68
25 0 4 4
100 Value
per $1000 6690$
2413$ -$
377 $ 362 $
9842$ 98
68
25 0 4 3
100 Value
per $1000 6690$
2488$ -$
377$ 276$
9830$ 98
71
22 0 4 3
100 Value
per $1000 6690$
2061$ -$
377$ 287$
9415$ 94
68
26 0 4 2
100 Value
per $1000 6690$
2610$ -$
377$ 215$
9891$ 99
49
50
Appendix 9 Estimating Total Delivered Costs ndash Mpongwe Main District Value of Commodity Volume of Commodity Procurement costs Operating Costs Total
Tier 1 Value of Commodity Volume of CommodityLogistics Costs Storage Inventory Transport Operating Total
Tier 2 Value of Commodity Volume of Commodity Logistics Costs Storage Inventory Transport Operating Total
Tier 3 Value of Commodity Volume of Commodity Logistics Costs Storage Inventory Transport Operating Total
SDP Delivered Cost by Function Procurement Costs Logistics Costs Storage Inventory Transport Operating Total
CHAZ per $1000
2083755 $ 74
104188$ 50$ -$
104188$ 50$
CHAZ 2083755 $
35394$ 17$ -$ 0
83130$ 40$ -$ 0
118524$ 57$
Mpongwe DHMTMpongwe Mission Hospital 334786$
11 per $1000
2631$ 001$ -$ -$ 94 $ 000$
272$ 000$ 2997$ 001$
St Theresas Mikata Health Centre 209237 6246$
5 039 per $1000 per $1000
1114$ 001$ 976$ 016$ -$ -$ -$ -$ 839$ 000$ 36$ 001$ 646$ 000$ 44$ 001$
2599$ 001$ 1056 017$
St Theresas Mikata Health Centre per $1000 per $1000
56 5000$ 47 5000$
001 00053$ 16 1715$ 000 -$ 0 -$
4438 398983$ 37 3990$ 000 00031$ 0 001$ 100 8991$ 100 10706$
Value 90 Value 107
51
52
Appendix 10
Estimating Total Delivered Costs ndash Weighted Average Calculations
Sample weighted average (SWA) by value
SWA for procurement costs
SWA for storage costs
SWA for transport costs
SWA for operation costs
SWA for Total Delivered Cost as a of Total Delivered Value of Commodities
Lubuto HC
19
14
3
1
164
Kavu Rural HC
2
1
1
0
027
Ndola Central Hospital
27
24
3
0
209
Arthur Davison
4
4
0
0
034
(cont) Kara Clinic Chilenje Rural HC Mtendere Clinic Bauleni Rural HC Mikata HC AVERAGE (TOTAL)
SWA by value 14 8 13 6 0 (100)
SWA for procurement costs 10 5 9 4 0 75
SWA for storage costs 3 2 3 2 0 17
SWA for transport costs 1 0 1 0 0 6
SWA for operation costs 2
SWA for Total Delivered Cost as a of Total Delivered Value of Commodities
143 077 123 062 002 896
Note CHAZ facilities not included due to the lack of available data on procurement costs
53
54
Appendix 11
USAID | DELIVER PROJECT Supply Chain Costing Tool Pilot List of Data inputs required for estimating the Cost of a Supply Chain
TC Total Cost All costs assumed to be annual
SC Supply Chain
Information Systems At present it is assumed that these costs will fall under labor costs under the procurement function rather than as a separate category This assumption may be re-assessed after the pilot exercise so placeholders are included at the end of the table
Quality Assurance At present it is assumed that these costs will fall under laborsupervisory costs under each of the procurement storage and transport categories rather than as a separate category This assumption may be re-assessed after the pilot exercise so placeholders are included at the end of the table
LOE Level of effort (as ) spent on HIV SC-related activities
55
Output Metric Notes User Input Metrics
Total Cost of Supply Chain TC Procurement +TC Storage +TC Transportation
(See above regarding information systems and quality assurance)
This is how the costs will be aggregated to obtain the total cost of procurementstoragetransportation at each tier of the system
Labor costs+ Non labor-operating costs + Capital costs + Other
TC Procurement
Labor cost Labor costs should be obtained from a standard civil service salary scale This way only the grade and LOE needs to be collected from each facility rather than having to include questions on salary
Personnel Types
Personnel Salary
Personnel Level of Effort spent on SC-related procurement activities ()
Personnel Benefits
Annual training expenditures related to SC procurement activities
Non-labor operating cost It is anticipated that these expenditures are available at the facility level Eg Average or annual expenditure on telephone calls Cost of space may be a capital cost if the value of the space is to be captured using the value of equivalent landbuilding rather than an equivalent rent
Telephones
Postage
Courier
Printing
Security
Supplies
Utilities
Costrent equivalent per sq feet per annum Area in sq feet allocated to procurement offices
Commodity Value If complete commodity data are available from the MSLPSU then it may not be necessary to collect them at the facility level unless there is reason to believe that the figures differ and there are costs associated eg wastage damage loss etc
Commodity Name
Commodity Quantity Procured
Unit price at which commodity X is procured
Custom Fees Commodity Prices
Custom rates (It may be that a single rate is used for all commodities and so this would simplify to a single percentage)
Taxes Commodity Prices
56
Output Metric Notes User Input Metrics
Insurance If applicable
Tax rate if applicable
Freight Fees Freight Rates if applicable
Commodity Prices
Freight rate specifically the rate charged for commodities up to the point of entry into the country only Rates may be based on price or volume
TC Storage
Labor Labor costs should be obtained from a standard civil service salary scale This way only the grade and LOE needs to be collected from each facility rather than having to include questions on salary
Personnel Types
Personnel Salary
Personnel LOE spent on SC-related storage activities ()
Personnel Benefits
Annual training expenditures
Non-labor operating cost It is anticipated that these expenditures are available at the facility level Eg Average or annual expenditure on telephone calls These non-costs do not include any capital costs which are captured in other sections
Telephones
Postage
Courier
Printing
Security
Supplies
Utilities
Fuel
Costrent equivalent per sq feet per annum Area in sq feet allocated to office space for storage-related personnel
Other expenses
Handling This equipment will count as capital costs For each of these items the quantity age and cost of the equipment will be collected and the depreciation calculated
Forklifts
Hand pallet trucks
Carts
Wheelbarrows
2-wheeler
Other
57
Output Metric Notes User Input Metrics
ShelvesRacks
Refrigerators
Cold room
Safevaults
Other
Supplies
Space Square meterage of storage space
Length (meters)
Breadth (pacesmetersfeet)
Value per square meter if no rent or payments currently made on the space then use rent of equivalent space in equivalent location
Percentage of space used for SC storage purposes and that is paid for out of the SC budget
TC Transportation
Note Specific maintenance costs to be estimated under operating costs and labor costs ie costs will be counted under rent and mechanic salaries and so on therefore there is no row for maintenance
Labor Labor costs should be obtained from a standard civil service salary scale This way only the grade and LOE needs to be collected from each facility rather than having to include questions on salary
Personnel Types
Personnel Salary
Personnel LOE
Personnel Benefits
Annual training
Non-labor operating cost It is anticipated that these expenditures are available at the facility level Eg Average or annual expenditure on telephone calls
Telephones
Fuel
Costrent equivalent per sq feet per annum Area in sq feet allocated to office space for storage-related personnel
Other expenses
Vehicles For each of these items the quantity age and cost of the equipment will be collected and the depreciation calculated
Vehicle Types
Vehicle Cost
Percent of time vehicle is used for SC transport purposes
58
Output Metric Notes User Input Metrics
Information Systems
Labor Labor costs should be obtained from a standard civil Personnel Types service salary scale This way only the grade and LOE Personnel Salary needs to be collected from each facility rather than having to include questions on salary Personnel LOE spent on SC-related storage activities ()
Personnel Benefits
Annual training expenditures
Quality Assurance
Labor Labor costs should be obtained from a standard civil service salary scale This way only the grade and LOE needs to be collected from each facility rather than having to include questions on salary
Personnel Types
Personnel Salary
Personnel LOE spent on SC-related storage activities ()
Personnel Benefits
Annual training expenditures
59
60
Appendix 12
Contact List Contact Title Organization
Albert Lupupa Chief Purchasing and Supplies Officer
Drug Procurement Office Ministry of Health
Tom Brown Director of Logistics Medical Stores Limited
Mulenga Muleba Deputy Country Manager Crown Agents - Zambia
Edward Kabwe Director of Finance and Administration
Medical Stores Limited
Abel Phiri Transport Manager Medical Stores Limited
Kwasi Torpey Director Technical Support ZPCT
Gail Bryant Senior Advisor Pharmaceutical Management
ZPCT
Yebo Gondwe ZPCT
Lona Mwenda Program Officer ZPCT
Kelly McCoy Project Manager CIHDZ
Joshua Kasimba CIHDZ
Chipupu Kandeke Manager Pharmaceutical Services CHAZ Church Health Association Zambia (CHAZ)
Shadreck Malupenga Logistics CHAZ Christian Health Association Zambia
Osward A Nyenda Manager Operations Ngansa Pharmaceuticals Ltd
Bjorn von Hofsten Director Pharmacist Ngansa Pharmaceuticals Ltd
Maxwell Kasonde Morgan Phiri District Pharmacy Programme Coordinators
Lusaka Main DHMT
Jack Menke Program Manager Kara Clinic Lusaka
Mrs Chileshe In-charge ARV Pharm Technician Mtendere Health Centre Lusaka Main
Happy Chiporu Mosia Muhango In-charge ARV Pharm Technician Chilenge Lusaka Main
Mrs Mtonge Lisa Siame In-charge ARV Pharm Technician Bauleni Health Centre Lusaka Main
Dr Isaac Banda Director Mpongwe DHMT
Gladys Mpagwe ARV Pharm Technician Mpongwe Mission Hospital
Florida Mumba Esther Zimba In-charge ARV Pharm Technician Mikata Health Centre
Sister Chanshi Director ARV Pharm Technician St Theresas Hospital
Mercy ZPCT Ndola
61
Contact Title Organization
Lilian Nyerbwa Manager Planning Ndola DHMT
James Simulwke Pharmacist Ndola DHMT
Chiryimba Musonda Pharmacist Technician Ndola DHMT
Ignatius Chikoti Assistant Accountant Ndola DHMT
Matthew Mwute Hanzooma Hatwiko
Head of Pharmacy Dispensing ARV Pharmacist
Arthur Davidson Childrenrsquos Hospital Ndola
Dr Dande Malawo Dr Masase Mwape Kunda Royd Ngoma
Executive Director Clinical Director Dispensing ARV Pharmacist Store Pharmacist
Ndola Central Mission Hospital
Mrs Mwambi Nurse In-Charge Lubutu Health Centre Ndola
Sister Elizabeth Njovu Nurse In-Charge Kavu Rural Health Centre Ndola
Deborah Connor Country Director EGPAF
Mbaweni Mwanza Deputy Director Finance and Administration
SCMS and USAID | DELIVER PROJECT
Peter Lisulo Senior Public Health Logistics Officer
SCMS and USAID | DELIVER PROJECT
Walter Proper Country Director SCMS and USAID | DELIVER PROJECT
Wendy Nicodemus Senior Technical Advisor SCMS and USAID | DELIVER PROJECT
Paul Kamuna Public Health Logistics Officer SCMS and USAID | DELIVER PROJECT
David Papworth Deputy Country Director SCMS and USAID | DELIVER PROJECT
62
For more information please visit deliverjsicom
USAID | DELIVER PROJECT
John Snow Inc
1616 Fort Myer Drive 11th Floor
Arlington VA 22209 USA
Phone 703-528-7474
Fax 703-528-7480
Email askdeliverjsicom
Internet deliverjsicom
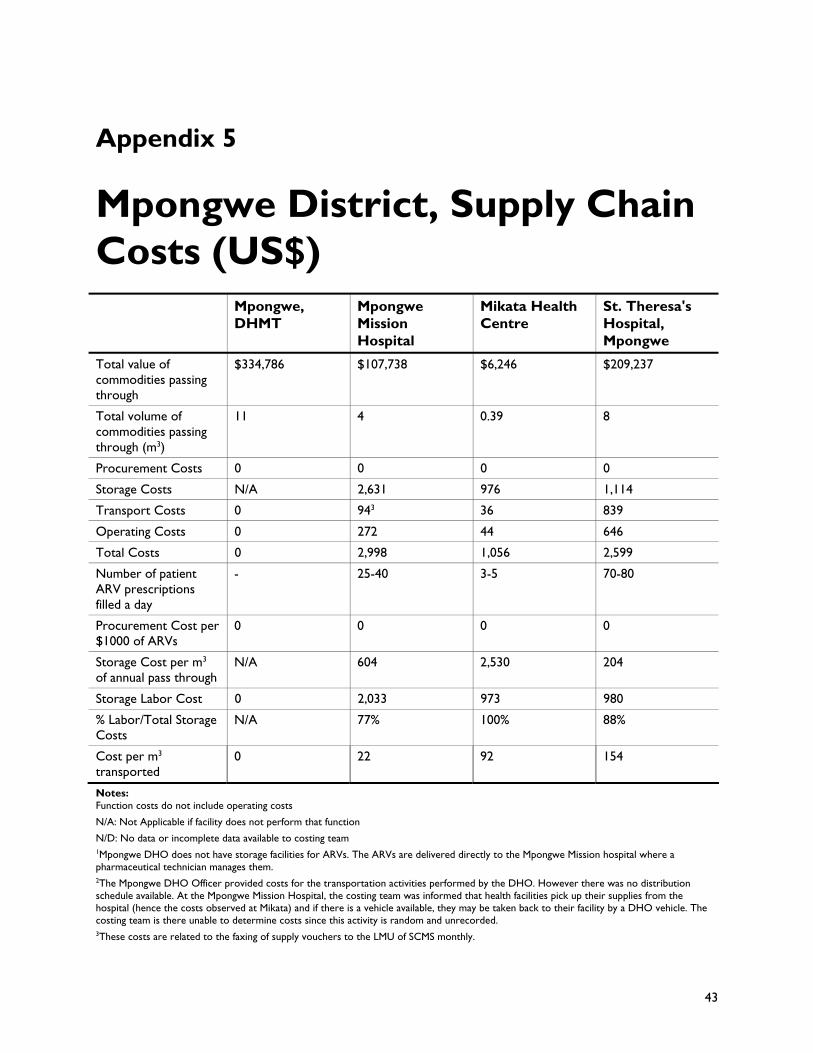
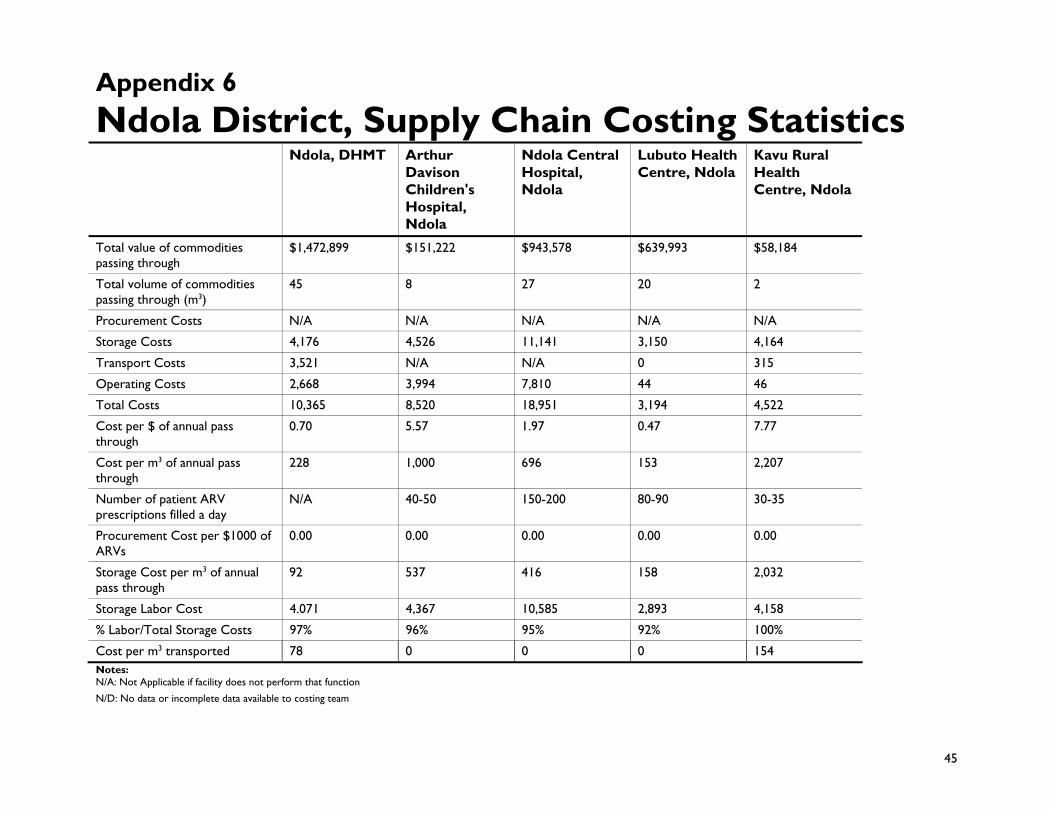
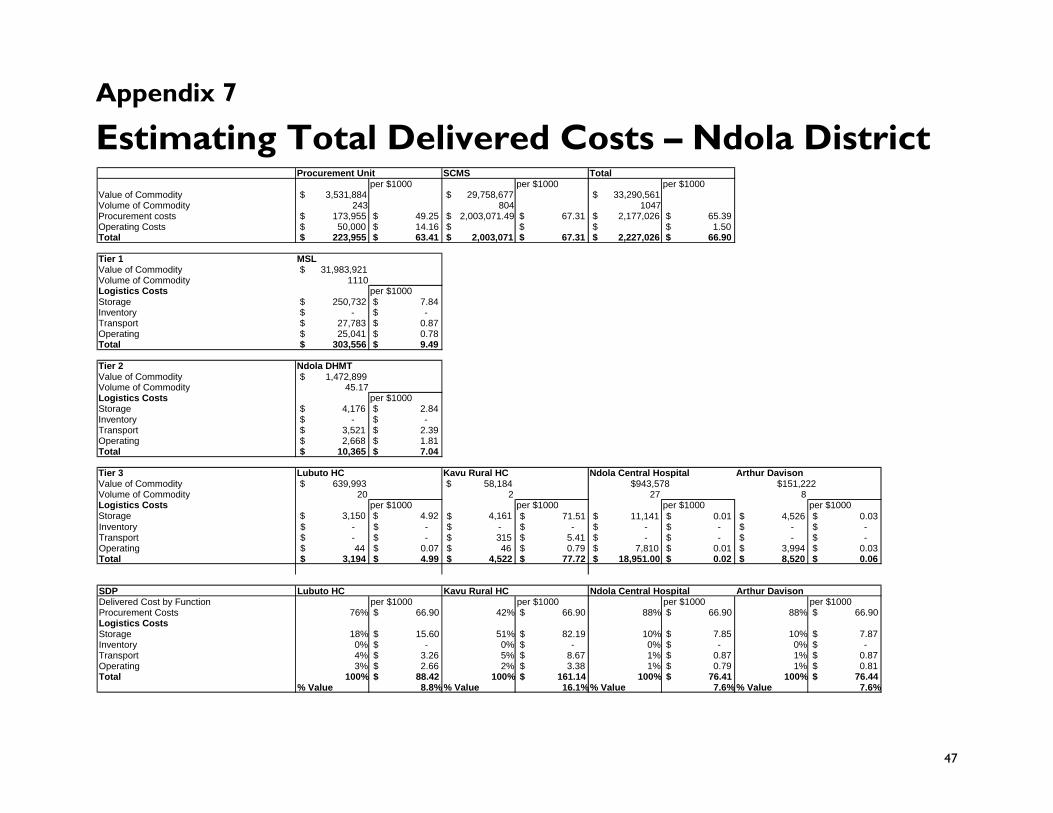
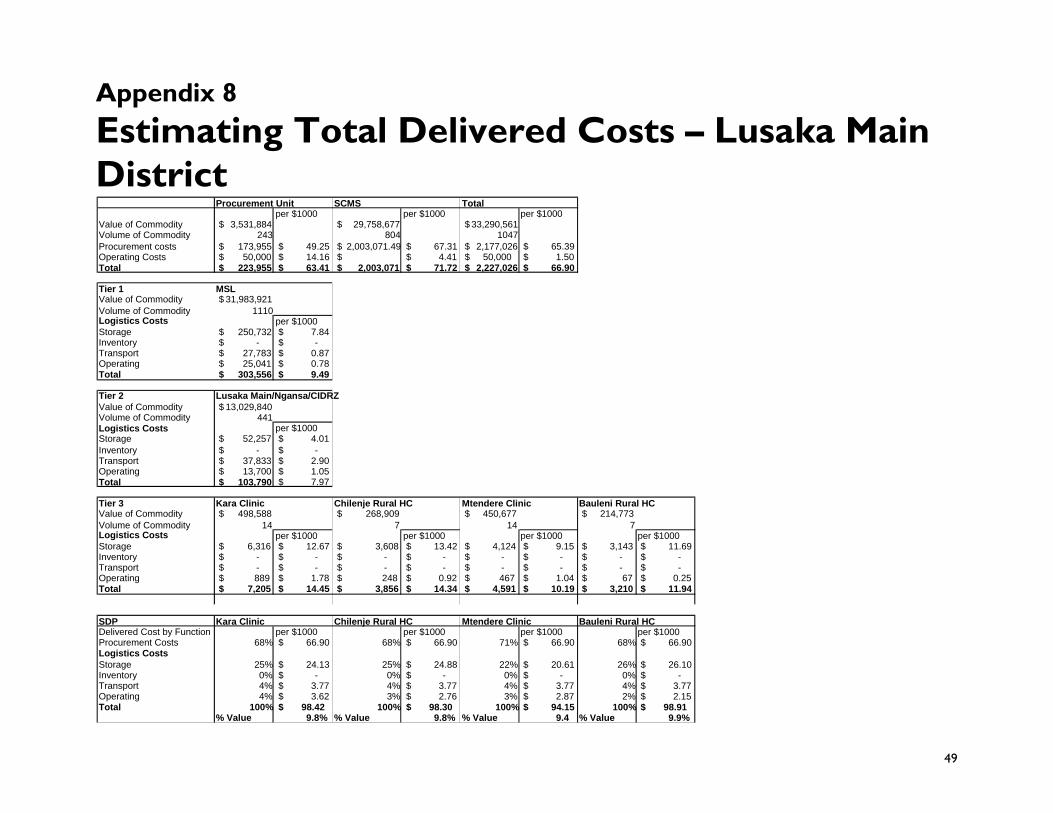
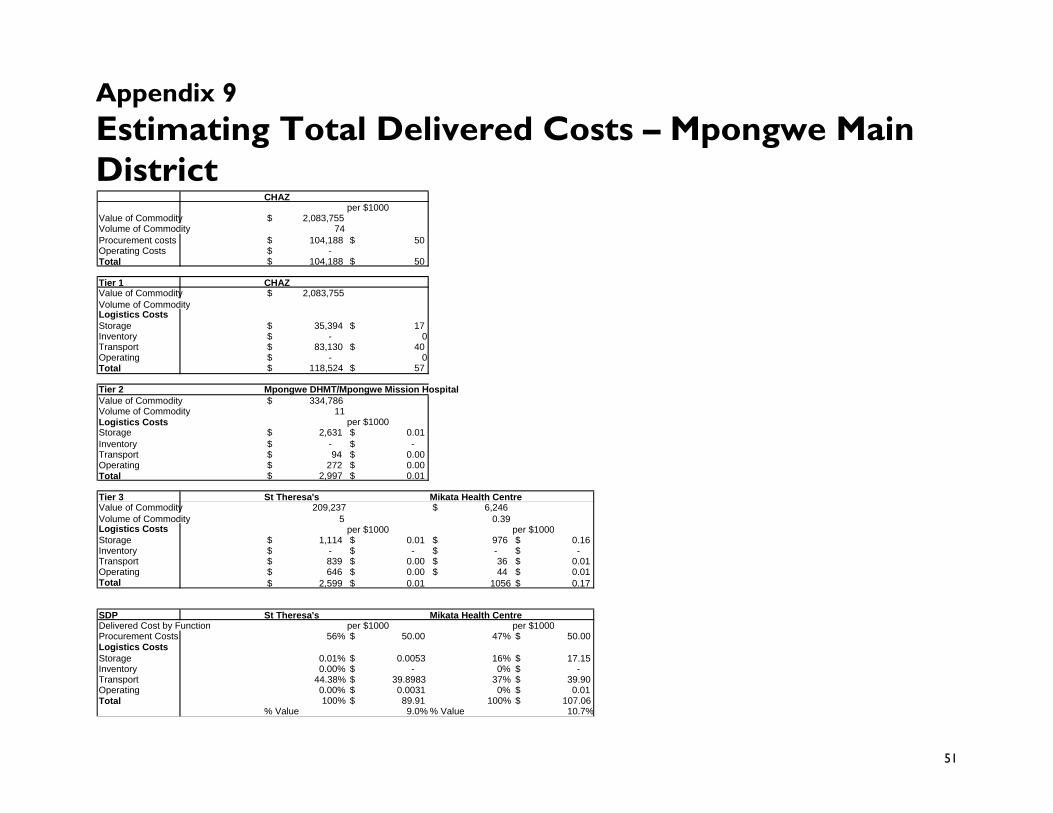
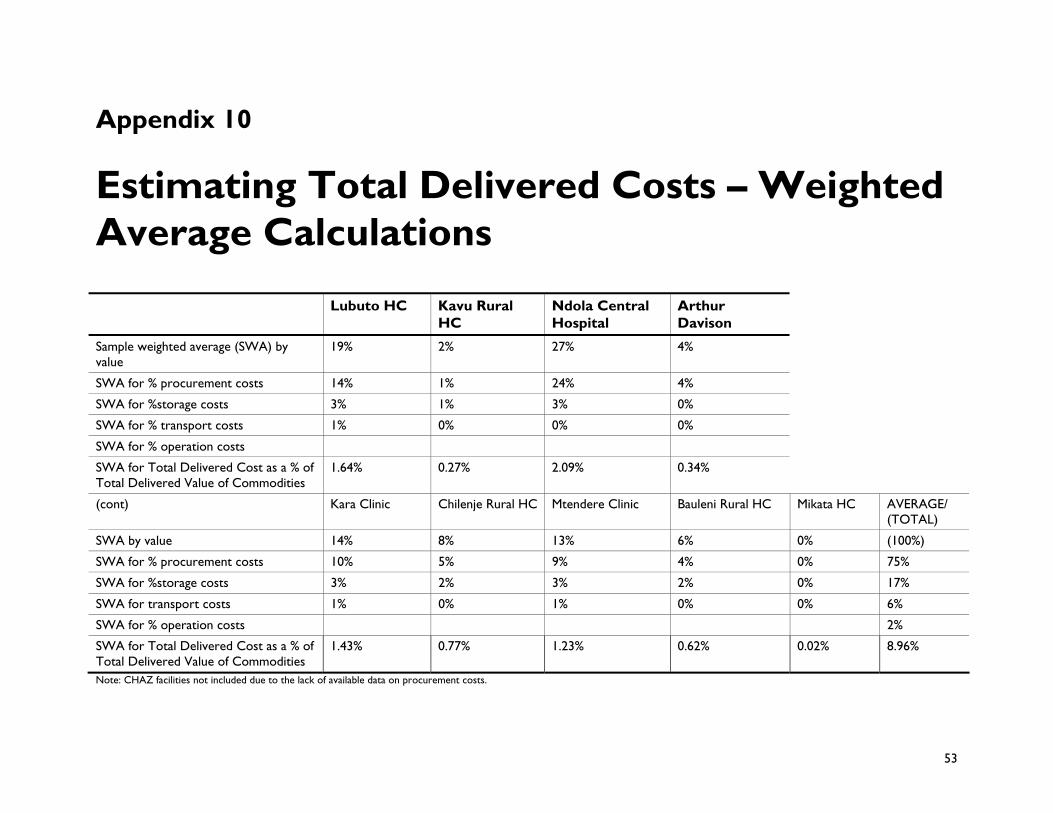

Output Metric Notes User Input Metrics
Total Cost of Supply Chain TC Procurement +TC Storage +TC Transportation
(See above regarding information systems and quality assurance)
This is how the costs will be aggregated to obtain the total cost of procurementstoragetransportation at each tier of the system
Labor costs+ Non labor-operating costs + Capital costs + Other
TC Procurement
Labor cost Labor costs should be obtained from a standard civil service salary scale This way only the grade and LOE needs to be collected from each facility rather than having to include questions on salary
Personnel Types
Personnel Salary
Personnel Level of Effort spent on SC-related procurement activities ()
Personnel Benefits
Annual training expenditures related to SC procurement activities
Non-labor operating cost It is anticipated that these expenditures are available at the facility level Eg Average or annual expenditure on telephone calls Cost of space may be a capital cost if the value of the space is to be captured using the value of equivalent landbuilding rather than an equivalent rent
Telephones
Postage
Courier
Printing
Security
Supplies
Utilities
Costrent equivalent per sq feet per annum Area in sq feet allocated to procurement offices
Commodity Value If complete commodity data are available from the MSLPSU then it may not be necessary to collect them at the facility level unless there is reason to believe that the figures differ and there are costs associated eg wastage damage loss etc
Commodity Name
Commodity Quantity Procured
Unit price at which commodity X is procured
Custom Fees Commodity Prices
Custom rates (It may be that a single rate is used for all commodities and so this would simplify to a single percentage)
Taxes Commodity Prices
56
Output Metric Notes User Input Metrics
Insurance If applicable
Tax rate if applicable
Freight Fees Freight Rates if applicable
Commodity Prices
Freight rate specifically the rate charged for commodities up to the point of entry into the country only Rates may be based on price or volume
TC Storage
Labor Labor costs should be obtained from a standard civil service salary scale This way only the grade and LOE needs to be collected from each facility rather than having to include questions on salary
Personnel Types
Personnel Salary
Personnel LOE spent on SC-related storage activities ()
Personnel Benefits
Annual training expenditures
Non-labor operating cost It is anticipated that these expenditures are available at the facility level Eg Average or annual expenditure on telephone calls These non-costs do not include any capital costs which are captured in other sections
Telephones
Postage
Courier
Printing
Security
Supplies
Utilities
Fuel
Costrent equivalent per sq feet per annum Area in sq feet allocated to office space for storage-related personnel
Other expenses
Handling This equipment will count as capital costs For each of these items the quantity age and cost of the equipment will be collected and the depreciation calculated
Forklifts
Hand pallet trucks
Carts
Wheelbarrows
2-wheeler
Other
57
Output Metric Notes User Input Metrics
ShelvesRacks
Refrigerators
Cold room
Safevaults
Other
Supplies
Space Square meterage of storage space
Length (meters)
Breadth (pacesmetersfeet)
Value per square meter if no rent or payments currently made on the space then use rent of equivalent space in equivalent location
Percentage of space used for SC storage purposes and that is paid for out of the SC budget
TC Transportation
Note Specific maintenance costs to be estimated under operating costs and labor costs ie costs will be counted under rent and mechanic salaries and so on therefore there is no row for maintenance
Labor Labor costs should be obtained from a standard civil service salary scale This way only the grade and LOE needs to be collected from each facility rather than having to include questions on salary
Personnel Types
Personnel Salary
Personnel LOE
Personnel Benefits
Annual training
Non-labor operating cost It is anticipated that these expenditures are available at the facility level Eg Average or annual expenditure on telephone calls
Telephones
Fuel
Costrent equivalent per sq feet per annum Area in sq feet allocated to office space for storage-related personnel
Other expenses
Vehicles For each of these items the quantity age and cost of the equipment will be collected and the depreciation calculated
Vehicle Types
Vehicle Cost
Percent of time vehicle is used for SC transport purposes
58
Output Metric Notes User Input Metrics
Information Systems
Labor Labor costs should be obtained from a standard civil Personnel Types service salary scale This way only the grade and LOE Personnel Salary needs to be collected from each facility rather than having to include questions on salary Personnel LOE spent on SC-related storage activities ()
Personnel Benefits
Annual training expenditures
Quality Assurance
Labor Labor costs should be obtained from a standard civil service salary scale This way only the grade and LOE needs to be collected from each facility rather than having to include questions on salary
Personnel Types
Personnel Salary
Personnel LOE spent on SC-related storage activities ()
Personnel Benefits
Annual training expenditures
59
60
Appendix 12
Contact List Contact Title Organization
Albert Lupupa Chief Purchasing and Supplies Officer
Drug Procurement Office Ministry of Health
Tom Brown Director of Logistics Medical Stores Limited
Mulenga Muleba Deputy Country Manager Crown Agents - Zambia
Edward Kabwe Director of Finance and Administration
Medical Stores Limited
Abel Phiri Transport Manager Medical Stores Limited
Kwasi Torpey Director Technical Support ZPCT
Gail Bryant Senior Advisor Pharmaceutical Management
ZPCT
Yebo Gondwe ZPCT
Lona Mwenda Program Officer ZPCT
Kelly McCoy Project Manager CIHDZ
Joshua Kasimba CIHDZ
Chipupu Kandeke Manager Pharmaceutical Services CHAZ Church Health Association Zambia (CHAZ)
Shadreck Malupenga Logistics CHAZ Christian Health Association Zambia
Osward A Nyenda Manager Operations Ngansa Pharmaceuticals Ltd
Bjorn von Hofsten Director Pharmacist Ngansa Pharmaceuticals Ltd
Maxwell Kasonde Morgan Phiri District Pharmacy Programme Coordinators
Lusaka Main DHMT
Jack Menke Program Manager Kara Clinic Lusaka
Mrs Chileshe In-charge ARV Pharm Technician Mtendere Health Centre Lusaka Main
Happy Chiporu Mosia Muhango In-charge ARV Pharm Technician Chilenge Lusaka Main
Mrs Mtonge Lisa Siame In-charge ARV Pharm Technician Bauleni Health Centre Lusaka Main
Dr Isaac Banda Director Mpongwe DHMT
Gladys Mpagwe ARV Pharm Technician Mpongwe Mission Hospital
Florida Mumba Esther Zimba In-charge ARV Pharm Technician Mikata Health Centre
Sister Chanshi Director ARV Pharm Technician St Theresas Hospital
Mercy ZPCT Ndola
61
Contact Title Organization
Lilian Nyerbwa Manager Planning Ndola DHMT
James Simulwke Pharmacist Ndola DHMT
Chiryimba Musonda Pharmacist Technician Ndola DHMT
Ignatius Chikoti Assistant Accountant Ndola DHMT
Matthew Mwute Hanzooma Hatwiko
Head of Pharmacy Dispensing ARV Pharmacist
Arthur Davidson Childrenrsquos Hospital Ndola
Dr Dande Malawo Dr Masase Mwape Kunda Royd Ngoma
Executive Director Clinical Director Dispensing ARV Pharmacist Store Pharmacist
Ndola Central Mission Hospital
Mrs Mwambi Nurse In-Charge Lubutu Health Centre Ndola
Sister Elizabeth Njovu Nurse In-Charge Kavu Rural Health Centre Ndola
Deborah Connor Country Director EGPAF
Mbaweni Mwanza Deputy Director Finance and Administration
SCMS and USAID | DELIVER PROJECT
Peter Lisulo Senior Public Health Logistics Officer
SCMS and USAID | DELIVER PROJECT
Walter Proper Country Director SCMS and USAID | DELIVER PROJECT
Wendy Nicodemus Senior Technical Advisor SCMS and USAID | DELIVER PROJECT
Paul Kamuna Public Health Logistics Officer SCMS and USAID | DELIVER PROJECT
David Papworth Deputy Country Director SCMS and USAID | DELIVER PROJECT
62
For more information please visit deliverjsicom
USAID | DELIVER PROJECT
John Snow Inc
1616 Fort Myer Drive 11th Floor
Arlington VA 22209 USA
Phone 703-528-7474
Fax 703-528-7480
Email askdeliverjsicom
Internet deliverjsicom
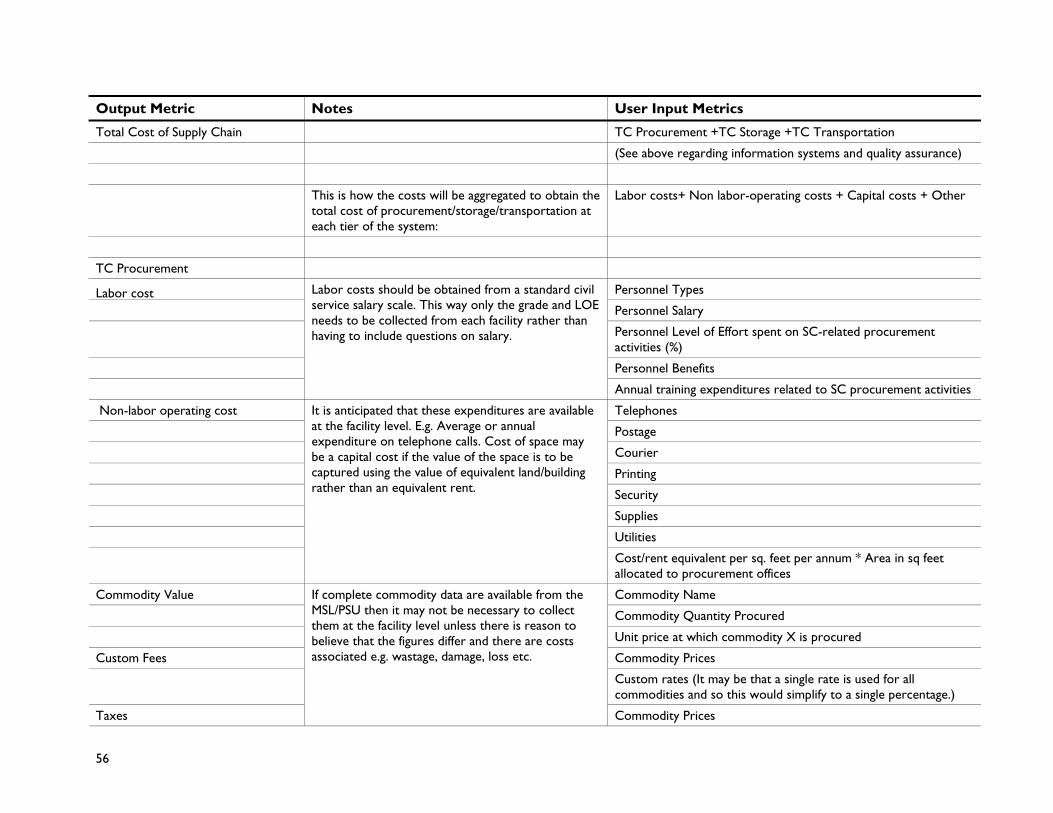
Output Metric Notes User Input Metrics
Insurance If applicable
Tax rate if applicable
Freight Fees Freight Rates if applicable
Commodity Prices
Freight rate specifically the rate charged for commodities up to the point of entry into the country only Rates may be based on price or volume
TC Storage
Labor Labor costs should be obtained from a standard civil service salary scale This way only the grade and LOE needs to be collected from each facility rather than having to include questions on salary
Personnel Types
Personnel Salary
Personnel LOE spent on SC-related storage activities ()
Personnel Benefits
Annual training expenditures
Non-labor operating cost It is anticipated that these expenditures are available at the facility level Eg Average or annual expenditure on telephone calls These non-costs do not include any capital costs which are captured in other sections
Telephones
Postage
Courier
Printing
Security
Supplies
Utilities
Fuel
Costrent equivalent per sq feet per annum Area in sq feet allocated to office space for storage-related personnel
Other expenses
Handling This equipment will count as capital costs For each of these items the quantity age and cost of the equipment will be collected and the depreciation calculated
Forklifts
Hand pallet trucks
Carts
Wheelbarrows
2-wheeler
Other
57
Output Metric Notes User Input Metrics
ShelvesRacks
Refrigerators
Cold room
Safevaults
Other
Supplies
Space Square meterage of storage space
Length (meters)
Breadth (pacesmetersfeet)
Value per square meter if no rent or payments currently made on the space then use rent of equivalent space in equivalent location
Percentage of space used for SC storage purposes and that is paid for out of the SC budget
TC Transportation
Note Specific maintenance costs to be estimated under operating costs and labor costs ie costs will be counted under rent and mechanic salaries and so on therefore there is no row for maintenance
Labor Labor costs should be obtained from a standard civil service salary scale This way only the grade and LOE needs to be collected from each facility rather than having to include questions on salary
Personnel Types
Personnel Salary
Personnel LOE
Personnel Benefits
Annual training
Non-labor operating cost It is anticipated that these expenditures are available at the facility level Eg Average or annual expenditure on telephone calls
Telephones
Fuel
Costrent equivalent per sq feet per annum Area in sq feet allocated to office space for storage-related personnel
Other expenses
Vehicles For each of these items the quantity age and cost of the equipment will be collected and the depreciation calculated
Vehicle Types
Vehicle Cost
Percent of time vehicle is used for SC transport purposes
58
Output Metric Notes User Input Metrics
Information Systems
Labor Labor costs should be obtained from a standard civil Personnel Types service salary scale This way only the grade and LOE Personnel Salary needs to be collected from each facility rather than having to include questions on salary Personnel LOE spent on SC-related storage activities ()
Personnel Benefits
Annual training expenditures
Quality Assurance
Labor Labor costs should be obtained from a standard civil service salary scale This way only the grade and LOE needs to be collected from each facility rather than having to include questions on salary
Personnel Types
Personnel Salary
Personnel LOE spent on SC-related storage activities ()
Personnel Benefits
Annual training expenditures
59
60
Appendix 12
Contact List Contact Title Organization
Albert Lupupa Chief Purchasing and Supplies Officer
Drug Procurement Office Ministry of Health
Tom Brown Director of Logistics Medical Stores Limited
Mulenga Muleba Deputy Country Manager Crown Agents - Zambia
Edward Kabwe Director of Finance and Administration
Medical Stores Limited
Abel Phiri Transport Manager Medical Stores Limited
Kwasi Torpey Director Technical Support ZPCT
Gail Bryant Senior Advisor Pharmaceutical Management
ZPCT
Yebo Gondwe ZPCT
Lona Mwenda Program Officer ZPCT
Kelly McCoy Project Manager CIHDZ
Joshua Kasimba CIHDZ
Chipupu Kandeke Manager Pharmaceutical Services CHAZ Church Health Association Zambia (CHAZ)
Shadreck Malupenga Logistics CHAZ Christian Health Association Zambia
Osward A Nyenda Manager Operations Ngansa Pharmaceuticals Ltd
Bjorn von Hofsten Director Pharmacist Ngansa Pharmaceuticals Ltd
Maxwell Kasonde Morgan Phiri District Pharmacy Programme Coordinators
Lusaka Main DHMT
Jack Menke Program Manager Kara Clinic Lusaka
Mrs Chileshe In-charge ARV Pharm Technician Mtendere Health Centre Lusaka Main
Happy Chiporu Mosia Muhango In-charge ARV Pharm Technician Chilenge Lusaka Main
Mrs Mtonge Lisa Siame In-charge ARV Pharm Technician Bauleni Health Centre Lusaka Main
Dr Isaac Banda Director Mpongwe DHMT
Gladys Mpagwe ARV Pharm Technician Mpongwe Mission Hospital
Florida Mumba Esther Zimba In-charge ARV Pharm Technician Mikata Health Centre
Sister Chanshi Director ARV Pharm Technician St Theresas Hospital
Mercy ZPCT Ndola
61
Contact Title Organization
Lilian Nyerbwa Manager Planning Ndola DHMT
James Simulwke Pharmacist Ndola DHMT
Chiryimba Musonda Pharmacist Technician Ndola DHMT
Ignatius Chikoti Assistant Accountant Ndola DHMT
Matthew Mwute Hanzooma Hatwiko
Head of Pharmacy Dispensing ARV Pharmacist
Arthur Davidson Childrenrsquos Hospital Ndola
Dr Dande Malawo Dr Masase Mwape Kunda Royd Ngoma
Executive Director Clinical Director Dispensing ARV Pharmacist Store Pharmacist
Ndola Central Mission Hospital
Mrs Mwambi Nurse In-Charge Lubutu Health Centre Ndola
Sister Elizabeth Njovu Nurse In-Charge Kavu Rural Health Centre Ndola
Deborah Connor Country Director EGPAF
Mbaweni Mwanza Deputy Director Finance and Administration
SCMS and USAID | DELIVER PROJECT
Peter Lisulo Senior Public Health Logistics Officer
SCMS and USAID | DELIVER PROJECT
Walter Proper Country Director SCMS and USAID | DELIVER PROJECT
Wendy Nicodemus Senior Technical Advisor SCMS and USAID | DELIVER PROJECT
Paul Kamuna Public Health Logistics Officer SCMS and USAID | DELIVER PROJECT
David Papworth Deputy Country Director SCMS and USAID | DELIVER PROJECT
62
For more information please visit deliverjsicom
USAID | DELIVER PROJECT
John Snow Inc
1616 Fort Myer Drive 11th Floor
Arlington VA 22209 USA
Phone 703-528-7474
Fax 703-528-7480
Email askdeliverjsicom
Internet deliverjsicom
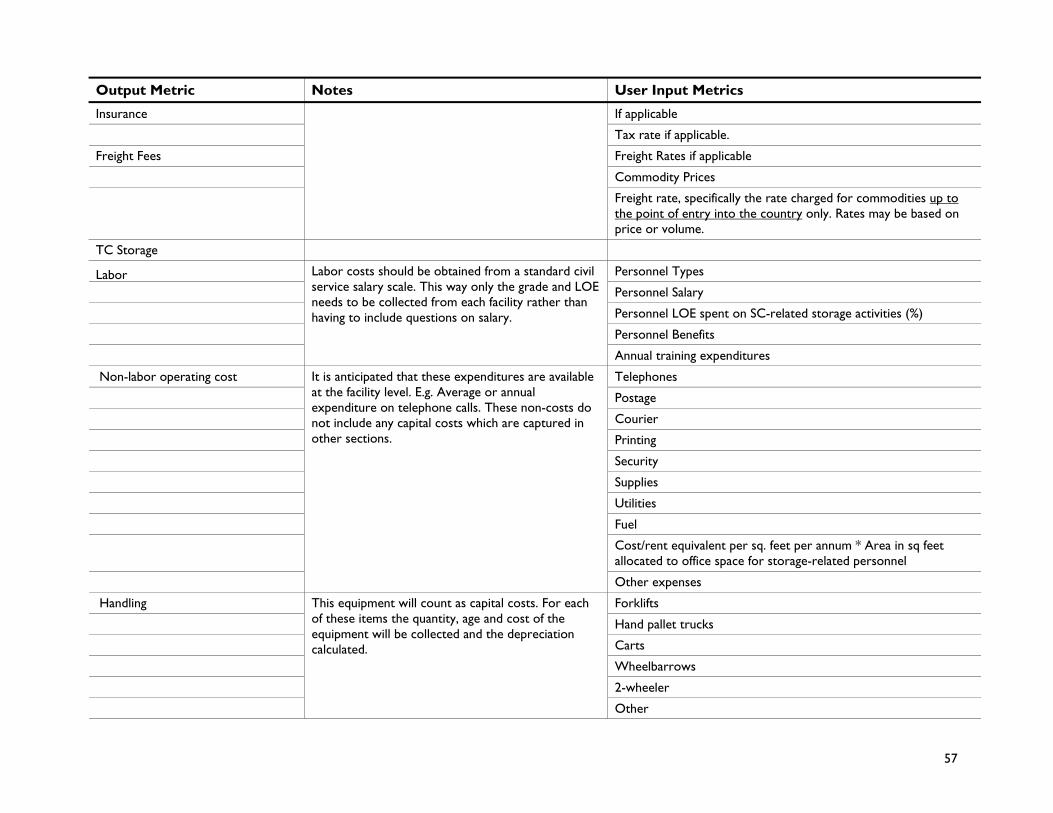
Output Metric Notes User Input Metrics
ShelvesRacks
Refrigerators
Cold room
Safevaults
Other
Supplies
Space Square meterage of storage space
Length (meters)
Breadth (pacesmetersfeet)
Value per square meter if no rent or payments currently made on the space then use rent of equivalent space in equivalent location
Percentage of space used for SC storage purposes and that is paid for out of the SC budget
TC Transportation
Note Specific maintenance costs to be estimated under operating costs and labor costs ie costs will be counted under rent and mechanic salaries and so on therefore there is no row for maintenance
Labor Labor costs should be obtained from a standard civil service salary scale This way only the grade and LOE needs to be collected from each facility rather than having to include questions on salary
Personnel Types
Personnel Salary
Personnel LOE
Personnel Benefits
Annual training
Non-labor operating cost It is anticipated that these expenditures are available at the facility level Eg Average or annual expenditure on telephone calls
Telephones
Fuel
Costrent equivalent per sq feet per annum Area in sq feet allocated to office space for storage-related personnel
Other expenses
Vehicles For each of these items the quantity age and cost of the equipment will be collected and the depreciation calculated
Vehicle Types
Vehicle Cost
Percent of time vehicle is used for SC transport purposes
58
Output Metric Notes User Input Metrics
Information Systems
Labor Labor costs should be obtained from a standard civil Personnel Types service salary scale This way only the grade and LOE Personnel Salary needs to be collected from each facility rather than having to include questions on salary Personnel LOE spent on SC-related storage activities ()
Personnel Benefits
Annual training expenditures
Quality Assurance
Labor Labor costs should be obtained from a standard civil service salary scale This way only the grade and LOE needs to be collected from each facility rather than having to include questions on salary
Personnel Types
Personnel Salary
Personnel LOE spent on SC-related storage activities ()
Personnel Benefits
Annual training expenditures
59
60
Appendix 12
Contact List Contact Title Organization
Albert Lupupa Chief Purchasing and Supplies Officer
Drug Procurement Office Ministry of Health
Tom Brown Director of Logistics Medical Stores Limited
Mulenga Muleba Deputy Country Manager Crown Agents - Zambia
Edward Kabwe Director of Finance and Administration
Medical Stores Limited
Abel Phiri Transport Manager Medical Stores Limited
Kwasi Torpey Director Technical Support ZPCT
Gail Bryant Senior Advisor Pharmaceutical Management
ZPCT
Yebo Gondwe ZPCT
Lona Mwenda Program Officer ZPCT
Kelly McCoy Project Manager CIHDZ
Joshua Kasimba CIHDZ
Chipupu Kandeke Manager Pharmaceutical Services CHAZ Church Health Association Zambia (CHAZ)
Shadreck Malupenga Logistics CHAZ Christian Health Association Zambia
Osward A Nyenda Manager Operations Ngansa Pharmaceuticals Ltd
Bjorn von Hofsten Director Pharmacist Ngansa Pharmaceuticals Ltd
Maxwell Kasonde Morgan Phiri District Pharmacy Programme Coordinators
Lusaka Main DHMT
Jack Menke Program Manager Kara Clinic Lusaka
Mrs Chileshe In-charge ARV Pharm Technician Mtendere Health Centre Lusaka Main
Happy Chiporu Mosia Muhango In-charge ARV Pharm Technician Chilenge Lusaka Main
Mrs Mtonge Lisa Siame In-charge ARV Pharm Technician Bauleni Health Centre Lusaka Main
Dr Isaac Banda Director Mpongwe DHMT
Gladys Mpagwe ARV Pharm Technician Mpongwe Mission Hospital
Florida Mumba Esther Zimba In-charge ARV Pharm Technician Mikata Health Centre
Sister Chanshi Director ARV Pharm Technician St Theresas Hospital
Mercy ZPCT Ndola
61
Contact Title Organization
Lilian Nyerbwa Manager Planning Ndola DHMT
James Simulwke Pharmacist Ndola DHMT
Chiryimba Musonda Pharmacist Technician Ndola DHMT
Ignatius Chikoti Assistant Accountant Ndola DHMT
Matthew Mwute Hanzooma Hatwiko
Head of Pharmacy Dispensing ARV Pharmacist
Arthur Davidson Childrenrsquos Hospital Ndola
Dr Dande Malawo Dr Masase Mwape Kunda Royd Ngoma
Executive Director Clinical Director Dispensing ARV Pharmacist Store Pharmacist
Ndola Central Mission Hospital
Mrs Mwambi Nurse In-Charge Lubutu Health Centre Ndola
Sister Elizabeth Njovu Nurse In-Charge Kavu Rural Health Centre Ndola
Deborah Connor Country Director EGPAF
Mbaweni Mwanza Deputy Director Finance and Administration
SCMS and USAID | DELIVER PROJECT
Peter Lisulo Senior Public Health Logistics Officer
SCMS and USAID | DELIVER PROJECT
Walter Proper Country Director SCMS and USAID | DELIVER PROJECT
Wendy Nicodemus Senior Technical Advisor SCMS and USAID | DELIVER PROJECT
Paul Kamuna Public Health Logistics Officer SCMS and USAID | DELIVER PROJECT
David Papworth Deputy Country Director SCMS and USAID | DELIVER PROJECT
62
For more information please visit deliverjsicom
USAID | DELIVER PROJECT
John Snow Inc
1616 Fort Myer Drive 11th Floor
Arlington VA 22209 USA
Phone 703-528-7474
Fax 703-528-7480
Email askdeliverjsicom
Internet deliverjsicom
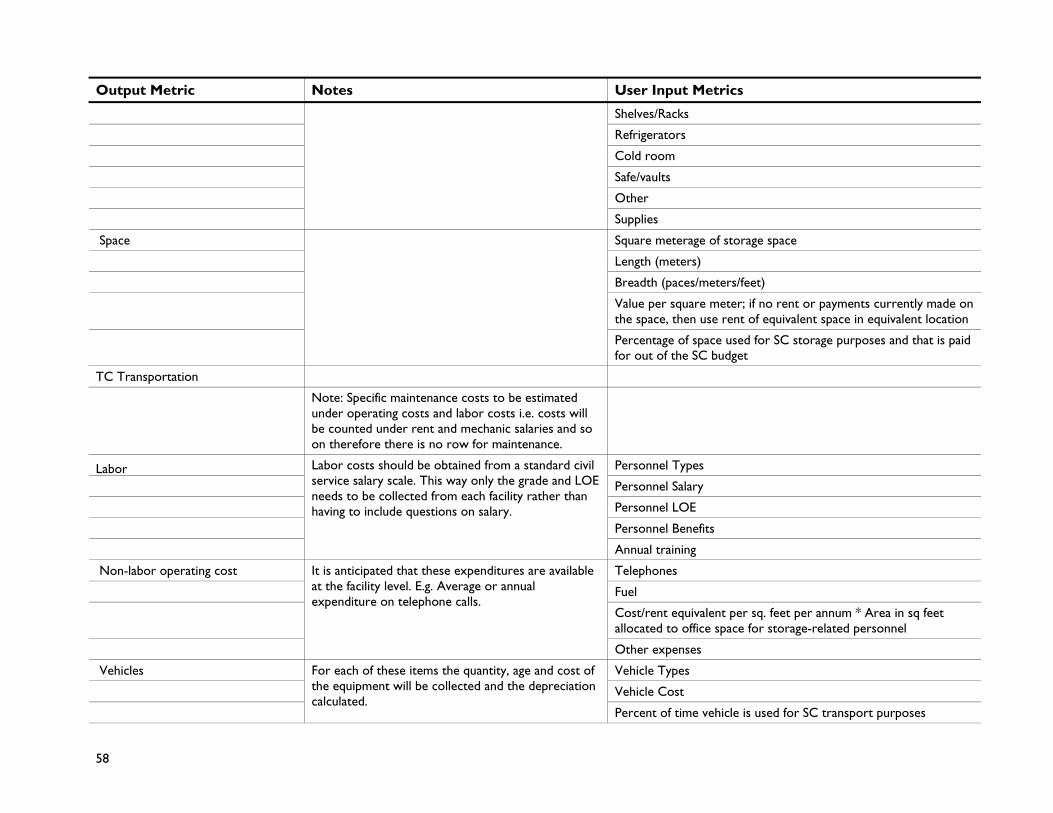
Output Metric Notes User Input Metrics
Information Systems
Labor Labor costs should be obtained from a standard civil Personnel Types service salary scale This way only the grade and LOE Personnel Salary needs to be collected from each facility rather than having to include questions on salary Personnel LOE spent on SC-related storage activities ()
Personnel Benefits
Annual training expenditures
Quality Assurance
Labor Labor costs should be obtained from a standard civil service salary scale This way only the grade and LOE needs to be collected from each facility rather than having to include questions on salary
Personnel Types
Personnel Salary
Personnel LOE spent on SC-related storage activities ()
Personnel Benefits
Annual training expenditures
59
60
Appendix 12
Contact List Contact Title Organization
Albert Lupupa Chief Purchasing and Supplies Officer
Drug Procurement Office Ministry of Health
Tom Brown Director of Logistics Medical Stores Limited
Mulenga Muleba Deputy Country Manager Crown Agents - Zambia
Edward Kabwe Director of Finance and Administration
Medical Stores Limited
Abel Phiri Transport Manager Medical Stores Limited
Kwasi Torpey Director Technical Support ZPCT
Gail Bryant Senior Advisor Pharmaceutical Management
ZPCT
Yebo Gondwe ZPCT
Lona Mwenda Program Officer ZPCT
Kelly McCoy Project Manager CIHDZ
Joshua Kasimba CIHDZ
Chipupu Kandeke Manager Pharmaceutical Services CHAZ Church Health Association Zambia (CHAZ)
Shadreck Malupenga Logistics CHAZ Christian Health Association Zambia
Osward A Nyenda Manager Operations Ngansa Pharmaceuticals Ltd
Bjorn von Hofsten Director Pharmacist Ngansa Pharmaceuticals Ltd
Maxwell Kasonde Morgan Phiri District Pharmacy Programme Coordinators
Lusaka Main DHMT
Jack Menke Program Manager Kara Clinic Lusaka
Mrs Chileshe In-charge ARV Pharm Technician Mtendere Health Centre Lusaka Main
Happy Chiporu Mosia Muhango In-charge ARV Pharm Technician Chilenge Lusaka Main
Mrs Mtonge Lisa Siame In-charge ARV Pharm Technician Bauleni Health Centre Lusaka Main
Dr Isaac Banda Director Mpongwe DHMT
Gladys Mpagwe ARV Pharm Technician Mpongwe Mission Hospital
Florida Mumba Esther Zimba In-charge ARV Pharm Technician Mikata Health Centre
Sister Chanshi Director ARV Pharm Technician St Theresas Hospital
Mercy ZPCT Ndola
61
Contact Title Organization
Lilian Nyerbwa Manager Planning Ndola DHMT
James Simulwke Pharmacist Ndola DHMT
Chiryimba Musonda Pharmacist Technician Ndola DHMT
Ignatius Chikoti Assistant Accountant Ndola DHMT
Matthew Mwute Hanzooma Hatwiko
Head of Pharmacy Dispensing ARV Pharmacist
Arthur Davidson Childrenrsquos Hospital Ndola
Dr Dande Malawo Dr Masase Mwape Kunda Royd Ngoma
Executive Director Clinical Director Dispensing ARV Pharmacist Store Pharmacist
Ndola Central Mission Hospital
Mrs Mwambi Nurse In-Charge Lubutu Health Centre Ndola
Sister Elizabeth Njovu Nurse In-Charge Kavu Rural Health Centre Ndola
Deborah Connor Country Director EGPAF
Mbaweni Mwanza Deputy Director Finance and Administration
SCMS and USAID | DELIVER PROJECT
Peter Lisulo Senior Public Health Logistics Officer
SCMS and USAID | DELIVER PROJECT
Walter Proper Country Director SCMS and USAID | DELIVER PROJECT
Wendy Nicodemus Senior Technical Advisor SCMS and USAID | DELIVER PROJECT
Paul Kamuna Public Health Logistics Officer SCMS and USAID | DELIVER PROJECT
David Papworth Deputy Country Director SCMS and USAID | DELIVER PROJECT
62
For more information please visit deliverjsicom
USAID | DELIVER PROJECT
John Snow Inc
1616 Fort Myer Drive 11th Floor
Arlington VA 22209 USA
Phone 703-528-7474
Fax 703-528-7480
Email askdeliverjsicom
Internet deliverjsicom
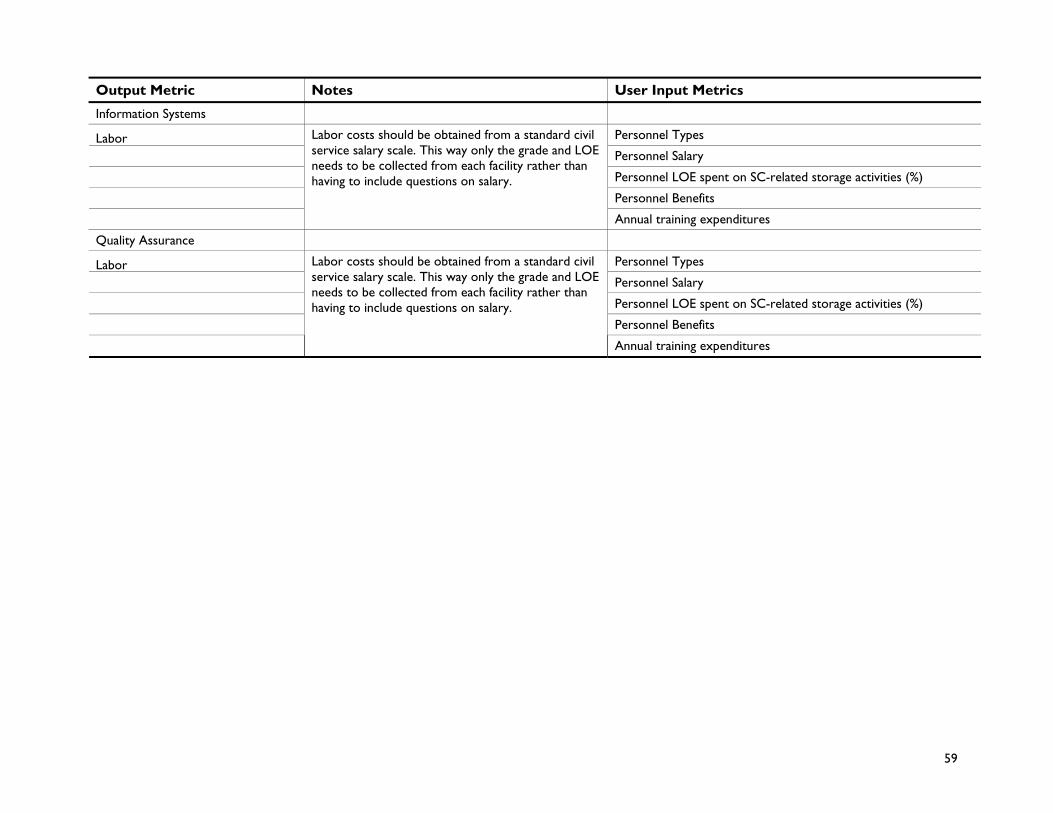
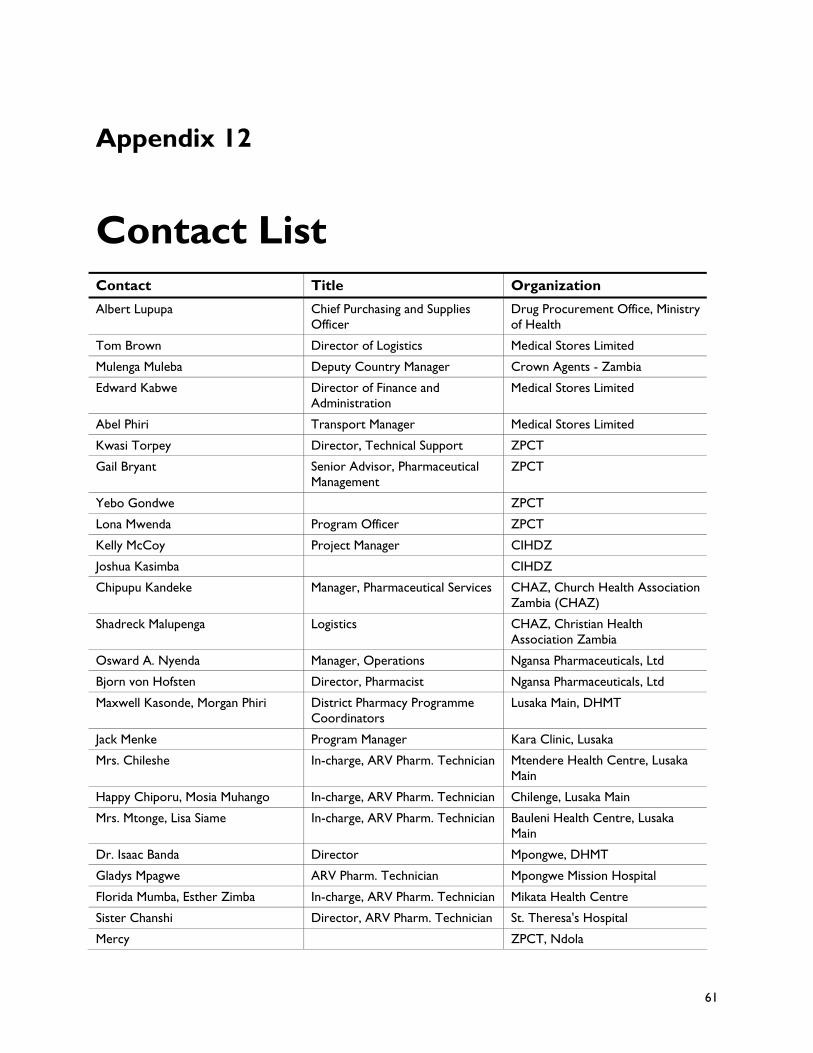
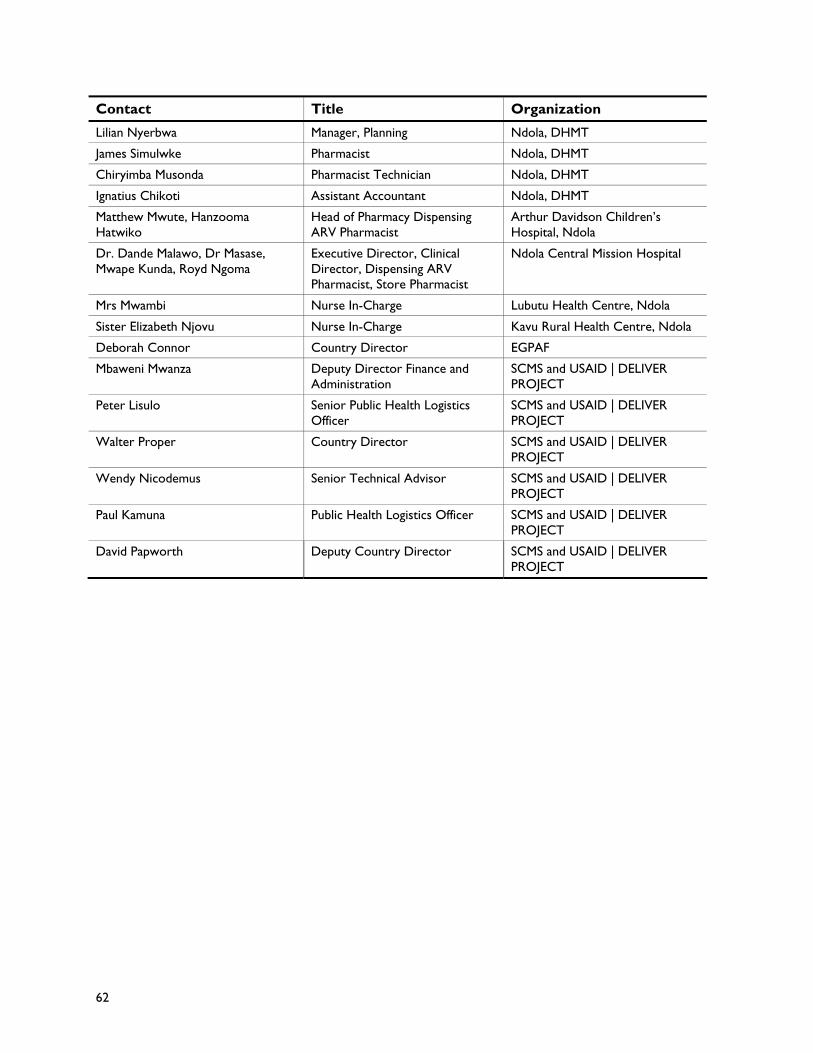
For more information please visit deliverjsicom
USAID | DELIVER PROJECT
John Snow Inc
1616 Fort Myer Drive 11th Floor
Arlington VA 22209 USA
Phone 703-528-7474
Fax 703-528-7480
Email askdeliverjsicom
Internet deliverjsicom
USAID | DELIVER PROJECT
John Snow Inc
1616 Fort Myer Drive 11th Floor
Arlington VA 22209 USA
Phone 703-528-7474
Fax 703-528-7480
Email askdeliverjsicom
Internet deliverjsicom