Embed Size (px)
DESCRIPTION
Citation preview
2
▪ National level HIV prevalence data suggest that HIV prevalence has stabilized– In adults aged 15-49 years, HSRC
surveys estimated HIV prevalence at 15.6% (2002), 16.2% (2005), and 16.9% (2008)
▪ Although HIV prevalence is stable, the total number of PLHIV1 is rising (~100,000/year) due to population growth and reduction of mortality due to ARVs
▪ On average, females are infected about five years earlier than males, with 7% of young women aged 15-19, and 14% of pregnant teenage girls, already infected
▪ Females have a statistically significant, higher HIV prevalence than men, nationally and in 7 of the 9 provinces (not in N Cape and North-West)
South Africa faces the world’s worst HIV epidemic –HIV prevalence seems to have stabilized, but at a very high level
SOURCE: KYE/KYR reports, 2011; Spectrum estimations and mid-year population estimates from www.statssa.gov.za
0
1,000,000
2,000,000
3,000,000
4,000,000
5,000,000
6,000,000
0
10
20
30
40
50
921990 2008060402200098
Number(infected, newly infected, died)
9694
PopulationMillions
AIDS-related deaths
Annual new HIV infections
People living with HIV
Total population
1 People Living with HIV/AIDS
3
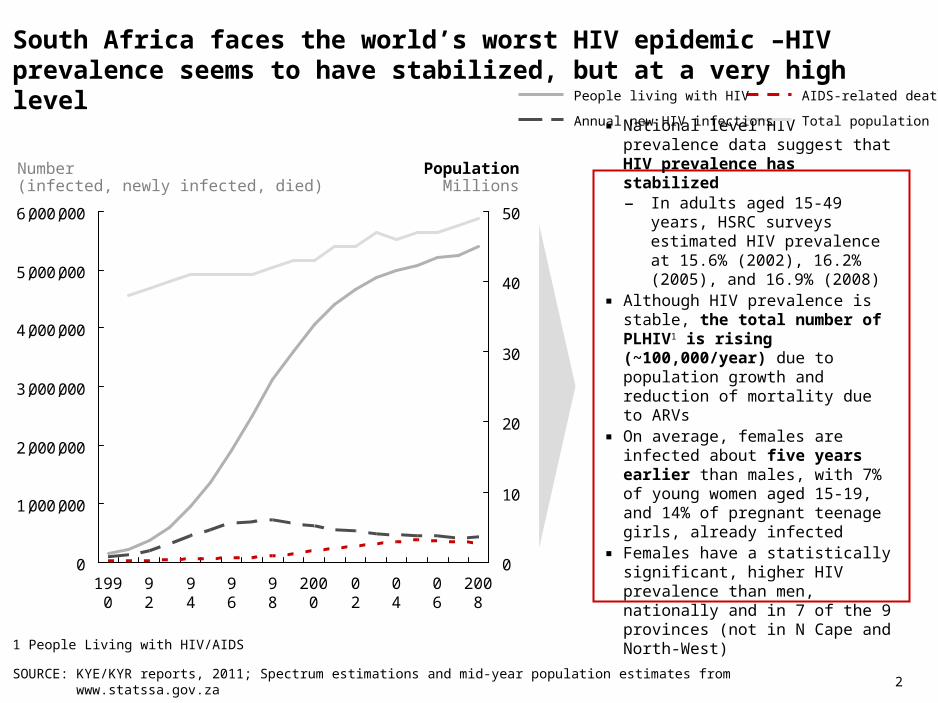
ARV roll-out is driving HIV prevalence up even further
SOURCE: HSRC survey reports; ART-adjusted data: Rehle et al., 2010; KYE/KYR reports, 2011
▪ ART has begun to have an important effect on HIV preva-lence levels (adding ~2% to HIV prevalence through PLHIV who would already have died in the absence of ART)
▪ The life-prolonging effect of ART is the chief reason for the observed increases in HIV prevalence in older people. This ‘ART effect’ is estimated to be largest in people in the mid-20s to late 40s
0
2
4
6
8
10
12
14
16
18
HIV prevalencePercent
2002
2006 2008
2008, ART adjusted
Pre-2002 level
4
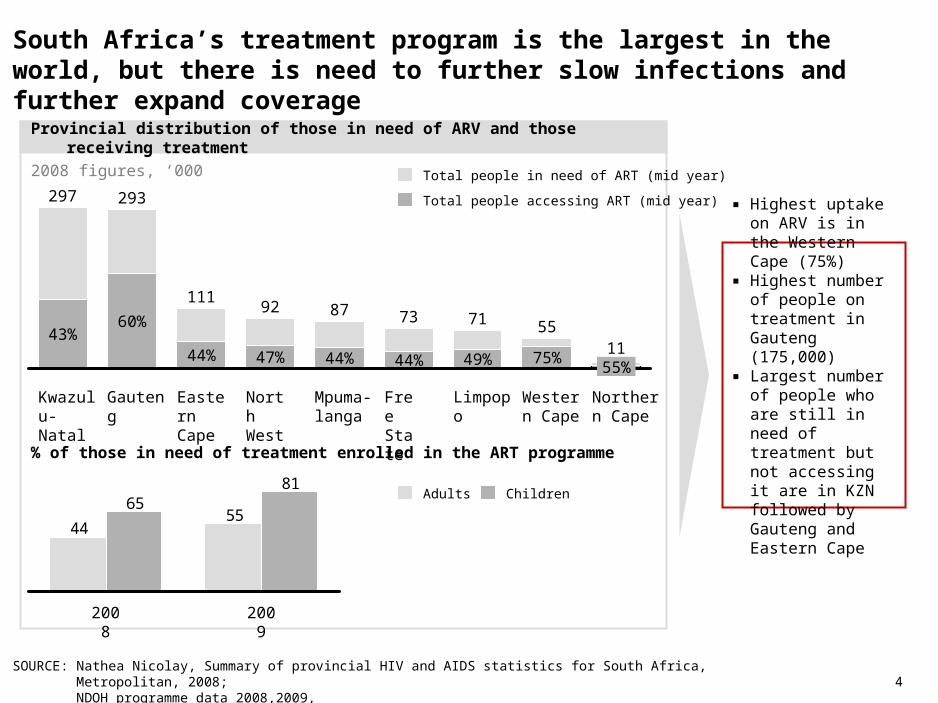
South Africa’s treatment program is the largest in the world, but there is need to further slow infections and further expand coverage
SOURCE: Nathea Nicolay, Summary of provincial HIV and AIDS statistics for South Africa, Metropolitan, 2008; NDOH programme data 2008,2009,
▪ Highest uptake on ARV is in the Western Cape (75%)
▪ Highest number of people on treatment in Gauteng (175,000)
▪ Largest number of people who are still in need of treatment but not accessing it are in KZN followed by Gauteng and Eastern Cape
Provincial distribution of those in need of ARV and those receiving treatment
2008 figures, ‘000
5544
8165
2008 2009
% of those in need of treatment enrolled in the ART programme
ChildrenAdults
297
43%73 7187
Mpuma-langa
44%
Free State
49%
North West
44%
92
293
47%
Eastern Cape
60%
111
44%
Kwazulu-Natal
Gauteng Western Cape
55
75%
Limpopo Northern Cape
1155%
Total people accessing ART (mid year)
Total people in need of ART (mid year)
5
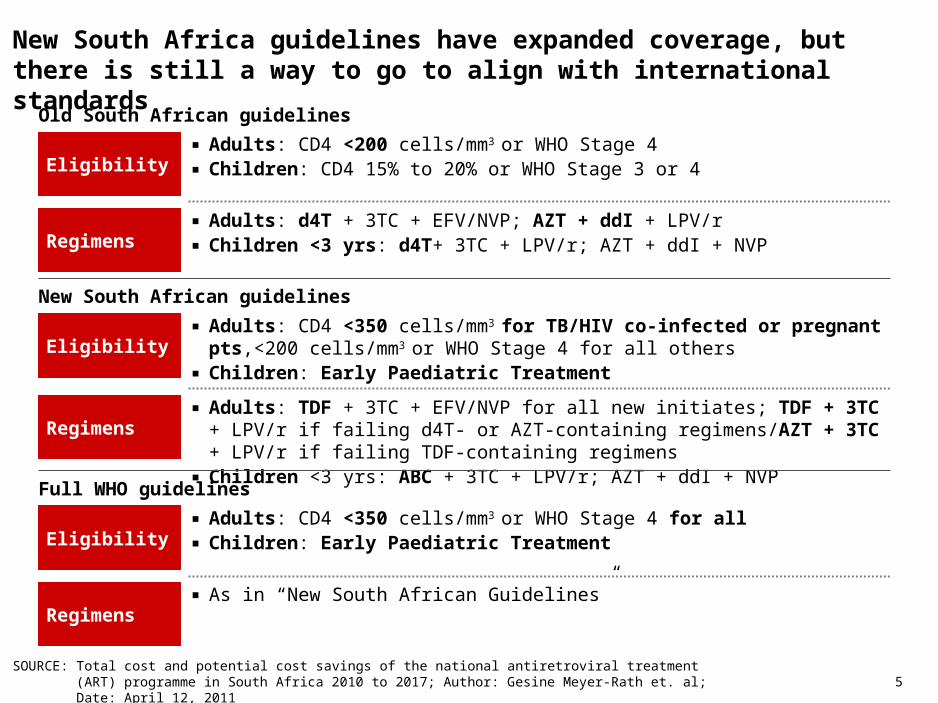
New South Africa guidelines have expanded coverage, but there is still a way to go to align with international standards
Old South African guidelines
Eligibility▪ Adults: CD4 <200 cells/mm3 or WHO Stage 4▪ Children: CD4 15% to 20% or WHO Stage 3 or 4
Regimens▪ Adults: d4T + 3TC + EFV/NVP; AZT + ddI + LPV/r▪ Children <3 yrs: d4T+ 3TC + LPV/r; AZT + ddI + NVP
New South African guidelines
Eligibility▪ Adults: CD4 <350 cells/mm3 for TB/HIV co-infected or pregnant pts,<200
cells/mm3 or WHO Stage 4 for all others▪ Children: Early Paediatric Treatment
Regimens▪ Adults: TDF + 3TC + EFV/NVP for all new initiates; TDF + 3TC + LPV/r if failing d4T-
or AZT-containing regimens/AZT + 3TC + LPV/r if failing TDF-containing regimens▪ Children <3 yrs: ABC + 3TC + LPV/r; AZT + ddI + NVP
Full WHO guidelines
Eligibility▪ Adults: CD4 <350 cells/mm3 or WHO Stage 4 for all▪ Children: Early Paediatric Treatment
Regimens▪ As in “New South African Guidelines”
SOURCE: Total cost and potential cost savings of the national antiretroviral treatment (ART) programme in South Africa 2010 to 2017; Author: Gesine Meyer-Rath et. al; Date: April 12, 2011
6
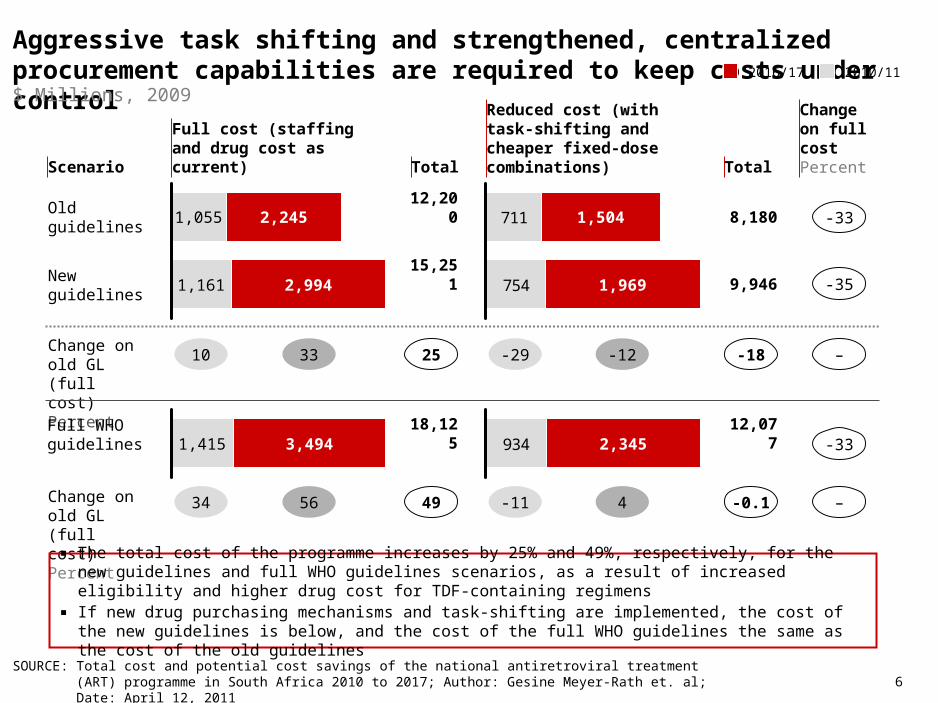
Aggressive task shifting and strengthened, centralized procurement capabilities are required to keep costs under control
SOURCE: Total cost and potential cost savings of the national antiretroviral treatment (ART) programme in South Africa 2010 to 2017; Author: Gesine Meyer-Rath et. al; Date: April 12, 2011
2,245
New guidelines 1,161 2,994
Old guidelines 1,055
2010/112016/17
711
754 1,969
1,504 8,180
9,946
-33
-35
Change on old GL (full cost)Percent
10 33 -29 -12 -18 –
Full WHOguidelines
1,415 3,494 934 2,345 12,077 -33
Reduced cost (with task-shifting and cheaper fixed-dose combinations) Total
Full cost (staffing and drug cost as current) TotalScenario
Change on full costPercent
Change on old GL (full cost)Percent
34 56
12,200
15,251
25
18,125
49 -11 4 -0.1 –
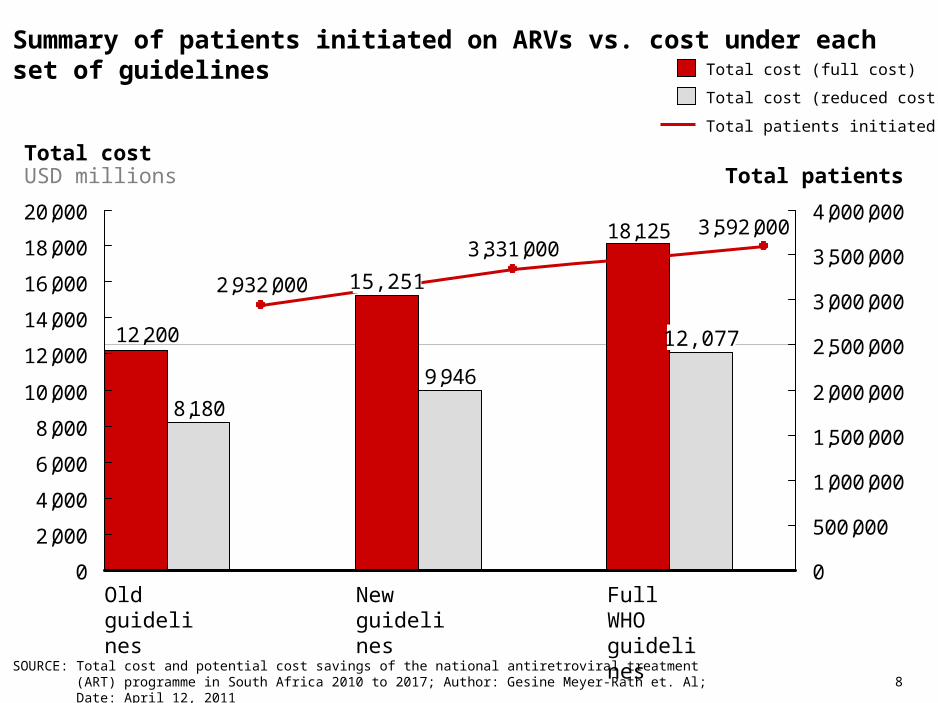
▪ The total cost of the programme increases by 25% and 49%, respectively, for the new guidelines and full WHO guidelines scenarios, as a result of increased eligibility and higher drug cost for TDF-containing regimens
▪ If new drug purchasing mechanisms and task-shifting are implemented, the cost of the new guidelines is below, and the cost of the full WHO guidelines the same as the cost of the old guidelines
$ Millions, 2009
7
10
8
8
13
10
9
15
12
10
Full WHO guidelines
New guidelines
Old guidelines
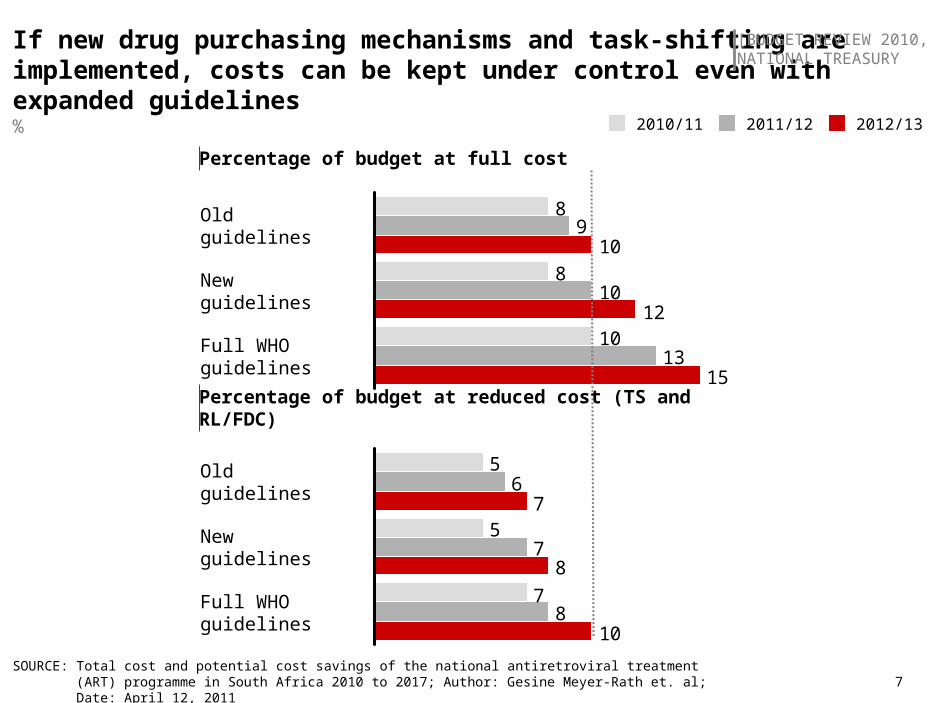
If new drug purchasing mechanisms and task-shifting are implemented, costs can be kept under control even with expanded guidelines
SOURCE: Total cost and potential cost savings of the national antiretroviral treatment (ART) programme in South Africa 2010 to 2017; Author: Gesine Meyer-Rath et. al; Date: April 12, 2011
[BUDGET REVIEW 2010,NATIONAL TREASURY
2012/132011/122010/11
7
5
5
8
7
6
10
8
7
Full WHO guidelines
New guidelines
Old guidelines
%
Percentage of budget at full cost
Percentage of budget at reduced cost (TS and RL/FDC)
8
Summary of patients initiated on ARVs vs. cost under each set of guidelines
SOURCE: Total cost and potential cost savings of the national antiretroviral treatment (ART) programme in South Africa 2010 to 2017; Author: Gesine Meyer-Rath et. Al; Date: April 12, 2011
9,946
8,180
18,125
12,200
3,592,0003,331,000
2,932,000
0
2,000
4,000
6,000
8,000
10,000
12,000
14,000
16,000
18,000
20,000
0
500,000
1,000,000
1,500,000
2,000,000
2,500,000
3,000,000
3,500,000
4,000,000
Total costUSD millions Total patients
12,077
Full WHO guidelines
New guidelines
15,251
Old guidelines
Total cost (full cost)
Total cost (reduced cost)
Total patients initiated on ART
9
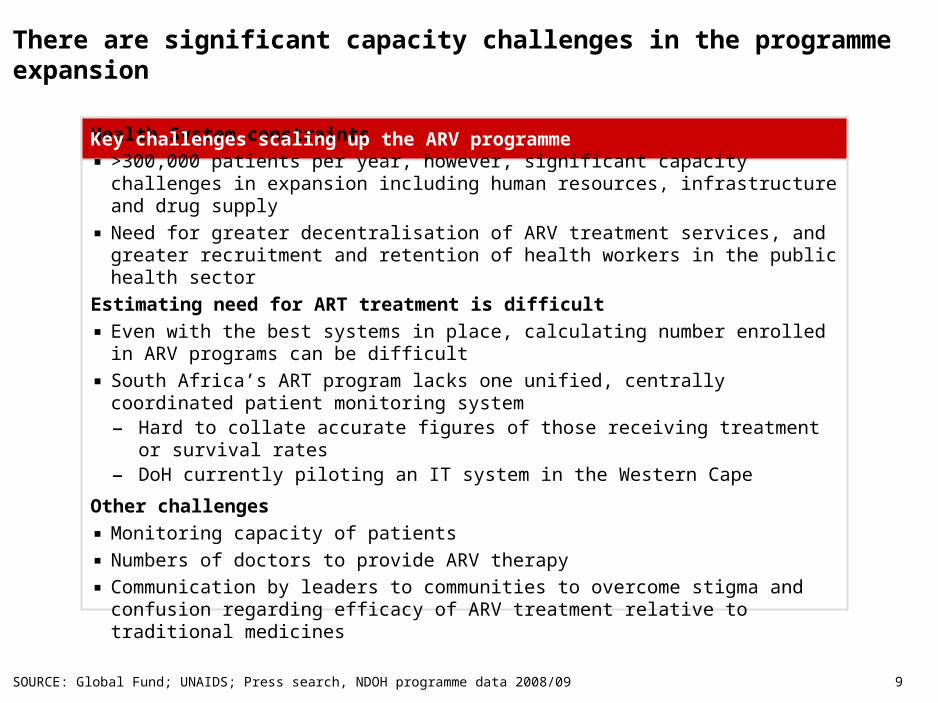
Health System constraints
▪ >300,000 patients per year, however, significant capacity challenges in expansion including human resources, infrastructure and drug supply
▪ Need for greater decentralisation of ARV treatment services, and greater recruitment and retention of health workers in the public health sector
Estimating need for ART treatment is difficult
▪ Even with the best systems in place, calculating number enrolled in ARV programs can be difficult
▪ South Africa’s ART program lacks one unified, centrally coordinated patient monitoring system– Hard to collate accurate figures of those receiving treatment or survival rates– DoH currently piloting an IT system in the Western Cape
Other challenges
▪ Monitoring capacity of patients
▪ Numbers of doctors to provide ARV therapy
▪ Communication by leaders to communities to overcome stigma and confusion regarding efficacy of ARV treatment relative to traditional medicines
SOURCE: Global Fund; UNAIDS; Press search, NDOH programme data 2008/09
There are significant capacity challenges in the programme expansion
Key challenges scaling up the ARV programme
10 SOURCE: Global Fund; UNAIDS; Press search, NDOH programme data 2008/09
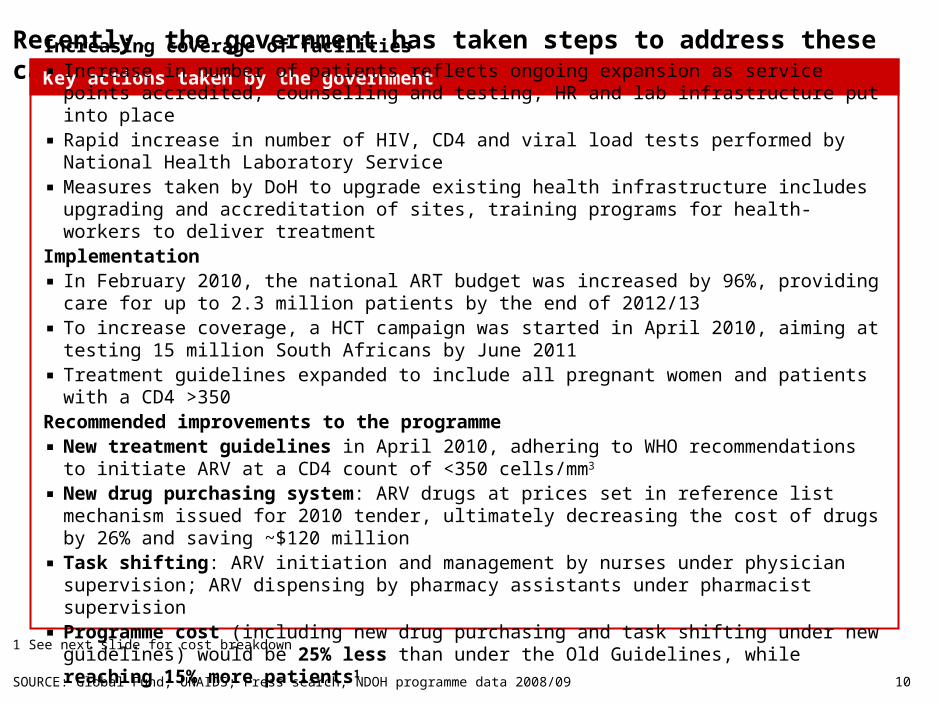
Recently, the government has taken steps to address these capacity gapsKey actions taken by the government
Increasing coverage of facilities▪ Increase in number of patients reflects ongoing expansion as service points accredited, counselling and
testing, HR and lab infrastructure put into place▪ Rapid increase in number of HIV, CD4 and viral load tests performed by National Health Laboratory
Service▪ Measures taken by DoH to upgrade existing health infrastructure includes upgrading and accreditation
of sites, training programs for health-workers to deliver treatmentImplementation▪ In February 2010, the national ART budget was increased by 96%, providing care for up to 2.3 million
patients by the end of 2012/13 ▪ To increase coverage, a HCT campaign was started in April 2010, aiming at testing 15 million South
Africans by June 2011▪ Treatment guidelines expanded to include all pregnant women and patients with a CD4 >350Recommended improvements to the programme▪ New treatment guidelines in April 2010, adhering to WHO recommendations to initiate ARV at a CD4
count of <350 cells/mm3
▪ New drug purchasing system: ARV drugs at prices set in reference list mechanism issued for 2010 tender, ultimately decreasing the cost of drugs by 26% and saving ~$120 million
▪ Task shifting: ARV initiation and management by nurses under physician supervision; ARV dispensing by pharmacy assistants under pharmacist supervision
▪ Programme cost (including new drug purchasing and task shifting under new guidelines) would be 25% less than under the Old Guidelines, while reaching 15% more patients1
1 See next slide for cost breakdown
11
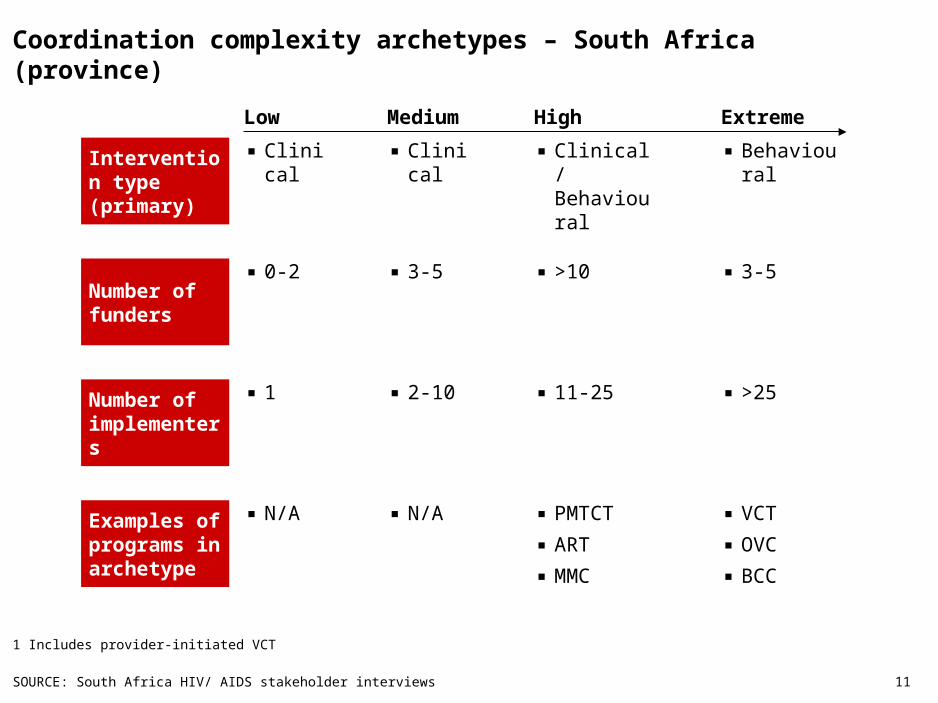
Coordination complexity archetypes – South Africa (province)
1 Includes provider-initiated VCT
SOURCE: South Africa HIV/ AIDS stakeholder interviews
Medium HighLow Extreme
Intervention type (primary)
▪ Clinical ▪ Clinical ▪ Clinical/ Behavioural
▪ Behavioural
Number of funders
▪ 0-2 ▪ 3-5 ▪ >10 ▪ 3-5
Number of implementers
▪ 1 ▪ 2-10 ▪ 11-25 ▪ >25
Examples of programs in archetype
▪ N/A ▪ N/A ▪ PMTCT
▪ ART
▪ MMC
▪ VCT
▪ OVC
▪ BCC
12
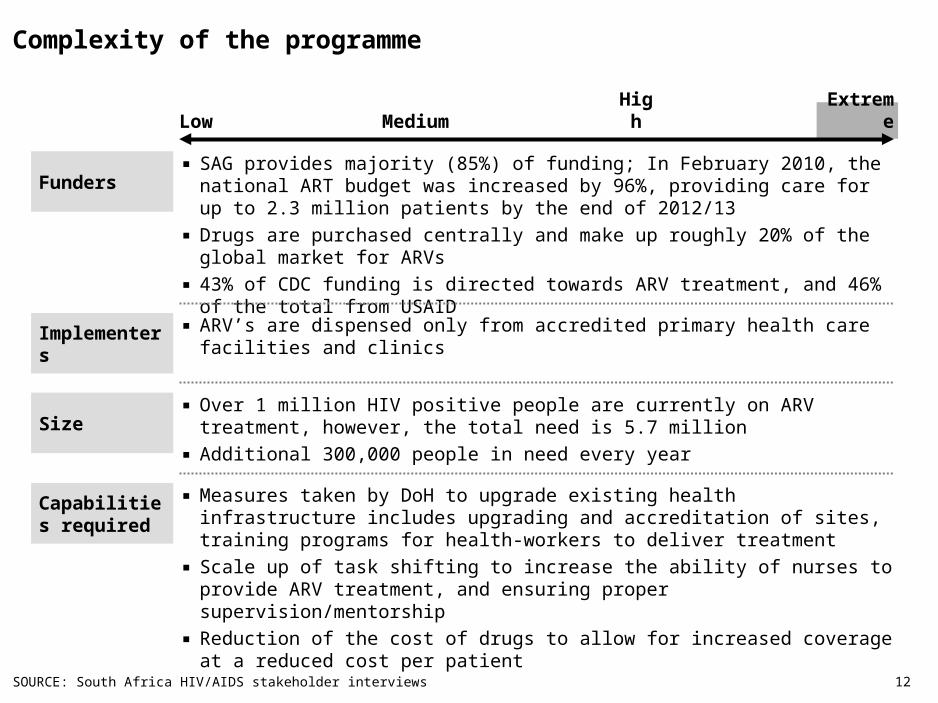
Complexity of the programme
LowMediu
mHig
hExtrem
e
Funders▪ SAG provides majority (85%) of funding; In February 2010, the national ART budget
was increased by 96%, providing care for up to 2.3 million patients by the end of 2012/13
▪ Drugs are purchased centrally and make up roughly 20% of the global market for ARVs
▪ 43% of CDC funding is directed towards ARV treatment, and 46% of the total from USAID
Implementers▪ ARV’s are dispensed only from accredited primary health care facilities and clinics
Size▪ Over 1 million HIV positive people are currently on ARV treatment, however, the total
need is 5.7 million
▪ Additional 300,000 people in need every year
▪ Measures taken by DoH to upgrade existing health infrastructure includes upgrading and accreditation of sites, training programs for health-workers to deliver treatment
▪ Scale up of task shifting to increase the ability of nurses to provide ARV treatment, and ensuring proper supervision/mentorship
▪ Reduction of the cost of drugs to allow for increased coverage at a reduced cost per patient
Capabilities required
SOURCE: South Africa HIV/AIDS stakeholder interviews
13
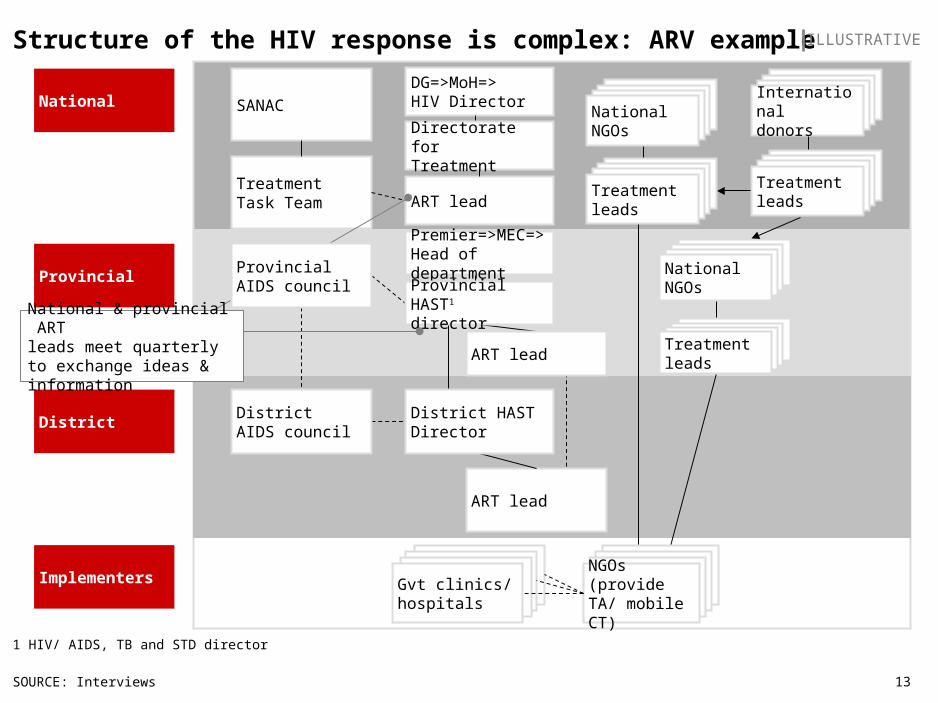
Structure of the HIV response is complex: ARV example
SOURCE: Interviews
1 HIV/ AIDS, TB and STD director
ILLUSTRATIVE
ART lead
Provincial
National
District
SANAC
TreatmentTask Team
ART lead
NGOsNGOsNGOsGvt clinics/ hospitals
NGOsNGOsNGOsNGOs (provideTA/ mobile CT)
Implementers
NGOsNGOsNGOsNationalNGOs
NGOsNGOsNGOsTreatmentleads
DistrictAIDS council
DG=>MoH=>HIV Director
Directorate for Treatment
Premier=>MEC=>Head of department
District HASTDirector
Provincial HAST1
director
ART lead
National & provincial ARTleads meet quarterly to exchange ideas & information
Provincial AIDS council
NGOsNGOsNGOsTreatmentleads
NGOsNGOsNGOsTreatmentleads
NGOsNGOsNGOsNationalNGOs
NGOsNGOsNGOsInternationaldonors
14 14
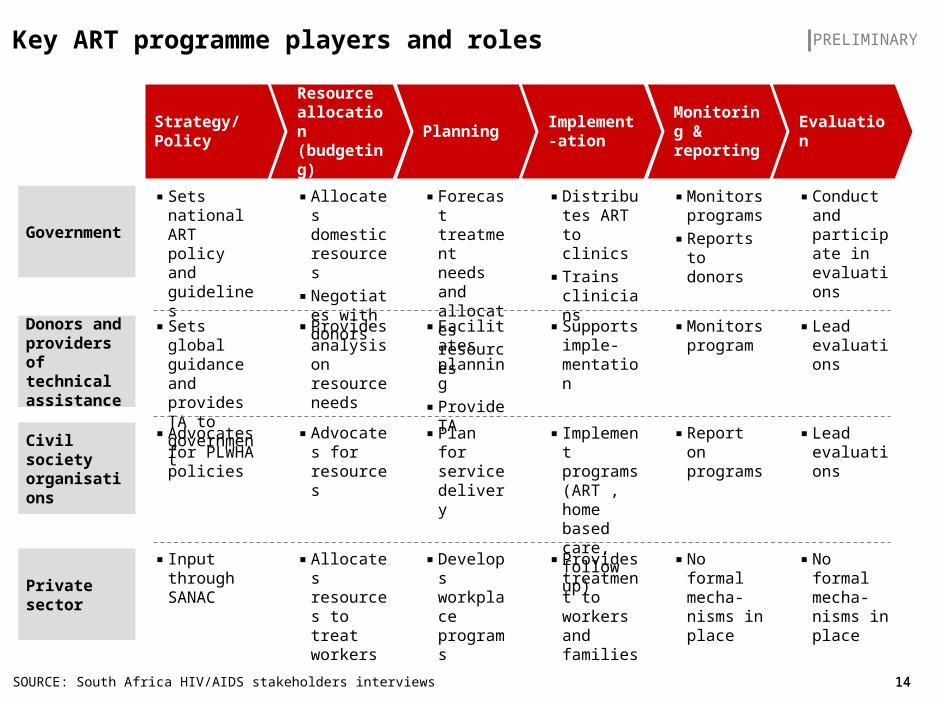
Key ART programme players and roles
SOURCE: South Africa HIV/AIDS stakeholders interviews
PRELIMINARY
Strategy/ Policy
Resource allocation (budgeting)
PlanningImplement-ation
Monitoring & reporting
Evaluation
Donors and providers of technical assistance
▪ Provides analysis on resource needs
▪ Facilitates planning
▪ Provide TA
▪ Supports imple-mentation
▪ Monitors program
▪ Lead evaluations
▪ Sets global guidance and provides TA to government
Civil society organisations
▪ Advocates for resources
▪ Plan for service delivery
▪ Implement programs (ART , home based care, follow up)
▪ Report on programs
▪ Lead evaluations
▪ Advocates for PLWHA policies
▪ Allocates domestic resources
▪ Negotiates with donors
▪ Forecast treatment needs and allocates resources
▪ Monitors programs
▪ Reports to donors
▪ Conduct and participate in evaluations
▪ Sets national ART policy and guidelines
Government
▪ Distributes ART to clinics
▪ Trains clinicians
Private sector
▪ Allocates resources to treat workers
▪ Develops workplace programs
▪ Provides treatment to workers and families
▪ No formal mecha-nisms in place
▪ No formal mecha-nisms in place
▪ Input through SANAC
15
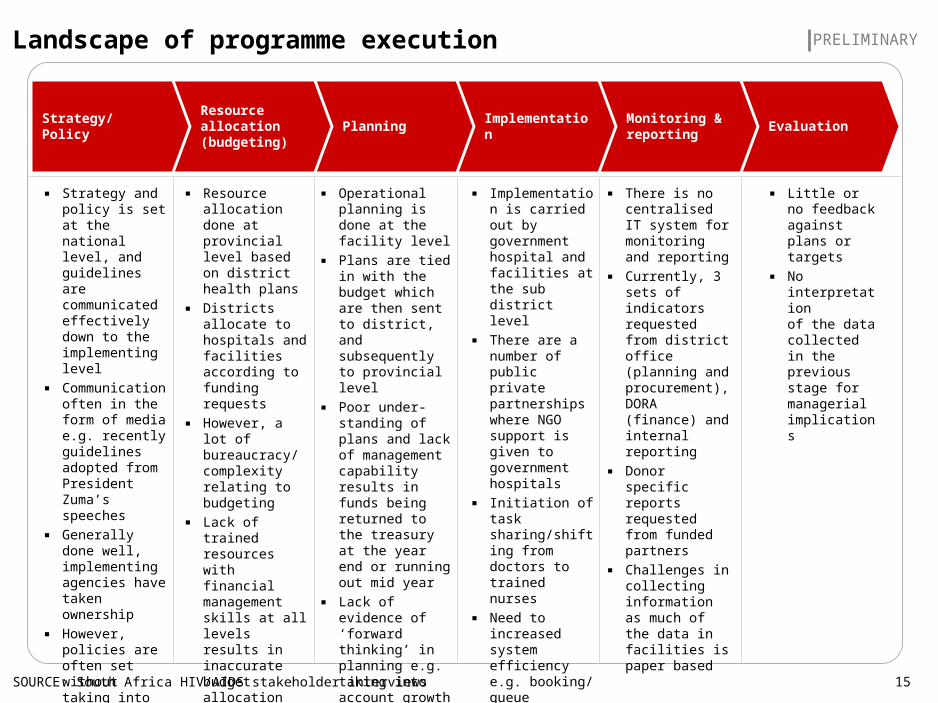
Landscape of programme execution
SOURCE: South Africa HIV/AIDS stakeholder interviews
PRELIMINARY
Strategy/ PolicyResource allocation (budgeting)
Planning ImplementationMonitoring & reporting
Evaluation
▪ Strategy and policy is set at the national level, and guidelines are communicated effectively down to the implementing level
▪ Communication often in the form of media e.g. recently guidelines adopted from President Zuma’s speeches
▪ Generally done well, implementing agencies have taken ownership
▪ However, policies are often set without taking into account capacity constraints
▪ Resource allocation done at provincial level based on district health plans
▪ Districts allocate to hospitals and facilities according to funding requests
▪ However, a lot of bureaucracy/ complexity relating to budgeting
▪ Lack of trained resources with financial management skills at all levels results in inaccurate budget allocation
▪ Issues around drug supply from the depot
▪ Operational planning is done at the facility level
▪ Plans are tied in with the budget which are then sent to district, and subsequently to provincial level
▪ Poor under-standing of plans and lack of management capability results in funds being returned to the treasury at the year end or running out mid year
▪ Lack of evidence of ‘forward thinking’ in planning e.g. taking into account growth
▪ Implementation is carried out by government hospital and facilities at the sub district level
▪ There are a number of public private partnerships where NGO support is given to government hospitals
▪ Initiation of task sharing/shifting from doctors to trained nurses
▪ Need to increased system efficiency e.g. booking/ queue management
▪ DoH chosen IT system to pilot
▪ There is no centralised IT system for monitoring and reporting
▪ Currently, 3 sets of indicators requested from district office (planning and procurement), DORA (finance) and internal reporting
▪ Donor specific reports requested from funded partners
▪ Challenges in collecting information as much of the data in facilities is paper based
▪ Little or no feedback against plans or targets
▪ No interpretationof the data collected in the previous stage for managerial implications
16
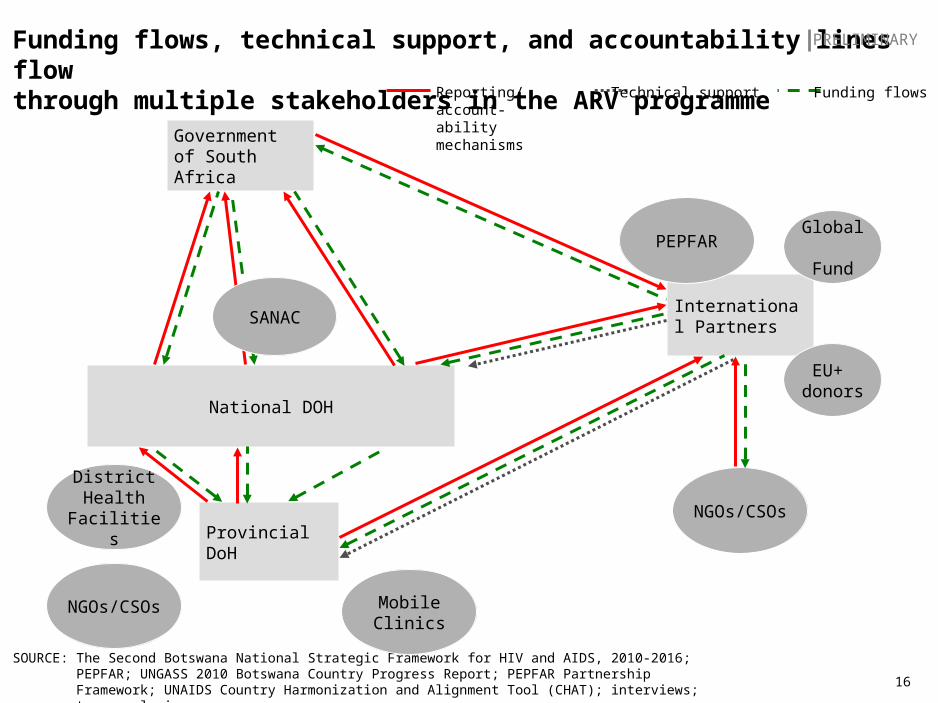
Funding flows, technical support, and accountability lines flow through multiple stakeholders in the ARV programme
Funding flowsReporting/account-ability mechanisms
Technical support
SOURCE: The Second Botswana National Strategic Framework for HIV and AIDS, 2010-2016; PEPFAR; UNGASS 2010 Botswana Country Progress Report; PEPFAR Partnership Framework; UNAIDS Country Harmonization and Alignment Tool (CHAT); interviews; team analysis
District Health
Facilities
NGOs/CSOs
International Partners
Government of South Africa
National DOH
Mobile Clinics
Provincial DoH
SANAC
NGOs/CSOs
EU+ donors
PEPFAR Global Fund
PRELIMINARY