Embed Size (px)
Citation preview
Abstract—From traditional times the Z score values have
been constantly used for prediction of Bankruptcy. This has
been vital to both the lenders and investors whose returns are
based on solvency estimates. The terms of credit have gone a U
turn from the traditional times to the modern scenario today.
The basic concern of prediction is to evaluate the terms of
credit and ensure repayment safely. Z score has been used as a
tool to evaluate the credibility of the firms. This paper provides
the Z score value for the public sector banks. This value is
useful when these banks demand loans from the RBI or any
other funding agency. The usage of back propagation neural
network is to forecast the internal parameters of Z score and
then use these internal parameters to forecast the Z score value
up to 2020. Thus the paper emphasizes the usage of BPNN for
prediction of bankruptcy for public sector banks in India.
Index Terms—Bankruptcy, internal parameters of Z score
Prediction, Z score value.
I. INTRODUCTION
Looking into the scenario of business today the enhancing
uncertainty scenario takes away the surety of existence
from firms. Perhaps to be sure of the longevity of the firm
becomes the prime issue of concern by all the business
houses. The viability of banks holds prime importance as it
relates to financial investments, funding, capacity building
and expansion by ploughing back profits. Z score has been
used as a tool to evaluate the credibility of the firms. This
paper provides the Z score value for the public sector banks.
This value is useful when these banks demand loans from
the RBI or any other funding agency. The usage of back
propagation neural network is to forecast the internal
parameters of Z score and then use these internal parameters
to forecast the Z score value up to 2020. Thus the paper
emphasizes the usage of BPNN for prediction of bankruptcy
for public sector banks in India. The research focus on three
banks that are considered in the big, medium and small
capital norms being Oriental Bank of Commerce, Punjab
National Bank and State Bank of India. The paper is divided
into sections. Section I gives the introduction about the
research done in the paper, Section II discusses the
bankruptcy scenario related to Z score, Section III describes
the model design and methodology, Section IV discusses the
BPNN Model application in Z Score for Public Sector banks
in India, Section V evaluates the predictions of internal
parameters of Z score, Section VI brings forth the findings
and the last Section VII sums up the research.
Manuscript received May 24, 2014; revised August 26, 2014.
Roli Pradhan is with the Department of Management, NITTTR, Bhopal
(e-mail: [email protected].)
II. LITERATURE SURVEY
Several researches have been conducted in the area.
O’Leary [1] argues that prediction of bankruptcy probably is
one of the most important business decision-making
problems affecting the entire life span of a business, failure
results in a high cost from the collaborators (firms and
organizations), the society and the country’s economy [2].
Over the last 35 years, the topic of company failure
prediction has developed to a major research domain in
corporate finance [3]-[5]. Academic researchers from all
over the world have been developing a gigantic number of
corporate failure prediction models, based on various types
of modeling techniques [6]. Besides the classic cross-
sectional statistical methods, which have produced
numerous failure prediction models, researchers have also
been using several alternative methods for analyzing and
predicting business failure [7], [8]. To date, a clear overview
and discussion of the application of alternative methods in
corporate failure prediction is still lacking. Research has
shown that most business failure is caused by bad or poor
management [9]. This could be in the form of inexperienced
management styles, fraud, and rapid technological changes
amongst other variables. Financial failure may take the form
of bankruptcy or insolvency [10], [11]-[14]. Bankruptcy
refers to a condition where the total liabilities exceed the fair
value of assets. Financial statements are normally used to
gauge the performance of the firm and its management [15].
The financial statements commonly used are profit and loss
statement, balance sheet and cash flow statements. From the
financial statements, various ratios can be calculated to
assess the current performance future prospects of the
concerned firm [16], [17]. Some of the ratios used include
current ratio, quick ratio, and working capital to total debt,
total debt to total assets, profit margin to sales and return on
total assets. Perhaps the best way to avoid failure is to
examine the myriad explanations for business failure [18],
[19]. Studies carried out by Altman [20] used financial
ratios to predict occurrence of bankruptcy and he was able
to predict 94% correctly one year before bankruptcy
occurred and 72% two years before its actual occurrence.
Dimitras, Koksal, and Kale [21] pointed out that after 30
years of research on this topic. There is no generally
accepted model for business failure prediction that has its
basis in a causal specification of underlying economic
determinants. Because of the confusingly varied and
restrictive assumptions underlying these classic statistical
models, there is need to recourse to alternative methods.
Prior empirical studies of failure have concentrated
almost exclusively on financial ratio data, though other
studies of failure usually cite managerial variables as being
critical. The usefulness of ratio-based business failure
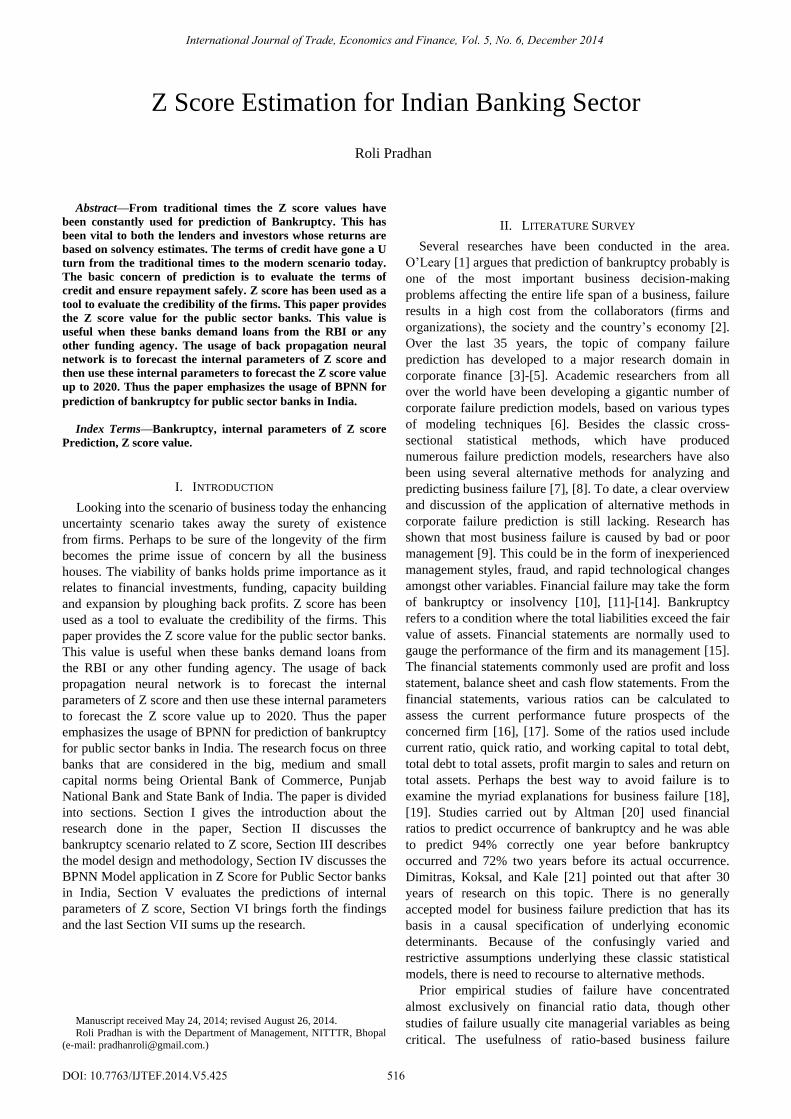
Z Score Estimation for Indian Banking Sector
Roli Pradhan
International Journal of Trade, Economics and Finance, Vol. 5, No. 6, December 2014
516DOI: 10.7763/IJTEF.2014.V5.425
prediction models has been questioned. For example, El-
Zayaty [22] find ratio models to be poor predictors of
bankruptcy of 132 businesses predicted to fail, and only 5
were discontinued over a five-year period. Ohlson JA
indicates that qualitative data can provide at least as good
predictions as traditional financial ratios. In Kenya, a study
on business failure prediction was done using discriminate
analysis. Kiragu [23] did another study on the prediction of
corporate failure using price adjusted accounting data. Kogi
[24] did an analysis of the discriminant corporate failure
prediction model based on stability of financial ratios.
Altman is known for the development of the Z-score
formula, which he published in 1968. The Z-score for
predicting Bankruptcy is a multivariate formula for a
measurement of the financial health of a company and a
powerful diagnostic tool that forecasts the probability of a
company entering bankruptcy within a 2 year period.
Studies measuring the effectiveness of the Z-score [25], [26]
have shown that the model has 70%-80% reliability. The Z
score analysis has been the base for research in this paper.
III. DESIGN AND METHODOLOGY
In this paper, a two step methodology has been adopted.
The part A provides the steps formulated for the prediction
of internal parameters of Z score, followed by part B which
enlists the steps followed for the prediction of Z score using
back propagation neural networks.
A. Formulation of Internal Parameters of Z Score Paper
Size
The basic ratios are formulated from details mentioned in
published statements like balance sheet, cash flow
statements, yearly details of banks, profit and loss
statements obtained from CMIE database, Reserve Bank of
India. Data is also taken from the official websites of the
banks and financial institutions and the internet.
Consequently this research work uses financial data i.e.
published time series data for the last 11 years from 2000 to
2009.
1) (Current Assets-Current Liabilities )/Total Assets
2) Retained Earnings/ Total Assets.
3) EBIT/ Total Assets
4) Equity/Total Liabilities
B. Prediction of Z Score Internal Parameters Using
BPNN
1) Catering to Neural Network inputs
2) Tolerance level Minimization
3) Data convergence using Neural Networks
4) Formulation of Absolute error
5) Prediction of ratios in each Ratios pillar
6) Data Validation
C. Altman Z Score Formula
T1 = (Current Assets-Current Liabilities) / Total Assets
T2 = Retained Earnings / Total Assets
T3 = Earnings before Interest and Taxes / Total Assets
T4 = Book Value of Equity / Total Liabilities
Z-Score Bankruptcy Model:
Z = 6.56T1 + 3.26T2 + 6.72T3 + 1.05T4
Zones of Discrimination:
Z > 2.6 -“Safe” Zone
1.1 < Z < 2.6 -“Grey” Zone
Z < 1.1 -“Distress” Zone
IV. BPNN MODEL APPLICATION IN Z SCORE FOR PUBLIC
SECTOR BANKS IN INDIA
The market capitalisation suggests certain that banks have
been predominantly capturing markets. Here three of them
have been selected for Z score analysis and forecasting.
These are Oriental Bank of Commerce, Punjab National
Bank and State Bank of India. The basic input sheets for all
the internal parameters are formulated for the three specified
banks in India. The process of input ratio formulation uses
the book formulae for computation of the ratios, which will
further be used as input parameters for Artificial Neural
Network. The Altman Z-score prediction uses the Neural
Network (1, 5, and 4). The number if input rows are 1. The
hidden layers are 5 and the outcomes are 4 internal
parameters. The input point is time and output has been the
required ratios. The period for input has been from 2000-
2008 which has been normalized from 1 to 8. The details of
the internal ratios and the values are enlisted in the Table I.
TABLE I: TRAINING PATTERN FOR INTERNAL PARAMETERS OF Z-SCORE
Public
Sector
Banks
Time Input Parameters
(CA-
CL)/
Total
Assets
Retained
Earnings/
Total
Assets
EBIT/
Total
Assets
Equity/
Total
Liabilities
OBC 2001 0.943326 0.04565 0.11216 0.007112
2002 0.924254 0.042033 0.109782 0.005968
2003 0.936343 0.041991 0.113615 0.005665
2004 0.93354 0.046744 0.098214 0.004695
2005 0.913661 0.045946 0.070938 0.003561
2006 0.909643 0.053183 0.074808 0.003267
2007 0.921352 0.066547 0.074801 0.003389
PNB 2001 0.865784 0.038987 0.081279 0.003921
2002 0.862777 0.041978 0.080515 0.003342
2003 0.870653 0.047153 0.076046 0.003639
2004 0.881733 0.051326 0.068712 0.003077
2005 0.872751 0.073619 0.062138 0.003081
2006 0.863976 0.06938 0.055071 0.002498
2007 0.894067 0.067643 0.056393 0.00217
SBI 2001 0.73659 0.049465 0.077749 0.002013
2002 0.781807 0.046565 0.077392 0.001667
2003 0.791241 0.047891 0.075746 0.001511
2004 0.796349 0.052424 0.064382 0.0014
2005 0.805242 0.057737 0.061314 0.001291
2006 0.837653 0.058967 0.058853 0.001144
2007 0.827194 0.061765 0.062825 0.001066
A Backpropogation Neural Network has been used to
transfer data sets. Trained network is used for prediction of
ratios for the forthcoming two years being 2008, 2009, and
2010. The initial weights of the neural paths were in the
range of -0.02 to 0.05. Convergence study of neural network
was carried out for difference tolerance error of
1,0.75,0.5,0.4,0.3,0.2,0.1,0.01,0.001. The predicted values
International Journal of Trade, Economics and Finance, Vol. 5, No. 6, December 2014
517
obtained from the neural network were compared with the
actual field data or the arithmetic computation done from the
published statements. The Table II provides the convergence
details for the internal parameters of Z score.
TABLE II: CONVERGENCE DETAILS FOR INTERNAL PARAMETERS OF Z-SCORE
Public
Sector
Banks
Tolerance Ratios 2008 2009 2010
Actual Predicted %Error Actual Predicted %Error Actual Predicted %Error
OBC 0.001 CA-CL)/
Total
Assets
0.9248 0.9284 -0.3926 0.9283 0.9305 -0.234 0.9548 0.9305 2.5420
Retained
Earnings/
Total
Assets
0.0590 0.0665 -12.809 0.0491 0.0665 -35.58 0.0451 0.0665 -47.4605
EBIT/
Total
Assets
0.0769 0.0673 12.5202 0.0882 0.0689 21.841 0.0834 0.0733 12.1179
Equity/
Total
Liabilities
0.0028 0.0036 -30.189 0.0022 0.0036 -63.70 0.0018 0.0036 -99.2469
Z Value 6.7790 6.8847 -1.5605 6.8445 6.9164 -1.049 6.9728 6.9237 0.7033
PNB 0.1 CA-CL)/
Total
Assets
0.89899 0.8759 2.56394 0.88504 0.8755 1.0778 0.89033 0.87512 1.70739
Retained
Earnings/
Total
Assets
0.06445 0.0639 0.78576 0.06444 0.0652 -1.269 0.06446 0.06631 -2.87319
EBIT/
Total
Assets
0.07405 0.0637 13.9209 0.08573 0.0618 27.851 0.07572 0.06008 20.65577
Equity/
Total
Liabilities
0.00194 0.0025 -30.526 0.00158 0.0024 -51.78 0.00128 0.00228 -78.9296
Z Value 6.60706 6.3522 3.85628 6.59373 6.3477 3.7309 6.56082 6.34370 3.30935
SBI 0.01 CA-CL)/
Total
Assets
0.8352 0.8205 1.7491 0.8104 0.8218 -1.402 0.8353 0.8228 1.4948
Retained
Earnings/
Total
Assets
0.0854 0.0650 23.9487 0.0794 0.0676 14.834 0.0677 0.0700 -3.3350
EBIT/
Total
Assets
0.0748 0.0594 20.5561 0.0791 0.0589 25.599 0.0635 0.0586 7.7366
Equity/
Total
Liabilities
0.0011 0.0010 6.0949 0.0009 0.0010 -15.64 0.0007 0.0010 -51.2262
Z Value 6.2630 6.0365 3.6177 6.1298 6.0484 1.3269 6.2630 6.0583 3.2683
TABLE III: PREDICTED VALUES FOR INTERNAL PARAMETERS OF Z-SCORE
Public Sector Bank Tolerance Years
Output for Internal Parameters
(CA-CL)/ Retained EBIT/ Equity/
Total Earnings/ Total Total
Assets Total Assets Liabilities
Assets
OBC 0.001 2009 0.93163 0.06600 0.06822 0.00370
2010 0.93180 0.06655 0.07204 0.00376
2011 0.93166 0.06655 0.07500 0.00382
2012 0.93154 0.06600 0.07697 0.00387
2013 0.93145 0.06680 0.07829 0.00391
2014 0.93139 0.06700 0.07923 0.00395
2015 0.93135 0.06710 0.07992 0.00397
2016 0.93128 0.06721 0.08321 0.00404
2017 0.93121 0.06737 0.08509 0.00408
2018 0.93115 0.06753 0.08698 0.00413
2019 0.93108 0.06768 0.08886 0.00417
2020 0.93101 0.06784 0.09074 0.00422
PNB 0.1 2009 0.87560 0.06541 0.06167 0.00239
2010 0.87520 0.06652 0.05975 0.00226
2011 0.87483 0.06742 0.05792 0.00214
2012 0.87451 0.06814 0.05622 0.00203
International Journal of Trade, Economics and Finance, Vol. 5, No. 6, December 2014
518
International Journal of Trade, Economics and Finance, Vol. 5, No. 6, December 2014
519
2013 0.87423 0.06872 0.05466 0.00193
2014 0.87398 0.06919 0.05324 0.00184
2015 0.87378 0.06957 0.05196 0.00177
2016 0.87338 0.07058 0.05000 0.00164
2017 0.87307 0.07127 0.04838 0.00153
2018 0.87277 0.07195 0.04676 0.00143
2019 0.87247 0.07263 0.04514 0.00132
2020 0.87216 0.07332 0.04351 0.00122
SBI 0.01 2009 0.82233 0.06815 0.05891 0.00102
2010 0.82336 0.07064 0.05875 0.00100
2011 0.82422 0.07277 0.05876 0.00099
2012 0.82495 0.07457 0.05885 0.00098
2013 0.82557 0.07606 0.05899 0.00097
2014 0.82611 0.07730 0.05915 0.00096
2015 0.82657 0.07831 0.05929 0.00095
2016 0.82753 0.08070 0.05927 0.00094
2017 0.82822 0.08238 0.05934 0.00093
2018 0.82892 0.08406 0.05942 0.00092
2019 0.82962 0.08574 0.05950 0.00090
2020 0.83032 0.08743 0.05958 0.00089
TABLE IV: Z-SCORE VALUE FOR SAMPLE BANKS FROM 2009-2020
Banks 2008 2009 2010 2011 2012 2013 2014 2015 2016 2017 2018 2019 2020
OBC 6.679 6.651 6.6502 6.6 6.746 6.621 6.725 6.7525 6.791 6.774 6.7569 6.739 6.722
PNB 6.5070 6.541 6.526 6.340 6.336 6.533 6.4831 6.4291 6.300 6.270 6.241 6.211 6.181
SBI 6.263 6.1105 6.1298 6.0418 6.053 6.0629 6.0715 6.0788 6.0511 6.0443 6.06375 6.0307 6.0239
V. BPNN MODELING ANALYSIS, RESULTS AND OUTCOMES
The validation was carried out for all the internal
parameters of Z-score value. The Z-score internal parameter
estimates were considered from 2001 to 2008 were applied
to train the backpropagation neural network and
subsequently estimates of the year 2009 to 2013 the data
values were used for validation. Based on these values
predictions were drawn using BPNN from 2011 to 2020.
These values have then been substitutes in the Z-score
formula for market credits to compute the Z-score values
from 2009 to 2020. The market has witnessed several ups
and downs during the period 2005 and 2010 and the
modelled. The trained BPNN has been able to forecast the
Z-score values in approximation to the actual values
suggesting that the BPNN has the ability to forecast the Z-
score parameters financial ratios. Table III provides details
of the percentage error at the adopted level of tolerance.
VI. OBSERVATION AND FINDINGS
The validation was carried out for all the internal
parameters of Z-score value. The Z-score internal parameter
estimates were considered from 2001 to 2007 were applied
to train the backpropagation neural network and
subsequently estimates of the year 2008 to 2013 the data
values were used for validation. Based on these values
predictions were drawn using BPNN from 2011 to
2015.these values have then been substitutes in the Z-score
formula for market credits to compute the Z-score values
from 2008 to 2020. The market has witnessed several ups
and downs during the period 2005 and 2010 and the
modelled BPNN has been able to closely predict the Z-score
values from 2005 to 2010. The trained BPNN has been able
to forecast the Z-score values in approximation to the actual
values suggesting that the BPNN has the ability to forecast
the Z-score parameters financial ratios.
A. Computation of Z Score Value
As already mentioned the Altman Z-score forms a
benchmark model within this research because of that
reason this Z-score model utilizes the formula of market
credits being variables depicted. The internal values
computed above are utilized in computation of the Z-score
value. The independent parameters are independent
variables and have to be multiplied by the coefficients
already mentioned and the Z-score value is computed. The
details of formula used have been mentioned in earlier
section of this paper. Table IV provides the details of the Z
score values of different banks.
The Z score reveals that it is safe to lend to the three
banks as the Z values obtained lie in the safe Zone. The
norms of credit can also be relaxed as their sustainability in
the market is been confirmed by the Z value. For OBC bank
the movement of Z-score has been from 0.1% to 4.6%. The
trend exhibited by the predicted value is from 0.6% to 7.8%.
For PNB bank the movement of Z-score has been from 0.2%
to 3.1%. The trend exhibited by the predicted value is from
0.2% to 3%. For SBI bank the movement of Z-score has
been from 0.4% to 5.1%. The trend exhibited by the
predicted value is from 0.1% to 3%.
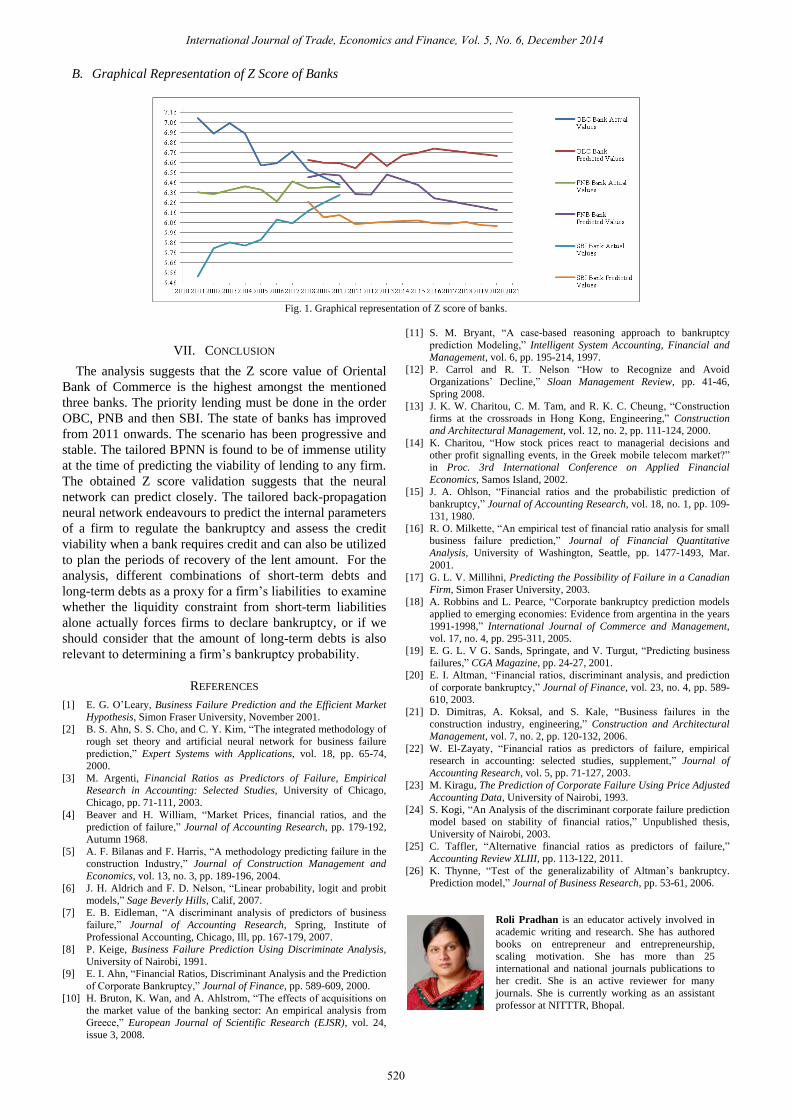
B. Graphical Representation of Z Score of Banks
Fig. 1. Graphical representation of Z score of banks.
VII. CONCLUSION
The analysis suggests that the Z score value of Oriental
Bank of Commerce is the highest amongst the mentioned
three banks. The priority lending must be done in the order
OBC, PNB and then SBI. The state of banks has improved
from 2011 onwards. The scenario has been progressive and
stable. The tailored BPNN is found to be of immense utility
at the time of predicting the viability of lending to any firm.
The obtained Z score validation suggests that the neural
network can predict closely. The tailored back-propagation
neural network endeavours to predict the internal parameters
of a firm to regulate the bankruptcy and assess the credit
viability when a bank requires credit and can also be utilized
to plan the periods of recovery of the lent amount. For the
analysis, different combinations of short-term debts and
long-term debts as a proxy for a firm’s liabilities to examine
whether the liquidity constraint from short-term liabilities
alone actually forces firms to declare bankruptcy, or if we
should consider that the amount of long-term debts is also
relevant to determining a firm’s bankruptcy probability.
REFERENCES
[1] E. G. O’Leary, Business Failure Prediction and the Efficient Market
Hypothesis, Simon Fraser University, November 2001.
[2] B. S. Ahn, S. S. Cho, and C. Y. Kim, “The integrated methodology of
rough set theory and artificial neural network for business failure
prediction,” Expert Systems with Applications, vol. 18, pp. 65-74,
2000.
[3] M. Argenti, Financial Ratios as Predictors of Failure, Empirical
Research in Accounting: Selected Studies, University of Chicago,
Chicago, pp. 71-111, 2003.
[4] Beaver and H. William, “Market Prices, financial ratios, and the
prediction of failure,” Journal of Accounting Research, pp. 179-192,
Autumn 1968.
[5] A. F. Bilanas and F. Harris, “A methodology predicting failure in the
construction Industry,” Journal of Construction Management and
Economics, vol. 13, no. 3, pp. 189-196, 2004.
[6] J. H. Aldrich and F. D. Nelson, “Linear probability, logit and probit
models,” Sage Beverly Hills, Calif, 2007.
[7] E. B. Eidleman, “A discriminant analysis of predictors of business
failure,” Journal of Accounting Research, Spring, Institute of
Professional Accounting, Chicago, Ill, pp. 167-179, 2007.
[8] P. Keige, Business Failure Prediction Using Discriminate Analysis,
University of Nairobi, 1991.
[9] E. I. Ahn, “Financial Ratios, Discriminant Analysis and the Prediction
of Corporate Bankruptcy,” Journal of Finance, pp. 589-609, 2000.
[10] H. Bruton, K. Wan, and A. Ahlstrom, “The effects of acquisitions on
the market value of the banking sector: An empirical analysis from
Greece,” European Journal of Scientific Research (EJSR), vol. 24,
issue 3, 2008.
[11] S. M. Bryant, “A case-based reasoning approach to bankruptcy
prediction Modeling,” Intelligent System Accounting, Financial and
Management, vol. 6, pp. 195-214, 1997.
[12] P. Carrol and R. T. Nelson “How to Recognize and Avoid
Organizations’ Decline,” Sloan Management Review, pp. 41-46,
Spring 2008.
[13] J. K. W. Charitou, C. M. Tam, and R. K. C. Cheung, “Construction
firms at the crossroads in Hong Kong, Engineering,” Construction
and Architectural Management, vol. 12, no. 2, pp. 111-124, 2000.
[14] K. Charitou, “How stock prices react to managerial decisions and
other profit signalling events, in the Greek mobile telecom market?”
in Proc. 3rd International Conference on Applied Financial
Economics, Samos Island, 2002.
[15] J. A. Ohlson, “Financial ratios and the probabilistic prediction of
bankruptcy,” Journal of Accounting Research, vol. 18, no. 1, pp. 109-
131, 1980.
[16] R. O. Milkette, “An empirical test of financial ratio analysis for small
business failure prediction,” Journal of Financial Quantitative
Analysis, University of Washington, Seattle, pp. 1477-1493, Mar.
2001.
[17] G. L. V. Millihni, Predicting the Possibility of Failure in a Canadian
Firm, Simon Fraser University, 2003.
[18] A. Robbins and L. Pearce, “Corporate bankruptcy prediction models
applied to emerging economies: Evidence from argentina in the years
1991-1998,” International Journal of Commerce and Management,
vol. 17, no. 4, pp. 295-311, 2005.
[19] E. G. L. V G. Sands, Springate, and V. Turgut, “Predicting business
failures,” CGA Magazine, pp. 24-27, 2001.
[20] E. I. Altman, “Financial ratios, discriminant analysis, and prediction
of corporate bankruptcy,” Journal of Finance, vol. 23, no. 4, pp. 589-
610, 2003.
[21] D. Dimitras, A. Koksal, and S. Kale, “Business failures in the
construction industry, engineering,” Construction and Architectural
Management, vol. 7, no. 2, pp. 120-132, 2006.
[22] W. El-Zayaty, “Financial ratios as predictors of failure, empirical
research in accounting: selected studies, supplement,” Journal of
Accounting Research, vol. 5, pp. 71-127, 2003.
[23] M. Kiragu, The Prediction of Corporate Failure Using Price Adjusted
Accounting Data, University of Nairobi, 1993.
[24] S. Kogi, “An Analysis of the discriminant corporate failure prediction
model based on stability of financial ratios,” Unpublished thesis,
University of Nairobi, 2003.
[25] C. Taffler, “Alternative financial ratios as predictors of failure,”
Accounting Review XLIII, pp. 113-122, 2011.
[26] K. Thynne, “Test of the generalizability of Altman’s bankruptcy.
Prediction model,” Journal of Business Research, pp. 53-61, 2006.
Roli Pradhan is an educator actively involved in
academic writing and research. She has authored
books on entrepreneur and entrepreneurship,
scaling motivation. She has more than 25
international and national journals publications to
her credit. She is an active reviewer for many
journals. She is currently working as an assistant
professor at NITTTR, Bhopal.
International Journal of Trade, Economics and Finance, Vol. 5, No. 6, December 2014
520