Embed Size (px)
Citation preview

ParkinsoNET: Estimation of UPDRS Score using Hubness-aware
Feed-Forward Neural Networks
Krisztian Buza1∗, Noemi Agnes Varga2†
1Brain Imaging Center, Research Center for Natural Sciences
Hungarian Academy of Sciences
2Institute of Genomic Medicine and Rare Disorders, Semmelweis University
[email protected], [email protected]
Abstract
Parkinson’s disease is a worldwide frequent neurodegenerative disorder with increasing incidence.
Speech disturbance appears during the progression of the disease. UPDRS is a gold standard tool for
diagnostic and follow up of the disease. We aim at estimating the UPDRS score based on biomedical
voice recordings. In this paper, we study the hubness phenomenon in context of the UPDRS score
estimation and propose hubness-aware error correction for feed-forward neural networks in order to
increase the accuracy of estimation. We perform experiments on publicly available datasets derived
form real voice data and show that the proposed technique systematically increases the accuracy of
various feed-forward neural networks.
Keywords – artificial neural networks, hubs, regression, Parkinson’s disease, UPDRS, prediction
1 Introduction
Parkinson’s disease (PD) is one of the most important neurodegenerative disorders, with increasing inci-
dence. PD affects 7 to 10 million people worldwide. Clinically PD is characterized by cardinal symptoms:
initially unilateral, asymmetrical resting tremor (shaking of the hand), rigidity and bradykinesia (slow
movement). In addition to these symptoms (motor disturbances) the disorder is associated with non-
motor, neuropsychiatric symptoms, such as cognitive impairment, autonomic dysregulation and sleep
problems (Crosiers et al., 2011).
∗This research was performed within the framework of the grant of the Hungarian Scientific Research Fund - OTKA
PD 111710. This paper was supported by the Janos Bolyai Research Scholarship of the Hungarian Academy of Sciences.†N.A. Varga was supported by the KTIA NAP 13 1-2013-0001
1

The total PD-related costs are estimated as $25 billion per year in the United States alone, while
“medication costs for an individual person with PD average $2,500 a year, and therapeutic surgery can
cost up to $100,000 dollars per patient.”1 As noted by de Rijk et al. (1997) and de Lau and Breteler
(2006), the prevalence increases with the age, and the increasing importance of PD is underlined by the
fact that “most economically developed and many developing countries are experiencing marked demo-
graphic shifts, with progressively larger proportions of their populations entering old age” (Pringsheim
et al., 2014).
The Unified Parkinson’s Disease Rating Scale (UPDRS) is the most commonly used scale in the
clinical study of PD (Ramaker et al., 2002). Roughly speaking, the UPDRS score of a particular patient
describes the severity of the disease in case of that patient (see also Section 2.1 and the references therein
for more details on UPDRS). The UPDRS score may change over time indicating the success of treatment
or the progression of the disease. Ideally, the UPDRS score would be measured regularly and relatively
often in order to provide medical doctors, the patient and his/her relatives with detailed information
about the progression of the disease and to contribute to the patient’s awareness of the disease, which is
one of the most relevant factors influencing the efficiency of the treatment. However, as the assessment of
the UPDRS score requires notable effort and the available capacity of medical personnel is a bottleneck,
under realistic conditions, the total UPDRS score is measured with a relatively low frequency, e.g., at
the beginning of the treatment and after several months.
Little et al. (2009), Tsanas et al. (2010) and Sakar et al. (2013) have shown that the UPDRS score is
related to various characteristics of the voice, thus, at least in theory, it could be estimated based on the
patient’s speech while he/she makes telephone or skype calls using his/her smartphone or tablet. With
our current study, we would like to take a step towards this visionary application which, on the long
term, is expected to allow continuous monitoring of the patient’s UPDRS score and almost immediate
identification of its substantial changes.
One of the major challenges associated with the aforementioned visionary application is the fact
that the exact function describing how the UPDRS score depends on (the combination of) quantifiable
characteristics of speech is unknown. Therefore, state-of-the-art solutions for the estimation of UPDRS
score from voice data, are based on machine learning (Sakar et al., 2013), (Tsanas et al., 2011). Following
the machine learning paradigm, voice data may be collected from a large set of patients which contains
both audio recordings and the patient’s UPDRS score at the time of recording. Such data allows machine
learning approaches to “discover” the dependency between the characteristics of the voice and the UPDRS
score so that the UPDRS score of “new” patients may be estimated based on their speech.
As artificial neural networks (ANNs) are known to be universal approximators (Pang-Ning et al.,
1http://www.pdf.org/en/parkinson statistics
2

2006), we base our solution on ANNs. In particular, after studying the hubness phenomenon and the
presence of bad hubs in context of the UPDRS score estimation in Section 3, we propose hubness-aware
error correction for ANNs in order to increase the accuracy of estimation. To the best of our knowledge,
the current work is the first attempt to exploit hubness in context of ANNs. We perform experiments
on publicly available datasets derived form real voice data and show that the proposed error correction
technique systematically increases the accuracy of various feed-forward neural networks.
2 Background
In order to ensure that the paper is self-contained, we provide the most relevant background information
about the UPDRS in Section 2.1 and review related works in Section 2.2. Finally, in Section 2.3, we give
basic definitions used throughout the paper.
2.1 Unified Parkinson’s Disease Rating Scale
The Unified Parkinson’s Disease Rating Scale (UPDRS) was developed to provide a comprehensive
coverage of the symptoms, in order to allow for clinical examination and follow-up of the progression of
the disease. Today it serves as a gold standard reference scale.
The scale has four parts. Part I (previously titled Mentation) was designed to assess non-motor
experiences of daily living. Part II (previously called Activities of daily living) assesses motor experiences
of daily living. Part III (a.k.a. the Motor part) contains the examination of the patient’s motor skills,
while Part IV (titled as Complications) considers motor complications.
The aforementioned parts of the UPDRS are measured at different frequencies, for example, according
to Goetz et al. (2003), Part III was used in 98% of the cases, whereas Part I was used with a frequency
of 60% only. For more details about the UPDRS score, the reader is referred to (Goetz et al., 2008).
Alteration of the speech is a well-known symptom of PD, about 70% of PD patients exhibit speech
impairment (Hartelius and Svensson, 1994), (Logemann et al., 1978). Speech disturbances are repre-
sented in Parts II and III of the UPDRS. Speech disturbances in PD are characterized by hypophonia,
hypokinetic dysarthria, palilalia and speech dysfluency. With the progression of the disease, due to the
involvement of speech organs, worsening of speech is known. Moreover, “positive effect of L-dopa treat-
ment on speech disorders could be objectively confirmed” (Pawlukowska et al., 2015). In this paper, we
aim to estimate patients’ UPDRS scores from voice measures.
3

2.2 Related works
Machine learning techniques are widely applied for medical tasks, see e.g. (Cyganek and Wozniak, 2015),
(Grana et al., 2011) and (Froelich et al., 2015).
As we formalize the task of automated estimation of UPDRS score as a regression task, when reviewing
related works, we focus on regression, which is one of the most prominent fields of machine learning with
various applications in medicine, see e.g. (Celikkaya et al., 2013), (Soyiri et al., 2013). In the last decades,
various regression techniques have been developed ranging from simple linear and polynomial regression
over nearest neighbor regression to more complex models, such as artificial neural networks (ANNs) and
support vector regression, see e.g. (Devroye et al., 1994), (Adamczak et al., 2004), (Basak et al., 2007).
One of the most interesting recent observations is the presence of hubs in various datasets. Informally,
hubs are instances that are similar to a surprisingly high amount of other instances. Unfortunately, some
of the hubs are bad in the sort of sense that they may mislead machine learning algorithms. The presence
of hubs have been studied primarily in context of classification, clustering and instance selection, see
(Radovanovic et al., 2010a), (Tomasev and Mladenic, 2013), (Radovanovic et al., 2009), (Radovanovic
et al., 2010b), (Tomasev et al., 2011), (Tomasev et al., 2015b), (Buza et al., 2011), and (Tomasev et al.,
2015a) for a survey.
To the best of our knowledge, Buza et al. (2015) was the first to study the presence of hubs in regression
tasks. They focused on nearest neighbor regression and considered various applications, whereas in the
subsequent sections of this paper we study the role of hubs in the estimation of the UPDRS score and
propose a hubness-aware enhancement of ANNs.
2.3 Definitions and notations
A dataset D containing n instances is given. In our case, each instance corresponds to an audio recording.
Numeric features describing characteristic properties of the voice are extracted, therefore, each instance
is a vector of such features. Instances are denoted by xi, 1 ≤ i ≤ n. For each instance xi ∈ D, the value
of the continuous target, i.e., UPDRS score, is given and it is denoted by y(xi). We say that y(xi) is
the label of instance xi and D is the training dataset. With regression we mean the task of predicting
(estimating) the label of an instance x′ 6∈ D.
We use d(xi, xj) to denote the distance between two instances xi and xj . In order to study the
hubness phenomenon, we will use the notion of k-nearest neighbors of an instance x′ which is a subset
NDk (x′) of D so that |ND
k (x′)| = k and
maxx∈ND
k (x′)d(x′, x) ≤ min
x∈D\NDk (x′)
d(x′, x).
We may omit the upper index D, whenever there is no ambiguity. We note that ties may be broken
4

a) b)
Figure 1: a) The nearest neighbor relationship is asymmetric. Some instances never appear as the first
nearest neighbor of other instances while there are some instances that appear frequently as the first
nearest neighbor of other instances. b) Example used to illustrate error correction.
arbitrarily, i.e., in case if there are several subsets fulfilling the above condition, any of them may be
used as the set of nearest neighbors.
3 Bad Hubs in UPDRS Score Estimation
Informally, hubness in datasets refers to the phenomenon that some instances are similar to surprisingly
large number of other instances. In order to quantitatively study hubness in context of UPDRS score
estimation from voice data, we use the notion of k-nearest neighbors.
Let us first note that the k-nearest neighbor relationship is asymmetric: while each instance x ∈ D
has k nearest neighbors, an instance x′ ∈ D does not necessarily appear k times as one of the k-nearest
neighbors of other instances. This is illustrated in Fig. 1a for k = 1. In order to keep the example simple,
we consider two-dimensional vector data, therefore, instances correspond to points of the plane. In the
context of UPDRS score estimation from speech data, we may imagine a simple scenario in which two
numeric features of the audio signals (such as shimmer and jitter) are extracted and we use only these
two features to represent the data. Each of these features may correspond to one of the horizontal and
vertical axis, thus the audio recordings may be mapped to points in the plane.
In Fig. 1a, there is a directed edge from each instance (denoted by a circle) to its first nearest neighbor.
While each instance has exactly one first nearest neighbor, how many times an instance appears as the
first nearest neighbor of other instances (i.e., the number of incoming edges to an instance) is not
necessarily one. As one can see, some of the instances never appear as nearest neighbors of others and
there is an instance that appears as the first nearest neighbor of three other instances. In particular, the
integer next to each instance shows how many times it appears as the first nearest neighbor of others.
Generally, we use Nk(x) to denote how many times the instance x ∈ D appears as one of the k-nearest
5

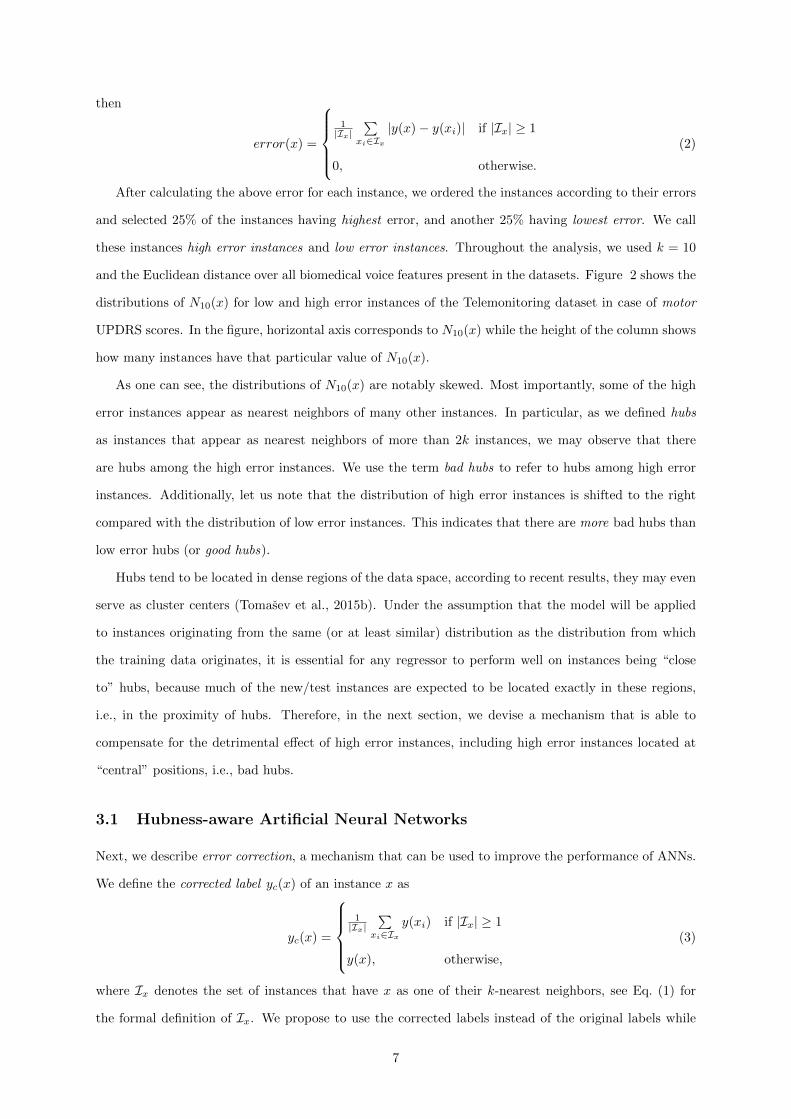
Figure 2: The distribution of N10(x) in case of motor UPDRS scores of the Telemonitoring dataset for
low error instances (in the left), high error instances (in the middle), and both histograms in the same
plot (in the right). Similar observations can be made for the Multiple Sound Recording dataset and total
UPDRS scores of the Telemonitoring dataset as well. Note that, some of the high error instances appear
as nearest neighbors of many other instances, i.e., there are bad hubs in the data. Remarkably, the
distribution of high error instances is shifted to the right compared with the distribution of low error
instances. This indicates that there are more high error hubs than low error hubs.
neighbors of other instances of D. It is easy to see that the expected value of Nk(x) is E[Nk(x)] = k,
however, the actual value of Nk(x) varies from instance to instance. As it was shown by Radovanovic
et al. (2010a), Buza et al. (2011), Tomasev and Mladenic (2013), in many cases, the distribution of
Nk(x) is substantially skewed to the right, i.e., there are a few instances with extraordinarily high Nk(x)
values, furthermore, the skewness increases with increasing intrinsic dimensionality of the data. Usually,
instances having surprisingly high Nk(x) are called hubs, while instanced with exceptionally low Nk(x)
are called anti-hubs. More precisely, we say that an instance x is a hub, if Nk(x) > 2k; while an instance
x is an anti-hub if Nk(x) = 0. The phenomenon that Nk(x) is skewed is called hubness and it is often
quantified by the third standardized moment (skewness) of the distribution of Nk(x).
In order to show that there are instances that may mislead machine learning models, we perform
the following analysis on the Telemonitoring and Multiple Sound Recording datasets, both of them
containing voice data for UPDRS estimation. (The datasets are described in Section 4.1 in more detail.)
We considered both estimation tasks (total and motor UPDRS score) associated with the Telemonitoring
data separately. For each instance x, as error(x), we calculate the average absolute difference between
the label of x (i.e. UPDRS score associated with x) and the labels of those instances that have x as one
of their nearest neighbors. Formally, let
Ix = {xj |x ∈ Nk(xj)}, (1)
6
then
error(x) =
1
|Ix|∑
xi∈Ix
|y(x)− y(xi)| if |Ix| ≥ 1
0, otherwise.
(2)
After calculating the above error for each instance, we ordered the instances according to their errors
and selected 25% of the instances having highest error, and another 25% having lowest error. We call
these instances high error instances and low error instances. Throughout the analysis, we used k = 10
and the Euclidean distance over all biomedical voice features present in the datasets. Figure 2 shows the
distributions of N10(x) for low and high error instances of the Telemonitoring dataset in case of motor
UPDRS scores. In the figure, horizontal axis corresponds to N10(x) while the height of the column shows
how many instances have that particular value of N10(x).
As one can see, the distributions of N10(x) are notably skewed. Most importantly, some of the high
error instances appear as nearest neighbors of many other instances. In particular, as we defined hubs
as instances that appear as nearest neighbors of more than 2k instances, we may observe that there
are hubs among the high error instances. We use the term bad hubs to refer to hubs among high error
instances. Additionally, let us note that the distribution of high error instances is shifted to the right
compared with the distribution of low error instances. This indicates that there are more bad hubs than
low error hubs (or good hubs).
Hubs tend to be located in dense regions of the data space, according to recent results, they may even
serve as cluster centers (Tomasev et al., 2015b). Under the assumption that the model will be applied
to instances originating from the same (or at least similar) distribution as the distribution from which
the training data originates, it is essential for any regressor to perform well on instances being “close
to” hubs, because much of the new/test instances are expected to be located exactly in these regions,
i.e., in the proximity of hubs. Therefore, in the next section, we devise a mechanism that is able to
compensate for the detrimental effect of high error instances, including high error instances located at
“central” positions, i.e., bad hubs.
3.1 Hubness-aware Artificial Neural Networks
Next, we describe error correction, a mechanism that can be used to improve the performance of ANNs.
We define the corrected label yc(x) of an instance x as
yc(x) =
1
|Ix|∑
xi∈Ix
y(xi) if |Ix| ≥ 1
y(x), otherwise,
(3)
where Ix denotes the set of instances that have x as one of their k-nearest neighbors, see Eq. (1) for
the formal definition of Ix. We propose to use the corrected labels instead of the original labels while
7

training ANNs. Although, our current work focuses on ANNs, we note that, in principle, the above error
correction technique may be used with various other regressors as well.
Using the example in Fig. 1b we illustrate how the corrected labels are calculated. In Fig. 1b training
instances are denoted by circles. They are identified by the symbols x1...x7. The numeric value next
to each instance shows its label. In order to keep the example simple, we use k = 1 to calculate the
corrected labels of training instances. For training ANNs, the corrected label of all the training instances
need to be calculated, however, we only present the calculations for x4 and x5 as the procedure is the
same in case of the other instances as well. Concretely, the corrected labels of x4 and x5 are:
yc(x4) =1
2(39.5 + 19.8) = 29.65, yc(x5) =
1
3(20.1 + 24.7 + 16.4) = 20.4.
4 Experiments
In this section we present the results of our experimental evaluation of the proposed approach on two
real-world speech datasets associated with UPDRS scores as prediction target.
4.1 Datasets
The Parkinsons Telemonitoring dataset (Tsanas et al., 2010; Little et al., 2009) “is composed of a range
of biomedical voice measurements from 42 people with early-stage Parkinson’s disease recruited to a
six-month trial of a telemonitoring device for remote symptom progression monitoring.”2 In total, the
data contains 5875 instances. Both motor (i.e., part III) and total (i.e., all the four parts) UPDRS scores
as well as temporal information (i.e., on which day the measurements were taken) are available. We use
motor to denote the experiments when the motor UPDRS score was used as target, analogously, total
denotes the experiments when the total UPDRS score was used as target.
We performed experiments on the Parkinson Speech Dataset with Multiple Types of Sound Recordings
as well, to which we refer as multi for simplicity (Sakar et al., 2013). This dataset contains 1040 instances.
Both datasets are available in the UCI Machine Learning repository (Bache and Lichman, 2013). In
case of both datasets, we used jitter and shimmer features.
4.2 Experimental Protocol
We performed experiments according to the patient-based 10×10-fold cross-validation protocol, i.e., in
each round of the 10×10-fold cross-validation, all the instances belonging to the same patient either
appear in the train or test split. This simulates the medically relevant scenario in which historical data
is used to train the model which is then applied to the estimation of UPDRS scores of new patients.
2http://archive.ics.uci.edu/ml/datasets/Parkinsons+Telemonitoring
8

As temporal information was available in the Telemonitoring dataset, an additional estimation task
that may be associated with the data is to estimate the change of UPDRS score relative to its initial
value. As it may be highly relevant to identify substantial changes in the UPDRS score of a patient
as early as possible, we also evaluated the proposed technique in the UPDRS score change estimation
context. These experiments are denoted as change motor and change total respectively.
In all the above experiments, features were normalized by subtracting their mean and dividing by
their standard deviation. Mean and standard deviation were calculated on the training subset of the
data (therefore, the normalization was performed in each round of the 10×10-fold cross-validation).
In our experiments, we used the implementation of ANNs from the Weka software package (Witten
and Frank, 2005). In particular, we used feed-forwarld ANNs trained with backpropagation with learning
rate of 0.3, and momentum of 0.2, while the number of training epochs was set to 500. In order to show
that the proposed approach is indeed able to improve the performance of neural networks, we used
neural networks of the same structure both with and without the error correction technique described
in Section 3.1. While performing error correction, we used the Euclidean distance and k = 10 as the
default k-value in order to calculate the nearest neighbor relationship. Error correction was performed
only on the training set, i.e., in both cases (with and without error correction) we aimed to predict the
same target.
We use a comma separated list of integers to denote the structure of ANNs: each item of the list
corresponds to one of the hidden layers and it denotes the number of neurons in that layer. For example,
“Net-5,5” denotes an ANN with two hidden layers each of them containing 5 neurons. We performed
experiments with ANNs of six different structure: one hidden layer with 5, 10 and 20 neurons and two
hidden layers with 5, 10 and 20 neurons each.
4.3 Performance Metrics
We measured the performance of our approach and the baselines in terms of mean absolute error (MAE)
and root-mean-square error (RMSE):
MAE =1
|Dtest|∑
xj∈Dtest
|y(xj)− y(xj)|, RMSE =
√√√√ 1
|Dtest|∑
xj∈Dtest
(y(xj)− y(xj)
)2,
where Dtest and |Dtest| denote the test set and its size respectively, y(xj) denotes the label predicted for
instance xj , while y(xj) denotes the true label of instance xj . We used paired calibrated t-test proposed
by Bouckaert (2003) at significance level of 0.05 to examine if the ANNs with error correction statistically
significantly outperform ANNs without error correction. For simplicity, we only report results for MAE,
but we note that we observed similar trends for RMSE as well.
9

Table 1: Mean absolute error averaged over 10×10 folds with (+EC) and without error correction (–EC).
The MAE-value is underlined, if the difference is statistically significant.
model motor total multi change motor change total
+EC –EC +EC –EC +EC –EC +EC –EC +EC –EC
Net-5 7.206 7.669 9.477 10.080 13.944 14.139 3.150 3.445 3.830 4.117
Net-10 7.232 7.687 9.504 10.056 13.968 14.548 3.148 3.469 3.827 4.127
Net-20 7.276 7.822 9.594 10.065 14.104 14.505 3.136 3.440 3.824 4.109
Net-5,5 7.220 7.558 9.451 10.035 13.764 14.114 3.103 3.473 3.716 4.022
Net-10,10 7.239 7.572 9.476 10.025 13.797 14.145 3.104 3.451 3.718 4.004
Net-20,20 7.266 7.589 9.452 10.014 13.852 14.260 3.106 3.434 3.712 4.013
4.4 Results
In each of the 5 different contexts (i.e., motor, total, multi, change motor and change total), we examined 6
types of neural networks, this gave in total 30 experiments. In each of these 30 experiments, we compared
neural networks using error correction (+EC) and neural networks without (−EC) error correction.
Table 1 summarizes the results. We report MAE averaged over 10×10 folds. As one can see, the
proposed error correction mechanism systematically improves the quality of UPDRS score estimation.
In particular, in all of the aforementioned 30 experiments, the neural networks with error correction
outperformed the neural networks without error correction. The improvement is statistically significant
in 24 experiments.
As noted previously, error correction may be used with various models. Therefore, we examined the
effect of error correction on other regression techniques as well. Fig. 3.a shows the performance of various
models in case of estimating the motor UPDRS score with and without error correction. In particular,
we consider: (i) Net-5, feed-forward artificial neural network with one hidden layer containing 5 neurons,
(ii) k-NN, k-nearest neighbor regression with k = 10, (iii) M5P regression trees from the aforementioned
Weka machine learning library and (iv) SVM, support vector regression with linear kernel. As one can
see, error correction is able to improve the performance of these models as well.
As described above, in order to perform error correction, k-nearest neighbor relationships are com-
puted first. Fig. 3.b shows the performance of Net-5 when performing error correction with various
k-values. As one can see, error correction systematically improves the performance of the model for all
the examined k values, while k values between 5 and 10 are preferable.
10

a) b)
Figure 3: a) Performance (MAE) of various models when predicting the motor UPDRS score with
(+EC) and without (−EC) error correction. b) Performance of Net-5 with error correction (+EC) using
various k-values, and without error correction (−EC).
5 Discussion
During spontaneous usage of tablets, smartphones and laptops, these devices are able to capture un-
precedented amount and variety of data about their users. The gathered information may range from
the dynamics of typing recorded while the user writes short messages or e-mails, over voice recordings
performed during phone or skype calls, to GPS coordinates and social connectivity features (such as how
many people the user regularly writes messages to). It is hypothesized that such information might be
related to various disorders or predict unexpected changes of the user’s health conditions (Estrin, 2013).
Given the relatively high and increasing computational power of smartphones and tables, processing and
analysis of the data collected during spontaneous usage became technologically possible. This is expected
to give rise to visionary healthcare applications that support medical doctors in diagnostic decisions and
treatment of diseases.
While much of the research focuses on understanding the background of PD, see e.g. (Zimprich et al.,
2003) and (Balicza et al., 2012), in this paper, we focused on the estimation of UPDRS score from
biomedical voice measurements. Due to the fact that the user’s voice can be simply recorded during
spontaneous interactions with tablets or smartphones, we strongly hope that our paper is a step towards
the usage of tablets and smartphones in the strict follow up of PD. Such visionary applications, once
they will be realized, will not only allow for cheap and continuous monitoring of patients’ status, but the
resulting data is expected to increase the patients’ and their relatives’ awareness of the disease which is
one of the key factors of successful treatment of the disease.
We hope that, on the long term, similar approaches will be used for diagnosis and monitoring of other
diseases as well. For example, Estrin (2013) reported that reduction of hearing abilities could be detected
by examining the volume at which the user listened to music on his smartphone. This increased the
patient’s awareness of the disease, and convinced the patient to turn to medical doctors for examination.
11

Dementia and cognitive impairment, see e.g. (Bereczki and Szatmari, 2009), is another domain in which
telemonitoring systems might be advantageous on the long term.
Regarding the limitations of our study we have to mention that it is likely that the accuracy of
UPDRS score estimation needs to be increased further for successful applications. Therefore, incorpo-
ration of further data mining techniques, such as monotonization (Horvath et al., 2011) and monotone
models (Horvath and Vojtas, 2006) and the adaptation of hybrid solutions (Wozniak et al., 2014) might
be advantageous. We also mention that the proposed error correction technique may contribute to avoid
overfitting to hub instances having non-representative labels. In contrast, conventional regularization
techniques focus on model complexity and treat all the instances equally important. More detailed study
of the relation between regularization and error correction is left for future work.
The data recorded during spontaneous usage of smartphones and tablets was originally not designed
for diagnostic purposes, therefore, even the most useful pieces of the data can only be expected to be
weakly correlated with medically relevant conditions. Note, however, that a combination of weak features
may serve as a reasonable predictor even if the features are weak predictors separately and, by training
neural networks, the machine is expected to learn the appropriate combination of those individually
weak predictors. On the other hand, medical doctors are expected to play a crucial role in the correct
interpretation of the data and potential additional examinations. The overall workload of medical doctors
will not necessarily decrease: although continuous telemonitoring might replace some of the scheduled
face-to-face meetings between patients and doctors, due to the continuous monitoring of UPDRS score
or other conditions, and possible false alarms generated by automated recognition systems, patients may
ask for more appointments with medical doctors.
6 Conclusions
In this paper, we focused on the automated estimation of UPDRS score based on biomedical voice
measures. This is a crucial component of telemonitoring systems for PD patients. We studied the hubness
phenomenon in context of the UPDRS score estimation and proposed a hubness-aware error correction
for artificial neural networks. We performed experiments on publicly available real-world datasets and
showed that the proposed technique systematically improves estimation accuracy as measured by MAE
and RMSE.
12

References
Rafa l Adamczak, Aleksey Porollo, and Jaros law Meller. Accurate prediction of solvent accessibility using
neural networks–based regression. Proteins: Structure, Function, and Bioinformatics, 56(4):753–767,
2004.
K. Bache and M. Lichman. UCI machine learning repository, 2013. URL
http://archive.ics.uci.edu/ml.
P Balicza, B Bereznai, A Takats, P Klivenyi, G Dibo, E Hidasi, I Balogh, and MJ Molnar. The
absence of the common lrrk2 g2019s mutation in 120 young onset hungarian parkinon’s disease patients.
Ideggyogyaszati szemle, 65(7-8):239–242, 2012.
Debasish Basak, Srimanta Pal, and Dipak Chandra Patranabis. Support vector regression. Neural
Information Processing-Letters and Reviews, 11(10):203–224, 2007.
Daniel Bereczki and Szabolcs Szatmari. Treatment of dementia and cognitive impairment: What can we
learn from the cochrane library. Journal of the neurological sciences, 283(1):207–210, 2009.
Remco R Bouckaert. Choosing between two learning algorithms based on calibrated tests. In Proceedings
of the 20th International Conference on Machine Learning (ICML-03), pages 51–58, 2003.
Krisztian Buza, Alexandros Nanopoulos, and Lars Schmidt-Thieme. Insight: efficient and effective
instance selection for time-series classification. In Advances in Knowledge Discovery and Data Mining,
pages 149–160. Springer, 2011.
Krisztian Buza, Alexandros Nanopoulos, and Gabor Nagy. Nearest neighbor regression in the presence
of bad hubs. Knowledge-Based Systems, 86:250–260, 2015.
E Busra Celikkaya, Christian R Shelton, Dave Kale, Randall C Wetzel, and Robinder G Khemani. Non-
invasive blood gas estimation for pediatric mechanical ventilation. In Machine Learning for Clinical
Data Analysis and Healthcare, NIPS Workshop, 2013.
David Crosiers, Jessie Theuns, Patrick Cras, and Christine Van Broeckhoven. Parkinson disease: insights
in clinical, genetic and pathological features of monogenic disease subtypes. Journal of Chemical
Neuroanatomy, 42(2):131–141, 2011.
Boguslaw Cyganek and Michal Wozniak. Tensor based representation and analysis of the electronic
healthcare record data. In IEEE International Conference on Bioinformatics and Biomedicine
(BIBM), pages 1383–1390. IEEE, 2015.
13

Lonneke ML de Lau and Monique MB Breteler. Epidemiology of parkinson’s disease. The Lancet
Neurology, 5(6):525–535, 2006.
MC d de Rijk, C Tzourio, MM Breteler, JF Dartigues, L Amaducci, S Lopez-Pousa, JM Manubens-
Bertran, A Alperovitch, and WA Rocca. Prevalence of parkinsonism and parkinson’s disease in europe:
the europarkinson collaborative study. european community concerted action on the epidemiology of
parkinson’s disease. Journal of Neurology, Neurosurgery & Psychiatry, 62(1):10–15, 1997.
Luc Devroye, Laszlo Gyorfi, Adam Krzyzak, and Gabor Lugosi. On the strong universal consistency of
nearest neighbor regression function estimates. The Annals of Statistics, pages 1371–1385, 1994.
Deborah Estrin. Small, n=me, data. Invited Talk at the conference of the Neural Information Processing
Systems Foundation (NIPS), 2013.
Wojciech Froelich, Krzysztof Wrobel, and Piotr Porwik. Diagnosis of parkinson’s disease using speech
samples and threshold-based classification. Journal of Medical Imaging and Health Informatics, 5(6):
1358–1363, 2015.
CG Goetz, W Poewe, and O et al. Rascol. Movement disorder society task force on rating scales for
parkinsons disease, the unified parkinsons disease rating scale (updrs): Status and recommendations.
Mov Disord, 18:738–50, 2003.
Christopher G Goetz, Barbara C Tilley, Stephanie R Shaftman, Glenn T Stebbins, Stanley Fahn, Pablo
Martinez-Martin, Werner Poewe, Cristina Sampaio, Matthew B Stern, Richard Dodel, et al. Movement
disorder society-sponsored revision of the unified parkinson’s disease rating scale (mds-updrs): Scale
presentation and clinimetric testing results. Movement disorders, 23(15):2129–2170, 2008.
M Grana, M Termenon, A Savio, A Gonzalez-Pinto, J Echeveste, JM Perez, and A Besga. Computer
aided diagnosis system for alzheimer disease using brain diffusion tensor imaging features selected by
pearson’s correlation. Neuroscience Letters, 502(3):225–229, 2011.
Lena Hartelius and Per Svensson. Speech and swallowing symptoms associated with parkinsons disease
and multiple sclerosis: a survey. Folia Phoniatrica et Logopaedica, 46(1):9–17, 1994.
Tomaa Horvath, Andreas Eckhardt, Krisztian Buza, Peter Vojtas, and Lars Schmidt-Thieme. Value-
transformation for monotone prediction by approximating fuzzy membership functions. In Compu-
tational Intelligence and Informatics (CINTI), 2011 IEEE 12th International Symposium on, pages
367–372. IEEE, 2011.
14

Tomas Horvath and Peter Vojtas. Ordinal classification with monotonicity constraints. Advances in Data
Mining. Applications in Medicine, Web Mining, Marketing, Image and Signal Mining, pages 217–225,
2006.
Max A Little, Patrick E McSharry, Eric J Hunter, Jennifer Spielman, and Lorraine O Ramig. Suitability
of dysphonia measurements for telemonitoring of parkinson’s disease. Biomedical Engineering, IEEE
Transactions on, 56(4):1015–1022, 2009.
Jeri A Logemann, Hilda B Fisher, Benjamin Boshes, and E Richard Blonsky. Frequency and cooccurrence
of vocal tract dysfunctions in the speech of a large sample of parkinson patients. Journal of Speech
and Hearing Disorders, 43(1):47–57, 1978.
Tan Pang-Ning, Michael Steinbach, and Vipin Kumar. Introduction to data mining. Pearson Addison-
Wesley, 2006.
Wioletta Pawlukowska, Monika Go lab-Janowska, Krzysztof Safranow, Iwona Rotter, Katarzyna
Amernik, Krystyna Honczarenko, and Przemys law Nowacki. Articulation disorders and duration,
severity and l-dopa dosage in idiopathic parkinson’s disease. Neurologia i neurochirurgia polska, 49(5):
302–306, 2015.
Tamara Pringsheim, Nathalie Jette, Alexandra Frolkis, and Thomas DL Steeves. The prevalence of
parkinson’s disease: A systematic review and meta-analysis. Movement Disorders, 29(13):1583–1590,
2014.
Milos Radovanovic, Alexandros Nanopoulos, and Mirjana Ivanovic. Nearest neighbors in high-
dimensional data: The emergence and influence of hubs. In Proceedings of the 26th Annual Inter-
national Conference on Machine Learning, pages 865–872. ACM, 2009.
Milos Radovanovic, Alexandros Nanopoulos, and Mirjana Ivanovic. Hubs in space: Popular nearest
neighbors in high-dimensional data. The Journal of Machine Learning Research, 11:2487–2531, 2010a.
Milos Radovanovic, Alexandros Nanopoulos, and Mirjana Ivanovic. Time-series classification in many
intrinsic dimensions. In Proc. 10th SIAM Int. Conf. on Data Mining (SDM), pages 677–688. SIAM,
2010b.
Claudia Ramaker, Johan Marinus, Anne Margarethe Stiggelbout, and Bob Johannes van Hilten. Sys-
tematic evaluation of rating scales for impairment and disability in parkinson’s disease. Movement
Disorders, 17(5):867–876, 2002.
15

Betul Erdogdu Sakar, MM Isenkul, C Okan Sakar, Ahmet Sertbas, Fikret Gurgen, Sakir Delil, Hulya
Apaydin, and Olcay Kursun. Collection and analysis of a parkinson speech dataset with multiple types
of sound recordings. Biomedical and Health Informatics, IEEE Journal of, 17(4):828–834, 2013.
Ireneous N Soyiri, Daniel D Reidpath, and Christophe Sarran. Forecasting peak asthma admissions in
london: an application of quantile regression models. International journal of biometeorology, 57(4):
569–578, 2013.
Nenad Tomasev and Dunja Mladenic. Class imbalance and the curse of minority hubs. Knowledge-Based
Systems, 53:157–172, 2013.
Nenad Tomasev, Milos Radovanovic, Dunja Mladenic, and Mirjana Ivanovic. A probabilistic approach
to nearest-neighbor classification: Naive hubness bayesian knn. In Proc. CIKM, 2011.
Nenad Tomasev, Krisztian Buza, Kristof Marussy, and Piroska B Kis. Hubness-aware classification,
instance selection and feature construction: Survey and extensions to time-series. 2015a.
Nenad Tomasev, Milos Radovanovic, Dunja Mladenic, and Mirjana Ivanovic. Hubness-based clustering
of high-dimensional data. In Partitional Clustering Algorithms, pages 353–386. Springer, 2015b.
A. Tsanas, M.A. Little, P.E. McSharry, and L.O. Ramig. Accurate telemonitoring of parkinson’s disease
progression by non-invasive speech tests. Biomedical Engineering, IEEE Transactions on, 57, 2010.
Athanasios Tsanas, Max A Little, Patrick E McSharry, and Lorraine O Ramig. Nonlinear speech analysis
algorithms mapped to a standard metric achieve clinically useful quantification of average parkinson’s
disease symptom severity. Journal of the Royal Society Interface, 8(59):842–855, 2011.
Ian H Witten and Eibe Frank. Data Mining: Practical machine learning tools and techniques. Morgan
Kaufmann, 2005.
Micha l Wozniak, Manuel Grana, and Emilio Corchado. A survey of multiple classifier systems as hybrid
systems. Information Fusion, 16:3–17, 2014.
Alexander Zimprich, Friedrich Asmus, Petra Leitner, Mirna Castro, Benjamin Bereznai, Nikolaus
Homann, Erwin Ott, A WijnandF Rutgers, Gyri Wieditz, Claudia Trenkwalder, et al. Point mutations
in exon 1 of the nr4a2 gene are not a major cause of familial parkinson’s disease. Neurogenetics, 4(4):
219–220, 2003.
16