Embed Size (px)
Citation preview

Yum Cha 飲 茶 September 26, 2014
TALKING POINTS
CHART OF THE DAY—ADB SEES CHINA’S 7.5% GROWTH INTACT, BUT WITH STIMULUS
Source: Bloomberg
INDICES Closing DoD%
Hang Seng Index 23,768.1 (0.6)
HSCEI 10,640.1 (0.7)
Shanghai COMP 2,345.1 0.1
Shenzhen COMP 1,309.0 (0.0)
Gold 1,209.7 (0.6)
BDIY 1,056.0 (1.6)
Crude Oil, WTI(US$/BBL) 92.6 (0.2)
Crude Oil, BRENT(US$/BBL) 96.7 (0.3)
HIBOR, 3-M 0.4 (0.4)
SHIBOR, 3-M 4.6 (0.3)
RMB/USD 6.1 0.0
DAILY NOTES FOR THIS WEEK
Sep 26 Industrial Profits YoY
Sep 27 Leading Index
NINE DRAGONS PAPER (Holdings) LIMITED (NDP) [2689.HK; HK$5.78; Not Rated] - The
manufacturer of packaging paperboard products and unbleached kraft is benefiting from a
changing supply/demand situation, as the Chinese government forces the shutdown of obsolete
capacity and smaller producers face severe funding challenges. As one of the bigger producers,
NDP is taking advantage of the situation, and expects to raise average selling price (ASP) by
RMB50-100/tonne in the coming months as the cost environment becomes more favourable.
Risks of weaker downstream demand are already in the price in our view, but the more positive
supply/demand equation is not.
CHONGQING RURAL COMMERCIAL BANK (CRCB) [3618.HK] - We initiate coverage on
CRCB with a BUY, based on several factors—one of the bigger rural banks, CRCB has the
most liquid balance sheet of the larger Chinese banks; it is able to attract relatively low-cost
deposits in rural areas and lend at impressive spreads (net interest margin 3.7%) in urban
areas. Its 58% loan-deposit ratio enables CRCB to “trade” the interbank market, extracting
spreads and boosting net interest income. Exposure to local government financing vehicles
(LGFV) is the key risk, but we believe there is an adequate buffer on the balance sheet. At the
current HK$3.59 CRCB’s 2014E PER is below 4x and PBR 0.76x. At our target price of
HK$4.80 CRCB for 2014E would be 5.3x and PBR 0.9x. BUY
Domestic consumption is the key to China’s ability to manage through the current economic
adjustment, according to the Asian Development Bank (ADB). The regional bank is more opti-
mistic than consensus on the short-term outlook, and is maintaining its gross domestic product
(GDP) forecast for 2014 at 7.5%, dipping slightly to 7.4% in 2015. The driver for domestic con-
sumption is labour-intensive services, e.g. telecommunications, healthcare, transport, which are
increasing in absolute terms and as a share of overall GDP. As the chart on the left shows,
household income is rising faster in rural areas than in urban areas, although per capita income
in urban areas is still 2.8x that of rural areas. The ADB believes growth in services will exceed
manufacturing and construction, although the weaker commodity prices (iron ore, coal) are
supporting China’s terms of trade, and moderate improvements in developed-world economies
are boosting demand. In an insight that may provide a backdrop to speculation of a change in
leadership of the People’s Bank of China (PBoC), the ADB notes that monetary policy will lean
towards tightening and to money supply growth closer to nominal GDP growth, for the time
being fiscal and monetary policy “is to prioritise short-term stability”. It points to the easier mon-
etary policy in Q2 2014 to illustrate this, and also to the likelihood that measures to reduce local
government’s off-budget spending will roll out over a longer timeframe. But “public debt overall
is still low by international norms”, so there is scope for further support, and “focusing stimulus
on smaller cities where the oversupply of property is concentrated seems appropriate”. Agreed!
HOUSEHOLD CONSUMP-
TION GROWTH SHARE OF
GDP (%)

VISIT NOTE
Analyst: John Mulcahy
Nine Dragons Paper (Holdings) Limited [2689.HK; HK$5.78; NOT-RATED -
Key takeaway from FY14 results presentation
Market Cap: US$3,478m; Free Float: 32.8%; 3-months Average Daily Turnover: US$5.3m
The Company. Nine Dragons Paper (NDP) manufactures and sells
packaging paperboard products and unbleached kraft.
Management remains positive on outlook. During the results
presentation, management had a positive tone on the group’s
outlook, given an improving supply/demand dynamic and more
favourable cost environment. China’s government targets to shut
down 4.6m tonnes of outdated capacity in 2014. Management
estimated that the government will shut down 5-7m tonnes of
outdated capacity in 2015. The shut-downs will cause the industry
as a whole to report slower capacity growth.
Tight liquidity environment triggered industry consolidation.
According to management, NDP is benefiting from tight financial
market liquidity, as banks are unwilling to lend money to smaller
paper manufacturers or paper manufacturers with obsolete
technology. Apart from increasing environmental controls, smaller
players are under heavy financing pressure as they are often
unable to fund working capital requirements or capacity expansion.
Leading players including NDP and Lee & Man Paper, with access
to multiple funding channels, are thus taking market share from
smaller players.
Net profit growth through cost control. NDP expects to raise
average selling price (ASP) by RMB50-100/tonne in the coming
months. The cost environment is getting more favourable given
stable coal costs and softening waste paper prices. Management
expects domestic and imported waste paper prices to decrease
from RMB1,150/tonne and US$200/tonne to RMB1,110/tonne and
US$180-190/tonne, respectively.
Management is targeting to achieve net profit per tonne of Rmb180
and sales volume of 12m tonnes in FY15. ASPs are unlikely to
increase significantly in the near term but cost savings will support
net profit growth. Management is targeting a net debt to equity ratio
of 95% by FY15 and 80% by FY16. The group reduced dividends
in FY14 to pay down its debt.
FY14 results recap. NDP reported FY14 net profit of RMB17.6bn,
up 13% year-on-year (YoY), in line with market consensus. Gross
profit margin improved from 16% in FY13 to 16.4% in FY14 which
was mainly due to costs reductions. Net profit per tonne was
RMB160 for FY14, down from RMB174 in 1H14, but still up from
RMB150 in FY13. NDP booked a foreign exchange loss of
RMB134m in 2HFY14 due to RMB depreciation since Jan 2014.
Net gearing fell further to 112% as at Jun 2014 vs. 117% as at Dec
2013.
Unlike other cyclical industries, paper demand is not closely
correlated with investment activities and is more related to local
consumption. We believe the paper manufacturing industry is one
September 26, 2014
Source: Bloomberg, Company Data.
[Nine Dragons Paper (Holdings) Limited]
of the long-term beneficiaries of China’s consumption
growth. Government policies including increasing
environmental protection control and increasing land costs
create entry barriers.
NDP is one of the major beneficiaries of an improvement in
supply/demand dynamics. The negatives such as weaker
than expected downstream demand have been partly
reflected in the group’s recent share price
underperformance.
Share Price Catalysts: Relaxation of tightening policies,
paper price hike, more discipline on the supply side, falling
coal prices and waste paper prices.
0
100
200
300
400
0
2
4
6
8
10
Sep13 Nov13 Jan14 Mar14 May14 Jul14
(HK$ million)(HK$)
Turnover (RHS) Price (LHS)
Key Financials
(in HK$ m)2013 2014 2015E 2016E
Revenue 35,693.3 36,561.1 41,251.9 44,128.9
Gross Profit 5,720.9 6,004.6 n.a. n.a.
Gross Margin % 16.0 16.4 17.6 17.9
Net Profit 1,938.3 2,218.2 2,721.8 3,129.8
Net Margin % 5.4 6.1 6.6 7.1
EPS (Basic) 0.42 0.48 0.59 0.68
ROE (%) 7.0 7.5 8.8 9.5
Dividend Yield (%) 2.15 1.75 2.87 3.55
PER (x) 13.90 12.16 9.76 8.56
PBR (x) 0.94 0.90 0.83 0.77
Capex (m) (5,520.7) (3,075.0) (3,121.1) (1,858.9)
Free cash flow (m) (7,578.8) 1,116.8 2,748.7 3,786.0
Net cash/(net debt) (mn)(37,707.0) (36,406.2) n.a. n.a.

Chongqing Rural Commercial Bank [3618.HK] - INITIATION REPORT
China Banking Sector
BUY
Close: HK$ 3.59 (SEP 25th, 2014)
Target Price: HK$ 4.80(+34%)
Liquid balance sheet; low NPL ratio and potential for fee and commission income growth – Initiating with BUY
Investment Highlights:
Chongqing Rural Commercial Bank Co., Ltd., (CRCB) was listed on the main board of
the Hong Kong Exchange in 2010, the first listed agricultural and regional bank. With 42
full branches; 1,772 outlets of all descriptions; and more than 15,000 employees, CRCB
is the biggest bank in the Chongqing region. Formed from the merger of rural credit co-
operatives, CRCB has a substantial rural depositor base, enjoying low-cost deposits
but high-yielding loans, a combination which gives it a net interest margin higher
than most banks in China (NIM: 3.66%). Partly because of this unique rural/urban
blend, CRCB has also successfully managed its asset quality, with a non-performing
loan (NPL) ratio of 0.85% at the end of Jun 2014, the lowest among its peers. CRCB’s
loan-deposit ratio (LDR) is under 60%, and despite its conservative lending posture,
CRCB’s growth outpaces its bigger national peers and is likely to do so in the future. Net
interest income growth (16.6%) and non-interest income (31.3%) year-on-year (YoY) in
1H2014, among the highest in the sector. We CRCB’s ability to manage a risk-averse
strategy and still generate above-average profit and loan growth justify a far higher rat-
ing, and initiate coverage with BUY
● Benefiting from strong Chongqing economy. Net profit increased from RMB3,219.7m in
1H2014 to RMB3,601.7m in 1H2013, up 11.9% YoY. Quarter-on-quarter (QoQ) growth of
loans/deposits was 5.39% and 2.86%, respectively, among the highest in the sector. CRCB
has one of the highest net interest margins (3.38%) and allowance to loans ratio (3.55%); low
NPL ratio (0.85%); and the lowest loan-deposit ratio (57.4%) in China’s banking sector.
● CAR may need attention. Tier 1 capital adequacy ratio (CAR) dropped to 9.8% from 10.96%
as the China Banking Regulatory Commission (CBRC) implemented new capital requirements
affecting interbank and non-standardized assets, taking the ratio close to the required 8.5%.
● Enough space for expansion. While CRCB has a highly liquid balance sheet, it has also
displayed a conservative lending strategy, preferring the low-risk interbank market to the higher
-yielding, but also higher-risk corporate credit market. With a loan-deposit ratio (LDR) below
60% there is no capacity shortage, but the bank’s risk-averse nature is still enabling reasona-
ble growth without unduly threatening the balance sheet.
● Non-interest income growing, but small. Growth in net fee and commission income has
been impressive, and we expect further growth, but in absolute terms it remains a small pro-
portion of net interest income (3.9% in 2013; growing to 5.4% in 2014).
● Undervalued by the market: In the current environment, with a potential series of credit
shocks ahead, CRCB’s prudent approach, marked by very low loan-deposit ratio (LDR) and
stable non-performing loan (NPL) ratio, should be viewed as a plus. Borrowing from rural de-
positors and lending to urban borrowers is the best of both worlds. Our target price (TP) is
HK$4.80, based on PER for 2014E of 5.5x; PBR of 0.91x; DY of 5.2%. Based on our 2015E,
our TP offers a PER of 5x; PBR of 0.8x and DY of 5.7%. We initiate coverage with BUY.
● Key risks: LGFV exposure; macro risk— Low local economic growth, credit crunch.
Figure 1: Key financials
Market Cap US$4,390m
Shares Outstanding 9,300m
Auditor Deloitte Touche
Free Float (H-share) 27%
52W range HK$3.08-$4.20
3M average daily T/O US$1.17m
Major Shareholders
Chongqing Yufu
Assets Management
Group 6.77%
Chongqing City Con-
struction Investment
Group 6.68%
Loncin Holdings Lim-
ited 6.13%
Key Financials 2011 2012 2013 2014E 2015E
Net interest income (RMBm) 10,505 13,092 15,703 17,532 18,936
- Change (%) 40.03% 24.63% 19.94% 11.64% 8.01%
Non interest income (RMB thousand) 613 561 612 953 1,300
- Change (%) 152.60% -8.52% 9.12% 55.61% 36.43%
Net Profit (RMB thousand) 4,247 5,377 6,015 6,790 7,386
- Change (%) 38.77% 26.61% 11.86% 12.89% 8.77%
NPL ratio (%) 1.44% 0.98% 0.80% 0.86% 0.88%
Net Interest Margins (%) 3.36% 3.50% 3.41% 3.14% 3.03%
PER (x) 6.23 4.94 4.48 3.97 3.65
PBR (x) 0.95 0.83 0.74 0.66 0.58
ROE (%) 15.17% 16.69% 16.31% 17.24% 16.55%
ROA (%) 1.35% 1.38% 1.28% 1.25% 1.19%
DY (%) 5.01% 6.06% 6.83% 7.71% 8.38%
Source: Company, CGIHK Research
John Mulcahy—Head of Research
(852) 3698-6889
Research Assistant: Louis Liu

Source: Company, CGIHK Research
CHONGQING RURAL COMMERCIAL BANK: Key Issues
● RRR cut, but limited impact. CRCB was given approval by the China Banking Regulatory
Commission (CBRC) in June this year to cut its reserve requirement ratio (RRR) by 50 bps.
However, with a loan-deposit ratio (LDR) of only 59% there is no immediate benefit.
● Extensive funding and lending network in Chongqing. The region has been growing at a
faster and (apparently) more stable pace than the country as a whole, and is a core city in
China’s western area. GDP overall and per capita, as well as loans and deposits are enjoy-
ing higher growth than the national average.
● New LDR measurement adds liquidity. CBRC’s rural status qualified the bank for the re-
vised calculation of LDR implemented in July this year. CRCB also has a thriving small &
medium enterprise (SME) business, which reduces the LDR calculation further under the
revised format. “Nice to have”, but as in the RRR case, CRCB has enough balance sheet
capacity to meet reasonable growth in loan demand.
● CRCB outpacing sector. The bank’s growth of loans, deposits and net profit all outpaced
the sector in 2013. However, the LDR has fallen further in 2014, to 58%, and suggesting the
bank is reluctant to grow its loan book too aggressively in the current credit environment.
This also explains why there seems to be a preference to provide funding to the interbank
market, where yields are lower, but so are risks.
● Non-interest income opportunity. The share of net fee and commission income in total
income is still low, despite rapid growth in 2013 and 1H 2014. The absolute scale of the
bank’s non-interest income is still relatively modest, despite strong growth, and we believe
further strong growth is achievable.
● CRCB manages risk well. During the past four years, the bank’s NPL ratio decreased from
2.38% to 0.80%, among the lowest in China’s banking sector. In addition, it has one of the
highest coverage ratios—provision to impairments—at 557.5%. CRCB’s credit environment
outlook is by no means perfect, as its share of local government debt is higher than average,
but we still believe CRCB has the ability to handle the risk given its good management and
its preparation for adversity. The NPL increased to 0.85% at the end of Jun due to the wors-
ening manufacturing sector, and a further amber flag is the fall in the Tier 1 capital adequacy
ratio (CAR) in 1H 2014. This drop may force CRCB to raise Tier 1 capital to maintain CAR
above the 8.5% at a time when overall business is still expanding.
2011 2012 2013 2014E 2015E
Net interest income (RMBm) 10,505 13,092 15,703 17,532 18,936
Non-interest income (RMBm) 613 561 612 953 1,300
Operating profit (RMBm) 5,496 7,067 7,916 8,595 9,349
Net profit (RMBm) 4,247 5,377 6,015 6,790 7,386
Total loans (RMBm) 144,350 173,550 205,252 235,898 270,959
Total assets (RMBm) 344,826 433,827 502,446 580,900 660,373
Total deposits (RMBm) 246,141 294,510 347,883 406,328 467,683
Shareholders funds (RMBm) 27,994 32,216 36,889 41,898 47,335
NPLs (%) 1.44% 0.98% 0.80% 0.86% 0.88%
Provision for impairments (%) 3.83% 3.42% 3.46% 3.60% 3.65%
EPS (RMB) 0.46 0.58 0.64 0.72 0.79
DPS (RMB) 0.14 0.17 0.19 0.22 0.24
Return on average assets (%) 1.35% 1.38% 1.28% 1.25% 1.19%
Return on average equity (%) 15.17% 16.69% 16.31% 17.24% 16.55%
Net interest margin (%) 3.36% 3.50% 3.41% 3.14% 3.03%
Cost-to-income ratio (%) 36.64% 37.70% 37.66% 37.70% 37.75%
Loan-deposit ratio (%) 58.64% 58.93% 59.00% 58.06% 57.94%
Tier 1 Capital adequacy ratio (%) N/A 11.30% 11.85% 9.80% 9.90%
Overall Capital adequacy ratio (%) N/A 13.22% 13.64% 12.50% 12.50%
Figure 2: Other key financials

Figure 6: Peer comparison
-
0.5
1.0
1.5
2.0
2.5
De
c-1
0
Ma
r-1
1
Jun
-11
Se
p-1
1
De
c-1
1
Ma
r-1
2
Jun
-12
Se
p-1
2
De
c-1
2
Ma
r-1
3
Jun
-13
Se
p-1
3
De
c-1
3
Ma
r-1
4
Jun
-14
Se
p-1
4
Rolling forward PBR (x) Average
+1 Standard deviation -1 Standard deviation
Figure 3: Share price/PBR:
Figure 4: PBR/PER bands
-
2.0
4.0
6.0
8.0
10.0
12.0D
ec-1
0
Ma
r-1
1
Jun
-11
Se
p-1
1
De
c-1
1
Ma
r-1
2
Jun
-12
Se
p-1
2
De
c-1
2
Ma
r-1
3
Jun
-13
Se
p-1
3
De
c-1
3
Ma
r-1
4
Jun
-14
Se
p-1
4
Rolling forward PER (x) Average
+1 Standard deviation -1 Standard deviation
P/B Ratio 2014E 1.4 1.3 1.2 1.1 1.0 0.9 0.8 0.7 0.6
Market Cap (HK$m) 72,516 67,336 62,156 56,977 51,797 46,617 41,438 36,258 31,078
Value Per Share (HK$) 7.72 7.16 6.61 6.06 5.51 4.96 4.41 3.86 3.31
P/E Ratio 2014E 11 10 9 8 7 6 5 4 3
Market Cap (HK$m) 94,351 85,774 77,197 68,619 60,042 51,464 42,887 34,310 25,732
Value Per Share (HK$) 10.04 9.13 8.21 7.30 6.39 5.48 4.56 3.65 2.74
P/B Ratio 2014E 1.4 1.3 1.2 1.1 1.0 0.9 0.8 0.7 0.6
P/E Ratio 2014E 8.5 7.9 7.2 6.6 6.0 5.4 4.8 4.2 3.6
Value Per Share (HK$) 7.7 7.2 6.6 6.1 5.5 5.0 4.4 3.9 3.3
Figure 5: Table for valuation
Source: Company, CGIHK Research
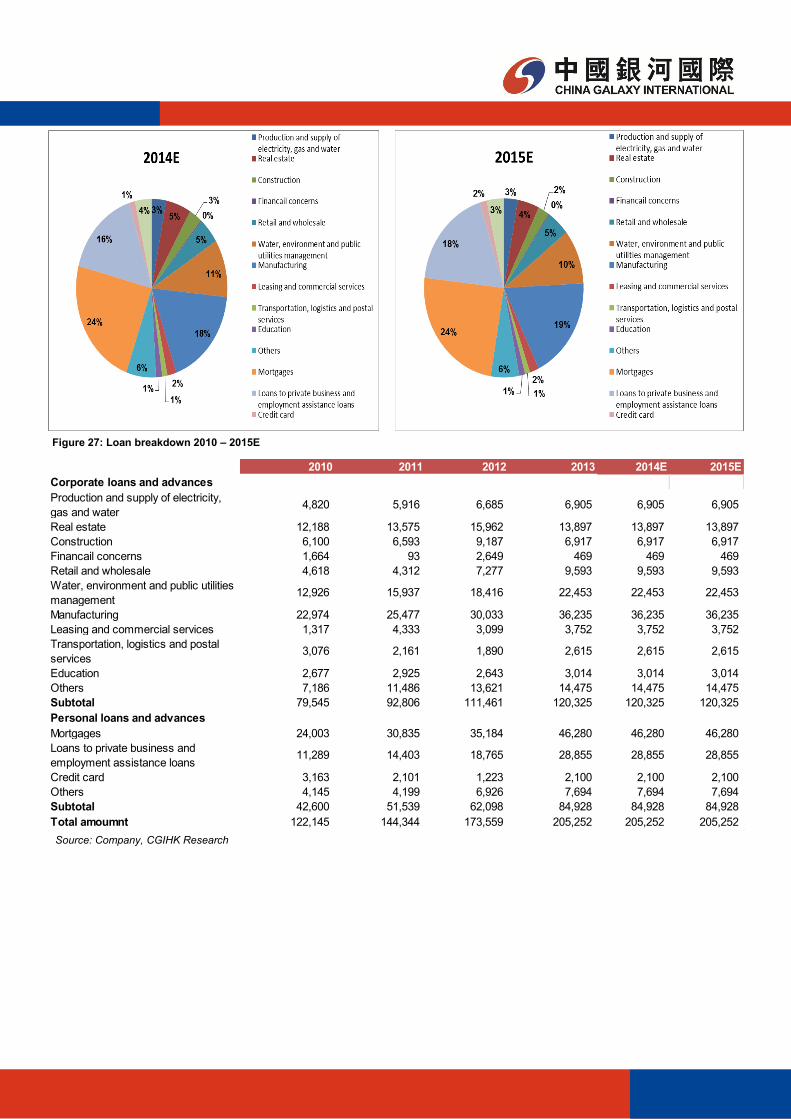
Figure 27: Loan breakdown 2010 – 2015E
2010 2011 2012 2013 2014E 2015E
Corporate loans and advances
Production and supply of electricity,
gas and water4,820 5,916 6,685 6,905 6,905 6,905
Real estate 12,188 13,575 15,962 13,897 13,897 13,897
Construction 6,100 6,593 9,187 6,917 6,917 6,917
Financail concerns 1,664 93 2,649 469 469 469
Retail and wholesale 4,618 4,312 7,277 9,593 9,593 9,593
Water, environment and public utilities
management12,926 15,937 18,416 22,453 22,453 22,453
Manufacturing 22,974 25,477 30,033 36,235 36,235 36,235
Leasing and commercial services 1,317 4,333 3,099 3,752 3,752 3,752
Transportation, logistics and postal
services3,076 2,161 1,890 2,615 2,615 2,615
Education 2,677 2,925 2,643 3,014 3,014 3,014
Others 7,186 11,486 13,621 14,475 14,475 14,475
Subtotal 79,545 92,806 111,461 120,325 120,325 120,325
Personal loans and advances
Mortgages 24,003 30,835 35,184 46,280 46,280 46,280
Loans to private business and
employment assistance loans11,289 14,403 18,765 28,855 28,855 28,855
Credit card 3,163 2,101 1,223 2,100 2,100 2,100
Others 4,145 4,199 6,926 7,694 7,694 7,694
Subtotal 42,600 51,539 62,098 84,928 84,928 84,928
Total amoumnt 122,145 144,344 173,559 205,252 205,252 205,252
Source: Company, CGIHK Research

Figure 40: Income statement and key ratios
(Unit: RMBm) 2011 2012 2013 2014E 2015E
Income statement
Interest income 17,539 22,332 27,180 31,152 35,046
Interest expense -7,034 -9,239 -11,477 -13,621 -16,111
Net interest income 10,505 13,092 15,703 17,532 18,936
Fee and commission income 671 488 739 973 1,263
Fee and commission expense -36 -53 -59 -78 -101
Net fee and commission income 635 436 680 895 1,162
Net trading gain/loss 23 13 -198 -99 -49
Other operating income, net -45 112 130 156 188
Operating income 11,118 13,653 16,315 18,484 20,235
Operating expenses -5,622 -6,586 -8,399 -9,889 -10,887
Operating Profit 5,496 7,067 7,916 8,595 9,349
Share of profits of associates and jointly-
controlled entities - - - - -
Profit before tax 5,496 7,067 7,916 8,595 9,349
Income tax expense -1,249 -1,690 -1,902 -1,805 -1,963
Net profit 4,247 5,377 6,015 6,790 7,386
Basic earnings per share (in RMB) 0.46 0.58 0.64 0.72 0.79
(%) 2011 2012 2013 2014E 2015E
Key Ratios
P/B: 0.95 0.83 0.74 0.66 0.58
P/E: 6.23 4.94 4.48 3.97 3.65
Loan-to-deposit Ratio: 58.64% 58.93% 59.00% 58.06% 57.94%
Net interest income growth: 40.03% 24.63% 19.94% 11.64% 8.01%
Non interest income growth: 152.60% -8.52% 9.12% 55.61% 36.43%
Profit Growth: 38.77% 26.61% 11.86% 12.89% 8.77%
NPL Ratios: 1.44% 0.98% 0.80% 0.86% 0.88%
Interest Margin: 3.36% 3.50% 3.41% 3.14% 3.03%

Figure 41: Balance sheet
(Unit: RMBm) 2011 2012 2013 2014E 2015E
Balance sheet
Assets:
Cash and deposits with central banks 50,663 58,964 68,782 72,221 74,388
Due from banks and non-bank financial
institutions 65,202 93,777 119,541 145,840 169,175
Loans and advances to customers 138,822 167,615 198,151 227,406 261,069
Financial investments 82,342 104,874 105,984 124,001 142,602
Property and equipment 2,711 3,154 3,574 3,503 3,328
Deferred tax assets 1,523 1,457 1,867 2,427 3,155
Other assets 3,562 3,987 4,547 5,502 6,657
Total assets 344,826 433,827 502,446 580,900 660,373
Liabilities
Due to central banks 30 110 185 278 416
Derivative financial liabilities 366 5,076 1,040 833 666
Due to banks and non-bank financial
institutions 60,017 91,733 103,586 123,850 143,386
Due to customers 246,141 294,510 347,883 406,328 467,683
Deferred tax liabilities 905 652 981 1,010 1,041
Bonds payable 2,300 2,300 2,300 2,530 2,783
Other liabilities 7,073 7,229 9,582 4,174 -2,938
Total liabilities 316,832 401,611 465,557 539,002 613,037
Equity:
Share capital 9,300 9,300 9,300 9,300 9,300
Reserves and retained profits 18,539 22,607 26,951 31,705 36,874
Non-controlling interests 155 309 638 893 1,161
Total equity 27,994 32,216 36,889 41,898 47,335
Total liabilities and equity 344,826 433,827 502,446 580,900 660,373
Disclaimer
This research report is not directed at, or intended for distribution to or used by, any person or entity who is a citizen or resident of or located in any jurisdiction where such distribution, publication, availability or use would be contrary to applicable law or regulation or which would subject China Galaxy International Securities (Hong Kong) Co., Limited (“Galaxy International Securities”) and/or its group companies to any registration or licensing requirement within such jurisdiction.
This report (including any information attached) is issued by Galaxy International Securities, one of the subsidiaries of the China Galaxy International Financial Holdings Limited, to the institutional clients from the information sources believed to be reliable, but no representation or warranty (expressly or implied) is made as to their accuracy, correctness and/or completeness.
This report shall not be construed as an offer, invitation or solicitation to buy or sell any securities of the company(ies) referred to herein. Past perfor-mance should not be taken as an indication or guarantee of future performance, and no representation or warranty, express or implied, is made regard-ing future performance. The recipient of this report should understand and comprehend the investment objectives and its related risks, and where necessary consult their own independent financial advisers prior to any investment decision.
Where any part of the information, opinions or estimates contained herein reflects the personal views and opinions of the analyst who prepared this report, such views and opinions may not correspond to the published views or investment decisions of China Galaxy International Financial Holdings Limited and any of its subsidiaries (“China Galaxy International”), directors, officers, agents and employees (“the Relevant Parties”).
All opinions and estimates reflect the judgment of the analyst on the date of this report and are subject to change without notice. China Galaxy Interna-tional and/or the Relevant Parties hereby disclaim any of their liabilities arising from the inaccuracy, incorrectness and incompleteness of this report and its attachment/s and/or any action or omission made in reliance thereof. Accordingly, this report must be read in conjunction with this disclaimer.
Disclosure of Interests
China Galaxy International may have financial interests in relation to the subjected company(ies) the securities in respect of which are reviewed in this report, and such interests aggregate to an amount may equal to or more than 1 % of the subjected company(ies)’ market capitalization.
One or more directors, officers and/or employees of China Galaxy International may be a director or officer of the securities of the company(ies) men-tioned in this report.
China Galaxy International and the Relevant Parties may, to the extent permitted by law, from time to time participate or invest in financing transac-tions with the securities of the company(ies) mentioned in this report, perform services for or solicit business from such company(ies), and/or have a position or holding, or other material interest, or effect transactions, in such securities or options thereon, or other investments related thereto.
China Galaxy International may have served as manager or co-manager of a public offering of securities for, or currently may make a primary market in issues of, any or all of the entities mentioned in this report or may be providing, or have provided within the last 12 months, significant advice or invest-ment services in relation to the investment concerned or a related investment or investment banking services to the company(ies) mentioned in this report.
Furthermore, China Galaxy International may have received compensation for investment banking services from the company(ies) mentioned in this report within the preceding 12 months and may currently seeking investment banking mandate from the subject company(ies).
Analyst Certification
The analyst who is primarily responsible for the content of this report, in whole or in part, certifies that with respect to the securities or issuer covered in this report: (1) all of the views expressed accurately reflect his or her personal views about the subject, securities or issuer; and (2) no part of his or her compensation was, is, or will be, directly or indirectly, related to the specific views expressed by the analyst in this report.
Besides, the analyst confirms that neither the analyst nor his/her associates (as defined in the code of conduct issued by The Hong Kong Securities and Futures Commission) (1) have dealt in or traded in the securities covered in this research report within 30 calendar days prior to the date of issue of this report; (2) will deal in or trade in the securities covered in this research report three business days after the date of issue of this report; (3) serve as an officer of any of the Hong Kong-listed companies covered in this report; and (4) have any financial interests in the Hong Kong-listed companies cov-ered in this report.
Explanation on Equity Ratings
Copyright Reserved
No part of this material may be reproduced or redistributed without the prior written consent of China Galaxy International Securities (Hong Kong) Co., Limited.
China Galaxy International Securities (Hong Kong) Co. Limited, CE No.AXM459
Room 3501-3507, 35/F, Cosco Tower, Grand Millennium Plaza, 183 Queen’s Road Central, Sheung Wan, Hong Kong. General line: 3698-6888.
BUY share price will increase by >20% within 12 months in absolute terms :
SELL share price will decrease by >20% within 12 months in absolute terms :
HOLD no clear catalyst, and downgraded from BUY pending clearer signal to reinstate BUY or further downgrade to outright SELL :


![Yum Cha 飲 茶 - chinastock.com.hk · 2 Kingdee International [0268.HK] Kingdee International (Kingdee) reported a satisfactory set of 1H 2016 results. Its 20.5% top-line growth](https://img.pdfslide.us/doc/110x75/5f0850d57e708231d4216792/yum-cha-e-eoe-2-kingdee-international-0268hk-kingdee-international-kingdee.jpg)
![Yum Cha 飲 茶€¦ · Yum Cha 飲 茶 March 20, 2013 Source: Bloomberg TALKING POINTS TIANNENG POWER [0819.HK, HK$5.50] — Gross margin of about 18% (based on original accounting](https://img.pdfslide.us/doc/110x75/6016b4edf548b25fc7427010/yum-cha-e-eoe-yum-cha-e-eoe-march-20-2013-source-bloomberg-talking-points.jpg)

![Yum Cha 飲 茶€¦ · valued at US$10bn. Ping An Insurance [2318.HK; BUY], as the major shareholder of Lufax, will definitely be the key beneficiary. As of end-2014, Ping An owned](https://img.pdfslide.us/doc/110x75/5fc780a2f623e4271a58ef35/yum-cha-e-eoe-valued-at-us10bn-ping-an-insurance-2318hk-buy-as-the-major.jpg)


![Yum Cha 飲 茶...Yum Cha 飲 茶 July 31, 2013 DIARY NOTES FOR THIS WEEK July 29 Leading Index (Jun) [previous: 99.6] August 1 RETAIL: Manufacturing PMI (Jul) [previous: 50.1] August](https://img.pdfslide.us/doc/110x75/5fa022d214d23742e44440b7/yum-cha-e-eoe-yum-cha-e-eoe-july-31-2013-diary-notes-for-this-week-july.jpg)