Embed Size (px)
DESCRIPTION
ratio analysis and recommendation SWOT
Citation preview
YTL LAND AND DEVELOPMENT BERHADUKAM 4024 INTEGRATED CASE STUDY
CASE 3
1
Student Name ID Number
DANESWARY GANESAN 11UKB00248
DESMOND TANG KWONG YIK 10UKB01963
LOH YOKE YEN 11UKB01138
YUEN SHET YEE 10UKB04141
● Founded in 1955 by Tan Sri Dato' Seri Yeoh Tiong Lay● Operates in two segments: property development &
management and construction
2
INTRODUCTION
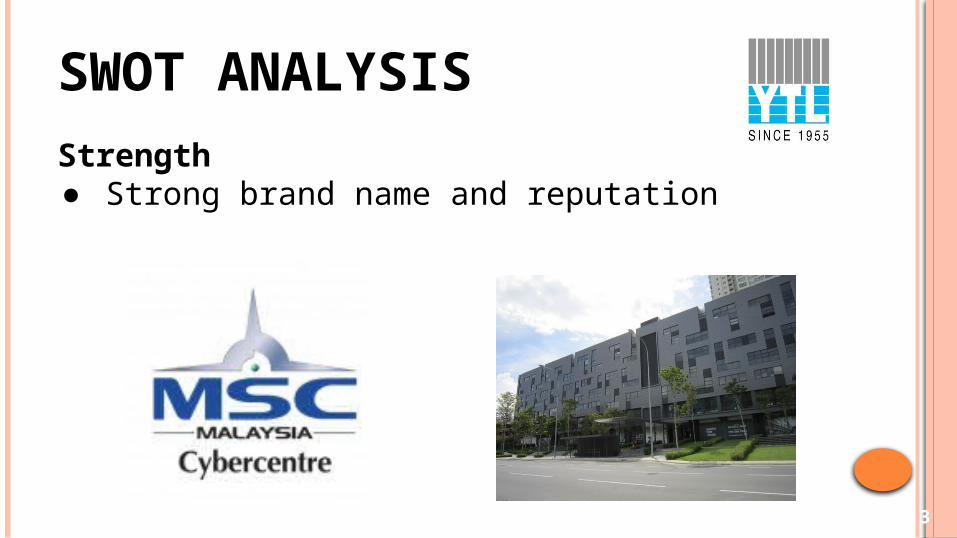
SWOT ANALYSIS
Strength● Strong brand name and reputation
3
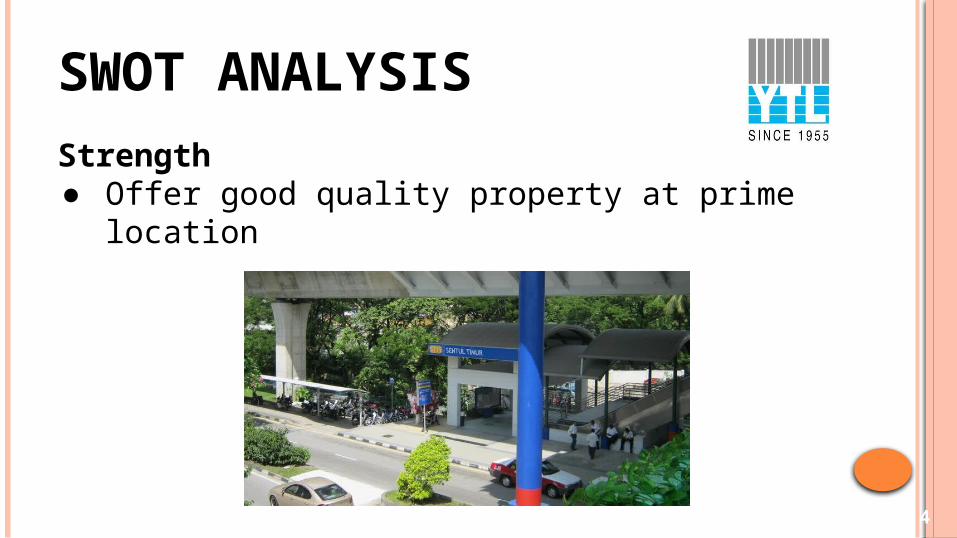
SWOT ANALYSIS
Strength● Offer good quality property at prime location
4
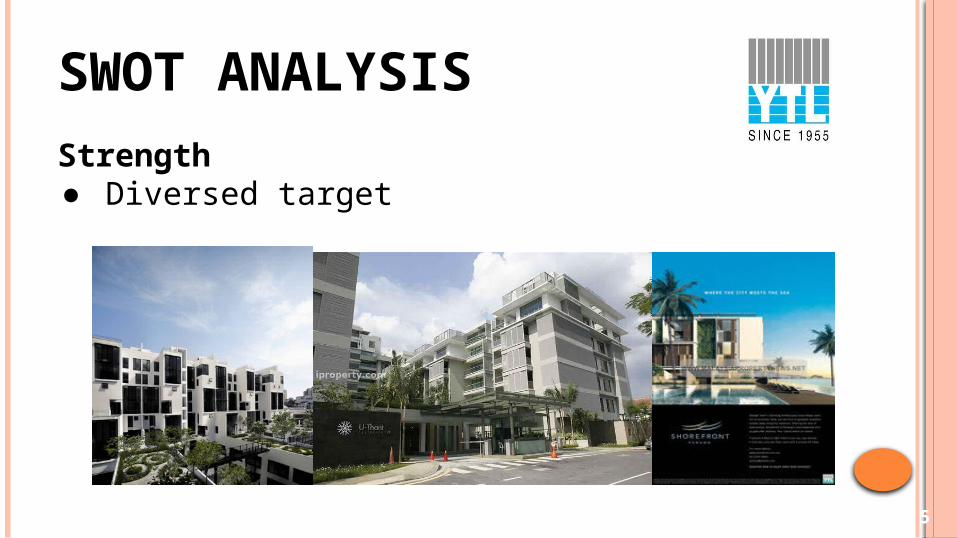
SWOT ANALYSIS
Strength● Diversed target
5
SWOT ANALYSIS
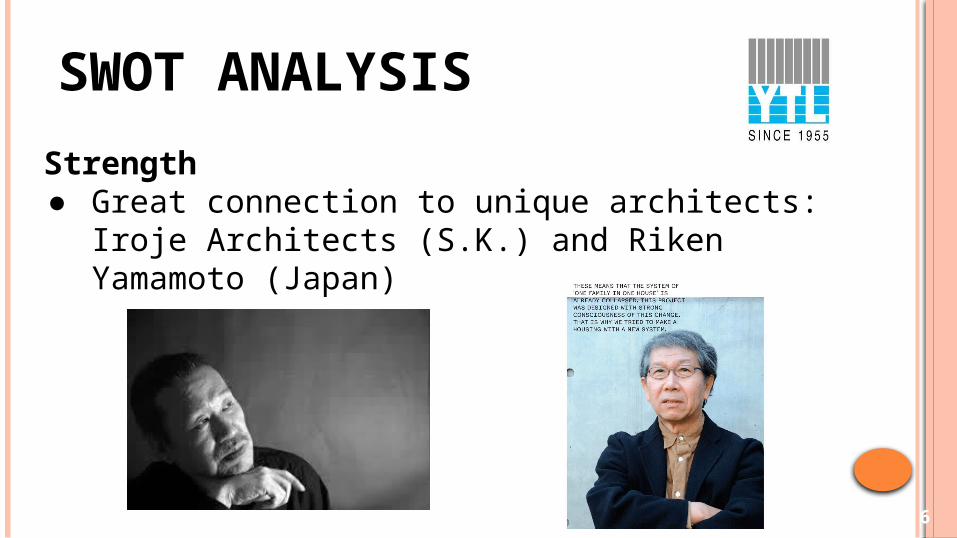
Strength● Great connection to unique architects: Iroje Architects (S.K.)
and Riken Yamamoto (Japan)
6
SWOT ANALYSIS
Weaknesses
● Too many diverse projects: Bangsar-PJ, KL, Sentul, Penang
7
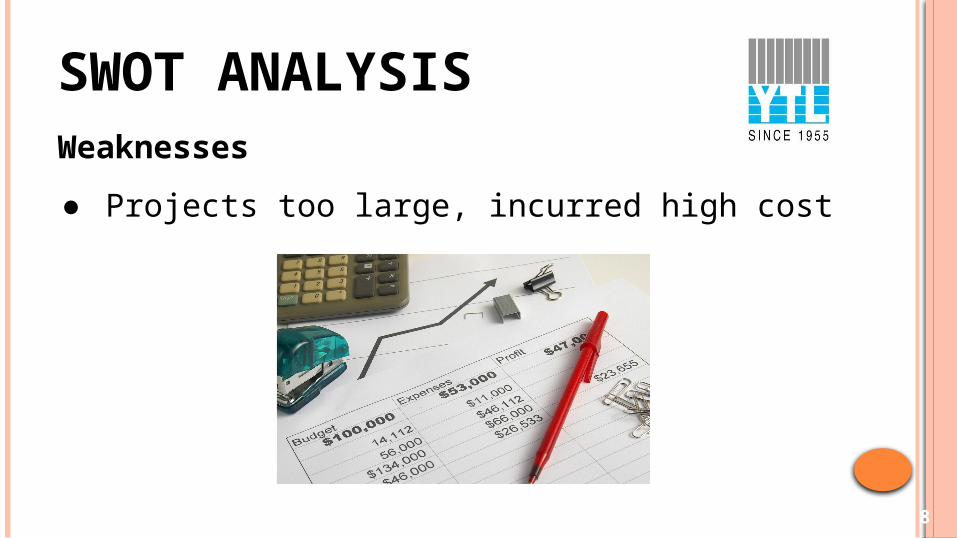
SWOT ANALYSISWeaknesses
● Projects too large, incurred high cost
8
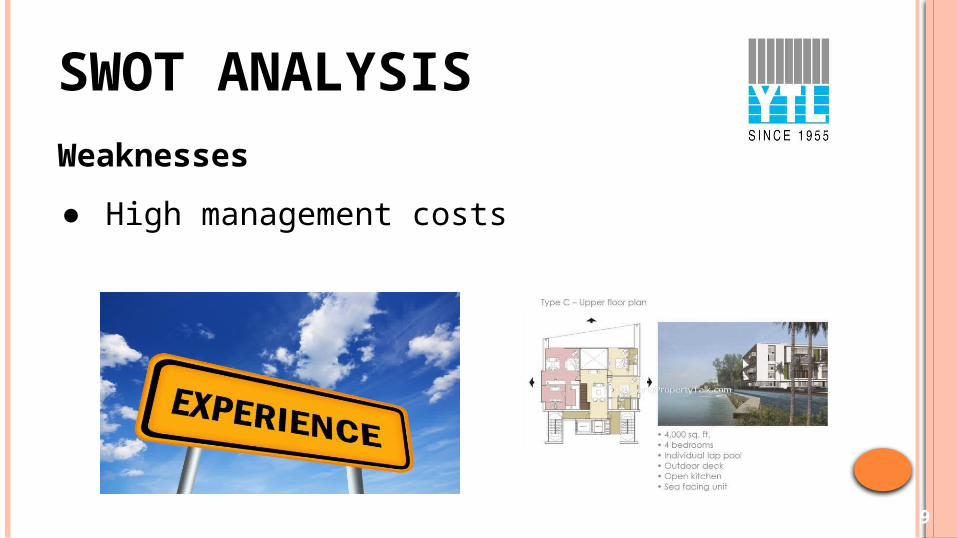
SWOT ANALYSIS
Weaknesses
● High management costs
9
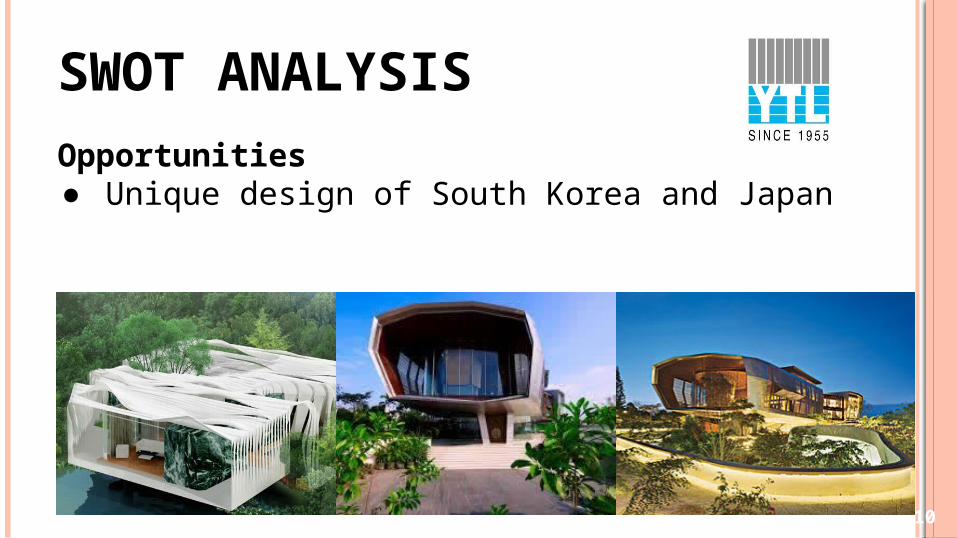
SWOT ANALYSIS
Opportunities● Unique design of South Korea and Japan
10
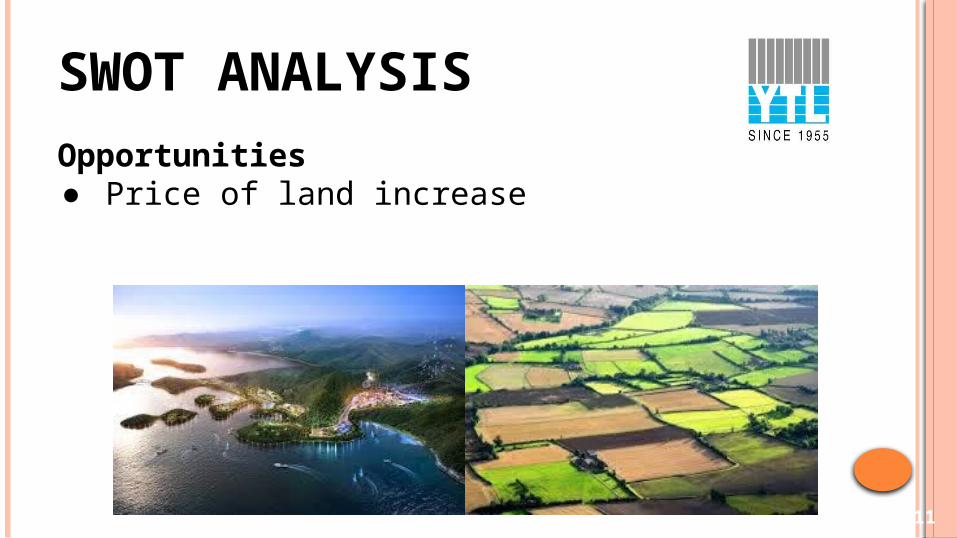
SWOT ANALYSIS
Opportunities● Price of land increase
11
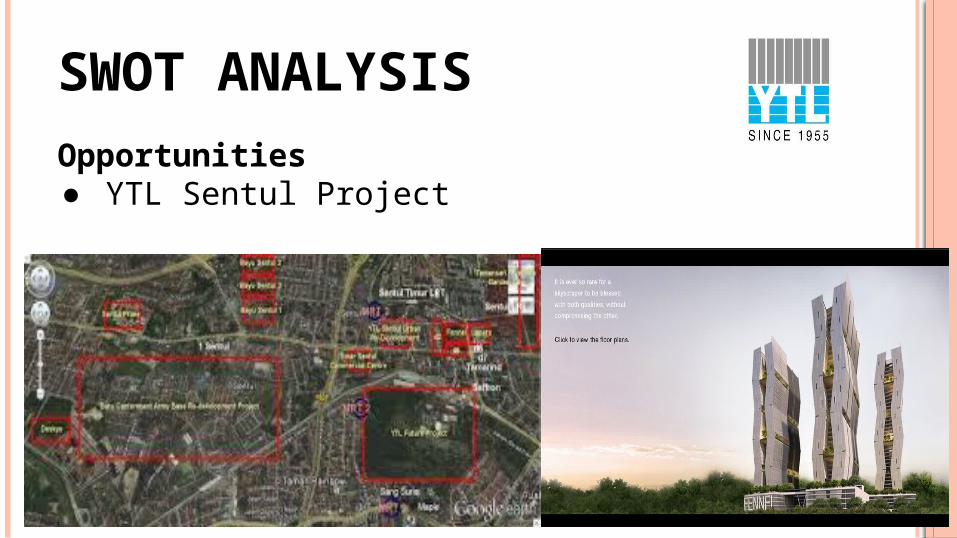
SWOT ANALYSIS
Opportunities● YTL Sentul Project
12
SWOT ANALYSIS
Opportunities● Advancement in technology
13
SWOT ANALYSIS
Threats● Bad economy● Volatile currencies
14
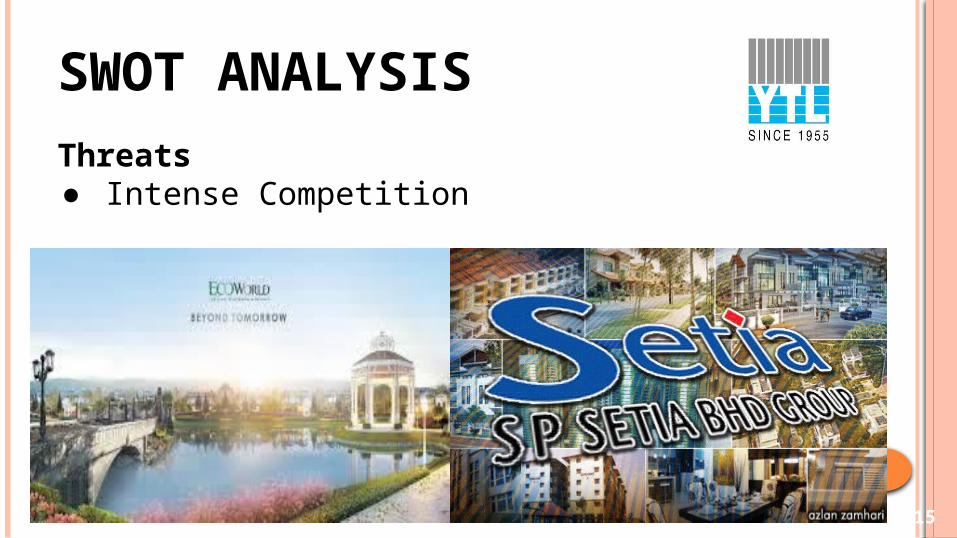
SWOT ANALYSIS
Threats● Intense Competition
15
SWOT ANALYSIS
Threats● Changes in government policy and regulations
16
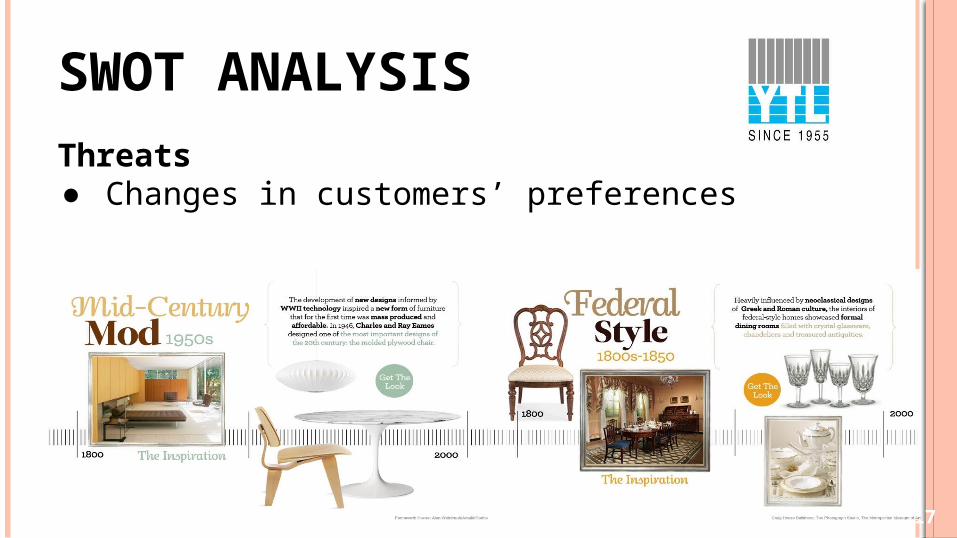
SWOT ANALYSIS
Threats● Changes in customers’ preferences
17
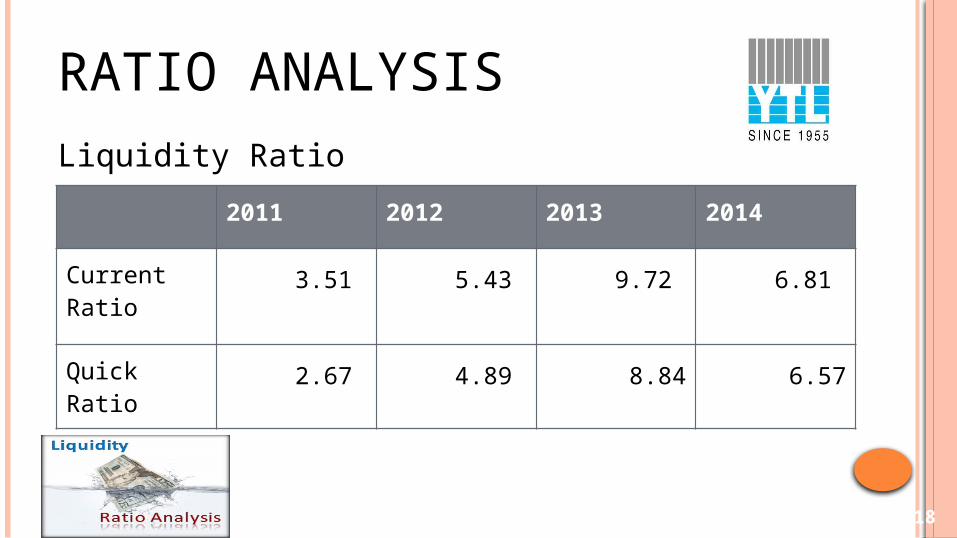
RATIO ANALYSIS
Liquidity Ratio
18
2011 2012 2013 2014
Current Ratio
3.51 5.43 9.72 6.81
Quick Ratio 2.67 4.89 8.84 6.57
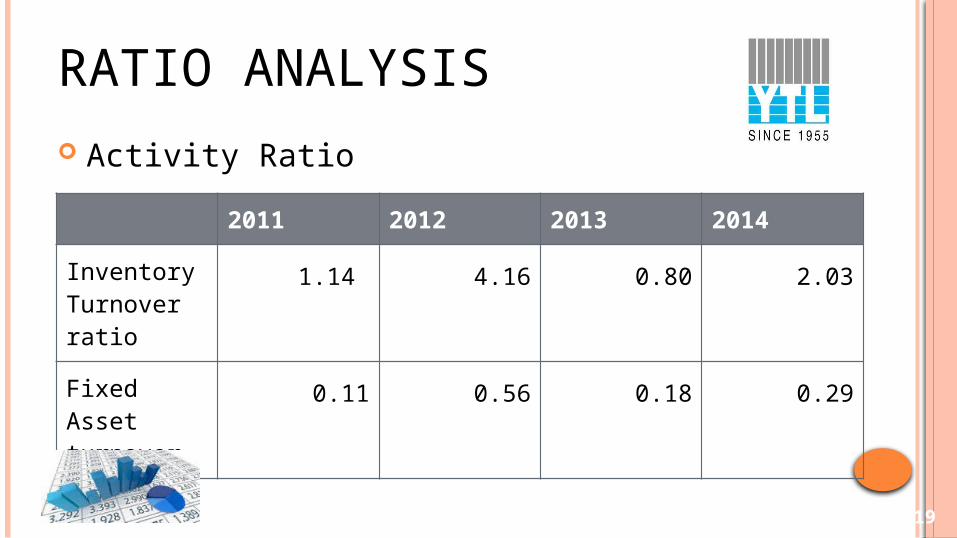
RATIO ANALYSIS Activity Ratio
19
2011 2012 2013 2014
Inventory Turnover ratio
1.14 4.16 0.80 2.03
Fixed Asset turnover
0.11 0.56 0.18 0.29
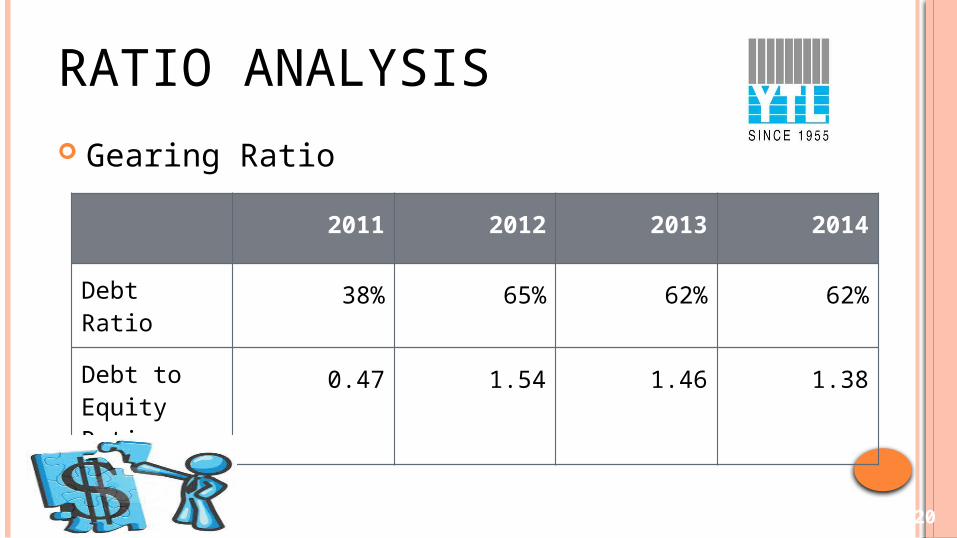
RATIO ANALYSIS Gearing Ratio
20
2011 2012 2013 2014
Debt Ratio 38% 65% 62% 62%
Debt to Equity Ratio
0.47 1.54 1.46 1.38
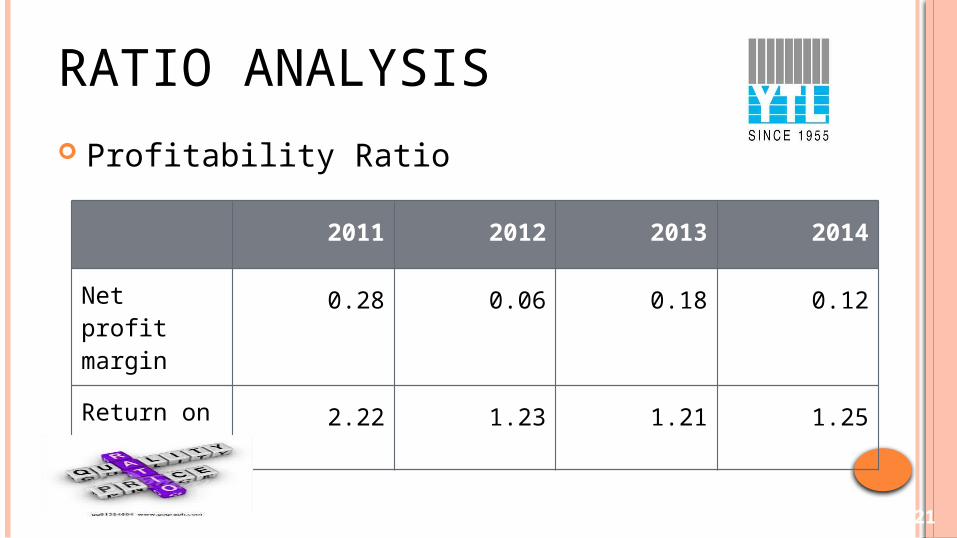
RATIO ANALYSIS Profitability Ratio
21
2011 2012 2013 2014
Net profit margin
0.28 0.06 0.18 0.12
Return on asset
2.22 1.23 1.21 1.25
RECOMMENDATION
How to compete with competitor?1. More creative design, attract customer2. Diversification-supporting business-sales agent3. E-commerce4. Improve supplier relationship-better supply chain5. Strategic marketing through building own town
22