Embed Size (px)
Citation preview
MIDF RESEARCH is a unit of MIDF AMANAH INVESTMENT BANK
Kindly refer to the last page of this publication for important disclosures
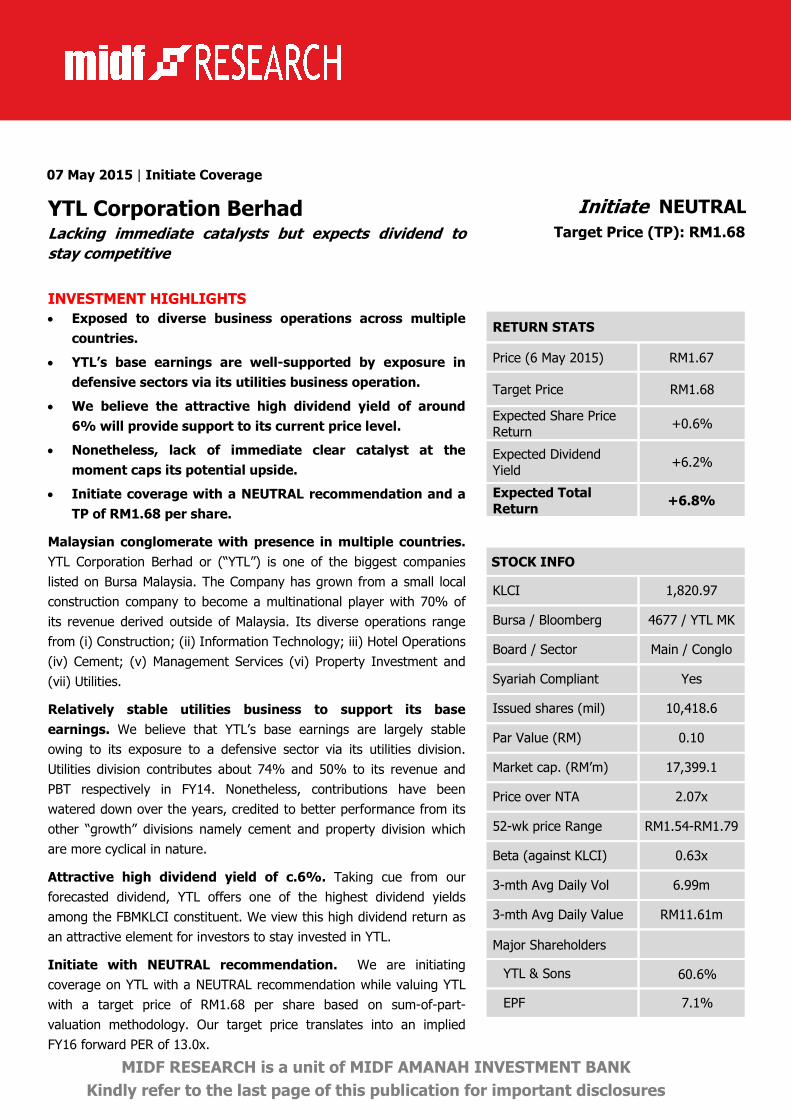
07 May 2015 | Initiate Coverage
YTL Corporation Berhad Initiate NEUTRAL
Lacking immediate catalysts but expects dividend to
stay competitive
Target Price (TP): RM1.68
INVESTMENT HIGHLIGHTS
• Exposed to diverse business operations across multiple
countries.
• YTL’s base earnings are well-supported by exposure in
defensive sectors via its utilities business operation.
• We believe the attractive high dividend yield of around
6% will provide support to its current price level.
• Nonetheless, lack of immediate clear catalyst at the
moment caps its potential upside.
• Initiate coverage with a NEUTRAL recommendation and a
TP of RM1.68 per share.
Malaysian conglomerate with presence in multiple countries.
YTL Corporation Berhad or (“YTL”) is one of the biggest companies
listed on Bursa Malaysia. The Company has grown from a small local
construction company to become a multinational player with 70% of
its revenue derived outside of Malaysia. Its diverse operations range
from (i) Construction; (ii) Information Technology; iii) Hotel Operations
(iv) Cement; (v) Management Services (vi) Property Investment and
(vii) Utilities.
Relatively stable utilities business to support its base
earnings. We believe that YTL’s base earnings are largely stable
owing to its exposure to a defensive sector via its utilities division.
Utilities division contributes about 74% and 50% to its revenue and
PBT respectively in FY14. Nonetheless, contributions have been
watered down over the years, credited to better performance from its
other “growth” divisions namely cement and property division which
are more cyclical in nature.
Attractive high dividend yield of c.6%. Taking cue from our
forecasted dividend, YTL offers one of the highest dividend yields
among the FBMKLCI constituent. We view this high dividend return as
an attractive element for investors to stay invested in YTL.
Initiate with NEUTRAL recommendation. We are initiating
coverage on YTL with a NEUTRAL recommendation while valuing YTL
with a target price of RM1.68 per share based on sum-of-part-
valuation methodology. Our target price translates into an implied
FY16 forward PER of 13.0x.
RETURN STATS
Price (6 May 2015) RM1.67
Target Price RM1.68
Expected Share Price Return
+0.6%
Expected Dividend Yield
+6.2%
Expected Total
Return +6.8%
STOCK INFO
KLCI 1,820.97
Bursa / Bloomberg 4677 / YTL MK
Board / Sector Main / Conglo
Syariah Compliant Yes
Issued shares (mil) 10,418.6
Par Value (RM) 0.10
Market cap. (RM’m) 17,399.1
Price over NTA 2.07x
52-wk price Range RM1.54-RM1.79
Beta (against KLCI) 0.63x
3-mth Avg Daily Vol 6.99m
3-mth Avg Daily Value RM11.61m
Major Shareholders
YTL & Sons 60.6%
EPF 7.1%
MIDF RESEARCH Thursday, 07 May 2015
2
COMPANY BACKGROUND
Founded in 1955 by Tan Sri Yeoh Tiong Lay, YTL started as a small construction company when it won jobs as
contractor for the government buildings mainly schools and hospitals. YTL has grown to become one of the
largest corporations in Malaysia and now known as a major turnkey developer and operator with expertise in
power generation, construction contracting, property development, manufacturing and trading and hotels and
tourism. Apart from these businesses, YTL are also involved in operation & maintenance (O&M) and information
technology.
Figure 1: YTL’s Organisation Chart
Source: YTL, MIDFR
YTL’s transformation from being a pure construction company into one of the biggest conglomerates in
Malaysia started when it ventured into utilities sector as it became the first Malaysian IPP in the 90s. YTL also
ventured into public facility segment with its involvement in the construction and operation of ERL linking Kuala
Lumpur and KLIA. Armed with steady earnings from its local business, YTL embarked on its global expansion in
the beginning 21st century with the acquisition of Wessex Water in 2002 and various other utilities businesses
across the globe.
YTL is now present in at least 11 countries, a truly remarkable achievement for this local based conglomerate.
MIDF RESEARCH Thursday, 07 May 2015
3
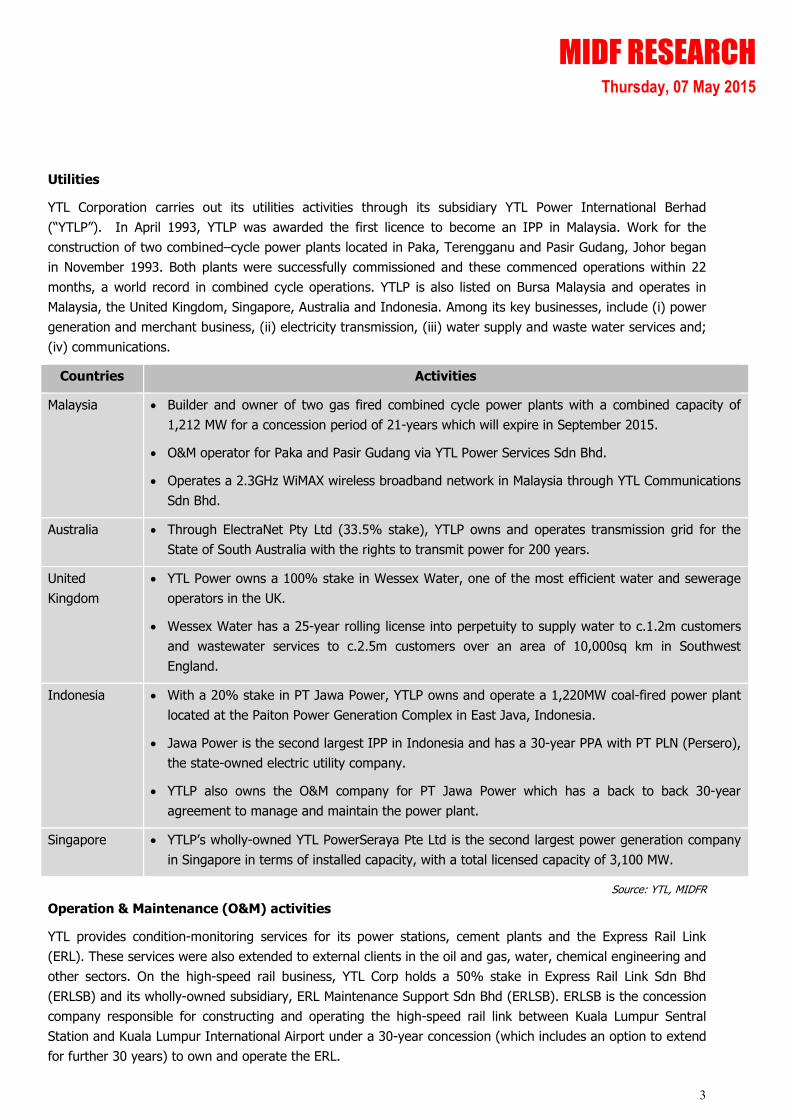
Utilities
YTL Corporation carries out its utilities activities through its subsidiary YTL Power International Berhad
(“YTLP”). In April 1993, YTLP was awarded the first licence to become an IPP in Malaysia. Work for the
construction of two combined–cycle power plants located in Paka, Terengganu and Pasir Gudang, Johor began
in November 1993. Both plants were successfully commissioned and these commenced operations within 22
months, a world record in combined cycle operations. YTLP is also listed on Bursa Malaysia and operates in
Malaysia, the United Kingdom, Singapore, Australia and Indonesia. Among its key businesses, include (i) power
generation and merchant business, (ii) electricity transmission, (iii) water supply and waste water services and;
(iv) communications.
Countries Activities
Malaysia • Builder and owner of two gas fired combined cycle power plants with a combined capacity of
1,212 MW for a concession period of 21-years which will expire in September 2015.
• O&M operator for Paka and Pasir Gudang via YTL Power Services Sdn Bhd.
• Operates a 2.3GHz WiMAX wireless broadband network in Malaysia through YTL Communications
Sdn Bhd.
Australia • Through ElectraNet Pty Ltd (33.5% stake), YTLP owns and operates transmission grid for the
State of South Australia with the rights to transmit power for 200 years.
United
Kingdom
• YTL Power owns a 100% stake in Wessex Water, one of the most efficient water and sewerage
operators in the UK.
• Wessex Water has a 25-year rolling license into perpetuity to supply water to c.1.2m customers
and wastewater services to c.2.5m customers over an area of 10,000sq km in Southwest
England.
Indonesia • With a 20% stake in PT Jawa Power, YTLP owns and operate a 1,220MW coal-fired power plant
located at the Paiton Power Generation Complex in East Java, Indonesia.
• Jawa Power is the second largest IPP in Indonesia and has a 30-year PPA with PT PLN (Persero),
the state-owned electric utility company.
• YTLP also owns the O&M company for PT Jawa Power which has a back to back 30-year
agreement to manage and maintain the power plant.
Singapore • YTLP’s wholly-owned YTL PowerSeraya Pte Ltd is the second largest power generation company
in Singapore in terms of installed capacity, with a total licensed capacity of 3,100 MW.
Source: YTL, MIDFR
Operation & Maintenance (O&M) activities
YTL provides condition-monitoring services for its power stations, cement plants and the Express Rail Link
(ERL). These services were also extended to external clients in the oil and gas, water, chemical engineering and
other sectors. On the high-speed rail business, YTL Corp holds a 50% stake in Express Rail Link Sdn Bhd
(ERLSB) and its wholly-owned subsidiary, ERL Maintenance Support Sdn Bhd (ERLSB). ERLSB is the concession
company responsible for constructing and operating the high-speed rail link between Kuala Lumpur Sentral
Station and Kuala Lumpur International Airport under a 30-year concession (which includes an option to extend
for further 30 years) to own and operate the ERL.
MIDF RESEARCH Thursday, 07 May 2015
4
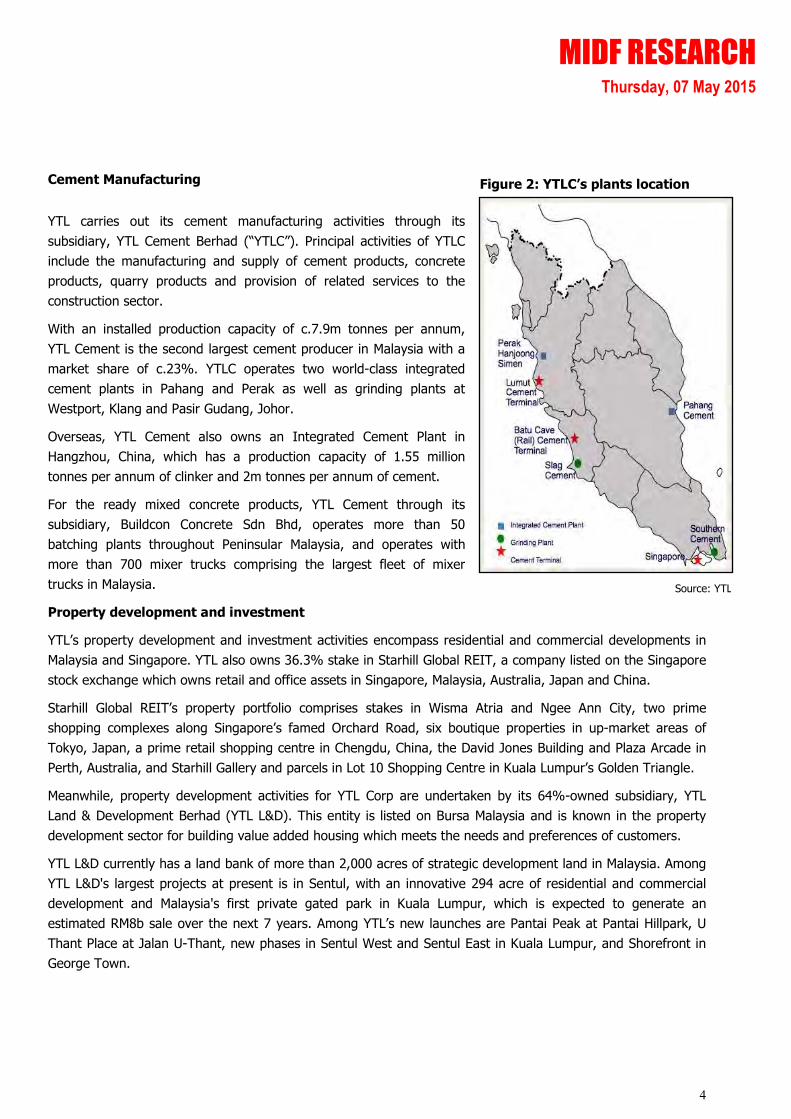
Figure 2: YTLC’s plants location
Source: YTL
Cement Manufacturing
YTL carries out its cement manufacturing activities through its
subsidiary, YTL Cement Berhad (“YTLC”). Principal activities of YTLC
include the manufacturing and supply of cement products, concrete
products, quarry products and provision of related services to the
construction sector.
With an installed production capacity of c.7.9m tonnes per annum,
YTL Cement is the second largest cement producer in Malaysia with a
market share of c.23%. YTLC operates two world-class integrated
cement plants in Pahang and Perak as well as grinding plants at
Westport, Klang and Pasir Gudang, Johor.
Overseas, YTL Cement also owns an Integrated Cement Plant in
Hangzhou, China, which has a production capacity of 1.55 million
tonnes per annum of clinker and 2m tonnes per annum of cement.
For the ready mixed concrete products, YTL Cement through its
subsidiary, Buildcon Concrete Sdn Bhd, operates more than 50
batching plants throughout Peninsular Malaysia, and operates with
more than 700 mixer trucks comprising the largest fleet of mixer
trucks in Malaysia.
Property development and investment
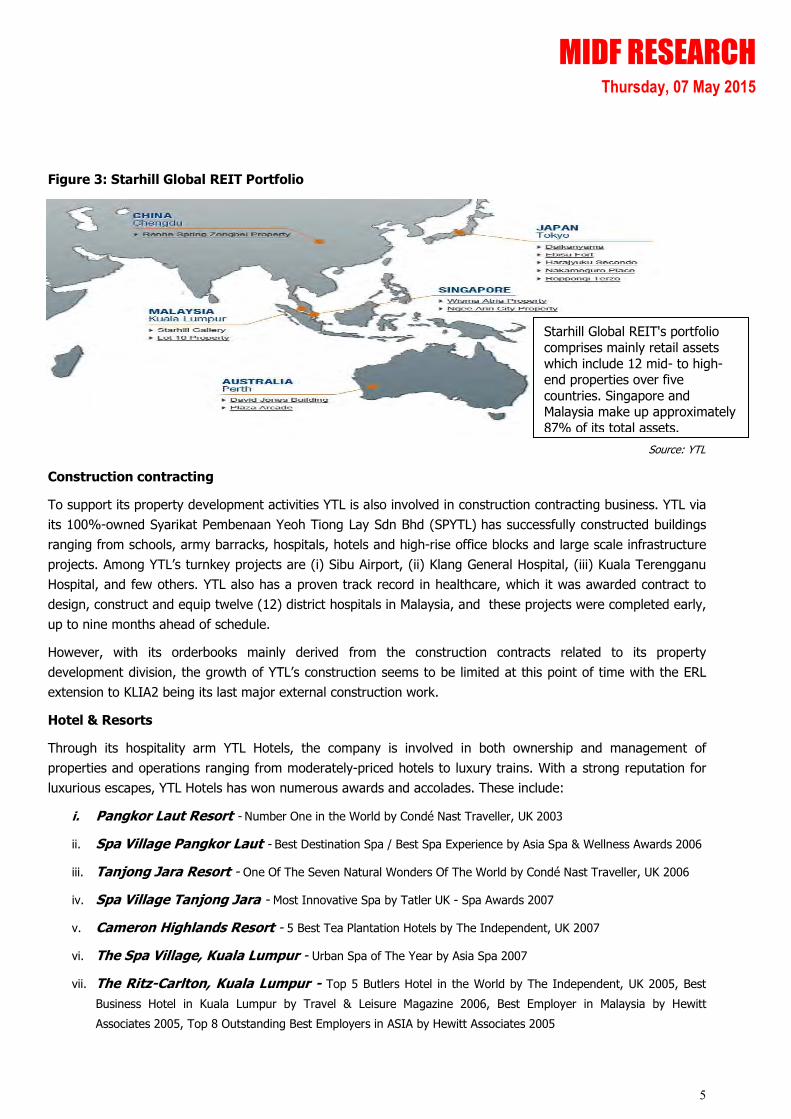
YTL’s property development and investment activities encompass residential and commercial developments in
Malaysia and Singapore. YTL also owns 36.3% stake in Starhill Global REIT, a company listed on the Singapore
stock exchange which owns retail and office assets in Singapore, Malaysia, Australia, Japan and China.
Starhill Global REIT’s property portfolio comprises stakes in Wisma Atria and Ngee Ann City, two prime
shopping complexes along Singapore’s famed Orchard Road, six boutique properties in up-market areas of
Tokyo, Japan, a prime retail shopping centre in Chengdu, China, the David Jones Building and Plaza Arcade in
Perth, Australia, and Starhill Gallery and parcels in Lot 10 Shopping Centre in Kuala Lumpur’s Golden Triangle.
Meanwhile, property development activities for YTL Corp are undertaken by its 64%-owned subsidiary, YTL
Land & Development Berhad (YTL L&D). This entity is listed on Bursa Malaysia and is known in the property
development sector for building value added housing which meets the needs and preferences of customers.
YTL L&D currently has a land bank of more than 2,000 acres of strategic development land in Malaysia. Among
YTL L&D's largest projects at present is in Sentul, with an innovative 294 acre of residential and commercial
development and Malaysia's first private gated park in Kuala Lumpur, which is expected to generate an
estimated RM8b sale over the next 7 years. Among YTL’s new launches are Pantai Peak at Pantai Hillpark, U
Thant Place at Jalan U-Thant, new phases in Sentul West and Sentul East in Kuala Lumpur, and Shorefront in
George Town.
MIDF RESEARCH Thursday, 07 May 2015
5
Figure 3: Starhill Global REIT Portfolio
Source: YTL
Construction contracting
To support its property development activities YTL is also involved in construction contracting business. YTL via
its 100%-owned Syarikat Pembenaan Yeoh Tiong Lay Sdn Bhd (SPYTL) has successfully constructed buildings
ranging from schools, army barracks, hospitals, hotels and high-rise office blocks and large scale infrastructure
projects. Among YTL’s turnkey projects are (i) Sibu Airport, (ii) Klang General Hospital, (iii) Kuala Terengganu
Hospital, and few others. YTL also has a proven track record in healthcare, which it was awarded contract to
design, construct and equip twelve (12) district hospitals in Malaysia, and these projects were completed early,
up to nine months ahead of schedule.
However, with its orderbooks mainly derived from the construction contracts related to its property
development division, the growth of YTL’s construction seems to be limited at this point of time with the ERL
extension to KLIA2 being its last major external construction work.
Hotel & Resorts
Through its hospitality arm YTL Hotels, the company is involved in both ownership and management of
properties and operations ranging from moderately-priced hotels to luxury trains. With a strong reputation for
luxurious escapes, YTL Hotels has won numerous awards and accolades. These include:
i. Pangkor Laut Resort - Number One in the World by Condé Nast Traveller, UK 2003
ii. Spa Village Pangkor Laut - Best Destination Spa / Best Spa Experience by Asia Spa & Wellness Awards 2006
iii. Tanjong Jara Resort - One Of The Seven Natural Wonders Of The World by Condé Nast Traveller, UK 2006
iv. Spa Village Tanjong Jara - Most Innovative Spa by Tatler UK - Spa Awards 2007
v. Cameron Highlands Resort - 5 Best Tea Plantation Hotels by The Independent, UK 2007
vi. The Spa Village, Kuala Lumpur - Urban Spa of The Year by Asia Spa 2007
vii. The Ritz-Carlton, Kuala Lumpur - Top 5 Butlers Hotel in the World by The Independent, UK 2005, Best
Business Hotel in Kuala Lumpur by Travel & Leisure Magazine 2006, Best Employer in Malaysia by Hewitt
Associates 2005, Top 8 Outstanding Best Employers in ASIA by Hewitt Associates 2005
Starhill Global REIT's portfolio comprises mainly retail assets which include 12 mid- to high-end properties over five countries. Singapore and Malaysia make up approximately 87% of its total assets.
MIDF RESEARCH Thursday, 07 May 2015
6
Majority of YTL’s hotel assets are owned by YTL Hospitality REIT, a Malaysian-listed real estate investment trust
focused on prime, yield-accretive hotel and hospitality-related assets in Malaysia and internationally.
Source: YTL
Information technology & e-commerce
YTL’s exposure in the information technology industry is through YTL e-Solutions Bhd (YTLE) – listed on ACE
Market of Bursa Malaysia with a market capitalization of RM753.4m. The company provides and maintains
information technology hardware and software systems, network and Internet connectivity infrastructure, and
e-commerce systems. YTLE operates its business through three segments, namely (i) Information technology
and e-commerce, (ii) Communications technology and (iii) Content and digital media.
KEY ATTRIBUTES
Reduced dependency on utilities division, which nevertheless presented the Company with a
stable earnings base. YTL provides investors with a combined exposure in both defensive and growth cycles
of business. Its exposure in the defensive sector includes utilities, which provides a natural hedge for the
Company against fluctuations in its other business earnings cycles. Likewise, YTL’s involvement in the cyclical
business, namely cements and property development, provides investors with opportunities to ride on any
potential upsides to its business when the economy is booming.
High dividend yield provides support to its current price level. YTL caught investors by surprise with its
generous dividend payment of 12sen per share in FY14, which translates into a payout ratio of circa 80%. We
attribute this to its rich cashflow generation and ability to upstream its cement division’s cashflow through
privatisation in 2012. Assuming a similar payout ratio assumption, we account for a dividend payment of circa
10 sen thus implying a dividend yield of approximately 6%. We view this as particularly attractive as it would be
poised to be one of the best dividend-yielding stocks amongst the FMCKLCI constituents, which generally
average at 3-4%.
Recognised management team. YTL remains one of the few successful family-run ventures in Malaysia,
which we attribute to a strong management team and clarity in regards to its future succession planning. Led
by the son of its founder, Tan Sri Dr Francis Yeoh, and backed by a team of highly experienced professionals,
YTL has consistently delivered on its key projects. This is exemplified by its venture into the utilities business
MIDF RESEARCH Thursday, 07 May 2015
7
as the first IPP operator in Malaysia, during which time YTL was able to complete construction on its plant at a
record 14 months ahead of schedule.
The Company has also managed to maintain its costs in constructing the ERL, even at the height of the Asian
Financial Crisis in 1997. Its costs amounting to RM35m/km being the lowest construction cost for a High Speed
Rail infrastructure in the world to date. We attribute its successes to its management team, which has proven
over the years to be an integral asset for YTL.
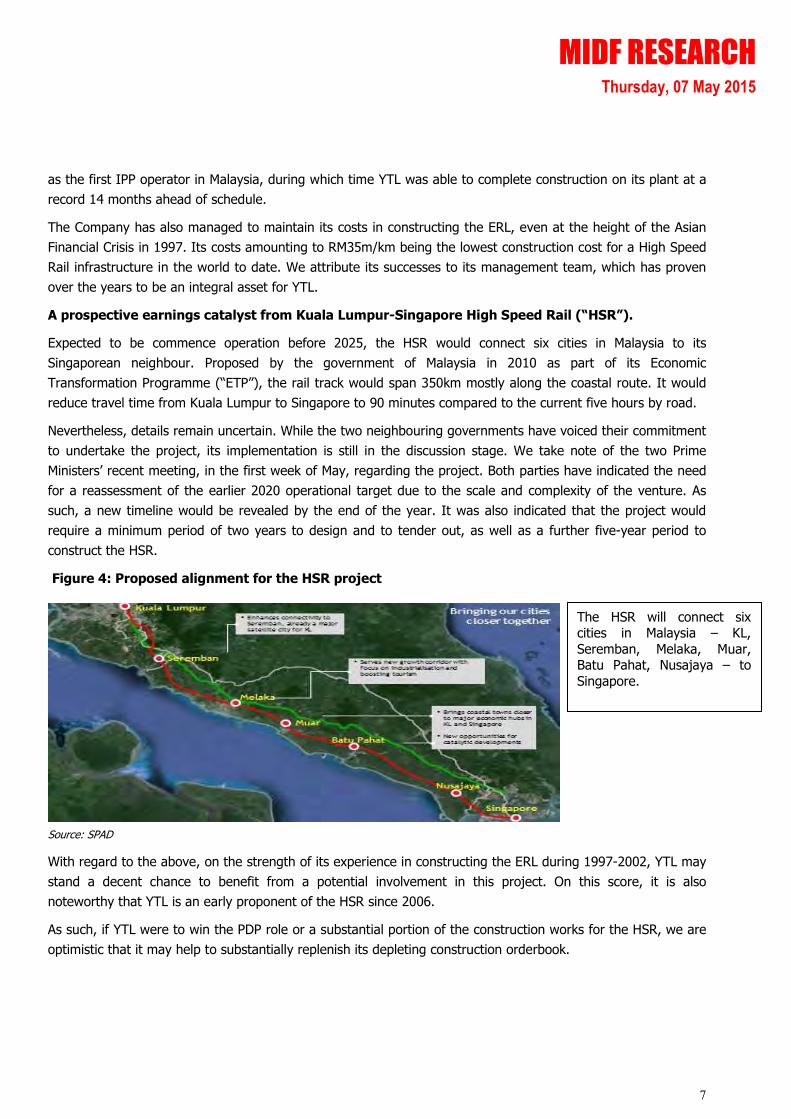
A prospective earnings catalyst from Kuala Lumpur-Singapore High Speed Rail (“HSR”).
Expected to be commence operation before 2025, the HSR would connect six cities in Malaysia to its
Singaporean neighbour. Proposed by the government of Malaysia in 2010 as part of its Economic
Transformation Programme (“ETP”), the rail track would span 350km mostly along the coastal route. It would
reduce travel time from Kuala Lumpur to Singapore to 90 minutes compared to the current five hours by road.
Nevertheless, details remain uncertain. While the two neighbouring governments have voiced their commitment
to undertake the project, its implementation is still in the discussion stage. We take note of the two Prime
Ministers’ recent meeting, in the first week of May, regarding the project. Both parties have indicated the need
for a reassessment of the earlier 2020 operational target due to the scale and complexity of the venture. As
such, a new timeline would be revealed by the end of the year. It was also indicated that the project would
require a minimum period of two years to design and to tender out, as well as a further five-year period to
construct the HSR.
Figure 4: Proposed alignment for the HSR project
Source: SPAD
With regard to the above, on the strength of its experience in constructing the ERL during 1997-2002, YTL may
stand a decent chance to benefit from a potential involvement in this project. On this score, it is also
noteworthy that YTL is an early proponent of the HSR since 2006.
As such, if YTL were to win the PDP role or a substantial portion of the construction works for the HSR, we are
optimistic that it may help to substantially replenish its depleting construction orderbook.
The HSR will connect six cities in Malaysia – KL, Seremban, Melaka, Muar, Batu Pahat, Nusajaya – to Singapore.
MIDF RESEARCH Thursday, 07 May 2015
8
KEY RISKS
Declining earnings from the expiration of Paka and Pasir Gudang PPAs. With the expiration of its
power plant, YTLP faces a void in its earnings which need to be addressed. Although PBT contributions of these
two power plants are rather small at circa 10% of YTLP’s bottomline, we foresee a difficult time ahead for this
division as heightened competition in the Singaporean merchant utility market could see its earnings decline
further. Even as its earnings base remains stable due to contributions from its Wessex Water business, we also
believe that future accretive earnings from this division are limited unless there is an M&A event or catalytic
events such as winning a new power plant.
Overcapacity in Malaysia’s cement industry. Risks specific to its cement operations would only arise
should the current over-capacity in production deteriorates further due to any unexpected slowdown in
demand. If this were to happen, we foresee YTLC’s margin to be suppressed further as a result of intensified
pricing competition.
Earnings are exposed to currency fluctuations. As a significant portion (>70%) of its revenue is derived
from its overseas’ operations, we are of the view that stock is exposed to fluctuations in Ringgit against the
Singaporean dollar and the Pound sterling.
Inability to pay dividend. Owing to its nature as an investment holding company, YTL’s ability to pay
dividends would ultimately lie on its ability to upstream cash from its operating subsidiaries. Therein, an
inability to pay dividends on the part of its subsidiaries would impose a risk to our dividend forecast.
Additionally, the Company might want to conserve cash for future M&As and as such it may not maintain its
FY14 payout ratio of 80%.
FINANCIAL OVERVIEW
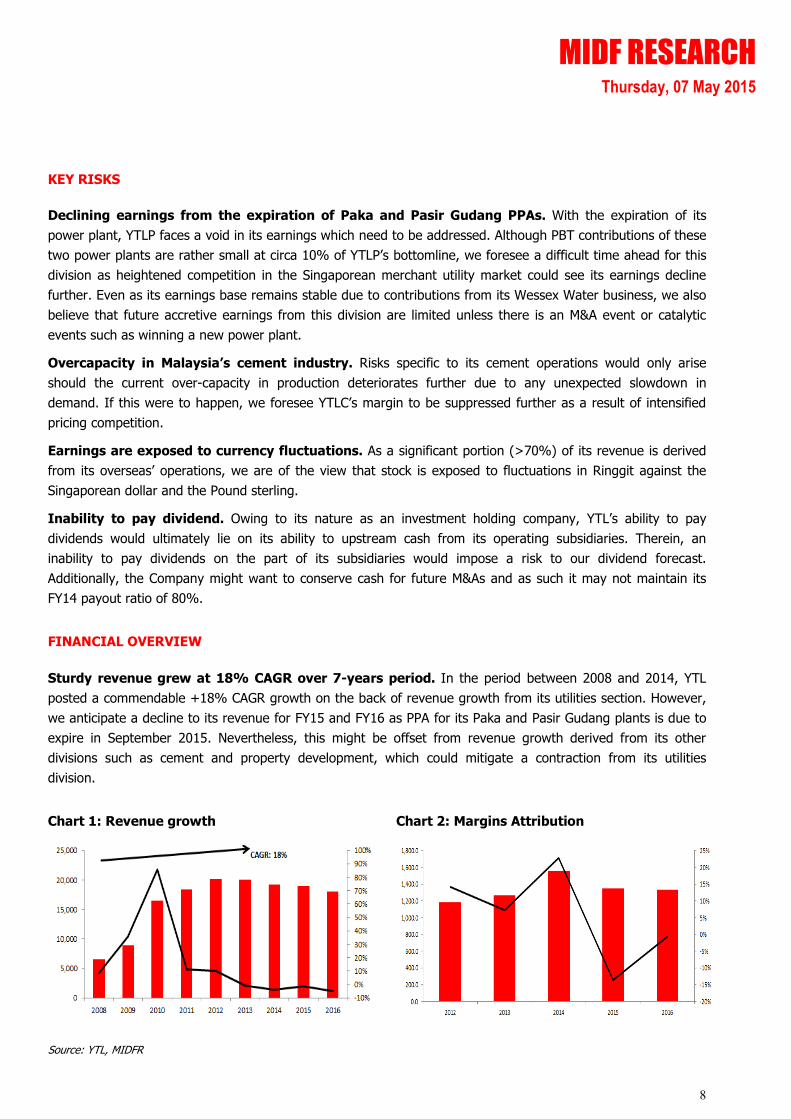
Sturdy revenue grew at 18% CAGR over 7-years period. In the period between 2008 and 2014, YTL
posted a commendable +18% CAGR growth on the back of revenue growth from its utilities section. However,
we anticipate a decline to its revenue for FY15 and FY16 as PPA for its Paka and Pasir Gudang plants is due to
expire in September 2015. Nevertheless, this might be offset from revenue growth derived from its other
divisions such as cement and property development, which could mitigate a contraction from its utilities
division.
Chart 1: Revenue growth Chart 2: Margins Attribution
Source: YTL, MIDFR
MIDF RESEARCH Thursday, 07 May 2015
9
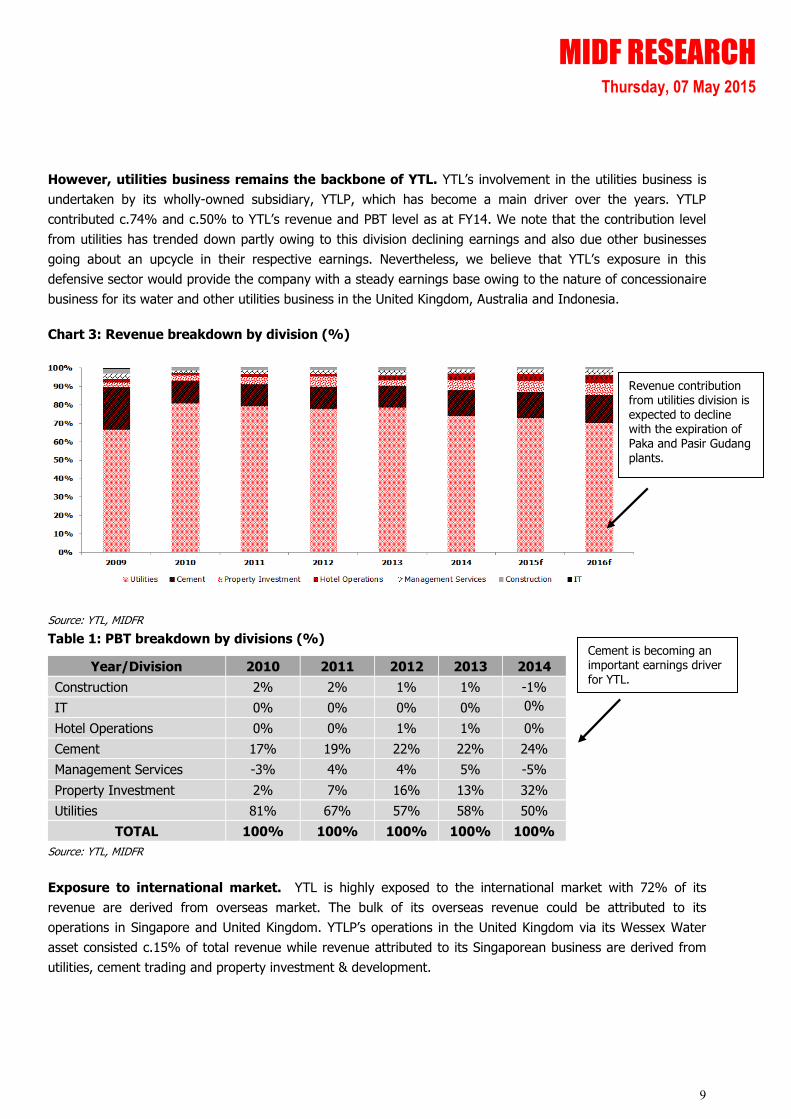
However, utilities business remains the backbone of YTL. YTL’s involvement in the utilities business is
undertaken by its wholly-owned subsidiary, YTLP, which has become a main driver over the years. YTLP
contributed c.74% and c.50% to YTL’s revenue and PBT level as at FY14. We note that the contribution level
from utilities has trended down partly owing to this division declining earnings and also due other businesses
going about an upcycle in their respective earnings. Nevertheless, we believe that YTL’s exposure in this
defensive sector would provide the company with a steady earnings base owing to the nature of concessionaire
business for its water and other utilities business in the United Kingdom, Australia and Indonesia.
Chart 3: Revenue breakdown by division (%)
Source: YTL, MIDFR
Table 1: PBT breakdown by divisions (%)
Year/Division 2010 2011 2012 2013 2014
Construction 2% 2% 1% 1% -1%
IT 0% 0% 0% 0% 0%
Hotel Operations 0% 0% 1% 1% 0%
Cement 17% 19% 22% 22% 24%
Management Services -3% 4% 4% 5% -5%
Property Investment 2% 7% 16% 13% 32%
Utilities 81% 67% 57% 58% 50%
TOTAL 100% 100% 100% 100% 100%
Source: YTL, MIDFR
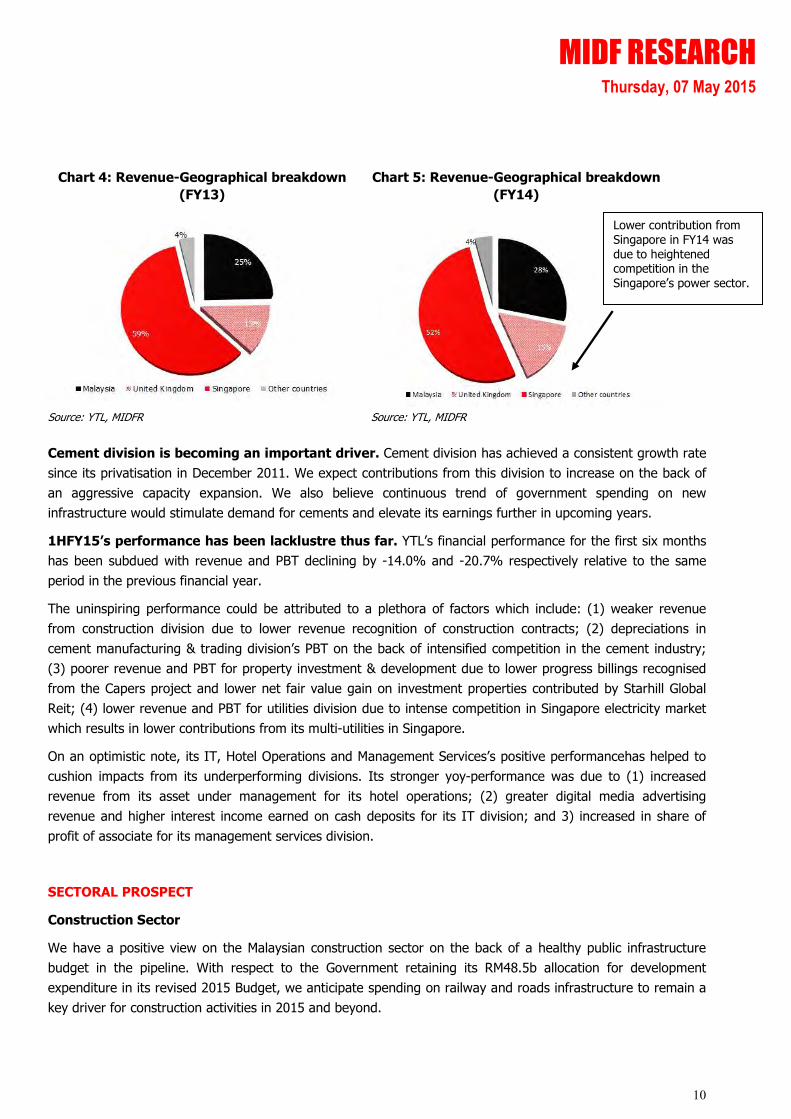
Exposure to international market. YTL is highly exposed to the international market with 72% of its
revenue are derived from overseas market. The bulk of its overseas revenue could be attributed to its
operations in Singapore and United Kingdom. YTLP’s operations in the United Kingdom via its Wessex Water
asset consisted c.15% of total revenue while revenue attributed to its Singaporean business are derived from
utilities, cement trading and property investment & development.
Cement is becoming an important earnings driver for YTL.
Revenue contribution from utilities division is expected to decline with the expiration of Paka and Pasir Gudang plants.
MIDF RESEARCH Thursday, 07 May 2015
10
Chart 4: Revenue-Geographical breakdown
(FY13)
Chart 5: Revenue-Geographical breakdown
(FY14)
Source: YTL, MIDFR Source: YTL, MIDFR
Cement division is becoming an important driver. Cement division has achieved a consistent growth rate
since its privatisation in December 2011. We expect contributions from this division to increase on the back of
an aggressive capacity expansion. We also believe continuous trend of government spending on new
infrastructure would stimulate demand for cements and elevate its earnings further in upcoming years.
1HFY15’s performance has been lacklustre thus far. YTL’s financial performance for the first six months
has been subdued with revenue and PBT declining by -14.0% and -20.7% respectively relative to the same
period in the previous financial year.
The uninspiring performance could be attributed to a plethora of factors which include: (1) weaker revenue
from construction division due to lower revenue recognition of construction contracts; (2) depreciations in
cement manufacturing & trading division’s PBT on the back of intensified competition in the cement industry;
(3) poorer revenue and PBT for property investment & development due to lower progress billings recognised
from the Capers project and lower net fair value gain on investment properties contributed by Starhill Global
Reit; (4) lower revenue and PBT for utilities division due to intense competition in Singapore electricity market
which results in lower contributions from its multi-utilities in Singapore.
On an optimistic note, its IT, Hotel Operations and Management Services’s positive performancehas helped to
cushion impacts from its underperforming divisions. Its stronger yoy-performance was due to (1) increased
revenue from its asset under management for its hotel operations; (2) greater digital media advertising
revenue and higher interest income earned on cash deposits for its IT division; and 3) increased in share of
profit of associate for its management services division.
SECTORAL PROSPECT
Construction Sector
We have a positive view on the Malaysian construction sector on the back of a healthy public infrastructure
budget in the pipeline. With respect to the Government retaining its RM48.5b allocation for development
expenditure in its revised 2015 Budget, we anticipate spending on railway and roads infrastructure to remain a
key driver for construction activities in 2015 and beyond.
Lower contribution from Singapore in FY14 was due to heightened competition in the Singapore’s power sector.
MIDF RESEARCH Thursday, 07 May 2015
11
We expect the government to continue to push for further infrastructure development under the country’s 11th
Master Plan (11MP) as it will be the final 5-year period before the 2020 deadline for Malaysia to achieve a
developed country status, as targeted under its Economic Transformation Programme (ETP). We see long-term
growth opportunities in local construction companies’ earnings from the development of KVMRT Line 2 and 3,
KL-Singapore High Speed Rail, LRT 3, East Coast Rail Link and Gemas-Johor Bharu Electrified Double Tracking.
Specific to YTL, its construction division currently caters to internal works which mainly service the construction
of new properties. With ERL’s extension being its last major facilities works to date, we do not foresee any
ready-made earnings catalyst for this division. Nonetheless, we view future earnings’ catalyst to be derived
from any potential construction packages for HSR construction.
Cement
Cement producers continue to face pressure on pricing, with average selling price (ASP) of cement continuing
to be impacted by a production overcapacity. Cement production for the Peninsular currently has a total
installed capacity of 29.8m MT/year while the average annual production of cement was 21.5m MT. We expect
demand for cement to pick up pace from execution of public infrastructure projects and construction of
affordable housing. This could mitigate the current overcapacity endemic in the industry.
As for YTL, impacts of intense competition could already be seen on its bottomline with its PBT margin declining
to c.20% compared to the same period in the previous year, which yielded c.25%, which we attribute to the
industrywide competition. In spite of that, its revenue remains on an uptrend which could be a benchmark for
the demand of its cement products. We note that some of its products stand a premium to its peers, thus
enabling it to withstand competition better than its competitors.
Property Investment
We view that demand for property will continue to ease down in 2015 as banks are expected to remain
stringent in regards to approvals for property financing. With weaker consumer sentiment looming in the post-
GST horizon, we anticipate yoy-decline to property industry sales.
Utilities
In view of the impending PPA expiration for the Paka and Pasir Gudang plants, we believe YTL’s exposure to
the Malaysian power generation sector to be at an end. We foresee a challenging time ahead for both of its
Singaporean merchant and telecommunication divisions. An aggressive liberalisation for the electricity industry
in Singapore in order to meet an increasing demand for energy has been widely anticipated to attract more
players to the field. As such we believe competition would remain stiff as these companies continue to compete
for a bigger share of the electricity-production market therefore worsening margin compression for YTL as it
bids to maintain its 25% of market share.
We share a similar view for its Mobile segment as the challenging telecommunication market requires the
Company to intensify efforts to continuously grow its subscribers’ base in order to generate higher revenue.
On a brighter note, we anticipate Wessex Water and other associates to continue delivering consistent returns
for its utilities division on the back of favourable market conditions. We opine that further depreciations in
ringgit would be beneficial in softening any decline to this division earnings.
MIDF RESEARCH Thursday, 07 May 2015
12
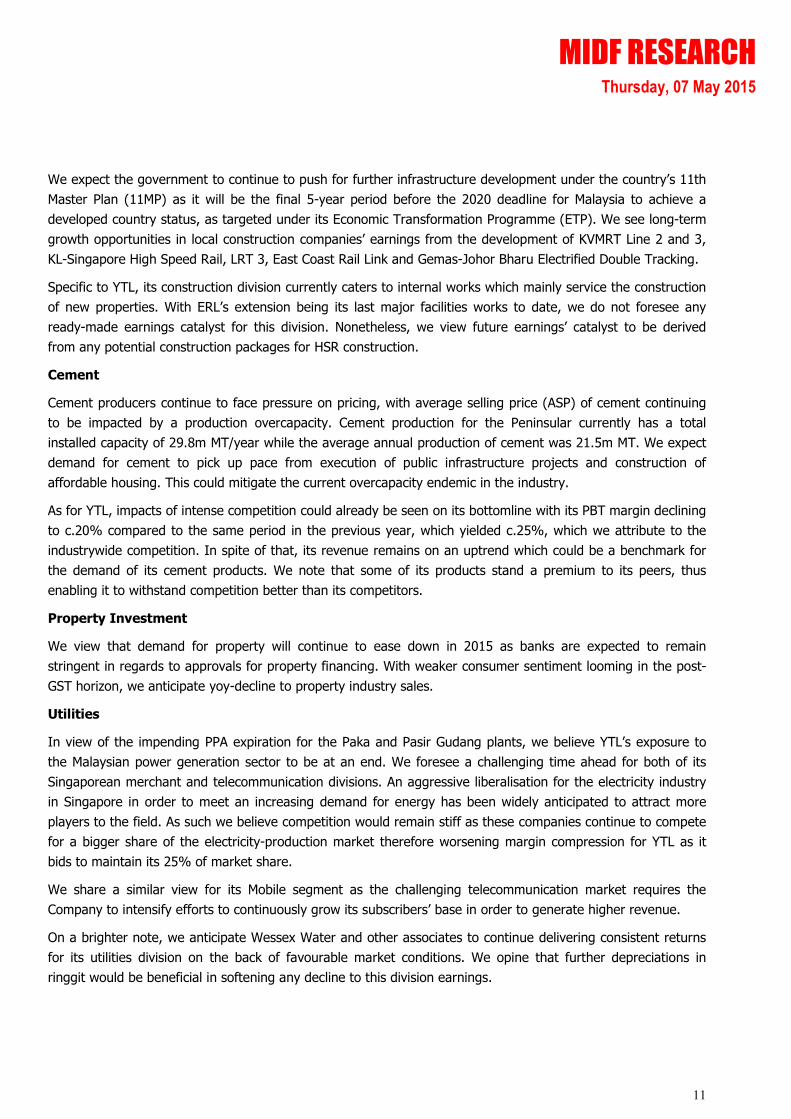
VALUATION AND RECOMMENDATION
Lacking an immediate catalyst as well as clarity for future plans. YTL’s share performance has been
lacklustre after the 1H12-surge to a high of RM2.12 in June 2012. We believe the appreciation in share price
then was mainly driven by the privatisation of YTL Cement which was undertaken via a share swap exercise.
Since then, the price has retraced and moved sideways. We also observe that YTL’s share price has been
trading within the range of RM1.55 – RM1.70 which we believe to be due to absence of an immediate catalyst
and clarity on its future plans, the presence of which would catapult its price.
Valuation wise, the share price is currently trading close to its 5-year rolling average PE range which we believe
is fair given the lack of immediate catalyst for this stock. On this note, we are of the view that its potential
share price gain is limited at the moment. We are valuing YTL with at RM1.68 per share after applying sum-of-
part valuation methodology to account for values accrued from its different operating businesses. Our TP
implies FY16 forward PE of 13.0x, which is also derived after applying a 15% discount due to the conglomerate
nature of the business as well as the lack of near-term visibility on its future.
Table 2: Sum of Part Valuation
Group's businesses Valuation method Value
(RM’m) Value/share
Listed
YTL Power MIDF's fair value of RM1.83 7,437 0.72
YTL Land market price 374 0.04
YTL e-Solutions market price 558 0.05
YTL Hospitality REIT market price 813 0.08
Starhill Global REIT market price 1,780 0.17
Unlisted
Cement 13xEV/EBITDA 10,720 1.03
Construction 10xPE 26 0.00
21,709 2.09
less: net debt @ holding Company (1254.122) (0.12)
Total Equity Value 20,455 1.97
15% conglomerate discount 1.68
Source: MIDFR
Chart 6: 1-year forward PE Chart 7: 1-year performance against FBMKLCI
Source: YTL, MIDFR Source: YTL, MIDFR
MIDF RESEARCH Thursday, 07 May 2015
13
Investment Statistics
FYE June 2013 2014 2015F 2016F 2017F
Revenue 20,033.1 19,269.2 19,001.1 18,019.0 18,399.6
EBIT 2,921.7 3,685.7 3,569.0 3,540.1 3,788.1
Pretax Profit 2,299.4 2,811.6 2,562.1 2,484.6 2,691.2
Minority Interest (564.2) (1,050.0) (742.0) (688.0) (723.3)
Net profit 1,266.7 1,555.0 1,344.5 1,335.5 1,468.5
EPS (sen) 12.2 15.0 13.0 12.9 14.2
PER (x) 13.7 11.1 12.9 13.0 11.8
Dividend 2.5 12.0 10.4 10.3 11.3
Dividend yield (%) @ RM1.67 1.5 7.2 6.2 6.2 6.8
Source: YTL, MIDFR
DAILY PRICE CHART
Izzat Esa [email protected]
03-2772 1679
MIDF RESEARCH Thursday, 07 May 2015
14
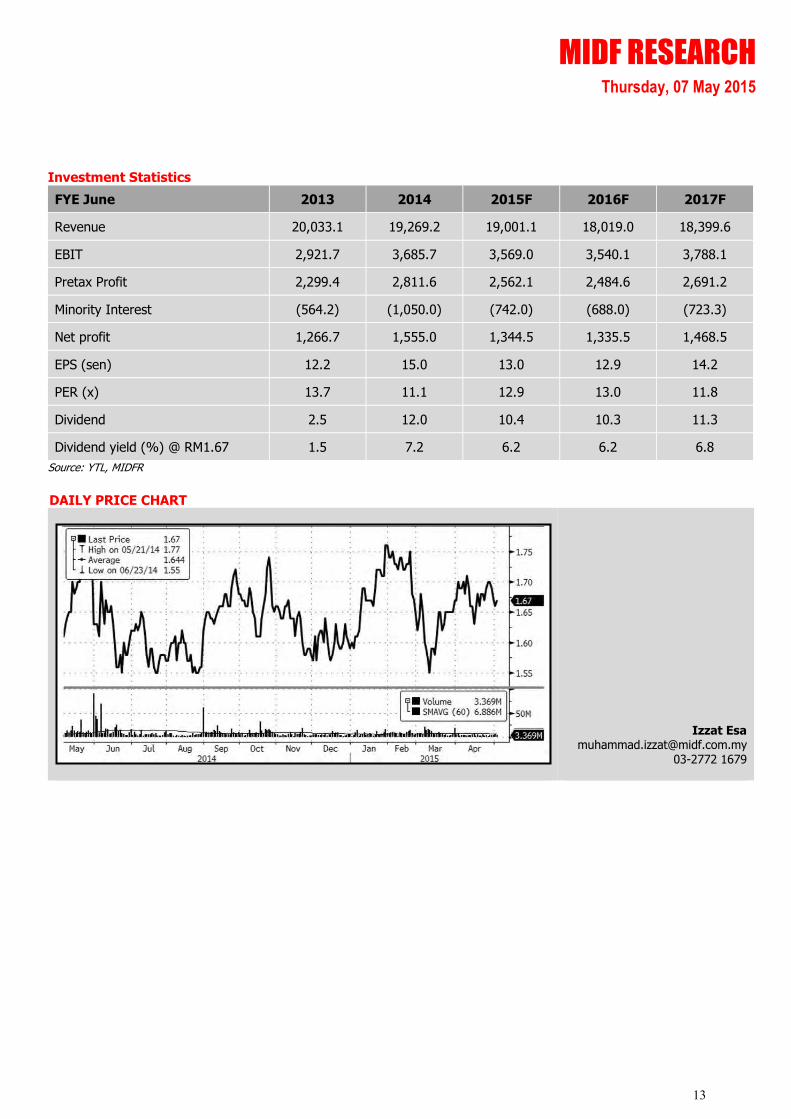
Financial Statement
Income Statement (RMm) 2013 2014 2015F 2016F 2017F Cashflow Statement (RM'm) 2013 2014 2015F 2016F 2017F
Revenue 20,033 19,269 19,001 18,019 18,400
EBIT 2,922 3,686 3,569 3,540 3,788 Cashflow from operations (CFO)
Net finance cost -1,019 -1,124 -1,264 -1,320 -1,370 Pretax profit 2,299 2,812 2,562 2,485 2,691
Associates 396 250 257 265 273 Non-cash adjustment 2,476 2,720 1,772 1,853 1,917
Pretax profit 2,299 2,812 2,562 2,485 2,691 ∆ Inventories (39) (75) (193) 50 (19)
Taxation -468 -207 -476 -461 -500 ∆ Receivables (21) (570) (11) 154 (60)
Minority Interest -564 -1,050 -742 -688 -723 ∆ Payables (49) (207) (97) (12) 26
PATAMI 1,267 1,555 1,345 1,335 1,468 ∆ Others (126) (13) - - -
EPS (sen) 12.2 15.0 13.0 12.9 14.2 Net change in WC (235) (865) (301) 192 (53)
DPS (sen) 2.5 12.0 10.4 10.3 11.3 Tax paid (468) (207) (476) (461) (500)
Others (1,301) (153) (742) (688) (723)
Balance Sheet (RM m) 2013 2014 2015F 2016F 2017F CFO 2,771 4,306 2,815 3,380 3,333
Non-current assets
Property, plant and equipment 22,207 25,314 26,472 27,388 28,315
Associates 3,430 1,649 1,649 1,649 1,649 Cashflow from investing (CFI)
Intangible assets 4,785 5,014 5,014 5,014 5,014 Capex (3,241) (2,680) (2,930) (2,769) (2,844)
Others 2,505 9,405 9,405 9,405 9,405 Others (27) 120 - - -
Total non-current assets 32,928 41,383 42,541 43,457 44,384 CFI (3,268) (2,560) (2,930) (2,769) (2,844)
Current assets
Inventories 849 774 967 917 937 Cashflow from financing (CFF)
Receivables 3,537 2,967 2,978 2,824 2,883 Dividends paid (259) (259) (1,076) (1,068) (1,175)
Cash and bank balances 13,814 13,216 13,869 14,423 14,641 Proceeds from borrowings 11,609 2,383 5,860 5,538 5,689
Others 2,476 2,703 2,703 2,703 2,703 Repayment of borrowings (9,624) (3,263) (4,161) (4,671) (4,931)
Total current assets 20,676 19,660 20,516 20,867 21,164 Others (694) (1,560) 143 145 146
Total assets 53,603 61,042 63,057 64,323 65,548 CFF 1,033 (2,700) 767 (57) (271)
Current liabilities
Payables 3,460 3,253 3,156 3,144 3,170 Net change in cash 535 (953) 652 554 218
Borrowings 4,227 5,396 5,396 5,396 5,396 Effect of exchange rate & bank overdraft1.727 356 - - -
Other current liabilities 422 525 525 525 525 B/f cash balance 13,277 13,814 13,216 13,869 14,423
Total current liabilities 8,110 9,174 9,078 9,065 9,092 Ending cash balance 13,814 13,216 13,869 14,423 14,641
Long term liabilities
Deferred taxation 2,404 2,276 2,276 2,276 2,276
Borrowings 26,515 28,189 30,032 31,043 31,947 Key Ratios 2013 2014 2015F 2016F 2017F
Others 1,390 1,624 1,624 1,624 1,624 Return on Equity (%) 9.6% 10.8% 9.2% 8.9% 9.7%
Total long term liabilities 30,309 32,088 33,931 34,942 35,847 Du Pont Analysis
Profitability Margin 6.3% 8.1% 7.1% 7.4% 8.0%
Financed by: Assets Utilisation 37.4% 31.6% 30.1% 28.0% 28.1%
Share capital 1,074 1,074 1,074 1,074 1,074 Equity Contribution 407.9% 424.3% 430.3% 431.0% 430.8%
Share premium 1,988 1,988 1,988 1,988 1,988 Return on Assets (%) 3.4% 4.3% 2.1% 2.1% 2.2%
Other Reserves (528) (111) (111) (111) (111) Current Ratio (x) 2.5 2.1 2.3 2.3 2.3
Retained profit 11,201 12,033 12,302 12,569 12,863 Quick Ratio (x) 1.8 1.5 1.6 1.7 1.7
Treasury (593) (597) (597) (597) (597) BV per share 1.3 1.4 1.4 1.4 1.5
Shareholder funds 13,142 14,387 14,656 14,923 15,216 Dividend Payout Ratios (%) 20% 80% 80% 80% 80%
Minority interest 2,043 5,393 5,393 5,393 5,393
Shareholders' equity 15,185 19,780 20,049 20,316 20,609
Source: YTL, MIDFR
MIDF RESEARCH Thursday, 07 May 2015
15
MIDF RESEARCH is part of MIDF Amanah Investment Bank Berhad (23878 - X).
(Bank Pelaburan)
(A Participating Organisation of Bursa Malaysia Securities Berhad)
DISCLOSURES AND DISCLAIMER
This report has been prepared by MIDF AMANAH INVESTMENT BANK BERHAD (23878-X). It is for
distribution only under such circumstances as may be permitted by applicable law.
Readers should be fully aware that this report is for information purposes only. The opinions contained
in this report are based on information obtained or derived from sources that we believe are reliable.
MIDF AMANAH INVESTMENT BANK BERHAD makes no representation or warranty, expressed or
implied, as to the accuracy, completeness or reliability of the information contained therein and it should
not be relied upon as such.
This report is not, and should not be construed as, an offer to buy or sell any securities or other
financial instruments. The analysis contained herein is based on numerous assumptions. Different
assumptions could result in materially different results. All opinions and estimates are subject to change
without notice. The research analysts will initiate, update and cease coverage solely at the discretion of
MIDF AMANAH INVESTMENT BANK BERHAD.
The directors, employees and representatives of MIDF AMANAH INVESTMENT BANK BERHAD may have
interest in any of the securities mentioned and may benefit from the information herein. Members of the
MIDF Group and their affiliates may provide services to any company and affiliates of such companies
whose securities are mentioned herein This document may not be reproduced, distributed or published
in any form or for any purpose.
MIDF AMANAH INVESTMENT BANK : GUIDE TO RECOMMENDATIONS
STOCK RECOMMENDATIONS
BUY Total return is expected to be >15% over the next 12 months.
TRADING BUY Stock price is expected to rise by >15% within 3-months after a Trading Buy rating has been assigned due to positive newsflow.
NEUTRAL Total return is expected to be between -15% and +15% over the next 12 months.
SELL Total return is expected to be <-15% over the next 12 months.
TRADING SELL Stock price is expected to fall by >15% within 3-months after a Trading Sell rating has been assigned due to negative newsflow.
SECTOR RECOMMENDATIONS
POSITIVE The sector is expected to outperform the overall market over the next 12 months.
NEUTRAL The sector is to perform in line with the overall market over the next 12 months.
NEGATIVE The sector is expected to underperform the overall market over the next 12 months.


![YTL 第3四半期決算短信 [L2-451891]...YTL CORPORATION BERHAD (Company No. 92647-H) (Incorporated in Malaysia) INTERIM FINANCIAL REPORT Interim financial report on consolidated](https://img.pdfslide.us/doc/110x75/61444aaaaa0cd638b460c316/ytl-c3oecc-l2-451891-ytl-corporation-berhad-company-no.jpg)