Embed Size (px)
Citation preview
YRC Worldwide Inc.Investor Presentation
February 2016

2
Forward-Looking DisclosuresForward-Looking Disclosures
The information in this presentation is summary in nature and may not contain all information that is important to you. The Recipient acknowledges and agrees that (i) no representation or warranty regarding the material contained in this presentation is made by YRC Worldwide Inc. (the “Company” or “we”) or any of its affiliates and (ii) that the Company and its affiliates have no obligation to update or supplement this presentation or otherwise provide additional information. This presentation is for discussion and reference purposes only and does not constitute an offer to sell or the solicitation of an offer to buy any securities or other property.
This presentation contains “forward-looking statements” within the meaning of Section 27A of the Securities Act of 1933 and Section 21E of the Securities Exchange Act of 1934. Forward-looking statements relate to future events or future performance of the Company and include statements about the Company’s expectations or forecasts for future periods and events. Specific forward-looking statements can be identified by the fact that they do not relate strictly to historical or current facts and include, without limitation, words such as “may,” “will,” “should,” “expect,” “plan,” “anticipate,” “believe,” “estimate,” “predict,” “potential” or “continue,” the negative of such terms or other comparable terminology. We disclaim any obligation to update those statements, except as applicable law may require us to do so, and we caution you not to rely unduly on them. We have based those forward-looking statements on our current expectations and assumptions about future events, and while our management considers those expectations and assumptions to be reasonable, they are inherently subject to significant business, economic, competitive, regulatory and other risks, contingencies and uncertainties, most of which are difficult to predict and many of which are beyond our control. Therefore, actual results may differ materially and adversely from those expressed in any forward-looking statements. Factors that might cause or contribute to such differences include, but are not limited to, those we discuss in the “Risk Factors” section of our Annual Report on Form 10-K and in other reports we file with the Securities and Exchange Commission.
This presentation includes the presentation of Adjusted EBITDA, a non-GAAP financial measure. Adjusted EBITDA is not a measure of financial performance in accordance with generally accepted accounting principles and may exclude items that are significant in understanding and assessing our financial results. Therefore, this measure should not be considered in isolation or as an alternative to net income from operations, cash flows from operations, earnings per fully-diluted share or other measures of profitability, liquidity or performance under generally accepted accounting principles. You should be aware that this presentation of Adjusted EBITDA may not be comparable to similarly-titled measures used by other companies. A reconciliation of this measure to the most comparable measures presented in accordance with generally accepted accounting principles has been included in this presentation.

IntroductionIntroductionYRC Worldwide is one of the largest less-than-truckload (LTL) carriers in
North America and generates approximately $4.8 billion of annual revenue byproviding services under a portfolio of four subsidiaries
Approximately 23% of the public carrier market share by tonnage
Providing the broadest coverage and more service capabilitythroughout North America than any competitor
3

YRC Freight and Regional TransportationYRC Freight and Regional Transportation
Formed by the combination of Yellow Transportation and Roadway Express
– Roadway acquired in 2003 and integrated in 2009
Branded as YRC Freight in 2012
Focused on longer-haul LTL shipping
Three distinct carriers serving separate regions
– Holland, Reddaway and New Penn
– Well established brands with long histories
Focused on next-day and time-sensitive services
YRC Freight YRC Regional
4
YRC Freight MetricFY 2015 revenue $3.1 billionFY 2015 Adj. EBITDA $167 million# of Customers ~125,000# of Terminals 258Average Length of Haul 1,300 milesAverage Weight 1,200 lbsAverage Transit 3-4 days
YRC Regional MetricFY 2015 revenue $1.8 billionFY 2015 Adj. EBITDA $166 million# of Customers ~150,000# of Terminals 126Average Length of Haul 400 milesAverage Weight 1,300 lbsAverage Transit > 90% in 2 days or less

North American Market ShareNorth American Market Share
Market share stable since 2010
23% market share by tonnage (public LTL carriers only)
YRC Freight and YRC Regional’s combined networks cover all 50 states, Puerto Rico, Canada and Mexico
− Broad footprint with service to over 250,000 customers
Scale is important for an LTL operator given the capital intensity/requirement to build the large “hub and spoke” network infrastructure and the significant operating leverage associated with the business model’s fixed costs
Historical market share by tonnage based upon publicly traded LTL carriers only. Conway’s market share estimated using YoY change in tonnage per day provided in the XPO Logistics Earnings Call.
Market share by tonnage reflects 3Q 2015 data.
5
2.2%5.5% 6.1%
9.0%13.4%
16.1%
24.3% 23.4%
0.0%5.0%
10.0%15.0%20.0%25.0%30.0%
Road
runn
er
ABF
Saia
(LTL
)
UPS
Freig
ht
ODFL
Con-
way F
reigh
t
FedE
x Fre
ight
YRCW
Market Share by Tonnage (Public LTL Carriers Only)
24% 25% 24% 25% 23% 23%
0%5%
10%15%20%25%30%
2010
2011
2012
2013
2014
3Q15
Historical Market Share

Diversified Customer BaseDiversified Customer Base
Long-standing and stable relationships with a large, diversified base of customers
− Customers range from Fortune 500 companies to small, privately-held businesses
Recognized by customers as leading operator
− YRC Freight received Walmart’s national LTL carrier of the year award for outstanding service 3 of the last 5 years
− Holland and Reddaway named by Toyota as 2015 LTL logistics partners of the year
− New Penn received 2 Quest of Quality awards in 2015 from Logistics Management magazine
6

Highly Experienced Senior ManagementHighly Experienced Senior Management
24 years of industry experience
Prior to being named President of YRC Freight, Darren was Senior Vice President of Sales for the Company
James WelchCEO, YRCW
Jamie PiersonCFO, YRCW
Scott WarePresident, Holland
34 years of experience in the transportation and logistics industry
Returned to the Company in 2011 to become CEO
Acted as an advisor to the Company from early 2009 –November 2011
Joined as CFO in late 2011
27 years of industry experience
Prior to being named President of Holland, Scott was Vice President of Operations and Linehaul for the Company
Don FoustPresident, New Penn
35 years of industry experience
Recognized throughout his career for strong leadership, team building and outstanding results in sales and operations performance
TJ O’ConnorPresident, Reddaway
30 years of industry experience
Prior to being named President of Reddaway in 2007, T.J. served as President and CEO of USF Bestway
Jim FryVice President – General Counsel & Corporate Secretary, YRCW
20 years of industry experience
Prior to YRCW, Jim served as Executive Vice President, General Counsel, and Secretary for Swift Transportation Company
Darren HawkinsPresident, YRC Freight
150 Years of Operating Experience
7

$297.5 $295.2 $278.0
$298.1
$698.2 $686.0 $105.0
$219.9
$124.2 $124.2
$117.9
$177.8 $86.7
$69.2 $16.5
$69.4 $0.2
$0.2
$-
$200.0
$400.0
$600.0
$800.0
$1,000.0
$1,200.0
$1,400.0
8
Refinancing & TurnaroundRefinancing & Turnaround
Term Loan – retired on 2/13/14
ABL Term A – retired on 2/13/14
Capital Leases
ABL Term B – retired on 2/13/14
CDA Note
Series A Notes - $90.9M redeemed on 1/31/14Remaining defeased on 2/12/14
Series B Notes - $51.8M converted to equity on 1/31/14
6% Convertible Senior Notes – retired on 1/31/14
Capital Leases
New Term Loan
CDA Note
$1,361.3M
$1,081.9M
Pre-Refinancing (12/31/13) Today (12/31/15)
Greatly simplified funded debt structure with maturities extended to 2019Reduced cash interest payments by ~$40M per year
9 3
5% Convertible Notes
5% Convertible NotesSeries B NotesSeries A Notes
Post-Refinancing (3/31/14)6
Capital Leases11.90% (1)
New Term Loan8.25%
CDA Note7.28% (1)
$1,221.0M
Number of Debt Facilities
(1) Average effective interest rate as of December 31, 2015

11.88x
8.54x
5.77x 5.34x4.57x
3.25x
0.0x
2.0x
4.0x
6.0x
8.0x
10.0x
12.0x
14.0x
2010 2011 2012 2013 2014 2015
Funded Debt / Adjusted EBITDA
Leverage RatioLeverage Ratio
Steady progress every year since 2010
– Funded Debt to Adjusted EBITDA ratio down 3.7x
– EBITDA cushion for leverage covenant is approximately $79M
YRCW is on much stronger footing as a result of reduced debt and increased earnings
3.7x reduction since 2010
Note: Funded debt balances based on par value
9

2014 2015 2016 2017 2018 2019 2020
10
No Near-Term MaturitiesNo Near-Term Maturities
Focus on Operational Execution RunwayFebruary 2014
Refinancing
February Term Loan,
ABL
March IBT (MOU)
December CDA
Significant extension of debt maturities provides longer runway to continue operational transformation
11
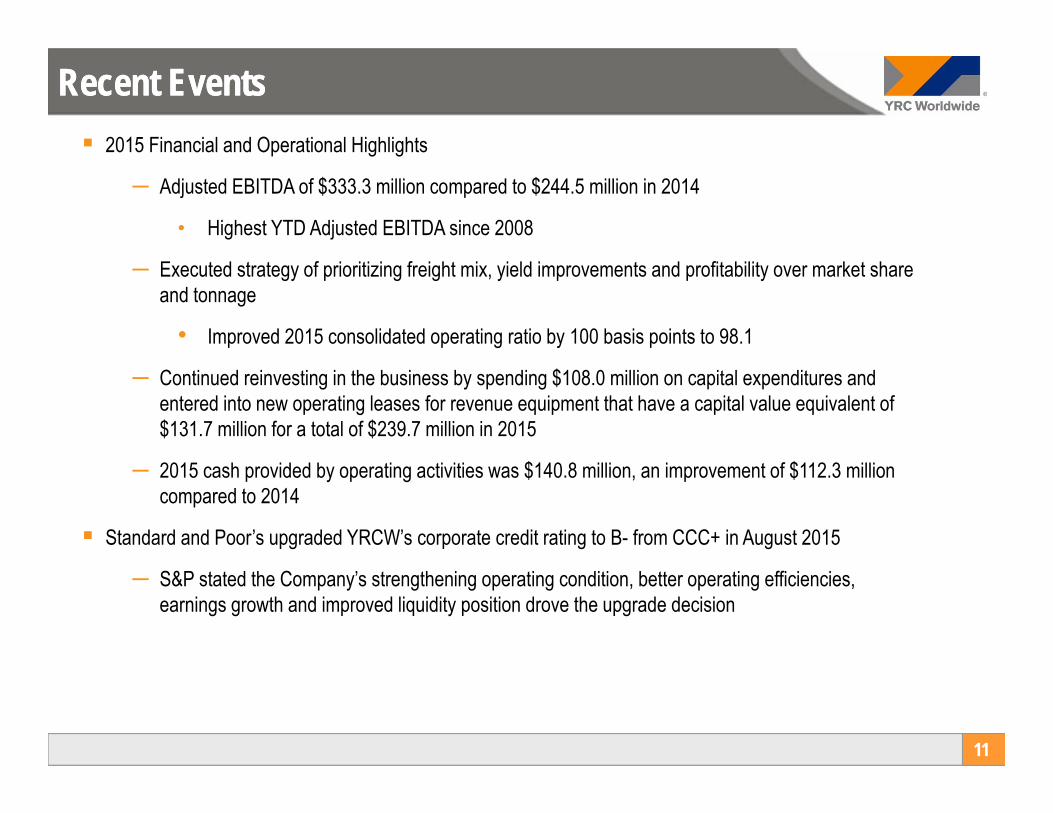
Recent EventsRecent Events 2015 Financial and Operational Highlights
― Adjusted EBITDA of $333.3 million compared to $244.5 million in 2014
• Highest YTD Adjusted EBITDA since 2008
― Executed strategy of prioritizing freight mix, yield improvements and profitability over market share and tonnage
• Improved 2015 consolidated operating ratio by 100 basis points to 98.1
― Continued reinvesting in the business by spending $108.0 million on capital expenditures and entered into new operating leases for revenue equipment that have a capital value equivalent of $131.7 million for a total of $239.7 million in 2015
― 2015 cash provided by operating activities was $140.8 million, an improvement of $112.3 million compared to 2014
Standard and Poor’s upgraded YRCW’s corporate credit rating to B- from CCC+ in August 2015
― S&P stated the Company’s strengthening operating condition, better operating efficiencies, earnings growth and improved liquidity position drove the upgrade decision

12.9%
8.8%
4.6%
1.6%
3.0%
0.0%
2.0%
4.0%
6.0%
8.0%
10.0%
12.0%
14.0%
Industry ex YRCW YRC Regional YRC Freight
FY 2015 EBITDA Margin
12
Opportunity for EBITDA Margin Growth & Further DeleveragingOpportunity for EBITDA Margin Growth & Further Deleveraging Significant opportunity for both segments to
achieve margin improvements― Assuming current market performance of an OR of
91 to 93, the long-term EBITDA margin segmentgoals are as follows:YRCF = 7.6% (equivalent to an OR of 95 – 96)Regional = 10.4% (equivalent to an OR of 93 – 94)
― Plan to achieve margin improvements includes reinvesting in the business
Note: For comparison purposes, EBITDA for all companies is defined as Operating Income, excluding gains or losses from property sales, plus Depreciation and Amortization. EBITDA used to calculate EBITDA margin for YRCW above differs from the credit agreement definition of Consolidated Adjusted EBITDA
10.4%
7.6%
Note: The peer groups FY 2015 EBITDA and OR excludes XPO Logistics’ LTL Division
FY 2015 YRC Freight YRC RegionalRev enue 3,055.7$ 1,776.9
EBITDA 111.1 156.1 Non-union pension settlement loss 28.7 - (Gains) / losses on property sales 1.9 0.2 EBITDA less losses on property sales + Non-union pension settlement loss 141.7$ 156.3$
EBITDA margin, less (gains) / losses on property sales 4.6% 8.8%
Confidential
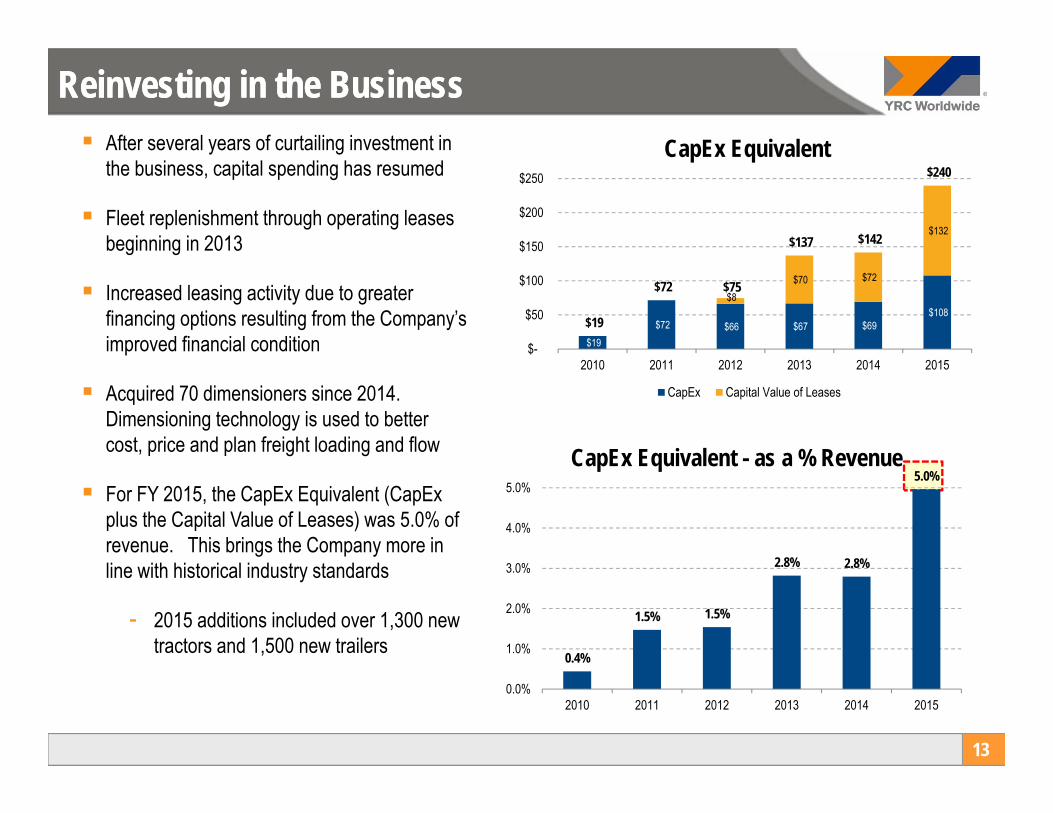
Reinvesting in the BusinessReinvesting in the Business
13
After several years of curtailing investment in the business, capital spending has resumed
Fleet replenishment through operating leases beginning in 2013
Increased leasing activity due to greater financing options resulting from the Company’s improved financial condition
Acquired 70 dimensioners since 2014. Dimensioning technology is used to better cost, price and plan freight loading and flow
For FY 2015, the CapEx Equivalent (CapEx plus the Capital Value of Leases) was 5.0% of revenue. This brings the Company more in line with historical industry standards
- 2015 additions included over 1,300 new tractors and 1,500 new trailers
$19 $72 $66 $67 $69
$108 $8
$70 $72
$132
$19
$72 $75
$137 $142
$240
$-
$50
$100
$150
$200
$250
2010 2011 2012 2013 2014 2015
CapEx Equivalent
CapEx Capital Value of Leases
0.4%
1.5% 1.5%
2.8% 2.8%
5.0%
0.0%
1.0%
2.0%
3.0%
4.0%
5.0%
2010 2011 2012 2013 2014 2015
CapEx Equivalent - as a % Revenue

Competitive StrengthsCompetitive Strengths
YRCW’s competitive strengths provide a platform for continued improvement and long-term growth
14

~32,000 highly experienced employees throughout North America
Typical LTL driving distance contributes to stable workforce and low turnover
YRCW drivers covered over 940 million miles in 2015
– The equivalent of more than 168,000 round trips between New York and Los Angeles
Long-term relationships with more than 250,000 customers
Experienced senior management with 150 combined years of operating experience leading transformation
Competitive StrengthsCompetitive Strengths
15

YRC Freight operates a large hub and spoke network
Regional carriers operate direct loading and quick sort networks
YRCW Totals
- 384 terminals
- ~15,000 tractors
- ~41,000 trailers
Reinvesting in the business by replenishing the fleet through a combined approach of purchasing and leasing
- Acquired over 1,300 new tractors and 1,500 new trailers in 2015
Competitive StrengthsCompetitive Strengths
16

Implementing technological tools for continuous improvement in safety, efficiency, and productivity
In-Cab Safety Recorders
Dimensioners
Dock Supervisor Tablets
Logistics Planning Technology
Kronos Workforce Management
Competitive StrengthsCompetitive Strengths
17

The result is award-winning customer service with a flexible supply chain that provides the broadest
coverage throughout North America
Competitive StrengthsCompetitive Strengths
18

19
StrongIndustryPosition
Simplified & Stable Capital
Structure
DiversifiedBusiness
Model
National Footprint /
Tremendous Asset Base
ExperiencedManagement
Team
TurnaroundStill Has Legs
Via Margin Expansion
Reinvestment Back into the
Business
Flexible supply chain focused on ensuring customers can ship
industrial, commercial and retail goods with
confidence
Compelling Investment Thesis Compelling Investment Thesis

Forward Looking ConsiderationsForward Looking Considerations Plan to continue investing back into the business through combined purchasing and leasing to
enhance shareholder value
Installation of in-cab safety equipment in all company’s tractors expected to be substantially complete by the end of 1Q 2016
International Brotherhood of Teamsters memorandum of understanding (MOU) in place through March 2019
― Annual wage increases of $0.34 per hour from 2016 - 2018
― Required contributions to pension plans remain $1.75 per hour
― Established profit sharing bonuses based on operating ratio metrics
No long-term debt / facility maturities until 2019
Federal net operating losses (NOL) as of year-end 2014 that expire between 2028 - 2034
― $462.8 million of NOL carryforwards (total of $697.8 million less $234.7 million that will not be utilized due to IRS limitations)
― Mitigates federal cash income tax payments
20

21
Key Financial Results

$9.80
$10.25
$9.30 $9.50 $9.70 $9.90
$10.10 $10.30 $10.50
2014 2015
Regional Revenue per cwt (x-FSC)
$144
$152
$139
$144
$149
$154
2014 2015
Regional Revenue per Shipment (x-FSC)
$234
$252
$225 $230 $235 $240 $245 $250 $255
2014 2015
YRC Freight Revenue per Shipment (x-FSC)
$19.80
$21.01
$18.50 $19.00 $19.50 $20.00 $20.50 $21.00 $21.50
2014 2015
YRC Freight Revenue per cwt (x-FSC)
22
YOY Revenue per Shipment and Revenue per cwtYOY Revenue per Shipment and Revenue per cwt
Both segments experiencing positive pricing growth driven by a focused effort on improving yield and further supported by a favorable industry pricing environment
Note: Percent change calculation based on unrounded figures and not the rounded figures presented
+6.1%
+7.7% +5.6%
+4.6%

31.37 30.76
26.00
28.00
30.00
32.00
2014 2015
Regional Tonnage per Day
42.64 41.43
35.00
40.00
45.00
50.00
2014 2015
Regional Shipments per Day
27.01
25.43
23.00
25.00
27.00
29.00
2014 2015
YRC Freight Tonnage per Day
45.64 42.35
35.00
40.00
45.00
50.00
2014 2015
YRC Freight Shipments per Day
23
YOY VolumeYOY Volume
YOY decrease at YRCF due to shift away from minimum charge and lighter shipments and toward higher yielding business
YOY decrease at Regional is primarily due to efforts to better manage capacity
Note: Percent change calculation based on unrounded figures and not the rounded figures presented
-7.2%
-5.8%
-2.8%
-1.9%

$99.8
$167.2
$.0
$50.0
$100.0
$150.0
$200.0
2014 2015
YRCF Adjusted EBITDA
24
Segment Adjusted EBITDASegment Adjusted EBITDA($ in millions)
Improved performance at both segments driven by yield improvement and impact of investment in high ROI generating technologies, partially offset by lower volume, productivity and higher lease equipment lease costs
Note: Percent change calculation based on unrounded figures and not the rounded figures presented
67.5%14.9%$144.4
$165.9
$.0
$50.0
$100.0
$150.0
$200.0
2014 2015
Regional Adjusted EBITDA
3.1%
5.5%
0.0%1.0%2.0%3.0%4.0%5.0%6.0%
2014 2015
YRC Freight Adjusted EBITDA Margin
240bps7.9%
9.3%
7.0%
7.5%
8.0%
8.5%
9.0%
9.5%
2014 2015
Regional Adjusted EBITDA Margin
150bps

4.8%
6.9%
0.0%
2.0%
4.0%
6.0%
8.0%
2014 2015
Adjusted EBITDA Margin
25
Consolidated (YRCW) Adjusted EBITDAConsolidated (YRCW) Adjusted EBITDA($ in millions)
Improved performance driven by yield improvement and impact of investment in high ROI generating technologies, partially offset by lower volume, productivity and higher lease equipment lease costs
Highest YTD EBITDA since 2008
Note: Percent change calculation based on unrounded figures and not the rounded figures presented
+88.8M +210bps$244.5
$333.3
$.0$50.0
$100.0$150.0$200.0$250.0$300.0$350.0
2014 2015
Adjusted EBITDA

26
Investor Relations InformationInvestor Relations Information
NASDAQ: YRCW
www.yrcw.com
Company contact:Tony CarreñoVice President – Investor Relations(913) [email protected]

27
Appendix

2003 2005 2006 2007 2008 2009 2010 2011 2012 2014 2015
Yellow acquired Roadway for $1.1 billion (debt financed) Included New Penn and Reimer
Acquired USF for $1.3 billion (debt financed) Included Holland,
Reddaway and Glen Moore
Acquired 50% stake in JHJ Chinese logistics operation
James Welch named CEO;New Board of Directors seated, including 2 IBT appointees Completed restructuring
2005
2003
July 2011 Closed former
Roadway HQ De-centralized
HoldCo structure Re-branded YRC
Freight Divested non-
core assets (Jiayu, excess real estate property auctions)
Former CEO Zollars announced retirement CEO, CFO, COO, CAO and CMO depart in 2011
Sep
tem
ber 2
010James Welch
departed2007
Divested Glen Moore (TL)
Decem
ber 2011
Acquired 65% stake in Jiayu20
08
2009 Yellow /
Roadway Integration
Refinancing Reduced
outstanding debt by over $225M (including redemption of Series A Notes)
Extended remaining maturities by 5 years
Annual cash interest savings of $40M
Amended and Extended Teamster contract to 2019
YRC Worldwide TransformationYRC Worldwide Transformation
2012
February 2014
4th Quarter 2015
FY 2015 Adjusted EBITDA improved $89M YoY to $333M
Focus on operational improvement
28

29(a) As required under our Term Loan Agreement, other, net, shown above consists of the impact of certain items to be included in Adjusted EBITDA
EBITDA Reconciliation – ConsolidationEBITDA Reconciliation – Consolidation
FY 2014 FY 2015Reconciliation of net income (loss) to adjusted EBITDA
Net income (loss) (67.7)$ 0.7$ Interest expense, net 149.5 107.1 Income tax expense (benefit) (16.1) (5.1) Depreciation and amortization 163.6 163.7
EBITDA 229.3 266.4 Adjustments for debt covenants
(Gains) losses on property disposals, net (11.9) 1.9 Letter of credit expense 12.1 8.8 Restructuring professional fees 4.2 0.2 Nonrecurring consulting fees - 5.1 Permitted dispositions and other 1.8 0.4 Equity based compensation expense 14.3 8.5 Amortization of ratification bonus 15.6 18.9 (Gain) loss on extinguishment of debt (11.2) 0.6 Non-union pension settlement charge - 28.7 Other, net (a) (9.7) (6.2)
Adjusted EBITDA 244.5$ 333.3$
Revenue 5,068.8$ 4,832.4$ Adjusted EBITDA Margin 4.8% 6.9%
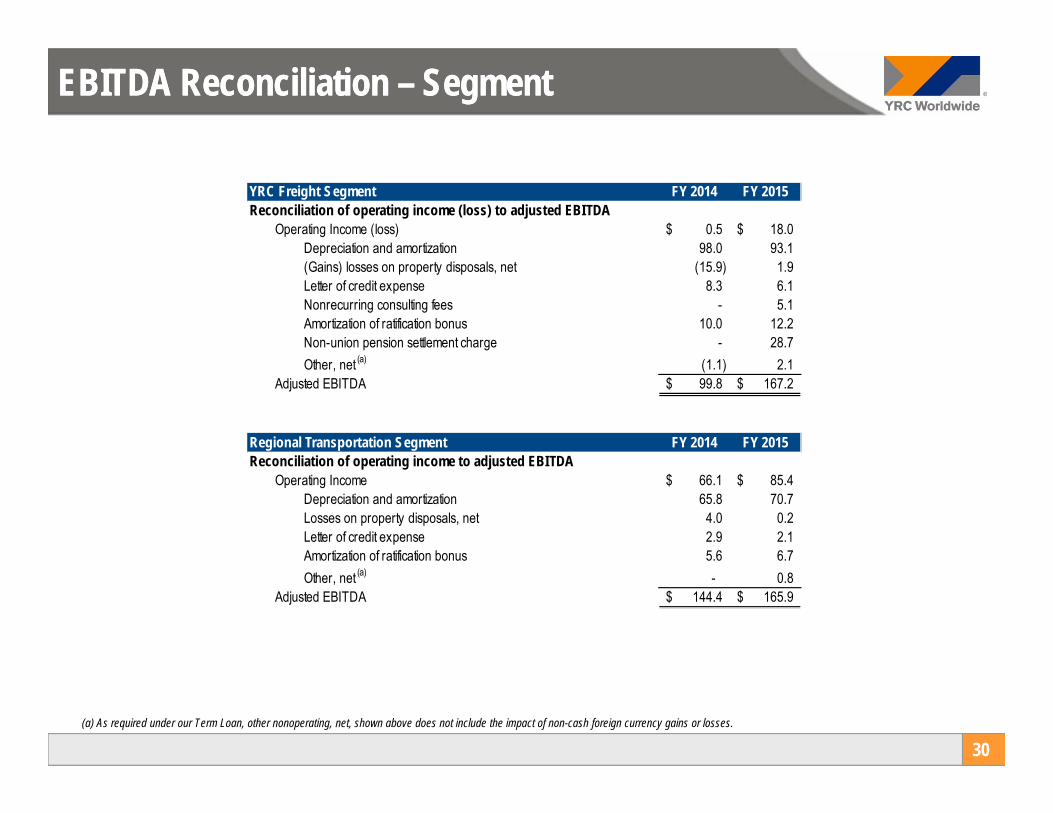
30(a) As required under our Term Loan, other nonoperating, net, shown above does not include the impact of non-cash foreign currency gains or losses.
EBITDA Reconciliation – SegmentEBITDA Reconciliation – Segment
YRC Freight Segment FY 2014 FY 2015Reconciliation of operating income (loss) to adjusted EBITDA
Operating Income (loss) 0.5$ 18.0$ Depreciation and amortization 98.0 93.1 (Gains) losses on property disposals, net (15.9) 1.9 Letter of credit expense 8.3 6.1 Nonrecurring consulting fees - 5.1 Amortization of ratification bonus 10.0 12.2 Non-union pension settlement charge - 28.7 Other, net (a) (1.1) 2.1
Adjusted EBITDA 99.8$ 167.2$
Regional Transportation Segment FY 2014 FY 2015Reconciliation of operating income to adjusted EBITDA
Operating Income 66.1$ 85.4$ Depreciation and amortization 65.8 70.7 Losses on property disposals, net 4.0 0.2 Letter of credit expense 2.9 2.1 Amortization of ratification bonus 5.6 6.7 Other, net (a) - 0.8
Adjusted EBITDA 144.4$ 165.9$


![Fish Friendly Turbines [YRC 2013]](https://img.pdfslide.us/doc/110x75/577cd3c11a28ab9e78977b87/fish-friendly-turbines-yrc-2013.jpg)