Embed Size (px)
Citation preview

AAWW Investor Slides November 2017

Page Page
3 Safe Harbor Statement 22 Atlas Air Worldwide
4 AAWW – Key Takeaways 23 Our Customers Reflect Our Focus on Quality
5 Airfreight Demand 24 Global Operating Network – 2016
6 Our Fleet Is Aligned with the Express Market 25 Revenue and Adjusted EBITDA Growth
7 Atlas Load Factors Outperforming 26 Convertible Note Offering
8 International Global Airfreight: Annual Growth 27 2017 Objectives
9 The Key Underlying Express Market Is Growing 28 3Q17 Summary
10 E-Commerce Projected Growth 29 2017 Framework
11 E-Commerce Penetration Levels Are Low 30 Global Airfreight Drivers
12 Amazon Service 31 Delivering Value to the General Air Cargo Market
13 Amazon Service – Financial Impact 32 Delivering Value to the Express Market
14 767-300 Financing 33 Delivering Value to the E-Commerce Market
15 Southern Air Acquisition 34 Large Freighter Supply Trends
16 AAWW – Executing Strategic Plan 35 Main Deck to Belly?
17 Our Current Fleet 36 A Strong Leader in a Vital Industry
18 Capital Allocation Strategy 37 Our Vision, Our Mission
19 Fleet Size and Net Leverage Ratio 38 Reconciliation to Non-GAAP Measures
20 AAWW – Key Takeaways 39 Reconciliation to Non-GAAP Measures
21 Appendix
Index
2

3
Safe Harbor Statement
This presentation contains “forward-looking statements” within the meaning of the Private Securities Litigation Reform Act
of 1995 that reflect Atlas Air Worldwide Holdings, Inc.’s (AAWW) current views with respect to certain current and future
events and financial performance. Such forward-looking statements are and will be, as the case may be, subject to many
risks, uncertainties and factors relating to the operations and business environments of AAWW and its subsidiaries that
may cause actual results to be materially different from any future results, express or implied, in such forward-looking
statements.
For additional information, we refer you to the risk factors set forth in the documents filed by AAWW with the Securities
and Exchange Commission. Other factors and assumptions not identified above are also involved in the preparation of
forward-looking statements, and the failure of such other factors and assumptions to be realized may also cause actual
results to differ materially from those discussed.
AAWW assumes no obligation to update the statements in this presentation to reflect actual results, changes in
assumptions, or changes in other factors affecting such estimates, other than as required by law.
This presentation also includes some non-GAAP financial measures. You can find our presentations on the most directly
comparable GAAP financial measures calculated in accordance with accounting principles generally accepted in the
United States and our reconciliations in our earnings release dated November 7, 2017, which is posted on our Web site at
www.atlasair.com.

4
AAWW – Key Takeaways
Shaping a Powerful Future
New era of significant business growth and development
Fundamental change in markets served
Strategic long-term relationship with Amazon
Southern Air acquisition
Capitalizing on initiatives to drive:
Value and benefit for customers and investors
Key new customer agreements including
Cathay Pacific Cargo, Asiana Cargo, Hong Kong Air Cargo,
Nippon Cargo Airlines, Suparna Airlines,
DHL Global Forwarding and FedEx
Strong foundation for earnings and cash flow

5
Source: IATA, Company, BofA Merrill Lynch Global Research estimates
Airfreight Demand
-10%
-5%
0%
5%
10%
15%
20%FTK and AFTK Growth
FTK AFTK
3.8%
5.0%
> 20%
0% 5% 10% 15% 20% 25%
International FTKs
International Express
E-Commerce
2016 Market Growth Rates

Our Fleet Is Aligned with the Express Market
6
Source: Company, ACMG – April 2017
Atlas Fleet in Express Compared with Express Share of Global Fleet
Total global large widebody freighters: 524 (747s, 777s, MD-11s, DC/MD-10-30s)
Total global medium widebody freighters: 478 (767s, A300-600Fs, A330-200Fs,
A310-200F/300Fs, DC/MD-10-10Fs)
46%
33%
AAWW Express Carriers
Large Widebody
100%
77%
AAWW Express Carriers
Medium Widebody

7
Source: IATA, Atlas (freighter aircraft excluding those serving military and dry leasing)
Atlas Load Factors Outperforming L
OA
D F
AC
TO
R
Average Freight Load Factors
40%
45%
50%
55%
60%
65%
70%
2011 2012 2013 2014 2015 2016
AAWW # Aircraft In Service International Load Factors AAWW Load Factors

8
Total Global Airfreight Tonnage: ICAO 2012 – 2014, IATA 2015 – 2017F (IATA – June 2017)
International Global Airfreight: Annual Growth
IATA – Total global airfreight tonnage growing from record levels
IATA – International freight tonne kilometers (FTKs) flown up 3.8% in 2016
IATA – Strong FTK growth in 2017 – up 11.1% thru September
48.8 49.5
51.5 52.2
54.3
58.2
40
50
60
2012 2013 2014 2015 2016E 2017F
Total Global Airfreight Tonnage Growing from Record Levels Freight Tonnes
(Millions)
-- 1.4% 4.0% 1.4% 4.0% 7.2% ∆
Y-o-Y

9
Notes: Weighted average of growth rates in international express package volume reported by these express operators
Weighting is 50% DHL, 25% UPS and 25% FedEx.
The Key Underlying Express Market Is Growing
The International Express market is showing robust growth
5.6% CAGR since 2011 versus nominal CAGR for international FTKs
6%
12%
19%
25%
31%
90%
100%
110%
120%
130%
140%
150%
2011 2012 2013 2014 2015 2016
International Express Market – DHL, FedEx and UPS Change in Package Volume (Base year 2011 - 100%)
5.6% CAGR

E-Commerce Projected Growth
10
Source: Euromonitor, Forrester, eMarketer, BofA Merrill Lynch Global Research estimates
Global E-Commerce Has Grown and Is Growing Sharply
$590 $741
$943
$1,190
$1,433
$1,774
$2,176
$2,619
$0
$1,000
$2,000
$3,000
2011 2012 2013 2014 2015 2016E 2017F 2018F
23.7% CAGR
Global E-Commerce Estimates ($ Billion)
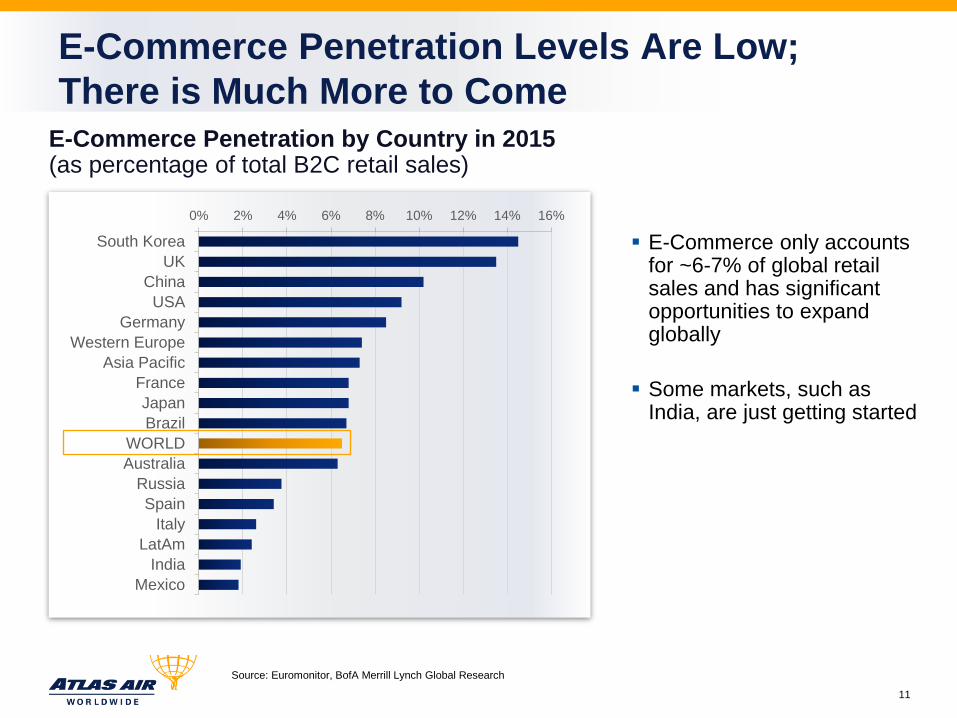
E-Commerce only accounts for ~6-7% of global retail sales and has significant opportunities to expand globally
Some markets, such as India, are just getting started
Source: Euromonitor, BofA Merrill Lynch Global Research
E-Commerce Penetration by Country in 2015 (as percentage of total B2C retail sales)
11
0% 2% 4% 6% 8% 10% 12% 14% 16%
Mexico
India
LatAm
Italy
Spain
Russia
Australia
WORLD
Brazil
Japan
France
Asia Pacific
Western Europe
Germany
USA
China
UK
South Korea
E-Commerce Penetration Levels Are Low;
There is Much More to Come
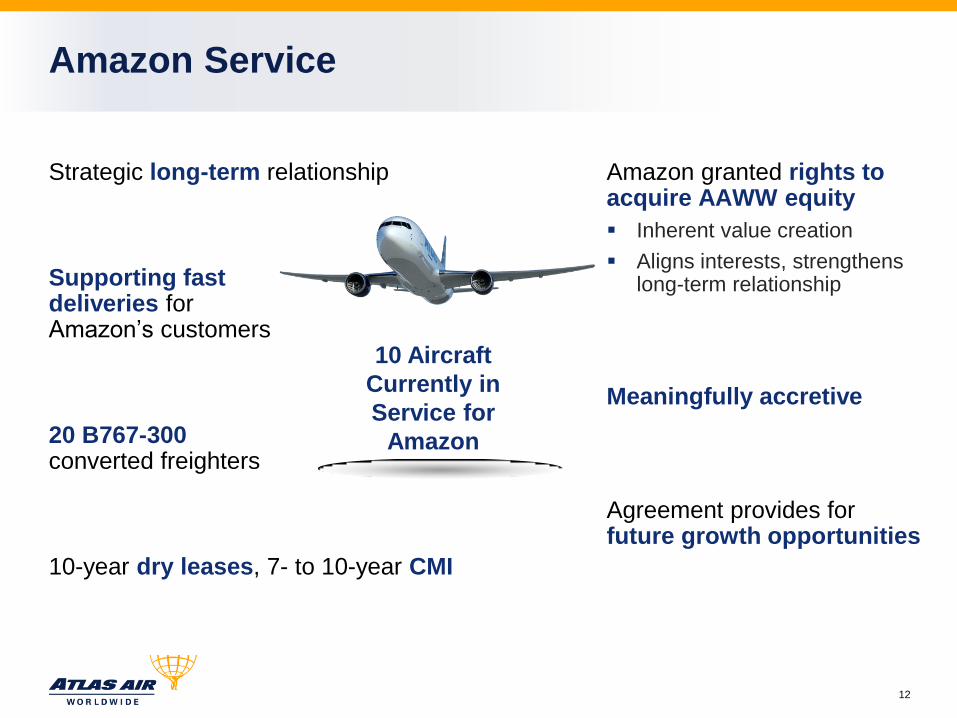
Amazon Service
Strategic long-term relationship
Supporting fast deliveries for Amazon’s customers
20 B767-300 converted freighters
10-year dry leases, 7- to 10-year CMI
Amazon granted rights to acquire AAWW equity
Inherent value creation
Aligns interests, strengthens long-term relationship
Meaningfully accretive
Agreement provides for future growth opportunities
12
10 Aircraft
Currently in
Service for
Amazon
13
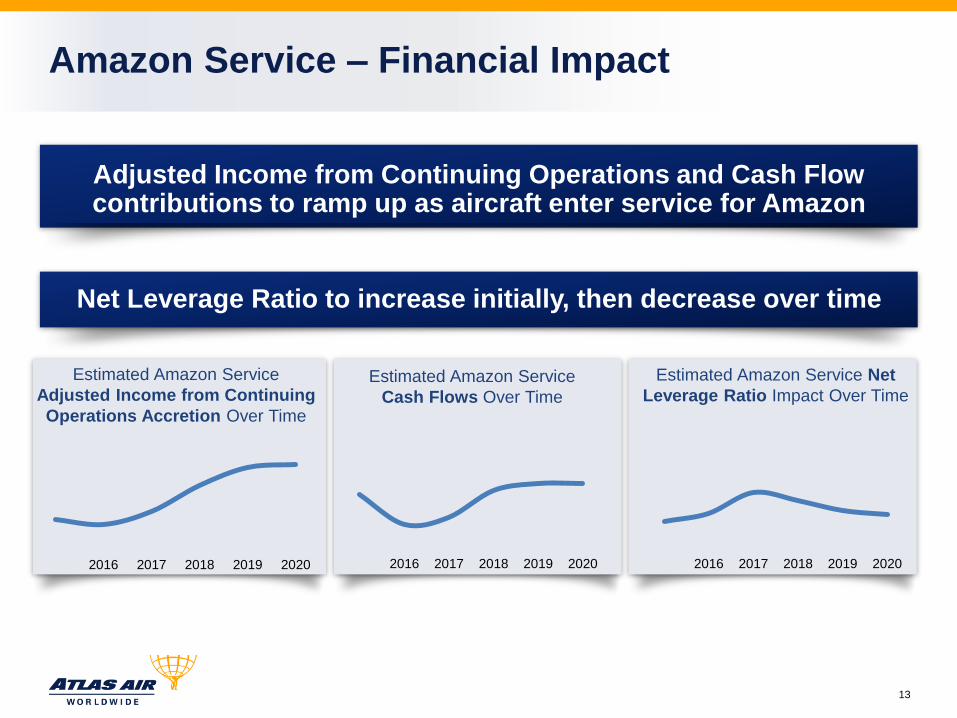
Amazon Service – Financial Impact
2016 2017 2018 2019 2020
Estimated Amazon Service
Adjusted Income from Continuing
Operations Accretion Over Time
2016 2017 2018 2019 2020
Estimated Amazon Service
Cash Flows Over Time
2016 2017 2018 2019 2020
Estimated Amazon Service Net
Leverage Ratio Impact Over Time
Net Leverage Ratio to increase initially, then decrease over time
Adjusted Income from Continuing Operations and Cash Flow contributions to ramp up as aircraft enter service for Amazon

14
767-300 Financing
Aircraft acquisitions to be funded with secured aircraft financing and future
cash generated from operations
Strength of cash flows to enhance financing:
By year-end 2018,
20 B767-300 Converted Freighters
Positive initial reaction
Multiple financing avenues
High LTVs
Low coupons

Southern Air Acquisition
Strategically Compelling
Highly Complementary
All-Cash, Debt-Free
Immediately Accretive
Foundation for Growth
Premier provider of intercontinental and domestic CMI services
Expands platform into 777 and 737 operations Provides access to broadest array of aircraft and operating services
All-cash, debt-free transaction valued at ~$105.8 million Completed April 7, 2016
Immediately accretive to earnings Adjusted EBITDA/net income margins in line with AAWW’s Adding ~$100 million in annualized revenues
Drives greater diversification, scale and global footprint Provides solid foundation for additional growth
Atlas is a more diversified and profitable company, offering customers access to the widest range of modern, efficient aircraft
15

AAWW – Executing Strategic Plan
16
Thought Leadership
Service Quality
Solid Financial Structure
Leading Assets
Global Scale & Scope
Diversified Mix
Transformed Business

17
* Includes to-be-converted aircraft
Our Current Fleet – September 2017
11 Boeing 777s
5 CMI 777Fs
6 Titan 777Fs
7 Boeing 737s
5 737-400Fs
1 737-300F Titan
1 737-800 passenger Titan
35 Boeing 767/757s
28 767-200/300Fs*
6 767-200/300 passenger
1 757-200 freighter Titan
Total Fleet: 97 Operating Fleet: 88
…Heading to More than 100 aircraft …with Over 40 B767s
44 Boeing 747s
10 747-8Fs
26 747-400Fs
4 747-400 passenger
4 Boeing Large Cargo Freighters
(LCFs)
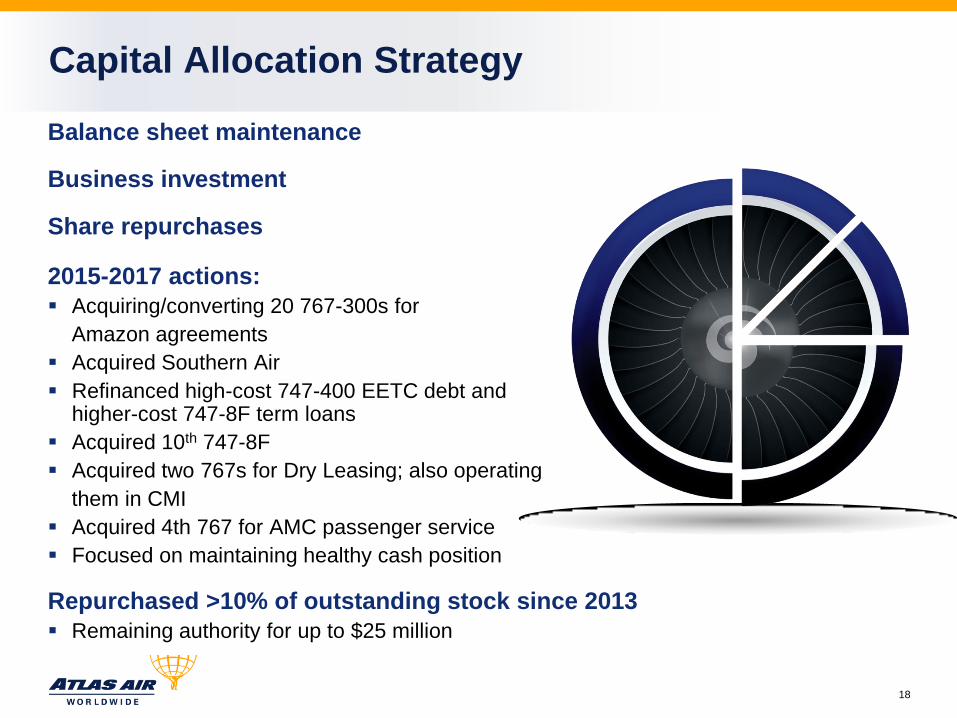
Capital Allocation Strategy
18
Balance sheet maintenance
Business investment
Share repurchases
2015-2017 actions:
Acquiring/converting 20 767-300s for
Amazon agreements
Acquired Southern Air
Refinanced high-cost 747-400 EETC debt and higher-cost 747-8F term loans
Acquired 10th 747-8F
Acquired two 767s for Dry Leasing; also operating
them in CMI
Acquired 4th 767 for AMC passenger service
Focused on maintaining healthy cash position
Repurchased >10% of outstanding stock since 2013
Remaining authority for up to $25 million

19
Fleet Size and Net Leverage Ratio
Growing and diversifying fleet and managing leverage
* See appendix for Non-GAAP reconciliation
67
78 79 82 84 88 91
1Q16 2Q16 3Q16 4Q16 1Q17 2Q17 3Q17
Fleet Size
3.0x
3.5x
4.0x
4.5x
5.0x
5.5x
Q1'17 Q2'17 Q3'17 Q4'17 Q1'18 Q2'18 Q3'18 Q4'18 Q1'19 Q2'19 Q3'19 Q4'19
Net leverage Ratio (NLR) Forecast With and Without Convertible Debt
NLR with Convertible Debt
NLR without Convertible Debt
4.9x
5.4x 5.3x
4.8x 4.9x 4.9x 5.0x
1Q16 2Q16 3Q16 4Q16 1Q17 2Q17 3Q17
Net Leverage Ratio*
3.0x
3.5x
4.0x
4.5x
5.0x
1Q17 4Q19
Estimated Net Leverage Ratio Trend Based on estimates of fleet growth, placement dates and financing plans
Before '17 Note Transaction After '17 Note Transaction
20
AAWW – Key Takeaways
Shaping a Powerful Future
New era of significant business growth and development
Fundamental change in markets served
Strategic long-term relationship with Amazon
Southern Air acquisition
Capitalizing on initiatives to drive:
Value and benefit for customers and investors
Key new customer agreements including
Cathay Pacific Cargo, Asiana Cargo, Hong Kong Air Cargo,
Nippon Cargo Airlines, Suparna Airlines,
DHL Global Forwarding and FedEx
Strong foundation for earnings and cash flow

Appendix

Atlas Air Worldwide
We manage diverse, complex and time-definite global networks
We deliver superior performance and value-added solutions across our business segments
We manage a world-class fleet to service multiple market segments
We are strategically positioned in a strengthening market and focused on new opportunities to continue to deliver future growth
Ownership
100% Ownership
100% Ownership
51% (49% DHL) Ownership
100%
22

23
Our Customers Reflect Our Focus on Quality
Long-term, profitable relationships Resilient business model and predictable revenues
Shippers Forwarders / Brokers Express Airlines
Expanded portfolio of growth-oriented market leaders
Covering the entire air cargo supply chain
High degree of customer integration
Focused on continuous development and growth
Long-term contractual commitments
Our Strengths
… and Amazon

Global Operating Network – 2016
210,444 Total Block Hours Operated in 2016*
39,882 Flights*
425 Airports in 119 Countries
730 Charters Completed
80+ Unique Customers
Astral Boeing BST
DHL Etihad Qantas
Panalpina SonAir Scheduled Service
EZE
LIM
* Totals including Southern Air, acquired April 7, 2016
24

Revenue and Adjusted EBITDA Growth
1,398.2
1,646.0 1,656.9
1,799.3 1,822.7 1,839.6
2011 2012 2013 2014 2015 2016
Revenue
EBITDA
25
214.9
289.0 294.6
330.2
377.9 382.3
14%
18%
22%
26%
200
400
2011 2012 2013 2014 2015 2016
Adj. EBITDA Adj. EBITDA Margin
Adj. EBITDA*
* See appendix for Non-GAAP reconciliation

Convertible Note Offering
26
Debt-Like Structure
Support Long- Term Growth
Strengthen Balance Sheet
Convertible Offering
Repay higher-cost revolving credit facility
Enhance business and financial flexibility
$289.0 million of 1.875% Convertible Senior Notes due 2024
New liquidity to support long-term growth
Bond hedge mitigates dilution
Intent to net share settle limits shares issued at conversion

2017 Objectives
27
Achieve earnings goals
Deliver superior service quality
Maximize business opportunities
Implement Amazon service
Complete Southern Air integration
Realize Continuous Improvement
In other words…
Continued Growth and Innovation
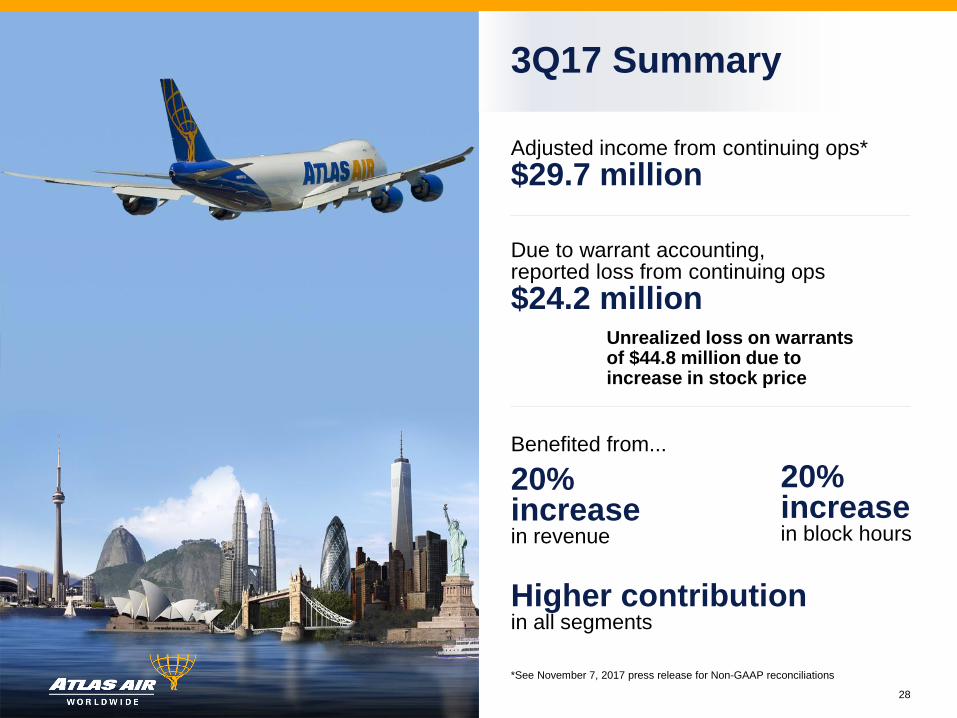
20% increase in revenue
20% increase in block hours
Higher contribution in all segments
28
*See November 7, 2017 press release for Non-GAAP reconciliations
Adjusted income from continuing ops*
$29.7 million
Due to warrant accounting, reported loss from continuing ops
$24.2 million Unrealized loss on warrants of $44.8 million due to increase in stock price
Benefited from...
3Q17 Summary

29
2017 Framework
~20% increase over 2016
~75% of total in ACMI
Balance in Charter
Block Hours
To grow by a high-single to
low-double-digit percentage compared with 2016
Adjusted Net Income
Stronger company
Solid demand for our services
Business
Maint Exp ~$275 million
Depr/Amort ~$165 million
Core Capex ~$75-$80 million
Other Key Items
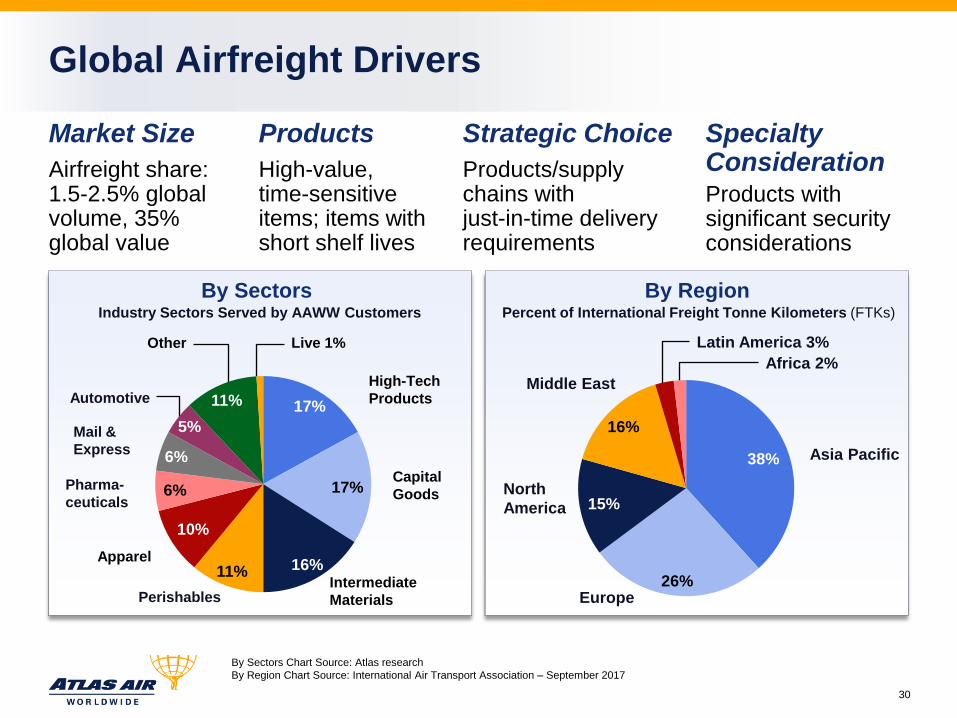
Global Airfreight Drivers
By Sectors Chart Source: Atlas research
By Region Chart Source: International Air Transport Association – September 2017
Market Size
By Region
38%
26%
15%
16%
Asia Pacific
Europe
North
America
Middle East
Latin America 3%
Africa 2%
Percent of International Freight Tonne Kilometers (FTKs)
By Sectors Industry Sectors Served by AAWW Customers
17%
17%
16% 11%
10%
6%
11%
High-Tech
Products
Capital
Goods
Apparel
Pharma-
ceuticals
Intermediate
Materials
Automotive
Other Live 1%
Perishables
Mail &
Express 6%
5%
Products Strategic Choice Specialty Consideration Airfreight share:
1.5-2.5% global volume, 35% global value
High-value, time-sensitive items; items with short shelf lives
Products/supply chains with just-in-time delivery requirements
Products with significant security considerations
30

31
Delivering Value to the General Air Cargo Market
EZE
LIM
Today Opportunity
Continued ACMI / CMI outsourcing by airlines, integrators, forwarders and shippers
Growth, particularly regarding 777, 767 and 737
Customer efficiency challenges will drive growth
Largest ACMI / CMI / Charter footprint
Multiple aircraft platforms
Expanded our position on five continents

32
Delivering Value to the Express Market
Today Opportunity
Expanding all products and services
Increasing fleet count
Expanding in fast-growing economies
ACMI, CMI and dry-leasing solutions
Multiple aircraft platforms
Operating on five continents

33
Delivering Value to E-Commerce Market
Today Opportunity
Very high growth rate with low penetration
Large scale expansion opportunity across several aircraft platforms
Expanding in fast-growing economies
ACMI, CMI and dry-leasing solutions
Multiple aircraft platforms (747, 777, 767, 757, 737)
Operating on five continents
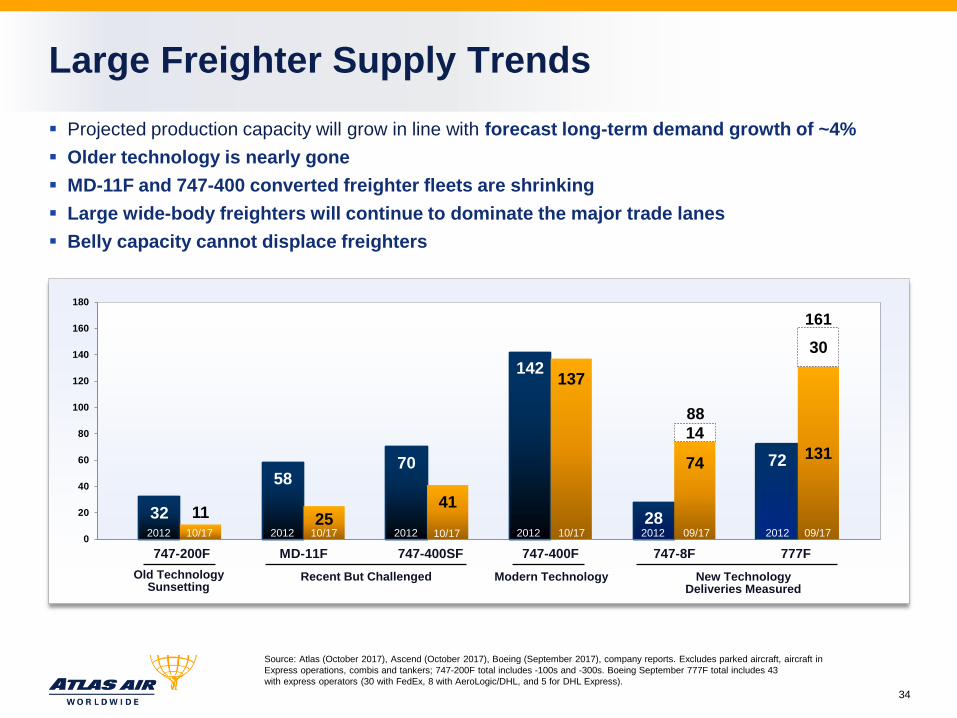
Large Freighter Supply Trends
Source: Atlas (October 2017), Ascend (October 2017), Boeing (September 2017), company reports. Excludes parked aircraft, aircraft in
Express operations, combis and tankers; 747-200F total includes -100s and -300s. Boeing September 777F total includes 43
with express operators (30 with FedEx, 8 with AeroLogic/DHL, and 5 for DHL Express).
32
58 70
142
28
72
11 25 41
137
74 131
14
30
0
20
40
60
80
100
120
140
160
180
Old Technology Sunsetting
747-200F
Modern Technology
747-400SF 747-400F
New Technology Deliveries Measured
747-8F MD-11F 777F
Recent But Challenged
2012 2012 2012 2012 10/17 10/17 10/17 10/17 09/17 09/17
161
88
2012 2012
Projected production capacity will grow in line with forecast long-term demand growth of ~4%
Older technology is nearly gone
MD-11F and 747-400 converted freighter fleets are shrinking
Large wide-body freighters will continue to dominate the major trade lanes
Belly capacity cannot displace freighters
34
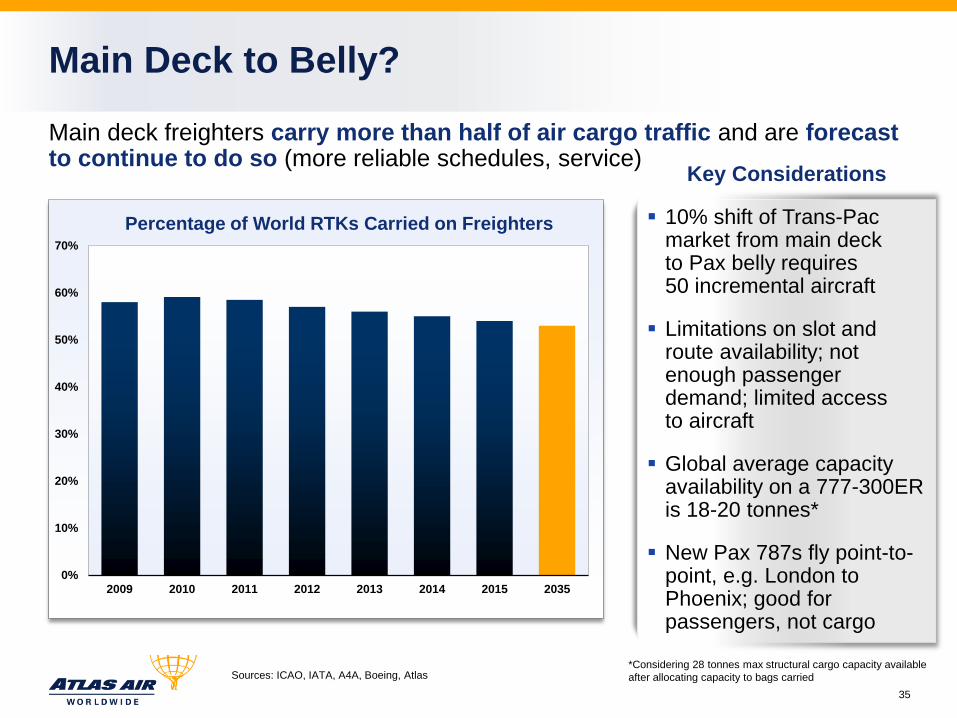
Main Deck to Belly?
Sources: ICAO, IATA, A4A, Boeing, Atlas
Main deck freighters carry more than half of air cargo traffic and are forecast to continue to do so (more reliable schedules, service)
0%
10%
20%
30%
40%
50%
60%
70%
2009 2010 2011 2012 2013 2014 2015 2035
Percentage of World RTKs Carried on Freighters
Key Considerations
10% shift of Trans-Pac market from main deck to Pax belly requires 50 incremental aircraft
Limitations on slot and route availability; not enough passenger demand; limited access to aircraft
Global average capacity availability on a 777-300ER is 18-20 tonnes*
New Pax 787s fly point-to-point, e.g. London to Phoenix; good for passengers, not cargo
*Considering 28 tonnes max structural cargo capacity available
after allocating capacity to bags carried
35
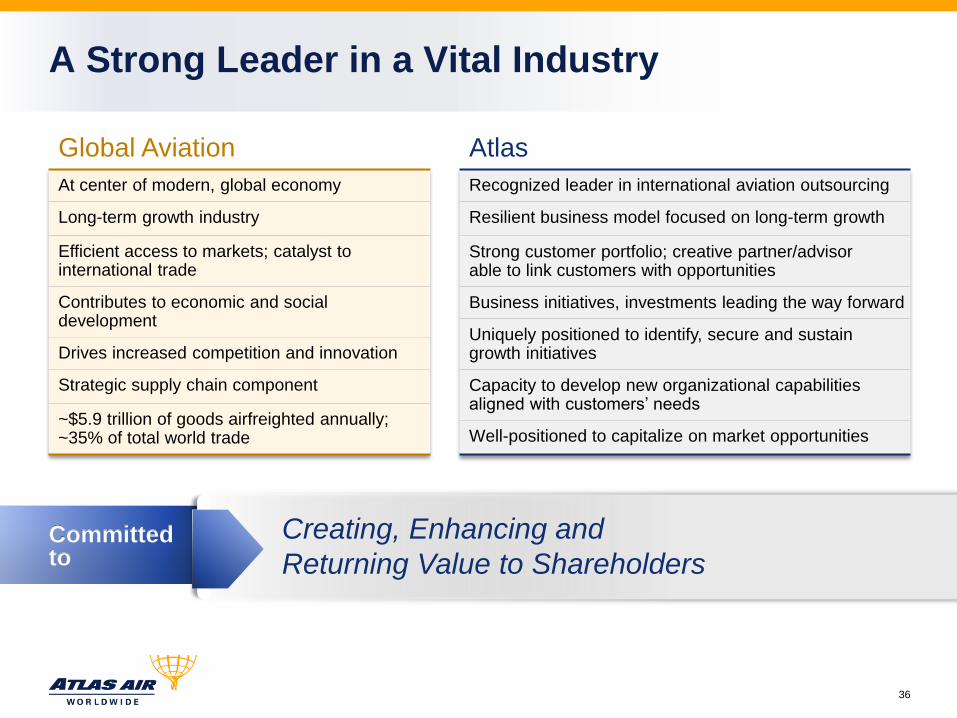
A Strong Leader in a Vital Industry
Global Aviation
At center of modern, global economy
Long-term growth industry
Efficient access to markets; catalyst to international trade
Contributes to economic and social development
Drives increased competition and innovation
Strategic supply chain component
~$5.9 trillion of goods airfreighted annually; ~35% of total world trade
Committed to
Creating, Enhancing and
Returning Value to Shareholders
Atlas
Recognized leader in international aviation outsourcing
Resilient business model focused on long-term growth
Strong customer portfolio; creative partner/advisor able to link customers with opportunities
Business initiatives, investments leading the way forward
Uniquely positioned to identify, secure and sustain growth initiatives
Capacity to develop new organizational capabilities aligned with customers’ needs
Well-positioned to capitalize on market opportunities
36
37
To be our customers’ most trusted partner
Our Vision
Our Mission To leverage our core competencies and organizational capabilities
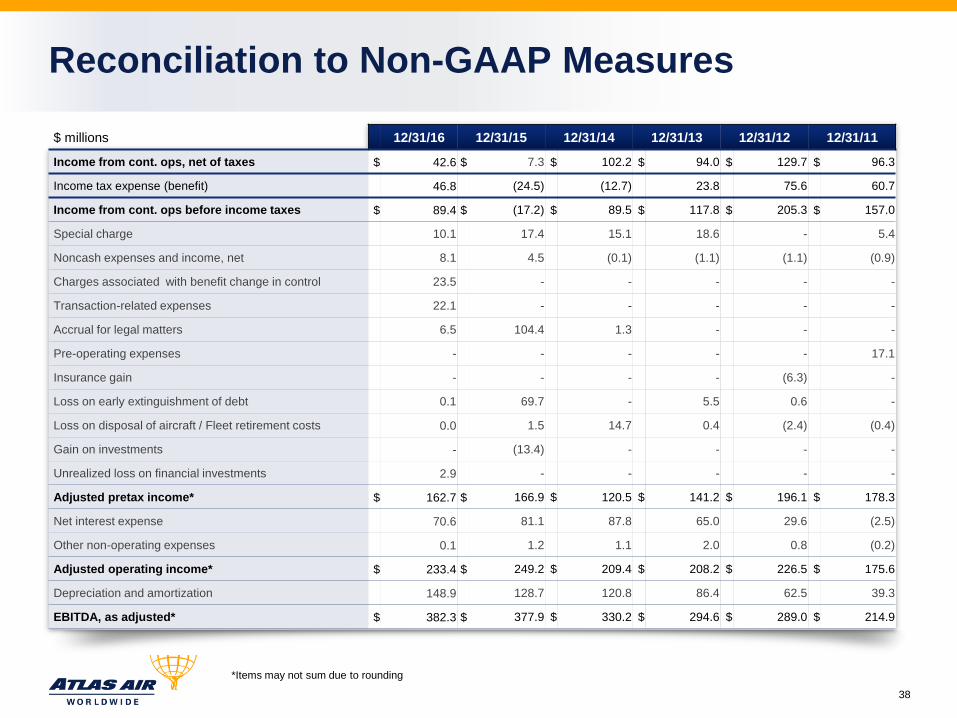
*Items may not sum due to rounding
Reconciliation to Non-GAAP Measures
38
$ millions 12/31/16 12/31/15 12/31/14 12/31/13 12/31/12 12/31/11
Income from cont. ops, net of taxes $ 42.6 $ 7.3 $ 102.2 $ 94.0 $ 129.7 $ 96.3
Income tax expense (benefit) 46.8 (24.5) (12.7) 23.8 75.6 60.7
Income from cont. ops before income taxes $ 89.4 $ (17.2) $ 89.5 $ 117.8 $ 205.3 $ 157.0
Special charge 10.1 17.4 15.1 18.6 - 5.4
Noncash expenses and income, net 8.1 4.5 (0.1) (1.1) (1.1) (0.9)
Charges associated with benefit change in control 23.5 - - - - -
Transaction-related expenses 22.1 - - - - -
Accrual for legal matters 6.5 104.4 1.3 - - -
Pre-operating expenses - - - - - 17.1
Insurance gain - - - - (6.3) -
Loss on early extinguishment of debt 0.1 69.7 - 5.5 0.6 -
Loss on disposal of aircraft / Fleet retirement costs 0.0 1.5 14.7 0.4 (2.4) (0.4)
Gain on investments - (13.4) - - - -
Unrealized loss on financial investments 2.9 - - - - -
Adjusted pretax income* $ 162.7 $ 166.9 $ 120.5 $ 141.2 $ 196.1 $ 178.3
Net interest expense 70.6 81.1 87.8 65.0 29.6 (2.5)
Other non-operating expenses 0.1 1.2 1.1 2.0 0.8 (0.2)
Adjusted operating income* $ 233.4 $ 249.2 $ 209.4 $ 208.2 $ 226.5 $ 175.6
Depreciation and amortization 148.9 128.7 120.8 86.4 62.5 39.3
EBITDA, as adjusted* $ 382.3 $ 377.9 $ 330.2 $ 294.6 $ 289.0 $ 214.9
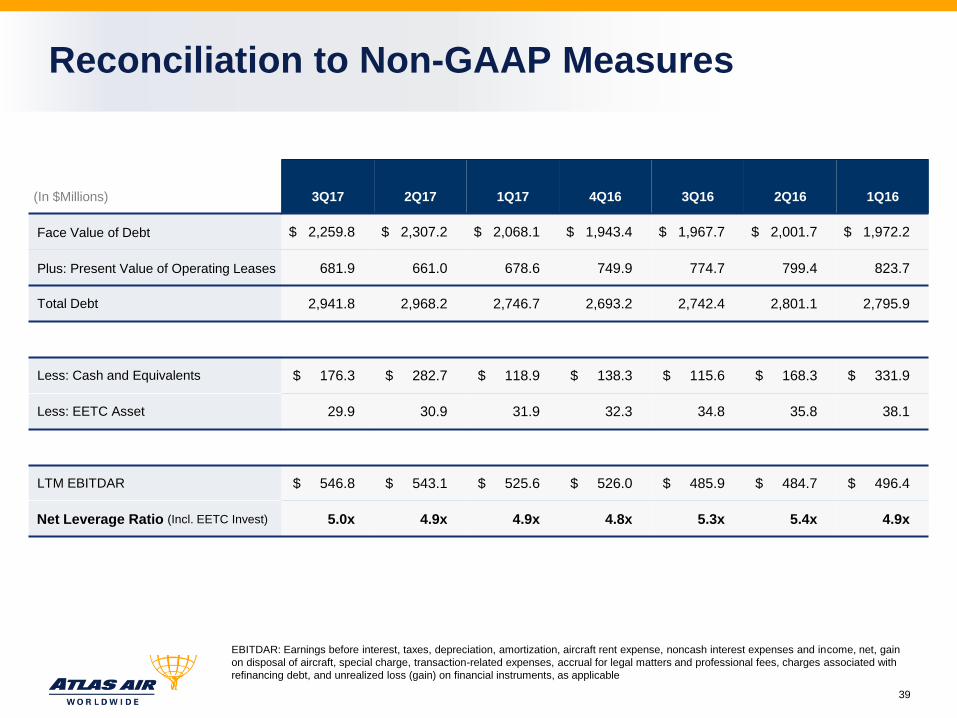
39
EBITDAR: Earnings before interest, taxes, depreciation, amortization, aircraft rent expense, noncash interest expenses and income, net, gain
on disposal of aircraft, special charge, transaction-related expenses, accrual for legal matters and professional fees, charges associated with
refinancing debt, and unrealized loss (gain) on financial instruments, as applicable
Reconciliation to Non-GAAP Measures
(In $Millions) 3Q17 2Q17 1Q17 4Q16 3Q16 2Q16 1Q16
Face Value of Debt $ 2,259.8 $ 2,307.2 $ 2,068.1 $ 1,943.4 $ 1,967.7 $ 2,001.7 $ 1,972.2
Plus: Present Value of Operating Leases 681.9 661.0 678.6 749.9 774.7 799.4 823.7
Total Debt 2,941.8 2,968.2 2,746.7 2,693.2 2,742.4 2,801.1 2,795.9
Less: Cash and Equivalents $ 176.3 $ 282.7 $ 118.9 $ 138.3 $ 115.6 $ 168.3 $ 331.9
Less: EETC Asset 29.9 30.9 31.9 32.3 34.8 35.8 38.1
LTM EBITDAR $ 546.8 $ 543.1 $ 525.6 $ 526.0 $ 485.9 $ 484.7 $ 496.4
Net Leverage Ratio (Incl. EETC Invest) 5.0x 4.9x 4.9x 4.8x 5.3x 5.4x 4.9x
Thank you.
40