Embed Size (px)
Citation preview
Youth employment statistics in Asia and the Pacific:a review of Internet resources
Peter K. Wingfield DigbyStatistical consultant
December 2001
Prepared for ILO/Japan Tripartite Regional Meeting on Youth Employment in Asia and the PacificBangkok, 27 February – 1 March 2002

This is a working paper written to serve as a basis for discussion at ILO/Japan Tripartite Regional Meeting on Youth Employment in Asia and the Pacific. The views and opinions expressd in this paper are those of the author and do not constitute an endorsement by the International Labour Office or by tripartite constituents in Thailand. The paper has not been edited and should not be cited or distributed without consent from the author and the ILO. Please send comments and suggestions to ILO BAO/EASMAT at E-mail: [email protected].
Youth employment statistics in Asia and the Pacific: A review of Internet resources ii

Contents
Page
1. Background 1
2. Key Indicators of the Labour Market (KILM) 2
3. Geographic coverage 4
4. Data availability and data quality 7
5. Suggestions for future work 8
List of Tables and Boxes
Box 1 Labour market indicators included in KILM 2001 2
Box 2 Establishing mathematical links between the KILM indicators 4
Table 1 Estimated distribution of total and youth population 6
Box 3 Asia and Pacific region member States of ILO 7
Table 2 Timeliness of some indicators in KILM 2001 7
Table 3 Data downloaded from Philippines NSO web site 9
Table 4 Calculation of indicators for KILM 9: Philippines example 9
Table 5 KILM 1: Labour force participation rates, 1995 11
Table 6 KILM 1: Labour force participation rates, latest year 12
Table 7 KILM 2: Employment to population ratio 13
Table 8 KILM 8: Unemployment rates 14
Table 9 KILM 9: Youth unemployment 15
Annexes
Annex 1 Comments on web sites containing data or relevant information 16
Annex 2 Social security programmes by country and type 37
Annex 3 Latest availability date of indicators in KILM 2001 38
Youth employment statistics in Asia and the Pacific: A review of Internet resources iii

1. Background
At the start of this new century, there is a continuing problem of unemployment and underemployment among youth in many parts of the world. According to ILO estimates, 70 million young people are searching for work but cannot find any. Studies of youth unemployment point to the greater burdens borne by teenagers and women. For these reasons, promoting productive employment for young people is high on the decent work agenda of the ILO. Accordingly, a Regional Meeting on Youth Employment in Asia and the Pacific has been scheduled to take place during 27 February – 1 March 2002 in Bangkok. Participants from eight countries will work together to identify national and regional strategies in promoting decent work for young men and women.
This report is written to provide an input to discussion at the Regional Meeting. The report covers the following topics: the Key Indicators of the Labour Market – KILM (section 2); the countries covered by this report (section 3); general issues of data availability and data quality (section 4); and some suggestions for future work (section 5). Information on country web sites is given in Annex 1.
According to the research design of this project given by the ILO, international comparability in data collection is essential. This is because the project aimed to fill gaps in the KILM database (described below). The main target years for data collection were specified as being from 1995 to 2000. It was envisaged that the data would be collected through searching the web sites of National Statistical Offices (NSOs) and Ministries of Labour in the region. Direct contact with NSOs was only to be made where absolutely necessary. Due to time constraints, direct contact with NSOs was not possible and data presented here were primarily collected from Internet sources.
The original plan had been that the researcher would provide ILO with detailed spreadsheets for some of the KILM indicators, which could be used for updating the KILM database. In the event, only a limited amount of youth employment data were found on the Internet. The detailed notes provided in Annex 1 should enable the reader to locate those few sites where useful information can be found, although further contacts with national authorities may be needed to get the full details of the methodology applicable to each indicator.
Before looking at the national situation in different countries, it is helpful to begin by taking a global perspective. As noted in the Resolution on the World Programme of Action for Youth to the Year 2000 and Beyond, adopted by the UN General Assembly in March 1996, unemployment and underemployment among youth is a problem. As the Resolution notes, it is in fact part of the larger struggle to create employment opportunities for all citizens. According to ILO estimates made at the time, more than one hundred million jobs would have had to be created within the following 20 years in order to provide suitable employment for the growing number of young people in the economically active populations of developing countries.
A very useful starting place for information on the general situation of youth is a web site on Youth at the United Nations (esa.un.org/socdev/unyin).1 The Q and A section of the web site notes that the term 'youth' refers to those in the age range 15-24 inclusive. This definition was made in connection with the International Youth Year held in 1985. All United Nations statistics on youth are now based on this definition. Within the category of “youth”, it is also useful to distinguish between
1 This web site is published by to the Youth Unit, Social Integration Branch, Division for Social Policy and Development, Department of Economic and Social Affairs (DESA) of the United Nations.
Youth employment statistics in Asia and the Pacific: A review of Internet resources 1

teenagers (youth aged under 20) and young adults (those aged 20-24), since the sociological, psychological, and health (and, in our area of interest, employment) problems they face may differ.
There are just over one billion youth in the world today. Youth currently constitute about 17 per cent of the total population. Although the number of youth is expected to increase to about 1.4 billion by the year 2025, the proportion of young people in the total world population is actually expected to drop slightly over the next 25 years, to about 16 per cent.
The Youth at the United Nations web site allows interested users to create their own statistical profile of an individual country or group of countries. Statistics available cover demographic indicators, education, employment, and health. For each country full details are given of the appropriate government and NGO contacts to use for collecting further youth information.
In the specific area of youth employment, the ILO itself has a useful web site, linked to its InFocus Programme on Skills, Knowledge and Employability: www.ilo.org/public/english/employment/skills/targets/youth/young.htm. The site draws attention to the common problems and uncertainties about the future faced by young men and women around the world, particularly in relation to limited employment prospects. Youth vulnerability is also often linked to problems of poverty, illiteracy, and health, and girls and young women are often especially disadvantaged. The web site contains an interesting report (released in September 2001) entitled Youth and Work: Global Trends, that was prepared jointly by the ILO Employment Sector and the ILO Bureau of Statistics. The report states bluntly: “Young men and women around the world face a deteriorating employment situation. Action is needed if they are to avoid a future of high unemployment, low incomes and unrealised aspirations. The figures speak for themselves.”
The report contains a variety of charts and tables to back up its opening statement, and the message is fairly clear:
Global youth unemployment is high and rising. Youth are two to three times more likely to be unemployed than adults. Young women face poorer employment prospects. The majority of new jobs are low paid and of poor quality. The costs of youth unemployment are high. There will be an increase of more than 110 million youth world-wide this decade
(and two-thirds of this growth will occur in the Asia-Pacific region). There is an urgent need for action.
2. Key Indicators of the Labour Market (KILM)
Following a request in 1996 from the International Labour Conference, the ILO embarked on a project entitled Key Indicators of the Labour Market to develop an expanded range of indicators of labour market performance and to widen the availability of indicators to monitor new employment trends. An initial list of 18 key labour market indicators was chosen for inclusion in the KILM database. A first release, KILM 1999, took place in September 1999, as a hard-copy publication and CD-ROM, and through a web site. An updated version, KILM 2001, was due for release in November 2001 (www.ilo.org/public/english/employment/strat/kilm/).2 Access to the Internet version of the KILM database (known as KILMnet) is available by subscription, after first registering with ILO Publications and obtaining a password.
2 KILM team kindly made available to the consultant an advance copy of the new data set before KILM 2001 was finally released to the public in November 2001.
Youth employment statistics in Asia and the Pacific: A review of Internet resources 2

The main change is that the number of indicators in this second version of KILM has been increased from 18 to 20 (see Box 1). The old KILM indicators 16, 17 and 18 have been renumbered as 17, 18, and 20 respectively, and two new indicators – KILM 16: occupational wages and earning indices, and KILM 19: Labour market flows – have been added.3 There is also more detailed information about each KILM indicator, as well as an expansion in the amount of other background indicators provided, covering macroeconomic topics, social and human development, and population and education.
The major focus of this present consultancy is on the KILM indicators 1, 2, 8 and 9. The definitions of the terms used for measuring these indicators were laid down in the Resolution concerning statistics of the economically active population, employment, unemployment and underemployment, adopted by the 13th International Conference of Labour Statisticians in 1982.
KILM 1: Labour force participation rate (LFPR)LFPR is a measure of the extent of economic activity amongst a country's working-age
population. It provides an indication of the relative size of the supply of labour available for the production of goods and services. It is defined as the ratio of the labour force to the working-age population, expressed in per centage terms. The labour force is the sum of the number of persons employed and the number of persons unemployed. Usually national labour force surveys (LFSs) represent the best source of information for measuring LFPR. Where no LFS has been carried out, the population census can be used.
KILM 2: Employment to population ratioThis ratio may be considered as perhaps the most important indicator of a country's labour
market status. It is defined as the proportion of an economy’s working age population that is employed, expressed in per centage terms. Employment is defined as persons who performed any work at all during the reference period, for pay or profit (including payment in kind), or who were temporarily absent from a job, for reasons such as illness, holidays or industrial dispute. People who work without pay in a family business or farm for at least an hour a week are also meant to be counted as being in employment. The data needed for this indicator usually come from a national labour force or some other household survey.
KILM 8: UnemploymentThe unemployment rate is probably the best-known labour market measure, and is defined
as the ratio of the total unemployed (for the country as a whole or for some subgroup) to the 3 Amongst other small but interesting changes is the dropping of the word 'urban' from the title of KILM 7, presumably to reflect the fact that the data on informal sector employment for some countries (including Fiji, the Philippines, and Thailand in certain years) cover both urban and rural areas.
Youth employment statistics in Asia and the Pacific: A review of Internet resources 3
Box 1: Labour market indicators included in KILM 2001
KILM 1 Labour force participation rate KILM 11. Unemployment by educational attainmentKILM 2. Employment-to-population ratio KILM 12. Time-related underemploymentKILM 3. Status in employment KILM 13. Inactivity rateKILM 4. Employment by sector KILM 14. Educational attainment and illiteracyKILM 5. Part-time workers KILM 15. Manufacturing wage trendsKILM 6. Hours of work KILM 16, Occupational wage and earning indicesKILM 7. Informal sector employment KILM 17. Hourly compensation costsKILM 8. Unemployment KILM 18. Labour productivity and unit labour costsKILM 9. Youth unemployment KILM 19. Labour market flows KILM 10. Long-term unemployment KILM 20. Poverty and income distribution

equivalent labour force (for the country as a whole or for the same subgroup). Unemployed persons are those who are without work and who are seeking work or who are currently available for work. Labour force surveys are generally the best source of data for calculating unemployment, but other sources such as population censuses or administrative records are also used.
KILM 9: Youth unemployment This indicator has four separate components, each representing a different aspect of the
youth unemployment problem:
(a) the youth unemployment rate, based on the ratio of the number of unemployed youth to the youth labour force;
(b) the ratio of the youth unemployment rate to the adult unemployment rate; (c) youth unemployment as a proportion of total unemployment; and (d) youth unemployment as a proportion of the youth population.
Youth are defined as those aged 15 to 24, with two subgroups being identified: teenagers (15-19) and young adults (20-24). Data for this indicator are generally derived from household surveys, although other sources can be used.
While the main focus of this consultancy is on these four indicators, attempts (largely unfruitful) have been made to collect some information in respect of other KILM indicators, such as time-related underemployment (KILM 12), duration of unemployment (KILM 10), and educational attainment (KILM 14). It had also been hoped that it would be possible to collect data separately for teenage youth (those aged 15-19) and for young adults (those aged 20-24), so as to reflect the different experiences of the two groups. However, in practice it has proved rarely possible to locate information on the Internet to this level of detail.
Table A3 of the KILM database contains useful information about the availability of different social security programmes in each country. Annex 2 of this report shows the details in respect of ILO member countries in the Asia-Pacific region. No attempt has been made to check the accuracy of this information.
Although the KILM 2001 database provides separate statistics for each indicator, there are in fact close links between many of the different indicators, as illustrated in Box 2.
Youth employment statistics in Asia and the Pacific: A review of Internet resources 4

3. Geographic coverage
Youth employment statistics in Asia and the Pacific: A review of Internet resources 5
Box 2 Establishing mathematical links between the KILM indicators
Although each KILM indicator provides a different perspective on some aspect of employment, it is important to realise that these indicators are not entirely independent of each other. In fact they are sometimes very closely related, and it is possible to derive one indicator from some combination of the other ones.
Let us consider, for instance, the relationship between the four KILM indicators of interest to us (KILM 1, KILM 2, KILM 8 and KILM 9). Here we consider the values of the indicators for “both sexes,” although the results would apply in similar fashion if we were considering just males, or just females.
KILM 1, KILM 2 and KILM 8
We can see this relationship by considering just the total figures (i.e. for those aged 15+) in KILM 1, KILM 2 and KILM 8. Let us use the following symbols:
Population = P, Labour force = L, Employed = E, Unemployed = U
KILM 1 is the LFPR which is (L/P)*100KILM 2 is the employment to population ratio, which is (E/P)*100KILM 8 is the unemployment rate, which is (U/L)*100
Since E + U = L by definition, we can rewrite KILM 8 as {(L-E)/L}*100 = {1- (E/L)}*100But KILM 2 divided by KILM 1 = {(E/P)*100} divided by {(L/P)*100} = (E/L)
Therefore we can write KILM 8 as: KILM 8 = {1 – (KILM 2 / KILM 1)} * 100
Thus, once we have KILM 1 and KILM 2, we can automatically derive the KILM 8 indicator.
Note: If we have obtained the values of KILM 1, KILM 2 and KILM 8 from different sources, the relationship above will help in providing a check on the quality of the data.
KILM 9 - Youth
Similarly, some of the youth indicators in KILM 9 have a very close relationship to the corresponding indicators in KILM 1 and “ILO-comparable” KILM 8.
If KILM 1 and KILM 8 are already available, the youth components of these indicators should also be known. KILM 9 (a), youth unemployment rate, is therefore exactly the same as its corresponding value in KILM 8. KILM 9 (a) = KILM 8 for youth.
KILM 9 (d), share of youth unemployed to youth population, can be written as (UY/PY )*100, where we use the subscript y to signify that we are concerned only with youth.
But KILM 1 for youth is (LY/PY)*100, and KILM 8 for youth is (UY/LY)*100Therefore KILM 1 * KILM 8 is (LY/PY)*100 * (UY/LY)*100 = (UY/PY)*100*100 = KILM 9 (d) * 100. So KILM 9 (d) = (KILM 1 for youth * KILM 8 for youth) / 100
Similar relationships could probably be developed for KILM 9 (b) and KILM 9 (c), but the mathematics become complicated.

The 26 countries covered by the ILO Regional Office for Asia and the Pacific (see Box 3 on page 6) extend over a vast area and are diverse in culture and level of economic development. ILO member States in the region stretch from the Islamic Republic of Iran in western Asia to the islands of Fiji in the Pacific. In terms of population size, they vary from China and India, each with a population of over one billion, to the tiny Pacific islands that make up Kiribati, with a population of smaller than 100,000.
In the KILM classification, countries have been grouped into special regions, which are further divided into sub-regions. Three countries in Asia and the Pacific (Australia, Japan and New Zealand) have been assigned to a group called “Developed (industrialised) countries.” The Islamic Republic of Iran has been assigned in the KILM database to the Middle East and North Africa region. The other countries have been assigned to various sub-regions within the Asia and Pacific region. In the case of Asian countries, the sub-regional groupings are Eastern, Southeastern and South-central. In the case of the Pacific, the sub-regional groupings are Melanesia, Micronesia and Polynesia. However, there are no ILO member countries in Polynesia, and only one (Kiribati) in Micronesia.4
Table 1 provides information on the size of the total population and the youth population of each country. We can see that the total population of ILO-ROAP member countries is about 3.4 billion people, with China and India accounting for two-thirds of this total. The member countries have very different population structures. At one extreme are the three “major non-Europe industrialised countries” – Australia, Japan and New Zealand – where the median age is well in excess of 30 years. Singapore shows a similar pattern. Moving along the continuum, we have China and the Republic of Korea, with a median age of around 30. The rest of the ILO-ROAP countries have median ages that are invariably lower than 30. At the other extreme, Afghanistan, Nepal, Pakistan, Cambodia, Lao PDR, the Solomon Islands and the Islamic Republic of have population pyramids heavily weighted towards the young, with at least half of the population aged under 20.
Turning to the youth population, we see from the third column of figures in Table 1 that there are about 600 million young people aged 15 to 24 in ILO-ROAP’s member countries, with about 200 million of them in China and another 200 million in India. In terms of number of youth, the next largest countries are Indonesia (40 million youth) and Bangladesh and Pakistan (each with 30 million youth). The fourth column of figures in Table 1 shows the per centage of youth in the population of each country. Youth constitute around 13 per cent of the population in the “industrialised countries” and in Singapore, and about 16 per cent in China, the Republic of Korea, Afghanistan and Cambodia. In all the other countries youth constitute roughly 20 per cent of the population. Also included in Table 1 is the number of youth for the most recent year shown in KILM 2001. These figures have been included here to highlight the difficulties of reconciling even basic population counts taken from different sources (see, for instance, the contrasting estimates for Bangladesh).
Table 1 Estimated distribution of total and youth population in ILO-ROAP member countries for the year 2000
4 Kiribati became a member of ILO in 2000. It therefore did not appear in KILM 1999, but is included in KILM 2001.
Youth employment statistics in Asia and the Pacific: A review of Internet resources 6
Total population
Median age
Youth population (15-24) Source: //esa.un.org
Youth population (15-24)Source: KILM 2001
(2000) (2000) Number
Per centof total
Number Latest year
millions years millions % millionsDeveloped (industrialised) countries
Major non-Europe Australia 18.8 35.1 2.5 13.5 % 2.7 1999Japan 126.4 40.8 16.2 12.8 % 16.2 2000New Zealand 3.8 33.4 0.5 13.9 % 0.5 1999
Asia and the Pacific
Eastern Asia China* 1,276.3 30.0 191.4 15.5 % 221.2 1995Korea, Republic of 46.9 31.5 7.7 16.5 % 6.8 1999Mongolia 2.7 21.4 0.6 20.7 % 0.4 1998
South-central Asia Afghanistan 25.6 19.8 4.4 17.3 % 3.9 1995Bangladesh 128.3 20.4 30.2 23.5 % 20.2 1996India 1,006.8 24.0 191.3 19.0 % 175.6 1995
Nepal 24.3 18.7 4.8 19.6 % 3.5 1998Pakistan 156.0 19.0 29.5 18.9 % 25.4 2000Sri Lanka 18.8 27.4 3.7 19.9 % 3.0 1999
South-eastern Asia Cambodia 11.2 19.4 1.8 16.8 % 2.1 1998Indonesia 212.6 24.7 42.1 19.8 % 39.1 1999Lao PDR 5.7 17.3 1.0 18.4 % 0.9 1995
Malaysia 22.3 22.5 4.2 18.8 % 4.4 1999Myanmar 49.3 23.1 9.6 19.5 % 9.2 1995Philippines 75.0 21.5 14.9 19.8 % 14.5 1999
Singapore 3.6 34.3 0.4 12.3 % 0.5 1998Thailand 60.5 28.1 11.4 18.9 % 11.5 1999Viet Nam 80.5 22.6 16.3 20.2 % 14.8 1995
Pacific: Melanesia Fiji 0.8 23.7 0.2 21.3 % 0.2 1995Papua New Guinea 4.8 20.5 0.9 19.7 % 0.9 1995Solomon Islands 0.4 18.2 0.1 20.5 % 0.1 1995
Micronesia Kiribati 0.1 n.a. 0.0 26.9 % n.a. n.a.
Middle East and North Africa
Middle East Iran, Islamic Rep. of 76.4 18.1 15.5 20.3 % 12.3 1996
TOTAL 3437.9 601.2 17.5 %
Note: * The figures for China exclude Hong Kong and Macau. The grouping of countries in this table is based on the KILM regions (see Box 3 on page 6).
Sources: The data in the first four columns of this table are taken from esa.un.org/socdev/unyin, the site of Youth at the United Nations. Those data on the web site were obtained from a large variety of different sources, mainly within the UN system. The data in the final two columns are taken from KILM 2001.
Youth employment statistics in Asia and the Pacific: A review of Internet resources 7
4. Data availability and data quality
Accessibility to data and timeliness in data release are two important components of overall data quality. One very useful table found in KILM 2001 in evaluating these criteria is Table E2, which shows for each country the latest availability date for each KILM indicator. This information is shown in detail for the ILO-ROAP countries in Annex 3, and the information for our indicators of interest is summarised in Table 2 below.
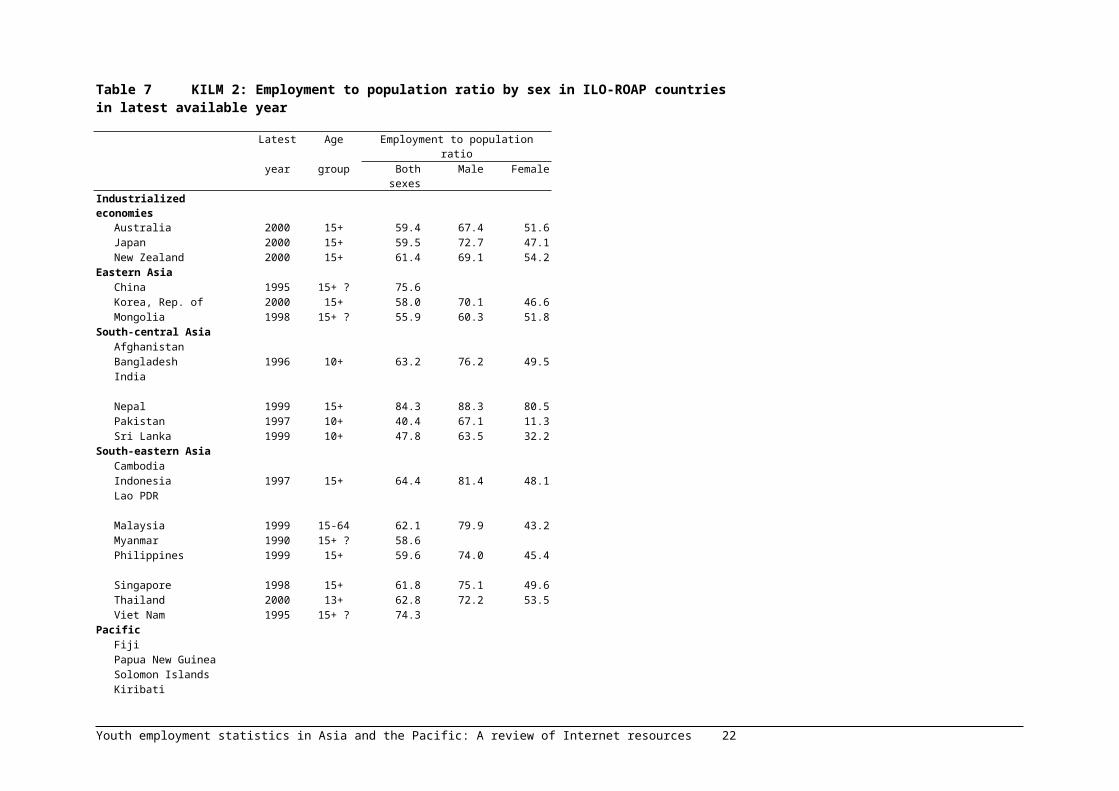
For our main indicators of interest, we can see that KILM 1 (labour force participation rate) is available for almost all ILO-ROAP countries; Kiribati, a new member of ILO, is the only country for which this indicator is missing. Some two-thirds of countries have data shown for KILM 2 (employment to population ratio) and a similar proportion have data shown for KILM 8 (unemployment). Only half the countries have data shown for KILM 9 (youth employment).
Table 2 Timeliness of some indicators in KILM 2001 for ILO-ROAP member countries
Per centage of ILO-ROAP countries in KILM 2001 with:Indicator shown Indicator reported for 1999, 2000 or 2001
Main indicators of interest 1 Labour force participation rate 96 % 38 % 2 Employment to population ratio 65 % 38 % 8 Unemployment 69 % 58 % 9 Youth unemployment 46 % 35 %
Additional indicators of interest 10 Long-term unemployment 15 % 15 % 12 Time-related underemployment 19 % 19 % 14 Educational attainment 92 % 77 %
Note: A country appears to be counted in KILM as having “available data” if any data item is available
for that year. It does not mean that all data items for a particular indicator are necessarily available forthe latest year.
Youth employment statistics in Asia and the Pacific: A review of Internet resources 8
Box 3: Asia and Pacific region member States of ILO, classified by KILM regional grouping
KILM region KILM sub-region Countries
Developed (industrialised) Major non-Europe: Australia, Japan, New Zealandcountries:
Asia and the Pacific: Eastern Asia: China, Republic of Korea, Mongolia
South-central Asia: Afghanistan, Bangladesh, India, NepalPakistan, Sri Lanka
South-eastern Asia: Cambodia, Indonesia, Lao People's Democratic Republic, Malaysia, Myanmar Philippines, Singapore, Thailand, Viet Nam
Pacific:Melanesia: Fiji, Papua New Guinea, Solomon Islands
Micronesia: Kiribati
Middle East and North Africa: Middle East: Islamic Republic of Iran

For the additional indicators, almost all countries have data shown for KILM 14 (educational attainment); the Solomon Islands and Kiribati are the only countries for which data are missing. On the other hand, fewer than 20 per cent of countries have data shown for KILM 10 (long-term unemployment) or KILM 12 (time-related underemployment).
Availability of data is one thing; timeliness is another. It is particularly striking that, although countries are nearly always represented on KILM 1, their data are usually not timely; only 38 per cent have data reported for 1999 or a more recent year. In contrast, the data for KILM 14 (educational attainment) are in general very timely. In fact, in 73 per cent of countries the data for KILM 14 relates to the year 2001.5 Interestingly, with this indicator it is often the more developed industrialised countries that do not have up-to-date data.
In terms of availability of data on the Internet, the situation is very patchy. Some countries have excellent basic employment data, either on the web site of the national statistics office or on the web site of the ministry of labour, or on both sites. But very few countries have any substantial amount of data available on the employment situation among youth, and even fewer countries provide a separate breakdown of the figures for those aged 15-19 and those aged 20-24. Further details of relevant Internet sites for each country are given in Annex 1.
Even where sites did appear to have data available, closer inspection sometimes suggested that the data were unreliable. Webmasters need to insist that greater quality control is exercised to ensure that the data shown on their web sites do actually represent intended statistics. Several examples are given in Annex 1 of cases where the data appear suspect. Some examples of suspect Internet presentations are the following:
Table captions in China were incorrect. Data from Japan showed identical LFPRs for males and females. Age and sex specific rates in Pakistan were identical in different years. A chart purporting to show unemployment rates in Sri Lanka was in fact showing LFPRs,
possibly due to a problem of transposition. One table in Thailand supposedly showing separate data for males, females and both
sexes, in fact contained the same data in all three tables.
Most of these examples were not serious, and could easily be spotted, but they do decrease the reliability of data from the Internet sources. With the Internet developing so rapidly, government offices that put material onto the World Wide Web need to ensure that their data are of the highest quality, just as they would for a hard copy publication.
5. Suggestions for future work
The original intention of this research had been to provide an inter-country comparison of the employment data available on the Internet but, such an approach is not realistic in the present state of development of the Internet in Asia and the Pacific. Instead, we present here a summary of the data available in KILM 2001 for the four key indicators: KILM 1, KILM 2, KILM 8 and KILM 9. These tables are shown on the following pages. In order to make the inter-country comparison more
5 The timeliness of KILM 14 data in the new KILM data set is in marked contrast to the situation two years earlier, when only a quarter of all ILO-ROAP countries in the KILM 1999 database had data for 1997 or 1998. This change probably reflects increased efforts being made by the international community, particularly the new UNESCO Institute for Statistics, to improve data in this field.
Youth employment statistics in Asia and the Pacific: A review of Internet resources 9

interesting, data are presented for KILM 1 in two formats. Table 5 shows the labour force participation rates for all ILO-ROAP countries in 1995, since that is the most recent year for which data are available for all countries (with the exception of Kiribati). Table 6 shows the KILM 1 data for the most recent year available. For the other three KILM indicators, figures are given for the most recent year available, except that for KILM 9 an earlier year has sometimes been taken when only limited data were available for a later year.
Each table presented here contains country data for only one year. Of course, since data are generally available in the KILM database over several years, it would also be instructive to study the patterns of change for each indicator, and contrast the experience of different countries. This can easily be done by using the information in the KILM 2001 publication or CD-ROM, or (for subscribers) by online interactive queries to the KILMnet database. The KILM 2001 package itself contains a detailed descriptive analysis, contrasting the employment experiences of different countries and regions around the world.
We conclude this brief report by presenting an extract of the data available on the web site of the National Statistics Office of the Philippines (and repeated also on the site of the Bureau of Labour and Employment Statistics). This data provide all the information required for calculating the different rates for KILM 9.
The Philippines web sites include a vast amount of labour force data, in easily accessible form (although some slight manual reorganisation of the layout was needed in order to present the data on this page). The data in Table 3 relate to October 2001, but similar information could be obtained from the web site for any quarter during the last five years. The table is good in that it has been presented in fairly simple fashion, with all numbers rounded to the nearest thousand. It also contains the key variables: age groupings (including separate groups for 15-19 and 20-24), sex, and labour force status (employed, unemployed, and not in labour force). The table from which this data were taken gave a further breakdown by locality (urban/rural), but the information is not included here.
Table 3 Data downloaded from the Philippines NSO web site
Household population 15 years old and over by employment status by age group and sex (October 2001) (Values are in thousands. Details may not add up to totals due to rounding) Philippines
Both sexes Male Female Age group Total In labour force Not in Total In labour force Not in Total In labour force Not in Emp- Unemp- labour Emp- Unemp- labour Emp- Unemp- labour loyed loyed force loyed loyed force loyed loyed force
Philippines 49,424 30,090 3,271 16,063 24,597 18,334 1,913 4,350 24,826 11,755 1,357 11,714
15 - 19 years 8,415 2,693 566 5,156 4,398 1,764 331 2,302 4,017 928 235 2,85320 - 24 years 6,579 3,676 924 1,979 3,485 2,332 484 670 3,094 1,345 440 1,31025 - 34 years 9,597 6,552 814 2,231 4,758 4,113 488 157 4,839 2,439 326 2,07335 - 44 years 9,296 7,074 387 1,835 4,570 4,270 233 66 4,726 2,804 153 1,76945 - 54 years 7,269 5,568 296 1,405 3,563 3,255 194 114 3,706 2,313 102 1,29155 - 64 years 4,475 3,030 172 1,272 2,136 1,722 118 296 2,339 1,309 54 97665 years+ 3,791 1,496 111 2,183 1,688 879 65 744 2,103 617 46 1,439Age unreported 2 - - 2 - - - - 2 - - 2Source: Table extracted from Philippines NSO web site, December 2001, www.census.gov.ph
Youth employment statistics in Asia and the Pacific: A review of Internet resources 10

We can then use the data from Table 3 to calculate all the indicators required for KILM 9. These are shown in Table 4. We have also shown the unemployment rates for people aged 25+ since these are needed for calculating KILM 9 (b) – the ratio of youth unemployment rate to adult unemployment rate. Countries should be encouraged to place on the Internet labour force data with sufficient detail, so that interested users can derive their own indicators.
Table 4 Calculation of indicators for KILM 9: Philippines example October 2001
KILM 9 (a) KILM 9 (b) KILM 9 ( c ) KILM 9 (d)
(Youth) unemployment rate Ratio of youth unemployment Share of youth unemployed Share of youth unemployed(%) rate to adult unemp. rate to total unemployed (%) to youth population (%)
Both sexes
Male Female Both sexes
Male Female Both sexes
Male Female Both sexes
Male Female
15-19 17.4 15.8 20.2 2.5 2.2 3.0 17.3 17.3 17.3 6.7 7.5 5.920-24 20.1 17.2 24.6 2.9 2.4 3.7 28.3 25.3 32.4 14.0 13.9 14.215-24 19.0 16.6 22.9 2.7 2.3 3.4 45.6 42.6 49.7 9.9 10.3 9.525+ 7.0 7.2 6.715+ 9.8 9.4 10.3
Source: Table 3
Finally, another point worth highlighting is the definitions of youth and adults. It has been suggested at the beginning that youth refer to those aged 15-24. However, this standard is by no means accepted in all countries. As can be seen from the comments in Annex 1, several countries use a different age grouping to define the term “youth.” Even if a country decides to use some other grouping for its own purposes, it should still be encouraged to present data for the 15-24 age grouping when publishing its results for the sake of international comparability.
Better still, the age group 15-24 should be broken into two groups, 15-19 and 20-24. Yet there is a difficulty with the expressions used for these two groups. The 15-19 group is referred to as “teenagers,” but it by no means comprises all teenagers, since teenagers younger than 15 years are omitted. The 20-24 group is referred to as “young adults,” but adults have previously been defined as those aged 25 and over. There appears to be a need to come up with better expressions that adequately describe the two groups without leading to confusion.
Youth employment statistics in Asia and the Pacific: A review of Internet resources 11

Table 5 KILM 1: Labour force participation rates for various age and sex groups in ILO-ROAP countries in 1995 * Per centages
Both sexes Male Female15+ 15-64 15-24 25-54 55-64 65+ 15+ 15-64 15-24 25-54 55-64 65+ 15+ 15-64 15-24 25-54 55-64 65+
Industrialized economies Australia 63.1 73.5 69.6 80.4 44.7 5.4 73.3 83.2 71.6 91.7 60.8 9.2 53.3 63.7 67.5 69.2 28.6 2.5Japan 63.4 71.5 47.6 81.4 66.2 24.5 77.6 84.5 48.0 97.5 84.8 37.3 50.0 58.4 47.2 65.2 48.5 15.6New Zealand 64.9 74.7 67.4 81.7 52.1 6.0 74.2 83.8 71.3 92.0 65.3 9.9 56.0 65.8 63.4 71.8 39.0 2.9
Eastern AsiaChina 79.8 85.4 79.1 92.9 55.3 18.1 85.6 90.1 78.4 97.9 72.7 30.1 73.7 80.3 79.9 87.5 36.6 7.8Korea, Rep. of 61.9 64.9 36.5 75.6 62.2 32.8 76.5 78.7 30.1 94.6 77.0 46.9 48.3 51.3 41.9 55.6 49.0 24.4Mongolia 78.4 81.6 68.9 91.5 68.5 30.0 84.3 86.9 72.6 97.0 81.6 38.5 72.6 76.3 65.1 86.1 55.9 23.6
South-central AsiaAfghanistan 67.4 68.8 59.7 75.1 65.0 39.2 86.4 87.7 73.1 96.6 88.8 58.8 47.4 48.9 45.5 52.2 40.5 20.8Bangladesh 76.9 78.6 66.8 86.2 79.3 48.7 87.3 88.9 74.1 97.8 93.8 62.1 65.9 67.7 59.1 74.0 62.9 33.1India 64.0 66.4 55.4 73.5 58.2 33.5 85.4 87.6 70.8 97.3 82.5 54.6 41.3 43.5 38.6 47.7 34.4 13.9
Nepal 71.3 72.6 65.7 77.3 69.4 51.7 86.4 87.7 75.1 96.1 86.7 66.6 56.5 57.8 56.0 59.8 50.6 36.7Pakistan 48.4 49.3 39.1 55.1 52.6 34.5 82.3 84.8 65.3 97.4 85.0 52.7 12.7 13.0 10.6 14.2 13.6 7.4Sri Lanka 54.9 58.9 43.2 68.8 43.8 20.1 74.8 78.7 51.6 94.1 63.6 37.6 35.8 39.4 34.9 44.0 25.3 6.0
South-eastern AsiaCambodia 84.7 87.5 76.8 94.0 75.0 31.8 87.1 89.1 73.8 97.6 81.0 40.8 82.6 86.2 79.8 90.9 71.4 26.5Indonesia 67.4 69.4 53.2 79.1 66.7 37.6 82.3 84.2 62.7 96.8 83.9 52.5 52.8 54.8 43.5 61.8 51.0 24.7Lao PDR 81.7 84.1 80.8 88.3 68.1 40.1 89.3 91.1 84.3 96.2 83.3 55.0 74.5 77.4 77.4 80.7 54.7 28.1
Malaysia 63.7 66.1 54.3 74.6 48.3 27.9 80.8 83.2 61.9 96.8 65.9 40.3 46.7 48.9 46.3 52.6 31.4 17.7Myanmar 77.0 78.9 71.2 84.0 75.9 49.9 88.4 89.7 79.6 96.1 88.1 67.9 66.0 68.3 62.5 72.3 64.7 34.8Philippines 65.6 67.3 50.1 77.0 70.7 43.0 82.1 83.8 60.6 97.7 89.4 58.5 49.0 50.7 38.4 57.1 52.9 29.7
Singapore 64.3 68.7 51.3 78.2 40.5 10.8 78.4 82.7 50.4 96.1 61.7 19.0 50.0 54.3 52.2 59.8 19.2 4.2Thailand 79.9 83.8 74.4 90.7 69.0 27.3 86.4 89.5 76.5 97.2 81.6 38.8 73.5 78.1 72.3 84.2 57.6 18.3Viet Nam 78.8 82.6 75.0 90.6 60.4 34.1 83.5 86.0 74.5 95.5 72.3 45.5 74.6 79.4 75.4 86.2 50.7 26.8
PacificFiji 57.1 58.9 49.7 65.8 47.9 27.3 82.3 84.5 67.1 95.8 75.1 45.9 31.4 32.8 31.3 35.3 21.3 9.9Papua New Guinea 77.3 79.1 68.4 87.2 69.4 40.8 86.9 88.7 78.2 96.8 77.0 47.8 66.9 68.7 57.8 76.6 61.7 34.2Solomon Islands 85.6 87.1 81.2 92.1 80.3 59.3 89.1 90.2 82.8 96.5 81.7 65.7 82.2 83.7 79.4 87.4 79.0 53.0Kiribati
Middle EastIran, Islamic Rep. of 52.5 53.8 42.9 61.6 50.5 34.1 79.1 80.8 59.3 95.4 81.8 56.5 25.2 26.2 25.8 27.8 17.0 11.2Note: * Data are given for the year 1995 because that is the most recent year for which data are available for all countries (except Kiribati). Source: KILM 2001
Youth employment statistics in Asia and the Pacific: A review of Internet resources 12

Table 6 KILM 1: Labour force participation rates for various age and sex groups in ILO-ROAP countries in latest available year Per centages
Latest Both sexes Males Femalesyear 15+ 15-64 15-24 25-54 55-64 65+ 15+ 15-64 15-24 25-54 55-64 65+ 15+ 15-64 15-24 25-54 55-64 65+
Industrialized economies Australia 1999 62.5 72.9 68.4 79.6 46.9 5.7 72.0 82.1 70.8 90.0 61.7 9.2 53.2 63.6 65.9 69.2 31.7 2.9Japan 2000 62.4 72.5 47.0 81.9 66.5 22.6 76.4 85.2 47.4 97.1 84.1 34.1 49.3 59.6 46.6 66.5 49.7 14.4New Zealand 1999 65.3 75.2 63.3 82.1 59.9 7.1 73.6 83.2 66.9 91.1 71.6 10.8 57.5 67.4 59.6 73.5 48.4 4.2
Eastern AsiaChina 1995 79.8 85.4 79.1 92.9 55.3 18.1 85.6 90.1 78.4 97.9 72.7 30.1 73.7 80.3 79.9 87.5 36.6 7.8Korea, Rep. of 1999 60.5 63.9 31.3 74.7 60.5 33.3 74.4 77.3 26.5 92.3 74.9 44.2 47.4 50.7 35.4 56.6 47.4 26.1Mongolia 1998 59.2 62.0 52.8 73.6 24.6 1.4 63.5 66.2 56.4 76.0 39.7 1.9 55.2 58.1 49.4 71.3 10.8 1.2
South-central AsiaAfghanistan 1995 67.4 68.8 59.7 75.1 65.0 39.2 86.4 87.7 73.1 96.6 88.8 58.8 47.4 48.9 45.5 52.2 40.5 20.8Bangladesh 1996 72.6 73.7 62.6 79.5 71.4 52.2 88.8 89.8 72.0 98.3 92.7 71.2 55.9 57.2 53.3 60.6 45.5 27.1India 1995 64.0 66.4 55.4 73.5 58.2 33.5 85.4 87.6 70.8 97.3 82.5 54.6 41.3 43.5 38.6 47.7 34.4 13.9
Nepal 1998 85.9 88.4 81.5 93.0 84.4 53.3 90.1 92.1 83.1 97.2 92.2 66.3 81.9 85.0 80.1 89.2 76.1 39.9Pakistan 2000 49.9 50.8 40.2 56.9 55.1 36.8 82.4 84.6 65.2 97.0 85.8 53.2 15.2 15.4 14.1 16.1 16.2 11.9Sri Lanka 1999 57.3 61.9 47.3 69.5 54.2 22.8 77.5 82.4 58.9 94.3 79.7 39.4 37.6 41.6 35.0 46.1 28.9 7.2
South-eastern AsiaCambodia 1998 77.0 79.0 60.7 89.7 78.8 46.6 81.2 82.3 56.3 97.4 91.6 62.6 73.5 76.2 64.9 83.2 69.3 35.2Indonesia 1999 67.9 69.6 54.0 77.6 66.2 46.0 84.6 86.3 65.0 97.2 82.8 62.8 51.5 53.2 43.0 58.5 49.9 30.2Lao PDR 1995 81.7 84.1 80.8 88.3 68.1 40.1 89.3 91.1 84.3 96.2 83.3 55.0 74.5 77.4 77.4 80.7 54.7 28.1
Malaysia 1999 - 64.3 48.9 74.6 46.2 - - 82.8 58.0 97.6 67.8 - - 44.7 39.1 50.2 24.5 -Myanmar 1995 77.0 78.9 71.2 84.0 75.9 49.9 88.4 89.7 79.6 96.1 88.1 67.9 66.0 68.3 62.5 72.3 64.7 34.8Philippines 1999 65.8 67.9 49.1 77.9 71.3 40.8 81.8 83.8 60.2 97.2 88.1 54.5 50.0 51.8 36.8 59.0 55.8 29.8
Singapore 1998 63.9 69.0 44.2 79.8 43.3 10.7 77.5 82.7 42.5 96.8 64.8 18.7 51.3 56.3 45.8 64.0 22.8 4.4Thailand 1999 72.2 76.7 53.4 88.8 62.6 24.7 80.3 84.1 57.9 96.7 76.8 36.1 64.2 69.2 48.6 81.0 49.2 15.2Viet Nam 1995 78.8 82.6 75.0 90.6 60.4 34.1 83.5 86.0 74.5 95.5 72.3 45.5 74.6 79.4 75.4 86.2 50.7 26.8
PacificFiji 1995 57.1 58.9 49.7 65.8 47.9 27.3 82.3 84.5 67.1 95.8 75.1 45.9 31.4 32.8 31.3 35.3 21.3 9.9Papua New Guinea 1995 77.3 79.1 68.4 87.2 69.4 40.8 86.9 88.7 78.2 96.8 77.0 47.8 66.9 68.7 57.8 76.6 61.7 34.2Solomon Islands 1995 85.6 87.1 81.2 92.1 80.3 59.3 89.1 90.2 82.8 96.5 81.7 65.7 82.2 83.7 79.4 87.4 79.0 53.0Kiribati
Middle EastIran, Islamic Rep. of 1996 43.1 44.1 30.7 53.1 43.6 30.2 74.8 76.4 51.0 93.0 77.1 54.3 10.6 11.2 10.6 12.5 5.0 2.7
Source: KILM 2001
Youth employment statistics in Asia and the Pacific: A review of Internet resources 13

Table 7 KILM 2: Employment to population ratio by sex in ILO-ROAP countries in latest available year
Latest Age Employment to population ratioyear group Both sexes Male Female
Industrialized economies Australia 2000 15+ 59.4 67.4 51.6Japan 2000 15+ 59.5 72.7 47.1New Zealand 2000 15+ 61.4 69.1 54.2
Eastern AsiaChina 1995 15+ ? 75.6Korea, Rep. of 2000 15+ 58.0 70.1 46.6Mongolia 1998 15+ ? 55.9 60.3 51.8
South-central AsiaAfghanistanBangladesh 1996 10+ 63.2 76.2 49.5India
Nepal 1999 15+ 84.3 88.3 80.5Pakistan 1997 10+ 40.4 67.1 11.3Sri Lanka 1999 10+ 47.8 63.5 32.2
South-eastern AsiaCambodiaIndonesia 1997 15+ 64.4 81.4 48.1Lao PDR
Malaysia 1999 15-64 62.1 79.9 43.2Myanmar 1990 15+ ? 58.6Philippines 1999 15+ 59.6 74.0 45.4
Singapore 1998 15+ 61.8 75.1 49.6Thailand 2000 13+ 62.8 72.2 53.5Viet Nam 1995 15+ ? 74.3
PacificFijiPapua New GuineaSolomon IslandsKiribati
Middle EastIran, Islamic Rep. of
Source: KILM 2001
Youth employment statistics in Asia and the Pacific: A review of Internet resources 14

Table 8 KILM 8: Male and female unemployment rates in ILO-ROAP countries (and ILO-comparable unemployment rates by age group) in latest available year
Unemployment rate (KILM 8a) ILO-comparable unemployment rate (KILM 8b)Both sexes Male Female
Year Age group Both sexes Male Female Year 15+ 15-24 25-54 55+ 15+ 15-24 25-54 55+ 15+ 15-24 25-54 55+Industrialized economies
Australia 1999 15+ 7.0 7.2 6.7 1998 7.9 15.0 6.2 5.7 8.1 15.7 6.4 6.4 7.7 14.3 6.0 4.4Japan 2000 15+ 4.8 5.0 4.5 2000 4.7 9.2 4.0 4.5 4.9 10.4 3.9 5.6 4.5 7.9 4.3 2.8New Zealand 2000 15+ 6.0 6.1 5.8 2000 5.9 13.2 4.5 4.0 6.0 14.1 4.3 4.6 5.7 12.1 4.6 2.1
Eastern AsiaChina (urban areas) 2000 16-25 3.1 - -Korea, Rep. of 1999 15+ 6.3 7.1 5.1Mongolia 1998 ? 5.7 5.2 6.3
South-central AsiaAfghanistanBangladesh 1996 10+ 2.5 2.7 2.3India 1999 14+ - - -
Nepal 1999 15+ 1.1 1.5 0.7Pakistan 2000 10+ 5.9 4.2 14.9Sri Lanka 1998 10+ 10.6 7.1 16.2
South-eastern AsiaCambodiaIndonesia 1996 10+ 4.0 3.3 5.1 1998Lao PDR
Malaysia 2000 15-64 3 - -Myanmar 1999 18+ - - -Philippines 2000 15+ 10.1 10.3 9.9 1998 7.7 15.7 5.4 5.3 7.3 13.6 5.4 5.6 8.3 19.3 5.3 4.8
Singapore 1999 15+ 4.6 4.5 4.6 1998 3.4 6.4 3.0 2.3 3.5 5.3 3.4 2.4 3.2 7.2 2.5 2.0Thailand 2000 13+ 3.0 3.0 3.0Viet Nam
PacificFiji 1995 15+ 5.4 - -Papua New GuineaSolomon IslandsKiribati
Middle EastIran, Islamic Rep. of
Source: KILM 2001
Youth employment statistics in Asia and the Pacific: A review of Internet resources 15
Table 9 KILM 9: Various measures of male and female youth unemployment in ILO-ROAP countries in latest available year since 1995
Youth unemployment rate (%) Ratio of youth unemployment rate to adult unemp. rate
Share of youth unemployed to total unemployed (%)
Share of youth unemployed to youth population (%)
Year Both sexes Male Female Both sexes Male Female Both sexes Male Female Both sexes Male FemaleIndustrialized economies
Australia 1999 13.5 14.7 12.0 2.5 2.7 2.3 37.8 37.2 38.6 9.2 10.4 7.9Japan 2000 9.2 10.4 7.9 2.2 2.4 2.0 21.7 20.6 23.4 4.3 4.9 3.7New Zealand 1999 13.7 14.6 12.8 2.6 2.7 2.5 35.9 36.1 35.6 8.7 9.7 7.6
Eastern AsiaChina 2000 3.1 - -Korea, Rep. of 1999 14.2 17.9 11.9 2.6 2.8 3.1 22.3 16.3 34.7 4.4 4.7 4.2Mongolia
South-central AsiaAfghanistanBangladeshIndia 1997 52.9 52.9 52.9
NepalPakistan 1995 8.9 7.6 18.1 2.4 3.2 1.4 46.2 52.8 34.2 3.5 4.9 1.9Sri Lanka 1998 28.2 24.6 33.6 7.1 9.2 5.3 69.6 73.3 66.0 13.8 14.1 13.6
South-eastern AsiaCambodiaIndonesia 1996 13.4 12.2 15.0 74.8 77.0 72.5 6.9 7.5 6.4Lao PDR
MalaysiaMyanmarPhilippines 1997 15.7 14.1 18.5 2.8 2.6 3.3 45.4 43.9 47.5 7.6 8.6 6.7
Singapore 1998 7.1 5.6 8.4 2.6 1.9 3.5 27.3 17.7 40.1 3.1 2.4 3.9Thailand 1998 7.4 8.2 6.5 3.1 3.7 2.4 42.9 47.9 36.8 4.2 5.1 3.3Viet Nam
PacificFijiPapua New GuineaSolomon IslandsKiribati
Middle EastIran, Islamic Rep. ofNote: In a few cases an earlier year has been taken if more data are available. For detailed notes, see KILM database.Source: KILM 2001
Youth employment statistics in Asia and the Pacific: A review of Internet resources 16

Annex 1
Comments on web sites containing data or relevant information for ILO-ROAP countries
(The countries are listed in alphabetical order. Only sites with English content are considered. The Internet is constantly evolving, with web sites coming and going. This review was carried out during November – December 2001. Information is given on sites that are relevant to statistics on youth employment, and on other sites that may be relevant to labour statistics in general.)
AFGHANISTAN No information
AUSTRALIA
Australian Bureau of Statistics(ABS): www.abs.gov.au
The ABS has an extensive site of statistical information. It is particularly strong on the methodological side, with considerable background information being provided about various statistical collections. Employment data come from the LFS component of the Monthly Population Survey. The statistics are very current: for instance, LFS figures for October 2001 were available on the site on 8 November 2001. A detailed breakdown of the figures by age and sex is not given (it would be necessary to subscribe in order to have access to that data), but some age-sex information (for instance, for the labour force participation rate) is given in the form of charts.
Of particular interest is the tree-like presentation used in portraying the conceptual frameworks for various statistics. For example, according to a conceptual framework note prepared in February 2001, the estimate of total persons aged 15-69 (13,413,900) is broken down according to each person's labour force activity over the previous 12 months. The tree diagram shows that the 7,410,400 people who were in the labour force for the whole year consist of: 6,561,500 people who worked the whole year; 660,700 who worked for part of the year and who looked for work throughout the time that they were not working; and 188,300 people who did not work during the year but who looked for work throughout the year. Another tree diagram provides a detailed breakdown of the civilian population into those in the labour force (the employed and unemployed) and those not in the labour force. Those not in the labour force are further classified according to the reasons why they are not working and their desire for work. The preparation of similar tables for young males and females in various age groups would help to shed light on the employment experience of youth.
The LFS now uses a rotating sample design, with one-eighth of the sample being replaced each month. The first interview with a selected household is conducted face-to-face, while subsequent LFS data is collected by means of telephone interviews (if this is acceptable to the respondent). Initially this new approach led to slight under-estimates of employment when compared with the old approach, but the estimates from the two methods have now come into line.
Department of Employment and Workplace Relations (DEWRSB): www.dewrsb.gov.au
This site provides current statistics – based on ABS data – on the main labour market aggregates for each of the 19 DEWRSB regions, as well as for 1,300 local statistical areas across Australia. (The Office of Small Business was originally part of this Department – hence the final ‘sb’
Youth employment statistics in Asia and the Pacific: A review of Internet resources 17

in the initials of the Department – but under the latest reorganisation of government ministries, that Office has been reassigned to the Department of Industry, Tourism and Resources.)
The web site also describes the Work for the Dole scheme, which is one approach adopted by Australia to deal with youth unemployment. According to the web site, Work for the Dole is one of the many activities which unemployed people can choose to satisfy their mutual obligation by participating in activities that provide or improve facilities available to their communities:
The principle of mutual obligation imposes obligations on eligible job seekers for receipt of unemployment allowances to encourage them to look for work more actively and to take part in activities which improve their skills and work habits. It aims to move those dependent on unemployment benefits from welfare to work.
Job seekers may be required to participate in Work for the Dole if they are on the full rate of payment at time of commencement on a Work for the Dole project/activity, for 6 months in each 12 month period and are:
18-19 year old Year 12 school leavers who have been receiving Youth Allowance as a job seeker for three months; 18-24 year old job seekers who have been receiving Youth or Newstart Allowance for six months or more; and 25-34 year old job seekers who have been receiving Newstart Allowance for six months or more.
In addition, people who are 18 years old or more and receiving the full rate of Youth or Newstart Allowance and have been receiving unemployment payments for six months or more, may volunteer to participate in Work for the Dole.
Work for the Dole funding assists community based and government organisations to provide projects/activities that are of value to the community. Work for the Dole places are located primarily in areas of high unemployment, with an emphasis on outer metropolitan, rural and regional areas.
An expansion of Work for the Dole was announced in the May 1999 budget, from 25,000 places in 1998-99 to 50,000 places in 2000-2001."
The Work for the Dole scheme can also be accessed directly through www.workplace.gov.au/assistance.asp.
Department of Education, Science and Training (DEST): www.dest.gov.au
Following the ministerial changes announced by the Prime Minister on 23 November 2001, this Department now takes over most of the functions of the old Department of Education, Training and Youth Affairs ( www.detya.gov.au ). The Youth Affairs function, however, will be transferred to the Department for Family and Community Affairs ( www.facs.gov.au ). In the meantime, information about youth affairs is being maintained on the old web site, and there is a special named link to Youth web sites. The site also contains the DETYA Annual Report for 2000-01, including information on the work of its Training and Youth Division. This Division focuses on the creation of a more skilled workforce, the fostering of opportunities for apprenticeships and vocational preparation, the promotion of positive perceptions of young people, and the provision of national leadership on youth issues. There is also information about the Job Placement, Employment and Training Programme, which is aimed at assisting students and unemployed young people aged 15 to 21 years (with priority given to those aged 15 to 19) who are homeless or at risk of becoming homeless. BANGLADESH
Bangladesh Bureau of Statistics (BBS): www.bbstats.org
Bangladesh has a centralised statistical system, and BBS comes under the Ministry of Planning, with the Secretary of the Statistics Division in the Ministry being also the Director General of BBS. The web site is still under construction, and attempts to follow some of the branches shown on the site will lead straight into construction activities. Some additional useful information can be obtained by entering www.bbstats.org/datacentre/aboutbbs.htm, etc. by hand. The detailed list of publications
Youth employment statistics in Asia and the Pacific: A review of Internet resources 18

indicates that BBS produces a monthly statistical bulletin. There is also mention of a Statistical Yearbook 1999, as well as CD-ROM version of a Statistical Pocketbook for 1999. There is also a report on the Labour Force Survey carried out in Bangladesh 1995-96, and an associated report on the National Sample Survey of Child Labour of the same date. Further details can be obtained from [email protected].
The National Data Bank, also under the Statistics Division, is at www.bangladeshgov.org/mop/ndb/index.htm. The site is still under development but a 1998 Brochure contains some limited labour data: figures for five years (1993-1997) on the total labour force, labour force growth rate, the size of the employed population, and the number in public sector employment. There is also a Data Sheet for 1999 with section 5 labelled Labour Force. It contains rather dated information on the size of the civilian labour force, activity rates, employed persons by industry, and the extent of child labour among boys and girls, with most of the data coming from the 1995-96 Labour Force Survey.
The Ministry of Labour and Employment does not appear to have a web site.
CAMBODIA
National Institute of Statistics (NIS): www.nis.gov.kh
The NIS is located in the Ministry of Planning, along with the General Directorate of Planning. Cambodia operates a decentralised system of statistics, with similar planning and statistics departments in the various ministries, as well as planning and statistics units in each province and district. The web site has been designed with assistance from UNFPA. The web site displays key results from the 1998 population census (with an effective date of 3 March). In 1998 the population was 11.4 million, compared with 5.7 million at the time of the last official census in 1962. The web site shows the per centage distribution by 5-year age groups (but not the actual figures) for males and females in urban and rural areas. It shows, for instance, that for the total population, 11.8 per cent were aged 15-19 and 6.5 per cent were aged 20-24. For males the corresponding per centages are 12.1 and 6.4 per cent, while for females they are 11.5 and 6.6 per cent. The labour force participation rates for both sexes, and for males and females are given as 55.5, 56.5 and 54.6 per cent respectively, although the age group is not stated. A graph is also given showing the LFPR for different age groups, although it seems likely that the ages shown on the x-axis are not correctly aligned. During the main working years the male LFPR approaches 100 per cent, while the female LFPR is over 80 per cent.
Details of various census publications, available in CD-ROM or in printed form, are given on the web site, and these may be ordered directly over the Internet. For instance, among the printed publications are the following, each costing $5: Labour Force and Employment (report 3); Women in Cambodia (report 6); and Literacy and Education (report 8). The following four CD-ROMs are available, each costing $15: Priority Tables (11,000 tables in all); Village database; Mapping and Graphing Database, using the POPMAP application software; and Population Database, providing small area statistics, with access being through the REDATAM database engine.
Youth employment statistics in Asia and the Pacific: A review of Internet resources 19

Ministry of Education, Youth and Sport: www.moeys.gov.kh
One part of this site has a section dealing with education reform, and includes information on gender disparities in education. Another section concerns Information Resources and Archive, including a copy of a national yearbook (Education Statistics and Indicators 1998/99) which can be downloaded.
Ministry of Social Affairs, Labour, Vocational Training and Youth Rehabilitation (MOSALVY)
This ministry does not have a web site. Regarding the lack of information on Cambodia in Table A3 of KILM 2001 (reproduced here as Annex 2), the following comment found on the site of Asia Times Online ( www.atimes.com/reports/BI26Ai01.html ) is relevant. In its country report for Cambodia dated 26 September 2000, it reports: “There is no public safety net for workers in Cambodia. MOSALVY has drafted legislation to create a national pension, and unemployment insurance scheme, and a workers compensation scheme, but that is as far as it has gone.”
The official web site of the Cambodian Government is located at www.ocm.gov.kh/masterpage.htm.
CHINA
National Bureau of Statistics (NBS): www.stats.gov.cn/english/index.html
What was formerly called the State Statistical Bureau (SSB) has now been renamed the National Bureau of Statistics (NBS). Its web site is known as the China Statistical Information Network, and provides a considerable amount of data on China, including the full Statistical Yearbook 1999 as well as some of the Yearbook for 1998. There is also a section headed Indicators which in fact provides explanatory notes on all the terms used in the Yearbooks. The 1999 Yearbook contains some 33 tables on the topic of employment and wages. The table headings are somewhat misleading, but the tables of most interest appear to show the following:
Table 5-2 provides a time series of the total economically active population and the number of employed persons. There are data for some years as far back as 1952, and with data for every year since 1985. The economically active population is shown to have increased from 501 million in 1985 to 714 million in 1998, while the number of employed persons has increased from 499 million to 700 million over the same period. The Statistical Communiqué on National Economic and Social Development, which is provided on the NBS web site, reports that total employment increased to 705.86 million by the end of 1999 and to 711.50 million by the end of 2000. Out of these totals, urban employment was 210.74 million at the end of 1999 and 212.74 million at the end of 2000. Table 5-29 shows the per centage distribution of the employed population by educational level, separately for each male and female 5-year age group. It is not stated which year the data refer to but it seems reasonable to assume that it is 1998, since that is the latest year shown in Table 5-2.
Table 5-30, 5-31, 5-32 and 5-33 all provide information about the urban unemployed, separately for males and females. The urban unemployed are presumably the “registered urban unemployed,” who are defined as "persons who are registered as permanent residents in the urban areas engaged in non-agricultural activities, aged within the range of working age, capable to labour, unemployed but desirous to be employed and have been registered at the local employment service agencies to apply for a job.” Tables 5-30 and 5-31 (like Table 5-29) show information separately for each 5-year age group. Table 5-30 shows the per centage distribution of each group of urban unemployed persons by educational level (illiterate and semi-illiterate, primary school, junior
Youth employment statistics in Asia and the Pacific: A review of Internet resources 20

secondary school, senior secondary school, and college and higher level). Table 5.32 shows, for each educational level, the distribution of the unemployed by reason for being unemployed (laid off, job-off after graduated, work unit bankruptcy, resigned or dismissed, and other reasons). Table 5.33 shows the same information, but with the per centages being shown in the other direction (i.e. the educational level of the urban unemployed, in each category of unemployment). From an examination of the numbers shown in Table 5.32, it is clear (as indicated in its title) that Table 5.31 is supposed to show the distribution of the urban unemployed within each age group, according to their reason for being unemployed, but unfortunately the wrong captions have been used. The captions at the top of the table should be those of Table 5-32, instead of those of Table 5-30.
A paper prepared by Liu Fujiang of NBS for the OECD/ESCAP Workshop on Key Economic Indicators, held in Bangkok, 22-25 May 2000, provides some background information on the methodology used for labour force indicators in China. The paper is accessible through www.unescap.org/stat/. Three government departments collect data. The Department of Population, Social and Science Statistics in NBS operates a Comprehensive Labour Statistics Reporting System, and collects labour data through three surveys (a Sample Survey on Change of Population, an Urban Labour Force Survey, and a Rural Social and Economic Survey). The Ministry of Labour and Social Insurance (see below) has its own Statistical Reporting System, and collects data on the number of registered unemployed persons in urban areas. The State Administration for Industry and Commerce collects data on the number of persons employed in urban and rural private enterprises and the number of self-employed persons in industry and commerce. One important point to note is that an age cut-off point of 16 years (not 15) is used for defining the economically active population.
Ministry of Labour and Social Security (MOLSS): www.molss.gov.cn/english
This site is in English but is at present hardly developed at all. It does, however, provide a brief description of each of the 12 functional departments that make up the Ministry, and lists about a dozen institutions that are attached to the Ministry.
Ministry of Finance (MOF): www.mof.gov.cn/eng/index2.htm
This site contains some financial and economic statistics. A section headed “Indicators and data” includes one statistic of interest in the pre sent context: the registered unemployment rate in urban areas for each year from 1990 to 1998, with a figure of about 3 per cent being quoted for recent years. It is pointed out that unemployment here refers to those non-agricultural population within working age who are able and willing to work but who are unemployed and registered in the local employment services agencies. A link is provided to the NBS site.
FIJI
Fiji Islands Statistics Bureau (FISB): www.statsfiji.gov.fj
The Bureau of Statistics, which comes under the Ministry of Finance and National Planning, has been renamed the Fiji Islands Statistics Bureau (FISB). Its web site contains a variety of statistical information. Of particular interest are figures of the age and sex distribution of the population, taken from the 1996 population census. In 1996 there were 42,829 males and 40,853 females aged 15-19, and 34,444 males and 32,511 females aged 20-24. A total population of 775,077 (393,931 males and 381,146 females) was counted in the census. According to the Fiji in Profile data provided in the Economic Statistics section of the web site, the total labour force was 302.4 thousand in 1997 (203.2 thousand males and 99.2 thousand females). Corresponding (but provisional) figures for 1998 were 304.7, 204.8, and 99.9 thousand. The total number unemployed was 18.1 thousand in 1997 and 17.7 thousand in 1998, giving rates of unemployment of 5.9 and 5.4 per cent respectively.
Youth employment statistics in Asia and the Pacific: A review of Internet resources 21

Also of interest are the numbers of wage and salary earners for four years (1993, 1996, 1997, and 1998). A cautionary note warns that "due to low response rate, figures for 1991, 1992, 1994 and 1995 were not compiled.” It is also noted that wage earners figures relate solely to manual workers in regular wage earning employment in June each year. Self-employed persons such as farmers and fishermen or seasonal workers such as cane cutters are not included in these figures. Domestic servants are also excluded. We are informed that the totals are based on 100% coverage, and that they cover both private and public sectors regardless of their size.
Fiji Government web site: www.fiji.gov.fj
This official government web site notes that the Ministry of Labour, Industrial Relations and Productivity has a Research and Development Section which undertakes research studies, surveys and the collection of statistics relative to the national labour market needs of the Ministry. The web site records a decision made by Cabinet on 7 December 2001 to ratify five core ILO conventions (87, 100, 111, 138 and 182). The latter two conventions relate to Minimum Age and the Abolition of the Worst Forms of Child Labour. The Cabinet also decided to create a new Department of Poverty Eradication, to be set up within the existing Ministry of Women, Social Welfare and Poverty Alleviation (women.fiji.gov.fj).
The web site contains a page (www.fiji.gov.fj/ministries/youth_employment_sports.shtml) for the Ministry of Youth, Employment Opportunities and Sports. Within the area of youth employment, various training programmes have been introduced by the Ministry to help equip youth with skills for both paid – and self-employment. A new initiative is a Positive Mental Attitude (PMA) training programme aimed at inculcating values of achievement and success. Another programme is the National Youth Service, launched in 1993 as a new approach to rural and urban youth training. It is a second chance programme, catering particularly for unemployed young people who have not succeeded within the formal education system and who need additional training.
INDIA
There are several agencies involved in the collection of labour and employment statistics. These include: the Ministry of Labour and its affiliates such as the Labour Bureau and the Director General of Employment and Training; the National Sample Survey Organisation (NSSO); and the Registrar General and Census Commissioner. The Central Statistical Organisation (CSO) also collects data on employment through its Economic Census.
Registrar General and Census Commissioner: www.consusindia.net
The web site for the population census is at www.censusindia.net. The site gives some information on the provisional results of the 2001 Population Census. The census, involving two million enumerators, was conducted during the first week of March. One notable feature was that the provisional count was released on 26 March 2001 (i.e. less than three weeks after the fieldwork). A second notable feature was that the census produced a count in excess of one billion (1,027,015,247). In due course the census can be expected to provide data, at national and local area level, on the characteristics of the labour force, and on the classification of workers by industrial activity, occupation, and other demographic and social characteristics.
Central Statistical Organisation (CSO): various
There are several sites related to official statistics. The web site for the Ministry of Statistics and Programme Implementation is at www.nic.in/stat . There is an additional web site at
Youth employment statistics in Asia and the Pacific: A review of Internet resources 22

www.statisticsindia.gov.in/statsindia, which includes three reports of meetings of the Expert Group on Informal Sector statistics (Delhi Group). Among the items included on the CSO site is the latest Monthly Abstract of Statistics, which provides monthly data for the last three financial years, and annual figures wherever relevant for the last five years. The Abstract is heavily weighted towards financial and economic data (particularly those coming from the regular economic survey), but it does have some limited information on population and employment. The 1999 mid-year population estimate was shown as 98.7 crore (i.e. 987,000,000), but the population census web site (see below) gives a more up-to-date figure. The CSO site also gives details of survey data and publications from the National Sample Survey Organisation (NSSO) that can be purchased, in particular data and reports on employment and unemployment from their quinquennial surveys, the most recent of which being the 1999-2000 survey. (The NSSO is a unified agency under CSO. It came into being in 1950 and was then reorganised in 1970.) By far the most useful item on the CSO web site is the full Report of the National Statistical Commission, released in August 2001 (see below).
A paper by Dr. R.N. Pandey, Joint Director of CSO, on the status of employment and unemployment statistics in India, was presented at the OECD/ESCAP Workshop on Key Economic Indicators, Bangkok, 22-25 May 2000, and is available from the ESCAP web site. The paper identifies five main sources of employment-related data: the population census, the NSSO, EMIP (see below), Employment Exchanges (see below), and the Economic Census (see above). Included in the paper are some useful tables. Table 1 shows worker / population ratios by gender and by rural / urban for various years from 1951 to 1994, based on Census and NSSO data. Table 2 shows the work participation rates for males and females in 1991. Table 3 shows male and female unemployment rates (using NSSO data) in urban and rural areas for various age groups for various years from 1977 to 1997. However, the age groups shown are 5-14, 15-29, etc., so the rates for the youth group cannot be easily determined. Table 4 shows the number of job seekers registered with employment exchanges for various years between 1961 and 1998. At the end of 1998 the number on the live register was more than 400 lakhs (i.e. 40 million).
Ministry of Labour: labour.nic.in
Within this site, details can be found of two units attached to the Ministry. One of these is the Directorate General of Employment and Training (DGET). It has several functions, but three of them are relevant in the present context: ….
(d) to implement, regulate and increase the scope of training of apprentices under the Apprentices Act 1961;
(e) to organise vocational training programmes for women; and ….(i) to collect and disseminate information concerning employment and unemployment and
prescribe uniform reporting procedures.
Among DGET’s main activities are the running of two programmes: the National Employment Service (including the operation of employment exchanges) and the Employment Market Information Programme (EMIP).
The other is the Women Training Directorate, which is developing and implementing the National Vocational Training System (NVTS) and specifically trying to promote the participation of women in skill training. The site also contains estimates of literacy rates based on an analysis of a 1998 NSSO survey. It notes that the emphasis on girls and women is paying dividends, with the literacy rate for the group aged 7 and over rising from 52 per cent in 1991 to
Youth employment statistics in Asia and the Pacific: A review of Internet resources 23
62 per cent in 1997 and 64 per cent in 1998. It is expected that a sustainable threshold level of 75 per cent literacy will be achieved between 2005 and 2006.
The Ministry of Labour web site also has links to the site of the Labour Bureau (labourbureau.nic.in). The Labour Bureau was originally set up to compile the Consumer Price Index, but it now collects, compiles, analyses and disseminates data on labour in both organised and unorganised sectors. It receives data regularly from the States through statutory and voluntary returns made under different Labour Acts. It also collects data itself through other surveys such as its Annual Survey of Industries (ASI) and its Rural Labour Inquiry.
Ministry of Youth Affairs and Sports: yas.nic.in
The Ministry of Youth Affairs and Sports has been upgraded from the Department of Youth Affairs and Sports. It was set up with the objective of developing human potential in the field of youth and sports. Through its various programmes and schemes, the Ministry gives assistance, training and awards to organisations, sports persons and youth to motivate them to contribute towards national development. The Ministry consists of two bureaux, one for youth affairs and the other for sports. According to the Ministry’s annual report, “the size of the population treated as youth between the ages of 15 and 35 [sic] constitutes nearly a third of the total population of India.”
Report of the Statistical Commission: (see CSO web site)
This Commission, consisting of a chairman and 11 eminent statisticians/economists, was set up to examine critically the deficiencies of the present statistical system and to make recommendations, regarding suitable mechanisms for co-ordinating statistical activities, to review current statistical legislation and organisational structures, and to examine the need for a statistical audit. Section 9.4 of the report deals with labour and employment statistics.
The Report notes the fact that as recently as January 1999 a Study Group on Labour Statistics was set up under the Chairmanship of Professor L.K. Deshpande to review all aspects of the data collection of labour statistics by different ministries and departments. The Report of the Study Group includes a comprehensive review of the problems and existing data gaps in labour statistics and a set of recommendations. The Commission took note of these suggestions and views, in arriving at its own recommendations.
Section 9.4 of the Commission’s report describes the work of the various agencies involved in the collection of labour and employment statistics, and draws attention to the deficiencies in much of the data that is collected. For instance, data collected by the Labour Bureau is of poor quality due to the low response rates and the long time lag in submission of returns. Data from both the National Employment Exchanges and EMIP have serious shortcomings due to their limited coverage, poor response rates, and lack of timeliness. The population census is potentially a major source of information on employment. However, even that source of data is not without problems. Earlier censuses had been restrictive in what they counted as economic activity, but the 2001 Census has used a wider definition. A very broad definition of “worker” has been used as any person who has worked “any time at all” in the last 365 days in either market or non-market activities.
Timeliness has recently much improved in the case of the NSSO survey on employment and unemployment. For instance, the most recent survey was carried out between July 1999 and June 2000, and the results were released in December 2000. But even this survey suffers from some limitations. It is only carried out every five years, although some limited employment data are available from other surveys carried out each year by NSSO. The NSSO definition of work differs
Youth employment statistics in Asia and the Pacific: A review of Internet resources 24

from the ILO definition, in that the NSSO does not recognise processing of primary commodities for home consumption as economic activity. However, the definition is broader than that of the census and more internationally comparable. It also gives better estimates of the participation of women in economic activities. Also identifies the reasons why women out of the labour force are not able to take up economic work.
The Commission also notes that there are serious data gaps with regard to the prevalence of child labour in India, as well as inherent difficulties (in view of the legal situation) in trying to collect reliable data on the extent of bonded labour.
The Commission report comments on the current situation regarding ILO Convention Number 160, which lays down various standards for the labour statistics that a country is required to compile and report to the ILO. It notes that the earlier Study Group had analysed the current data gaps in relation to this Convention, and had made valuable suggestions for bridging those data gaps. The Commission recommends that the Labour Bureau should, in consultation with the Ministry of Labour, formulate a plan to meet the requirements of different conventions, with priority being given to Convention 160 and with a view to its ratification.
INDONESIA
Central Bureau of Statistics (BPS): www.bps.go.id
The BPS has an interesting site, although the Internet link appears to be rather slow. The site contains background information about BPS, news and events, official statistical releases, censuses in brief (including descriptions, abstracts and summaries of all censuses), abstracts and papers (including analysis, methodologies and research), list of publications, statistical glossary, statistical profile of the country and regions, and statistics by sector.
According to a BPS paper presented at the OECD/ESCAP Workshop on Key Economic Indicators, Bangkok, 22-25 May 2000 (see www.unescap.org/stat), labour force data are collected primarily through the national labour force survey (Sakernas). Similar data are also available from the national socio-economic surveys (Susenas), the population censuses, and the population intercensal surveys (Supas). All these sources of data have been using consistent concepts and definitions since 1976, but there are variations in sample design and time reference periods used. The BPS paper defines the main employment concepts that apply in the labour force and other surveys. In fact, in the LFS data are collected from all household members aged 10 years and over, although the final data are presented only for those aged 15 years and over. The LFS used to be conducted on a quarterly basis, so as to obtain estimates of the seasonal effects, but since 1994 the survey has been considered as being an annual survey, since the sample was too small to measure significant changes between quarters.
Details of the censuses and surveys relevant to employment statistics are given on the BPS web site. At present Sakernas has a sample size of almost 50,000 households. The most recent rounds of Susenas, on the other hand, have had sample sizes in excess of 200,000 households, so that estimates can be made at sub-provincial level. The web site includes four summary tables from Sakernas surveys for the four years 1997-2000 (including an interesting one on unemployment by level of educational attainment), but none of them show any employment details by age or sex. BPS issues quarterly and annual reports on the Sakernas results. Labour statistics from other departments are published annually. Some labour statistics are also available in the Statistical Yearbook and in the population census reports. The web site also includes a section of abstracts and papers, among which are at least
Youth employment statistics in Asia and the Pacific: A review of Internet resources 25
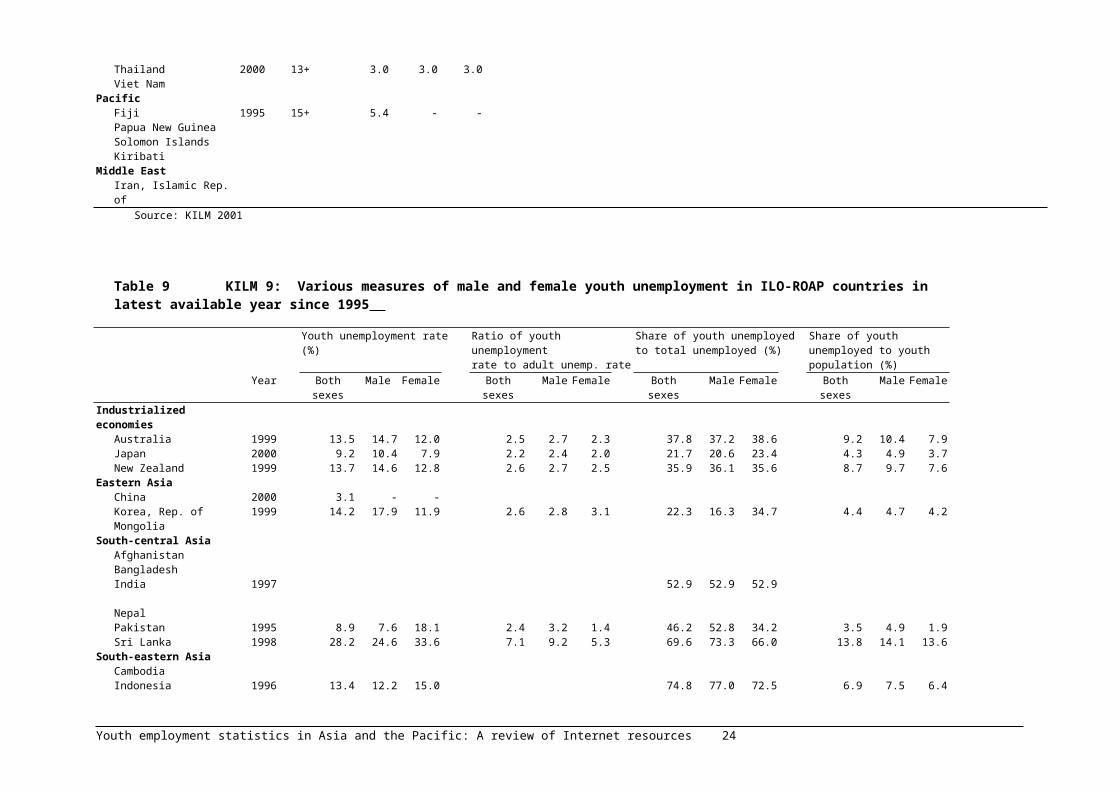
three of possible interest: Employment data in Indonesia: a review of existing sources; Selected issues in labour force statistics; and Measuring open unemployment in Sakernas.
The BPS paper mentioned above notes that employment data could be collected from administrative records at the Department of Manpower, but in that case the numbers shown as unemployed would be very small, since very few people register themselves as looking for a job. Employment data held by other departments or companies might also be examined, but often the definitions and concepts used are unclear. The paper comments on the problems in developing countries when attempts are made to follow the ILO recommendations. Since anyone who works at least one hour a week is considered employed, unemployment rates tend to be very low, while underemployment becomes very high.
National Development Planning Board (BAPPENAS): www.bappenas.go.id
This is an extensive site, which covers the full range of development activities undertaken by BAPPENAS. There is a section on employment, which includes full details of the concepts and definitions used for employment statistics. The various classifications (of age, occupation, etc.) are also shown. A few rather limited tables are also included on the site.
Department of Manpower and Transmigration: www.nakertrans.go.id
The most interesting item on this web site is the report of an ILO Employment Strategy Mission that visited Indonesia in April 1999. In paragraph 10 of the report there is a comment about youth unemployment:
Youth (15-24 years old), many of them recent school leavers and first-time job seekers, represent about two-thirds of the unemployed. Although youth unemployment is not a new problem in Indonesia, shrinking labour demand has exacerbated the problem and pushed the youth unemployment rate to over 17 per cent. The available measures for the youth unemployed (an entrepreneurship scheme for graduates and a self-employment programme for secondary school leavers) appear to be small in their scope. Therefore, there is need for low-cost programmes that speed up the transition from school to work and that reach more young persons.
On the subject of labour statistics, paragraph 15 notes that the national statistical system of Indonesia in the field of labour is relatively well developed, especially at BPS. The mission has two main suggestions for improvement to labour statistics: the need to develop appropriate statistical instruments for the accurate targeting of employment creation programmes, and for monitoring the geographical mobility of labour following the government’s decentralisation policy; and the need to fill the present gap in the area of informal sector statistics.
IRAN (ISLAMIC REPUBLIC OF) Statistical Centre of Iran (SCI): www.sci.or.ir
This excellent web site provides considerable statistical information about Iran. It has a listing of the 518 tables appearing in the Iran Statistical Yearbook for the year 1379 (Iranian calendar), i.e. March 2000 to March 2001, but not the actual tables. One section of the site gives A Glance at Iran. In the most recent population census (1996-97), the total population was 60,055,488, of whom 50.8 per cent were male. The 15-24 age group constituted 20.54 per cent of the population. In the population aged 6 and over (52,294,979), some 41,582,377 persons were recorded as literate, giving a literacy rate of 79.5 per cent. Of those who were literate, 54 per cent were males. A section of the web site headed Definitions and Concepts provides a detailed definition of the concept of literacy.
Youth employment statistics in Asia and the Pacific: A review of Internet resources 26
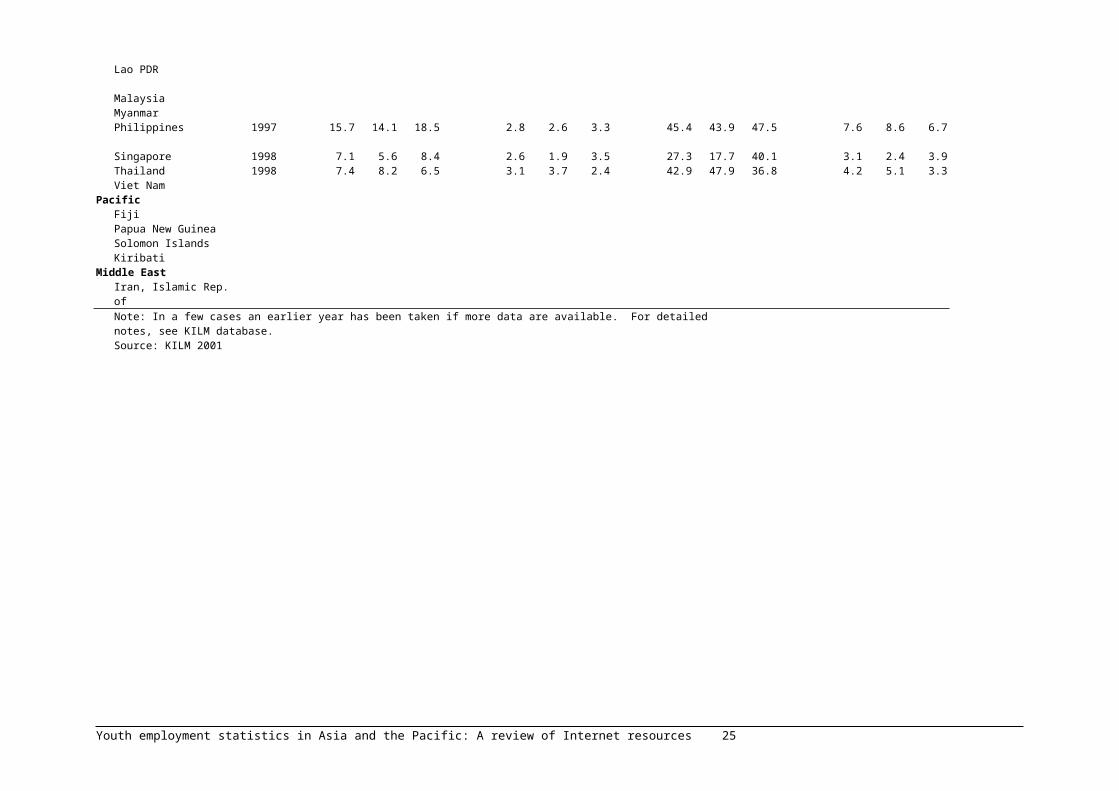
The site provides background information on SCI. Originally the statistical function was performed by the Department of Public Statistics under the Ministry of the Interior. In 1965 the office was renamed the Statistical Centre of Iran, and it was affiliated to the Plan and Budget Organisation. In 2000 the Plan and Budget Organisation merged with the State Organisation for Employment and Administration to form the Management and Planning Organisation. The head of SCI acts as Deputy Chief of the parent institution. SCI operates under a Statistical Act (revised in 1974) which sets out the functions and powers of the SCI.
A section of the web site gives an Introduction to SCI Projects. It lists all projects carried out in the last three years, including the name of the survey, type of enumeration, timing of survey implementation, and the coverage of the results. It can be seen, for instance, that an Employment and Unemployment Survey is carried out towards the end of each year, with sampling being performed across all provinces.
The section of the web site called Selected Statistical Information includes some data taken from the Yearbook. The median age of the population is given as follows: 1966 16.9, 1976 17.4, 1986 17.0, 1991 17.6, and 1996 19.4, although this latter figure looks a bit suspect. The total census population in the 1996-97 census (see above) was made up of 30,515,159 males and 29,540,329 females. There is also substantial information about employment. The census gave a population of 45.401 million people aged 10 or more, of whom 14.572 million were employed and 1.456 million were unemployed. The remaining 28.822 million were not economically active. Over the last three years, the rate of unemployment has been around 13 per cent, with fractionally higher rates for females than for males.
Ministry of Labour and Social Affairs: www.irimlsa.org
There is an English icon button on the home page, but it does not seem to be linkable at the time of research.
JAPAN
Statistics Bureau and Statistics Center: www.stat.go.jp
The Statistics Bureau and the Statistics Center are under the Ministry of Public Management, Home Affairs, Posts and Telecommunications. The Statistics Bureau is responsible for co-ordinating the statistical activities of different ministries and agencies, and for producing basic statistics on the state of the nation by carrying out major censuses and sample surveys. It carries out two major censuses: the population census, and the census of establishments and enterprises. It also carries out regular surveys (e.g. the monthly Labour Force Survey and the monthly Family Income and Expenditure Survey) and produces other statistical series such as the current population estimates and the consumer price index.
The Statistics Center is responsible for tabulating the returns of the censuses and the surveys of not only the Statistics Bureau but also other ministries and agencies if so requested.
A monthly bulletin of statistics is available on the Internet; this monthly publication, which has been running continuously since 1947 now contains 4000 statistical series (monthly, quarterly and yearly), The current estimated population for December 2001 is shown as 127.27 million persons (62.21 million males and 65.06 million females). The bulletin contains quite a number of employment
Youth employment statistics in Asia and the Pacific: A review of Internet resources 27

tables for each of the last 12 months, and annual figures for the last seven years. The tables are in Excel format.
The web site provides detailed information about the monthly LFS, including the concepts and definitions used, the latest monthly results and yearly averages, as well as a schedule of release dates for the monthly results. The survey has been done regularly since 1946, and covers a sample of about 100,000 persons in some 40,000 households. Households complete a questionnaire, which is dropped off and later collected by the field staff. In addition to the LFS, two other surveys are carried out. One of these, a special supplement to the monthly LFS with a sample of similar size, is carried out twice a year and collects more detailed information. In 2001 the survey was carried out in February and August. The other, an employment status survey, is carried out once every five years on a much larger sample (430,000 households), and collects detailed information on topics such as income, second jobs, etc. The survey was last done in October 1997.
As an illustration of one site that provides detailed labour force information on youth, the latest figures available for Japan are shown below. One or two points should be noted about this table. On the web site each figure was given to the nearest 10,000 persons. For convenience of understanding we have preferred to present the data in terms of thousands, but it means that the final digit of these numbers is not significant. The original table on the web site actually goes into greater detail by age, splitting the data for teenagers up into two groups, those aged 15 to 17, and those aged 18 to 19. Those figures substantiate the trends apparent from the table below, with participation rates for “both sexes” increasing (6.5, 32.2, and 70.8 per cent) and unemployment rates falling (14.3, 11.3 and 9.2 per cent) across the three age groups.One rather worrying feature of this table is the fact that, in each age group, the LFPR in Japan is identical for males and females, which suggests that perhaps some standard ratios have been applied for males and females to obtain the estimates of population or labour force. It would have been more satisfactory if the LFPR had been generated internally, using just the survey data.
Labour force characteristics in Japan, October 2001, by age and sex
Both sexes Males Females
Japan, Oct 200115-19 20-24 15-24 15-19 20-24 15-24 15-19 20-24 15-24
Population ‘000 7340 8280 15620 3760 4240 8000 3580 4040 7620In the labour force ‘000 1250 5860 7110 640 3000 3640 610 2860 3470Employed ‘000 1110 5320 6430 560 2690 3250 540 2630 3170Unemployed ‘000 150 540 690 80 310 390 70 220 290Not in the labour force ‘000 6070 2410 8480 3120 1230 4350 2960 1180 4140LF status not known ‘000 10 10 20 10 10 20 10 0 10
LF participation rate % 17.0 70.8 45.5 17.0 70.8 45.5 17.0 70.8 45.5Unemployment rate % 12.0 9.2 9.7 12.5 10.3 10.7 11.5 7.7 8.4
Source: www.stat.go.jp 14 December 2001
The dissemination of data is not done by the Statistics Bureau itself. Instead, the Bureau works with various affiliate bodies. Printed reports on survey results for public release are provided by the Japan Statistical Association (www.jstat.or.jp/e-index.html). Computer-readable data on survey results are provided on CD-ROM, magnetic tape or floppy disk through the Statistical Information Institute for Consulting and Analysis (Sinfonica), but its web site (www.sinfonica.or.jp) is entirely in Japanese. Ministry of Health, Labour and Welfare: www.mhlw.go.jp/english/index.html
This Ministry was originally two separate Ministries, one for Labour and the other for Health and Welfare. The Ministry has a Statistics and Information Department attached directly to the
Youth employment statistics in Asia and the Pacific: A review of Internet resources 28
Minister’s Secretariat. This Department has five Divisions, one of which is the Employment Statistics Division. Under the banner Information base for the people and life, it is noted that the Department “plans, implements and analyses various surveys to support policy planning…” Under the banner Supports policy making by means of statistics it is noted that the Department “implements large-scale, nation-wide surveys concerning the population, households, welfare, and employment/wages of workers. These surveys, together with irregular special surveys, play a significant role in the process of policy making of the ministry. Furthermore, the huge amount of data is disclosed widely to the public…”
The main survey is a regular national survey, covering a sample of about 33,000 establishments with five or more regular employees. A similar survey at the prefectural level covers about 43,500 establishments with five or more regular employees. Small establishments with 1-4 regular employees are dealt with through a special establishment survey, which covers establishments in about 4,750 sample districts. The results of these surveys are posted on the web site within a month of the fieldwork.
Japan Institute of Labour (JIL): www.jil.go.jp
JIL is not a primary collector of labour data, but its site reproduces, often in more attractive and simplified form, much of the labour statistics prepared by the Statistics Bureau and Statistics Centre, and by the Ministry of Health, Labour and Welfare. For instance, JIL has tables showing the number in the labour force and the LFPR, as well as unemployment rates. The site also has the Japanese Working Life Profile 2001, which compares various indicators for Japan with those of the US, France, Germany, Italy and the UK.
KIRIBATI
Government site: www.tskl.net.ki/kiribati/Government/Ministries.htm
There seems to be an absence of Internet sites for the National Statistics Office, or for Ministries such as Finance and Economic Planning or Education Training and Technology. Some information is available from outside sources. The Asian Development Outlook 2001 report from the Asian Development Bank site (www.adb.org/Documents/Books/ADO/2001) states that
Underemployment and unemployment levels are high in Kiribati, especially among the younger age groups. Currently, less than 20 per cent – 8,600 people – of the working-age population are formally employed. Yet, in both the public and private sectors, many job openings remain unfilled because individuals with the appropriate training, education or experience cannot be found. In the short run, this could mean an increase in youth unemployment as the number of job seekers exceeds the number of new jobs created. Consequently, the Government has identified human resources development as one of the key platforms of the National Development Strategy…. Outer island development continues to be a priority for the Government, which pushes technical training as a way to help people in those areas and to encourage young people to remain on their home islands rather than seeking employment in already crowded urban areas.
In the context of youth development, an interesting site for Pacific island countries is that of the Pacific Youth Bureau (PYB) (www.spc.org.nc/youth). The PYB was formerly the Youth and Adult Education Programme of the Secretariat of the Pacific Community, and it is one of several programmes within the Socio-Economic Resources Division of SPC based at its headquarters in Noumea. The Bureau, headed by a Youth Development Adviser, was officially launched in June 1998 with the mandate of co-ordinating the implementation of the Pacific Youth Strategy 2005. The site notes that in Kiribati youth affairs are administered by the Ministry of the Environment and Social
Youth employment statistics in Asia and the Pacific: A review of Internet resources 29

Development. In connection with the problem of unemployment, one of the major objectives is to “increase and enhance employment and income-generating opportunities for young men and women on the basis of equal gender access.”
KOREA (REPUBLIC OF)
National Statistical Office (NSO) www.nso.go.kr/eng
The NSO web site contains information from the Korea labour force survey. The survey is done monthly and is called the Economically Active Population Survey. The sample size is 30,000 households. All persons aged 15 and over are included. In addition to the monthly and annual reports on the survey (the latter coming out in May each year), a summary of the monthly results is placed on the web site within three weeks of the fieldwork. One small point is interesting to note: whereas the results were always previously referred to as being from the Economically Active Population Survey, since August 2001 the notice on the web site has referred to the Labour Force Survey results (which brings Korea into line with the language used in most other countries). In November 2001 the national LFPR was 61.5 per cent and the unemployment rate was 3.5 per cent. The summary of the LFS results makes some reference to age groups, but no tables are given by age, and sex is not included as a variable in the summary at all.
The web site contains a useful listing of all censuses and surveys carried out by NSO, giving details of their frequency, and a brief methodological description for each one. The web site also contains a special database, known as KOSIS, but it appears one needs to be registered in order to access it. In the employment field, KOSIS contains details of the population aged 15 and over, the number of employed and unemployed persons, the inactive population, and participation and unemployment rates. The data are available on a monthly, quarterly and annual basis, from 1963 to the present time, disaggregated by gender and age.
Ministry of Labour: www.molab.go.kr
The Ministry of Labour produces press releases on unemployment trends from time to time. One section of its site is concerned with labour statistics, including annual labour force data since 1980 (for females as well as for the whole population aged 15 and over), and quarterly figures for 1999 and 2000. The NSO surveys are the source of the data.
Another Ministry of interest is the Ministry of Gender Equality, which has its own web site. Some parts of the website are in English (www.moge.go.kr/eng/index(eng).jsp). The Ministry of Finance and Economy also has a web site (www.mofe.go.kr/English/e_wa.html), which includes a useful list of government ministries and their web sites, but some of the links do not seem to work. The web site of the Ministry of Culture and Tourism (www.mct.go.kr/indexe.html) indicates that the Ministry has a Youth Bureau within its structure.
Korea Labour Institute: hs.kli.re.kr
The Korea Labour Institute, established in October 1998, is a government-sponsored research institute devoted to conducting policy-oriented research on a wide spectrum of labour issues in Korea. It incorporates an Unemployment Policy Monitoring Centre. With regard to unemployment policy, its functions include: formulation of policy measures for the highly educated jobless and unemployed youth, the monitoring of loan projects for the unemployed, supporting female family heads, and
Youth employment statistics in Asia and the Pacific: A review of Internet resources 30

supporting the disabled who are unemployed. The site contains extensive labour statistics for the years 1981-2000, including the following: major employment indicators (total and females), showing the working age population, the labour force, employed, unemployed, participation rates, and unemployment rates; graphs of male and female participation rates; employment by sector; employment by status; graphs on the number unemployed and the unemployment rate, and unemployment rate by education status (but without a sex breakdown); compensation; working hours; and women’s work. However, without access to Korean script, some of the tables are difficult or impossible to read.
The graphs showing participation rates by age group for 1990 and 2000 indicate that, for the 15-19 age group, male participation rates have remained unchanged at around 10 per cent, while female rates have fallen by about 5 points (from around 18 to 13). In the 20-24 age group, both male and female participation rates have fallen, the male rate from about 60 to less than 55, and the female rate from about 65 to about 60. For both sexes these rates are still about as high as for any other age group in Korea.
Korean Development Institute (KDI): idep.kdi.re.kr
KDI, in conjunction with other agencies, organised a one-day international conference on 3 December 1999 on the topic of the Eonomic Crisis and Restructuring in Korea, at which Nanak Kakwani and Hyun H. Son presented a paper on Long-term Trends and Economic Crisis in the Korean Social Sector. They noted that, because of the economic crisis, the unemployment rate for the 15-19 age group had “soared” from 10.8 per cent in 1997 to 20.7 per cent in 1998. They give the following annual figures for each year from 1990 to 1998: 9.2, 9.2, 10.2, 11.1, 9.3, 8.6, 7.5, 10.8, 20.7. They also note that there has been a steady fall in the LFPR for the same age group in recent years. The corresponding figures for LFPR are 14.6 (1990), 14.9, 14.5, 13.5, 12.9, 12.3, 11.1, 10.6 and 10.6 (1998), “indicating that the teenagers have been spending increasingly more time for their education, which in turn generates higher levels in the market”. They conclude that youth unemployment has become quite serious, and that this issue should be paid more careful attention by the government.
Korea Institute for Youth Development (KIYD): www.youthnet.re.kr/en/html/KIYD.htm
KIYD was established in 1989, in accordance with the Youth Development Law. It was then known as the Korea Institute for Youth and Children. In 1993, the institution was expanded and reorganised as KIYD under the Youth Basic Law. KIYD is a specialised research institution for the development of policies pertaining to young people, and it reports directly to the Office of the Prime Minister. Its main roles and duties include the analysis and evaluation of government-instituted youth development policies and research efforts. Also, KIYD supports and provides advice to youth-related programmes initiated by non-governmental organisations. Some ideas on the likely future direction of Korea’s youth policy can be gleaned from a paper by the former president of KIYD, Chung-Ok Choi. His paper, Project Implementation on Youth within APEC Framework: Experience of Korea, was presented at an APEC youth networking conference held in Bangkok in July 2000. The details are at www.inter.mua.go.th.
LAO PEOPLE'S DEMOCRATIC REPUBLIC
No relevant web sites have been found.
Youth employment statistics in Asia and the Pacific: A review of Internet resources 31

MALAYSIA
Department of Statistics: www.statistics.gov.my
The Department of Statistics comes under the Prime Minister’s Office. It has an interesting web site, which was deservedly named one of the “Best Government Web sites 2001.” (In the Interactive section there is an amusing area, which enables users to determine the day of the week on which they were born) The web site contains an organisation chart and a list of all survey activities and their frequencies. Also shown are details of all products, including types and listing of publications, latest releases, dates of release for publications, prices, and details of CD-ROMs. There is also a calendar of events, including information about the 2000 Population Census. The total population was 22.2 million (11.2 million males and 11.0 million females). Useful details are also included about meetings, workshops and visits made to or from the Department. From a statistical point of view, a particularly interesting part of the site is the summary of methodology (for instance on employment and unemployment) which is provided in accordance with the Special Data Dissemination Standard (SDDS) of the International Monetary Fund. For the topics covered, this area of the web site discusses key aspects of the data collections: coverage and periodicity, timeliness, access by the public, integrity, and quality. Also shown on the web site is the National Summary Data Page (including data on employment and unemployment) which is taken from the IMF Data Standards Bulletin Board (DSBB).
The web site contains some summary employment data. Annual figures are given for 1999 and 2000, and quarterly data for 2001. For instance, in the third quarter of 2001, the estimated total labour force was 9922.5 thousand, of whom 323.2 thousand were unemployed, giving an unemployment rate of 3.3 per cent. There is no breakdown of the overall figures by sex or age. The source of this data is the Labour Force Survey. According to information in the publications section, the report for 2000 is available, at a cost of 30 RM. The cover of the report is displayed on the site, along with a brief introduction. The 2001 LFS is conducted in four rounds, covering about 60,000 households. Further information on the methodology of the LFS is included in a paper presented at the OECD/ESCAP Workshop on Key Economic Indicators, held in Bangkok in May 2000 (www.unescap.org/stat/meet/keyindic/keyindic.htm).
Ministry of Human Resources: www1.jaring.my/ksm
Various departments come under the Ministry, such as the Manpower Department (see below), the Occupational Safety and Health Department, the National Vocational Training Council, and the Departments of Labour in each State. The Manpower Department (www.jtr.gov.my/bi) deals with issues such as job registrations, licensing of private employment agencies, and skills training. It also provides labour market information. The site includes some information on the number of vacancies reported and retrenchments in each State, but it cautions that “the figures represent only a portion of the vacancies in the labour market since it is not mandatory for employers to report vacancies to the Manpower Department.” The Labour Market Report also includes some key economic indicators, including male and female labour force participation rates for 1995-1999, but these are not broken down further by age group.
MONGOLIA
National Statistical Office (NSO): nso.mn
Youth employment statistics in Asia and the Pacific: A review of Internet resources 32
The web site of the Mongolia NSO has a new address. The site includes some aggregate data on the employment situation, but only a limited breakdown by age. According to the News section of the site, at the end of July 2001 the number of registered unemployed was 39.9 thousand, which represents an increase of 2 per cent compared with the same period a year earlier. The number of unemployed women was 21 thousand, which means that women represented 53 per cent of the total unemployed. The Monthly Bulletin for August 2001 provides a further breakdown by age. Out of the 39,953 registered unemployed (of whom 21,231 were females), some 10,661 (among them 5,960 females) were aged 16 to 24. According to the Census 2000 section, the total population of the country was 2,373.5 thousand, of whom 1,195.5 thousand were females.
From a section headed Mongolia in Figures we learn (perhaps based on the results of the 2000 Census) that the size of the economically active population in 2000 was 847.6 thousand, of whom 809.0 thousand were employed and 38.6 thousand were unemployed.
Mongolia Youth Development Centre (MYDC): www.mydc.org.mn
The Mongolia Youth Development Centre was established in 1997 as a non-governmental and non-profit organisation. It works to assist Mongolian youth to develop into active members of society by providing social, educational, cultural and physical activities. MYDC works in co-operation with the Mongolian government and other Mongolian NGOs, as well as with foreign government and non-governmental organisations for the welfare of children and youth. It focuses on three areas: youth volunteer work; youth and education; and youth at risk. As part of its work on youth and education, it aims to help vulnerable children and youth to obtain non-formal education, choose a future career and provide support to help them acquire a viable way of life.
Ministry of Foreign Affairs: extmin.mn
The Ministry of Foreign Affairs has a wide-ranging web-site. Under the topic Social Life, it notes
the most crucial issue of today’s young people is unemployment. Therefore, in order to decrease the unemployment rate of young people, we should conduct a government programme, firstly creating jobs by actively attracting domestic and foreign investment, and secondly sending young people as a labour force to work abroad. The issues of education and profession ought to be in the hub of social policy of young people.
The web site contains a very detailed statement of government policy for the future. In the area of economic policy, it is encouraging to note that the aims include to “strengthen the independent and impartial status of statistics and ensure transparency of information through improving the official statistics information system”.
MYANMAR
No relevant web sites have been found.
NEPAL
National Planning Commission (NPC): npc.gov.np:8080/index.jsp
The Central Bureau of Statistics does not have a web site, but some statistical information is included on the NPC site. The NPC is an advisory body responsible for the formulation of development plans and policies for Nepal under direction provided by the National Development
Youth employment statistics in Asia and the Pacific: A review of Internet resources 33
Council. The web site includes several important reports such as the Interim Poverty Reduction Strategy Paper (I-PRSP) and the Economic Survey. In due course the site will have the Statistical Yearbook of Nepal for 2001, but this part of the site was at the time of research under construction. Some detailed counts are provided from the 2001 Census, showing the number of households, males and females by district. The census gave an estimate of 23.2 million persons in Nepal in June 2001, with a population growth rate of 2.3 per cent per annum.
Chapter IV of the Economic Survey Report for the Fiscal Year 2000/2001 deals with employment. The site can also be accessed through the site of the Foreign Aid Co-ordination Division, Ministry of Finance. (www.facd.gov.np) (Paragraph 4.4)
increasing numbers of Nepalese youth are being attracted to foreign employment in recent years. As the return to their labour there is higher than the minimum wage in the domestic market and it does not demand high education, the foreign employment has positive impact absorption of semi-skilled and unskilled labour force of the country …. During the first eight months of this financial year, 25,840 Nepali workers left for foreign employment.
Employment Promotion Commission(EPC): www.rojgarayog.gov.np
The EPC was originally set up in 1996 and rejuvenated in 2000. Its objectives include “2.2: To arrange skill-oriented training for the unemployed youths by exploring new sectors of employment.” EPC has a Central Executive Committee that is chaired by the Vice-Chairman of NPC; its membership includes the Secretaries from the Ministry of Finance and the Ministry of Labour and Transport. Employment-related policies are set out in the Ninth Plan, covering the period 1997-2002. Paragraph 6.2 deals with labour force and employment promotion, and again refers to the issue of labour migration. The site also contains information about the Labour Act of 1991. According to the Labour Act, a “child” means a person who has not attained the age of 14. A “minor” means a person aged 14 to 18, and a “major” means a person aged 19 or over.
NEW ZEALAND Statistics New Zealand: www.stats.govt.nz
The web site gives some final results from the 2001 Population Census released on 17 December 2001. The usually resident population numbers 3,737,277. One interesting feature of the census results presented is that, in order to preserve confidentiality of cells containing only a small number of observations, all cells in the tables have been rounded to base 3. One section of the web site gives a Profile of New Zealand. Within this section, some statistics on the economy show the size of the male and female labour force and the corresponding unemployment rates. Another useful area is the Stats & Info section, which includes Labour & Education, where the latest quarterly results from the LFS are presented. From the detailed spreadsheets presented, it is possible to extract the information on youth employment as demonstrated below.
Labour force characteristics of the youth population in New Zealand
Age
Employed
‘000
Unemployed
‘000
Labour Force
‘000
Not in LF
‘000
Working age pop
‘000
Labour Force Participation Rate
%
Unemployment rate
%
All (15 +) 1817.6 97.1 1914.7 1005.5 2920.3 65.6 5.115-19 120.0 20.7 140.7 136.5 277.2 50.8 14.720-24 174.1 14.8 188.9 68.0 256.9 73.5 7.8Source: LFS, Statistics New Zealand
Youth employment statistics in Asia and the Pacific: A review of Internet resources 34

A detailed commentary is also provided each quarter, showing the trends over time. This tends to concentrate on summary measures, and there are very few data presented that are disaggregated by age or sex. Statistics New Zealand produces a publication entitled Labour Market Statistics. The eighth annual edition was published in 1998, bringing together a comprehensive range of tables about New Zealand’s labour market and employment situation. The web site presents only the first table from each chapter, so as to whet the reader’s appetite.
Within the Stats & Info section, a particularly relevant topic is Population, which includes a special section on Young New Zealanders. This has sub-sections dealing with the youth population (the 15-25 age group), families and households, education, employment and unemployment, income and income sources, and health. Within the employment and unemployment section, there are pages dealing with the following topics: more young people work part-time (i.e. less than 30 hours a week); main industries for young workers; young workers highest unemployed; and unemployment by ethnic group. In the case of unemployment and part-time working, the figures are presented separately for the 15-19 and 20-25 age groups. Department of Labour (DOL): www.dol.govt.nz
The Department of Labour delivers a range of services and provides policy advice in areas which are all linked to the development and integration of human capability. Its work covers topics such as employment relationships, workplace safety and health, community employment, immigration, labour market policy, and Maori liaison. The Labour Market Policy Group (LMPG) (www.lmpg.govt.nz) analyses labour market trends and advises government on key policy issues related to the labour market with a view to improving economic and social outcomes. The main statistical sources it uses include the household labour force survey and the quarterly employment survey and labour cost index from Statistics New Zealand. LMPG also produces a Labour Market Bulletin, which is a refereed journal (back issues are available on-line), as well as other occasional reports such as Labour Market Outlook. The site has links to the Ministry of Education and to Statistics New Zealand.
Department of Work and Income (DWI): www.winz.govt.nz
The Department of Work and Income was formed in 1998 to offer a single point of contact for New Zealanders needing work-search support, income support and in-work support. Its web site has a Statistics section. DWI “produce a wide range of demographic and other statistics relating to people who receive employment and/or income services.” Its main publication is its Quarterly Client Profile, which includes a profile and trends of registered job seekers, and of people receiving income support. Appendix 2 explains the differences between registered unemployment and official unemployment as estimated in the Household LFS.
Ministry of Education: www.minedu.govt.nz
The main item of interest on this web site can be found in the section headed Topical issues. The Government has initiated a Review of Youth Training and Training Opportunities. The review started in August 2001 and is due to be completed by February 2002. The background to this review is as follows. A Training Opportunities Programme (TOP) was established in 1993 to assist people with low qualifications or limited skills to gain recognised qualifications (or credit towards them), and to move into further education and training, or into employment. Up until 1998, TOP was administered by Skill New Zealand and funded through the Education Vote. In 1998 the funding arrangements were split, with almost two-thirds of the funding being transferred to the Vote of the Department of Work
Youth employment statistics in Asia and the Pacific: A review of Internet resources 35

and Income, so as to give DWI more flexibility in the disbursement of funds to their clients. This part of the Vote was known as Training Opportunities, and catered to those aged 18 and over. Just over a third of the Vote was retained under Education, was known as Youth Training, and catered to 16 to 17 year-olds. Skill New Zealand continues to administer both schemes.
As a first step in the review process, the review team submitted an Issues Paper in early October 2001, which is available on the web site. Appendix D contains some information on Demographic Trends. In a section on Youth Training, the team notes some of the results of the LFS, particularly with regard to those who might be eligible for Youth Training. In March 2001 there were about 42,400 15-19 year-olds who were not in school and who were either unemployed, or studying or not studying. It was reckoned that this figure included about 16,300 eligible Maoris. According to recent estimates by the Department of Labour, up to 20 per cent of 15-19 year-olds have low or no formal qualifications (two or fewer School Certificate passes). According to Ministry of Education figures, about 18 per cent of school leavers during the period 1995-2000 left school with no qualifications. In numerical terms, this means that out of the 53,000 people leaving secondary school each year, some 9,600 leave with no qualifications. But the figures are even higher for Maori students (37 per cent as against the national average of 18 per cent).
Ministry of Youth Affairs: www.youthaffairs.govt.nz
The Ministry of Youth Affairs provides government and other agencies with policy advice on young people and their future. It also aims to promote the direct participation of young people aged between 12 and 25 years in the social, educational, economic and cultural development of New Zealand, both locally and nationally. Its web site has a section on Facts and Stats. One section here deals with Young People in NZ: How do we earn a living ? It describes the distribution of young people in the labour force, using data from the 1996 census.
PAKISTAN
Federal Bureau of Statistics (FBS): www.statpak.gov.pk
This is the web site of the Statistics Division. There are three units in the Statistics Division: the Federal Bureau of Statistics (FBS), the Population Census Organisation (PCO), and the Agricultural Census Organisation (ACO). The FBS web site does not contain much in the way of statistics, but it does contain a 40-page report, showing the summary results and detailed tables from the 1996 preliminary report on the Child Labour Survey, which covered children aged 5-14. It also describes the various functions and activities of FBS, including the conduct of labour force surveys. A list of publications is also given.
Ministry of Labour, Manpower and Overseas Pakistanis: www.labour.gov.pk
The Ministry is mandated to perform functions broadly related to policy formulation regarding labour administration, manpower planning and employment promotion. The web site is www.labour.gov.pk . The web site prominently displays an online magazine The Future: News Magazine on Child Labour. Because under the Constitution labour and employment are on the Concurrent Legislative List, the Ministry functions in close co-ordination with the provincial governments. Thus, labour market information is collected by the ministry itself only from employment exchanges in the Northern Areas. There is no information specifically about youth employment, but a news item in the Islamabad News on 3 October 2001 (found at www.jang.com.pk/thenews) reported that “the Minister of Labour Omar Asghar Khan said the government is making efforts to increase the employment opportunities to absorb the youth in
Youth employment statistics in Asia and the Pacific: A review of Internet resources 36
productive pursuits.” (The main government web site at www.pak.gov.pk provides a listing of all government ministries.)
Ministry of Finance: www.finance.gov.pk
The Ministry of Finance has an excellent site. Included on the site is an Economic Survey report. Chapter 13 deals with Population, Labour Force and Employment. The estimated mid-year population in 2001 is 140.5 million. The total labour force is about 41.2 million. The LFPR is reported to be 29.4 per cent (based on the 1997/98 LFS), but this is a misleading figure since it is a “crude activity rate.” The true figure is the “refined activity rate,” which is 43.3 per cent. An important point to note is that in Pakistan “the employed labour force is defined as all persons of ten years of age and more who worked for at least one hour during the reference period and was either ‘paid employee’ or ‘self-employed’.” Detailed tables from the FBS labour force survey are provided on the web site. For instance, Table 12.3 provides the following information:
Age specific labour force participation rates for males and females, Pakistan, 1990/91 to 1999/2000
90/91 91/92 92/93 93/94 94/95 95/96 96/97 97/98 98/99 99/00
15-19 Male 55.2 53.3 53.1 52.3 51.1 51.1 52.9 52.4 52.4 52.4 Female 13.2 13.5 12.5 12.1 9.6 9.6 13.1 13.5 13.5 13.5
20-24 Male 87.7 84.8 83.9 84.9 85.5 85.5 85.0 84.9 84.9 84.9 Female 14.0 14.1 13.5 14.0 11.7 11.7 15.1 15.2 15.2 15.2
Source: LFS, Federal Bureau of Statistics.
Unfortunately no explanation is given as to why the age-sex specific LFPRs for these two age groups (and for every other age group) are identical in the two years 1994/95 and 1995/96, and in the three years 1997/98, 1998/99, and 1999/2000. It may mean that the labour force survey was not carried out every year.
PAPUA NEW GUINEA
National Statistical Office (NSO): www.nso.gov.pg
This web site gives considerable background information about the workings of the NSO but does not include any data. NSO’s most important recent activity was the conduct of a population census in mid-2000, but the NSO site does not yet display any preliminary census results.
Miscellaneous
The government gateway is at www.pngonline.gov.pg, but there appear to be very few web sites connected with government activities in PNG. A report on economic and development policies, presented by the Prime Minister on the occasion of the 2000 Budget, (www.treasury.gov.pg/treasury/…) contains the statement (page 6): “Of the total working population, only 14 per cent account for wage employment in PNG. Around 50,000 people enter the labour force each year.” Among the international agencies, even initial attempts to access the UNDP web site at www.undp.org.pg were to no avail, since the site appears to be dormant. There is, however, an alternative site at www.un.org.pg which is active. This site gives access to all the UN agencies in PNG. The site for UNFPA states in a special Challenges box at the top of its home page: “The major challenge in the foreseeable future is the increasing number of youths. Can the increasing numbers be absorbed into the economy while simultaneously improving the quality of life and maintaining environmental quality? How can the quality of PNG’s human resources (education, training, skills, health, motivation, etc.) be improved while the population continues to grow?”
Youth employment statistics in Asia and the Pacific: A review of Internet resources 37

The special web site of the Pacific Youth Bureau, based at SPC in Noumea, provides the following information on the position of youth in PNG (www.spc.org.nc/youth).
The National Executive Council (NEC) approved the National Youth Policy on 14 January 1997. It focuses on Integrated Human Development, and seeks to enlarge the choices which people have to improve their lives. These choices include the opportunity of access to income and employment…. The primary objectives (of the youth policy) are to encourage and provide avenues for young men and women at the local level to enter the work force in order to create and maintain a regular cash income. The National Youth Commission Act of 1999 replaces the Youth Service Act of 1991…. There is a problem of defining what is meant by young men and women. There are various definitions of youth that can be used as a basis of a policy. The previous national youth movement programme (NYMP) defined young men and women as persons between the ages of 12 and 25 years…. What a policy has to recognise is that young people are in a state of transition from one of dependence of childhood to the relative independence of responsible adulthood and citizenship. In this sense the State allows an 18 year-old certain legal rights and with it duties and obligations…. While there is no single definition of young men and women that would be approximated in the PNG context, the policy is directed to young people in the age range of 12 to 35 [sic] years. What is important to remember is that the discussion of the contemporary realities must be relevant to young people, and it must be applied in a particular way to the formation of youth policies and strategies.
PHILIPPINES
National Economic and Development Authority (NEDA): www.neda.gov.ph
NEDA is the country’s premier social and economic development planning and policy co-ordinating body. Among the six agencies that are attached to it are the National Statistical Co-ordination Board and the National Statistics Office (see below). The web site has links to the Philippines Statistical System, which covers all agencies involved in statistical work.
National Statistical Co-ordination Board (NSCB): www.nscb.gov.ph
NSCB was created in 1987. It is the country’s highest policy making and co-ordinating body on statistical matters. It aims to promote the independence, objectivity, integrity, relevance, and responsiveness of the Philippines Statistical System. It will achieve this through developing an orderly statistical system, capable of providing timely, accurate, relevant and useful data for the government and the public for planning and decision making. It has an excellent web site, with much methodological information and statistics. Its section Stat Watch gives various key pieces of statistical information such as the current unemployment and underemployment rates, compared with their values three months and a year ago. Stat Tables gives national accounts data at national and regional level, as well as some sectoral statistics. For instance, a mini-table on labour and employment shows the labour force, unemployment and underemployment rates for January 1999, January 2000, and January 2001. Stat Meter shows historical trends of key indicators. Under Macro Indicators, it has a graph showing the unemployment rate over a 10-year period, and identifies the highest, lowest and most recent values. There is the same mini-table that was mentioned above. There are also links to all the main publications involving labour and employment statistics: a report on Integrated Survey of Households, produced by the National Statistics Office (see below); and three other reports (Current Labour Statistics, Labour and Employment Statistics Report, and Yearbook of Labour Statistics), all produced by the Bureau of Labour and Employment Statistics (see below). Other useful sections are Active Stats, containing codes and classifications, as well as a statistical database (accessible by subscription), and a Data Release Calendar, showing the release dates for various publications.
National Statistics Office (NSO): www.census.gov.ph
NSO is the major statistical agency in the Philippines responsible for collecting, compiling, classifying, producing, publishing, and disseminating general-purpose statistics. Their web site is not
Youth employment statistics in Asia and the Pacific: A review of Internet resources 38

particularly attractive, but the labour entry in a box on the left leads one to what is what is probably the best collection of web-based labour and employment statistics in Asia and the Pacific. A set of 14 different tables are provided, containing data from the LFS, with data being available for each quarter over a five-year period. The table below shows what can be produced using data from just one table (the twelfth table in the list). Similar tables could be produced for every quarter over the last five years.
KILM 9 data for Oct 2001 developed from a table on the Philippines NSO web site, with youth split into two 5-year age groups
(Youth) unemployment rate Ratio of youth unemployment Share of youth unemployed Share of youth unemployed(%) rate to adult unemp. rate To total unemployed (%) to youth population (%)
Both sexes
Male Female Both sexes
Male Female Both sexes
Male Female Both sexes
Male Female
15-19 17.4 15.8 20.2 2.5 2.2 3.0 17.3 17.3 17.3 6.7 7.5 5.920-24 20.1 17.2 24.6 2.9 2.4 3.7 28.3 25.3 32.4 14.0 13.9 14.215-24 19.0 16.6 22.9 2.7 2.3 3.4 45.6 42.6 49.7 9.9 10.3 9.525+ 7.0 7.2 6.715+ 9.8 9.4 10.3
Source: LFS, Philippines NSO
The web site provides detailed technical notes about the LFS, and additional information on labour force indicators is available from a paper presented at the OECD/ESCAP Workshop on Key Economic Indicators, held in Bangkok, 22-25 May 2000 (www.unescap.org/stat/meet/keyindic/keyindic.htm). The LFS is conducted quarterly by NSO as part of the Integrated Survey of Households (ISH). The paper for the OECD/ESCAP workshop notes that some of the concepts currently used on the LFS do not conform to the ILO resolutions on the measurement of the labour force. It therefore suggests that there should be a study focusing on the operational definitions of “work for profit,” employment status of those absent from work for pay or self-employment, unemployment and the availability for work criterion, and underemployment and its various forms.
The paper also suggests that the coverage of LFS should be expanded to cover data items on child labour, informal sector, home-based workers, earnings, new entrants, multiple jobholders, and subcontractors.
Department of Labour and Employment (DOLE): www.dole.gov.ph
DOLE is mandated to formulate policies, implement programmes and serve as the policy co-ordinating arm of the executive branch in the field of labour and employment. The web site is updated daily. Two important bureaux inside DOLE are the Bureau of Labour and Employment Statistics (BLES) and the Bureau of Local Employment (BLE). The BLES home page is approached directly through the DOLE web site. BLES is responsible for formulating, developing and implementing plans and programmes on the labour statistical system, in order to provide government with timely, accurate and reliable data on labour and employment. It also conducts surveys, often through NSO. For instance, its quarterly Employment, Hours and Earnings Survey (EHES) is added on as a rider to NSO’s Quarterly Survey of Establishments. Its Occupational Wages Survey (OWS) monitors wages in 22 selected low-paid occupations in non-agricultural establishments, with the data collection being done by NSO. BLES maintains a databank on labour and employment statistics, including data collected from administrative sources. It is known as the Labour and Employment Integrated Statistical Information System (LEISIS). BLES produces a variety of publications, including the Yearbook of Labour Statistics, the Philippine Industry Yearbook of Labour Statistics, and Current Labour Statistics.
Youth employment statistics in Asia and the Pacific: A review of Internet resources 39

The BLES web site also makes available the same substantial set of LFS tables as are found on the NSO site.
The Bureau of Local Employment web site (www.ble.dole.gov.ph) can also be reached through the DOLE web site. BLE is responsible, among other things, for maintaining and developing a Labour Market Information System, as an aid to proper manpower and development planning. The most relevant part of the BLE site is the information about the various youth programmes run by BLE. These are grouped together under KABATAAN 2000, which is a year-round youth work programme. It aims to instill among youth a sense of awareness of the vision, policies and programmes set forth by the administration for the country and people. It provides youth, especially out-of-school youth, with alternatives which will instill the values of discipline, hard work, community work, etc.. It also provides training and financial assistance to support their educational and career development needs.
Three of the other programmes under the umbrella of KABATAAN 2000 are SPES, TULAY 2000, and WAP. SPES is the Special Programme for the Employment of Students, aimed at helping poor but deserving students to pursue their education by encouraging their employment during summer and/or Christmas vacations, through incentives granted to employers (who have to pay only 60 per cent of their salaries). It is targeted at students aged 15-25 who are in high school or doing vocational training. TULAY 2000 aims to assist with the integration of persons with disability into the mainstream of society. This initiative is in support of the ESCAP-promoted Decade of Disabled Persons 1993-2002, and in line with ILO Convention 159. WAP is the Work Appreciation Programme, which aims to provide youth with opportunities to be able to appreciate work and develop proper work ethics by exposing them to the actual work situation. It is targeted at 18-25 year-olds, who are unemployed, in or out of school. The students are employed for up to three months, with the employers paying 75 per cent of the prevailing minimum wage.
SINGAPORE
Singapore Statistics: www.singstat.gov.sg
The Department of Statistics comes under the Ministry of Trade and Industry. It has a comprehensive web site, including background information, as well as the following statistics: the latest monthly and quarterly figures together with an advance calendar of the dates of future statistical releases; key tables from the Monthly Digest of Statistics; the latest annual indicators; key tables from the 2000 Yearbook of Statistics (released each year in June); selected historical indicators back to the 1960s; Singapore in Brief; and Singapore in Figures.
Singapore conducted a census in 2000. The total population was only 1.6 million back in 1960, but is now 4.0 million. Youth constitute 13 per cent of the population. There are 211 thousand teenagers aged 15-19, and 215 thousand young adults aged 20-24.
It is interesting to note that the population censuses seem to give slightly higher LFPRs than are obtained from the LFS. This poses a problem for doing inter-year comparisons, because the LFS is usually not carried out in the year when there is a census. Comparing recent censuses, the LFPR has increased from 55 per cent in 1970 to 69 per cent in 2000, but this increase is entirely due to changes in the female LFPR. The male rate has remained static at 81 per cent, while the female rate has increased from 28 per cent in 1970 to 55 per cent in 2000.
There is a useful Advance data release 4 (19 Dec 2000) section, which discusses the economic characteristics of the Singapore resident population, concentrating on the changes between 1990 and
Youth employment statistics in Asia and the Pacific: A review of Internet resources 40

2000. It shows, with the use of a line graph, that when the LFPR is analysed by age, there has been an increase in male and female participation rates in all age groups except the youngest and the oldest age groups. It says: “There was a decline in participation rates for those aged 15-24 years and 65 years and over. Proportionately more male and female residents aged 15-24 years were schooling and hence fewer joined the labour market.”
There is a useful table showing unemployment rates by age and sex. Part of it is shown here.
Unemployment rates for male and female youth in Singapore, 1990, 1999 and 2000 Per cent
Both sexes Male Female . 1990 1999 2000 1990 1999 2000 1990 1999 2000
All those 15+ 2.0 4.9 6.0 2.2 4.7 5.6 1.6 5.2 6.6
Youth: 15-19 3.6 10.7 11.9 1.7 3.6 3.7 5.7 19.6 21.4 20-24 3.3 9.4 8.1 3.7 7.1 7.1 2.8 11.9 9.1 .Source: Singapore Statistics
In general, youth tend to have higher unemployment rates than older people, and this is particularly true of females.
Ministry of Manpower (MOM): www.gov.sg/mom
The Ministry of Manpower has a very modern style of web site. According to the site, MOM aims to “to provide Singapore with an integrated national manpower planning framework, policies and systems that will ensure a dynamic and effective labour market in the knowledge-based economy.” To this end, MOM “co-ordinates and spearheads national efforts to balance manpower demand with supply.”
As explained in the SingStat web site, the MOM has a Manpower Research and Statistics Department, which carries out two major quarterly surveys, designed to collect data for monitoring employment trends. These two surveys are the Labour Force Survey directed at households, and the Labour Market Survey directed at establishments. Detailed results from the LFS are available on the SingStat site. SOLOMON ISLANDS
The Statistics Office comes under the Ministry of Finance and does not have a web site. Labour issues are dealt with by the Labour Division in the Ministry of Commerce, Employment and Trade. Responsibility for women’s and youth development comes under the Ministry of Youth, Women, and Sports.
Ministry of Commerce, Employment and Trade: www.commerce.gov.sb
This appears to be the only government site of the Solomon Islands on the Internet. The Ministry is charged with the responsibility to promote and develop private sector investment and to foster the establishment of indigenous enterprises in the Solomon Islands. Its Labour Division operates under the Labour Act of 1982. This Division has the usual duties of a labour department (enforcing labour laws, dealing with labour relations, trade testing, occupational safety, etc.). It is also responsible for “…labour market data collection – employment and workplace surveys, job bank and data collection, and career and training information dissemination – a new area of active preparatory work and initial implementation.”
Youth employment statistics in Asia and the Pacific: A review of Internet resources 41

The web site also contains details of the Government’s Programme of Action arising from its Peace Plan 2000, following the recent unrest experienced in the country (…/Strategy/2000.htm). The Peace Plan describes the policies and objectives, and sets out the strategies and targets for the period 2000-2002. Details are given in respect of the work of each Ministry. For instance, the Ministry of Youth, Women and Sports has a Youth Division and a Women in Development Division. The Ministry’s policy objectives are, among others, “to ensure that youth and women receive appropriate training and acquire skills that enable them to play their role in the development of the country,” while the development strategies are “to create opportunities for school dropouts to engage in productive development and community work.”
The web site of the Pacific Youth Bureau at SPC (www.spc.org.nc/youth) notes that the Solomon Islands National Youth Policy defines young men and women as those in the age range 14-29 years. “However, special circumstances under and above this age range will be considered.” The National Youth Policy document states that young people continue to be disadvantaged in all sectors of society, including lack of employment opportunities.
Solomon Islands People First Network: www.peoplefirst.net.sb
This site was developed under a UNDP-UNOPS programme entitled SIDAPP (Solomon Islands Development Administration Planning Programme). The programme has direct relevance to the issue of youth employment. The aim of the programme was two-fold: (a) to strengthen the institutional capacity for social and economic planning and (b) to increase the quality and quantity of data available in relation to social planning. In an attempt to fill data gaps, the programme planned to commission one survey of youth unemployment and participation in informal economic activities, and another one on women in development, focusing in particular on issues of education and employment. A special project, entitled Monitoring and Planning for Vulnerable Groups (SOI/97/004), began in June 1998 and was due to finish by the end of 2001. The surveys were supposed to be carried out under that project. In the event this has so far proved impossible because of the recent unrest in the country. But it was still hoped that it might be possible to conduct the surveys in the latter half of 2001 before the project ended.
SRI LANKA
Department of Census and Statistics(DCS): www.lk/census and www.statistics.gov.lk
DCS is the central statistical agency in Sri Lanka and is responsible for the collection, compilation, analysis and dissemination of all statistical data needed for national planning. The web site www.lk/census contains several items of interest.
DCS produces a statistical abstract each year, summarising all the information compiled during the past five years.
The Statistical Abstract for 1998 is included on the web site, but it is noted that some tables in the Abstract do not include information for the Northern and Eastern provinces, because certain surveys cannot be carried out in these areas due to the unsettled situation. Section 4 of the Abstract deals with Labour and Employment. Table 4.1 and 4.1a provide detailed information on the labour force, with annual data provided for each of the four years 1993-1996, and with quarterly data given for 1997 and the first half of 1998. The following details are given for males and females: population aged 10 and over, total labour force, LFPR, employed, unemployed, and not in labour force.
Youth employment statistics in Asia and the Pacific: A review of Internet resources 42

A special section of the web site gives more up-to-date labour force data, up to as far as the third quarter of 1999. Some of the data are classified by age. For instance, the LFPR for the 15-19 age group is given as 28.9 per cent (35.8 for males and 21.2 for females), while the LFPR for the 20-24 group is given as 69.1 per cent (87.1 for males and 50.6 for females). An attempt has been made on the web site to provide equivalent unemployment rates, but unfortunately the LFPR rates have been repeated again. The accompanying graph suggests that the unemployment rates are about 32 per cent for males and 34 per cent for females in the 15-19 age group, and about 23 per cent for males and 27 per cent for females in the 20-24 group. A bar chart illustrates the fact that youth constitute a very large proportion of the unemployed. More than 60 per cent of unemployed males, and more than 50 per cent of unemployed females fall in the 15-24 age group. For males, about 29 per cent of the unemployed are aged 15-19, and another 43 per cent are aged 20-24. For females, about 19 per cent are aged 15-19, and another 33 per cent are aged 20-24.
There is extensive information on the Child Activity Survey 1999, which was undertaken with ILO/IPEC support. The survey covered 14,400 households in Sri Lanka (but excluding the Northern and Eastern provinces) and focused on the economic activities of those aged 5 to 17. The following were counted as “working children”: those who were paid employees, those who were self-employed on own account, and those who did work in the family enterprise without payment (unpaid family workers), but excluding housekeeping activities. It was estimated that, out of 4.3 million children aged 5 to 17, some 21 per cent (or almost a million) were engaged in some form of economic activity. In two-thirds of these cases of economic activity, the children were also involved in both housekeeping and going to school. Unfortunately there is very little disaggregation of the data by age. Table 2, however, indicates that there were approximately 1.16 million children aged 15 to 17, of whom about 450 thousand (or 39 per cent) were engaged in economic activity.
Another DCS web site is at www.statistics.gov.lk. This site also contains details of the Child Activity Survey 1999. For the LFS, the site includes a more up-to-date LFS bulletin, covering the second quarter of 2000. However, the statistics presented are much less useful for studying youth employment because the age group 20-29 is now presented as a single group, instead of being split into the two groups, 20-24 and 25-29. Rates for those aged 15-19 are still shown separately.
This site also provides some preliminary results from the 2001 population census. The reference date for this census was 17 July 2001. Because of the security situation, it was impossible to cover most of the Northern and Eastern provinces. In the 18 districts that were covered the total population was almost 17 million, compared with a figure of about 13 million for the same areas at the time of the 1981 census. The web site also contains a detailed background report on the census from the Director General of DCS. Another useful item on this web site is the summary findings from the 1995/96 Household Income and Expenditure Survey, together with details of poverty indicators derived from the survey.
Ministry of Labour: www.labour.gov.lk
There is a Labour Statistics Division in the Department of Labour. It is responsible for collecting, compiling and disseminating statistical information. The main activities undertaken by the Division are as follows: annual employment survey, survey on average earnings and hours of work, computation of monthly wage rate indices, collection of labour inspection data, publications (Annual Employment Survey, Labour Statistics of Sri Lanka, and Quarterly News Bulletin on Child Labour), maintaining the Department’s web site, and providing statistical information to the ILO.
Youth employment statistics in Asia and the Pacific: A review of Internet resources 43
The web site contains 15 tables of labour statistics, but none includes any breakdown by sex or age. The tables cover topics such as minimum wages, trades unions, strikes, industrial disputes, industrial accidents, and compensation paid.
Details are given of national labour laws. Law 29 of 1973 is an Act to regulate the employment of women, young persons, and children. Young persons are defined as those aged 14-17. Children are defined as those aged under 14 years. There are strict provisions on night work; establishments must maintain a register of all persons under 18. Children may not engage or be employed in street trading but may be employed by parents or guardians for a small amount of light agricultural or horticultural work. Paragraph 21 of Part IV specifies the provisions on the employment of young persons, according to their age and sex.
National Youth Services Council (NYSC): www.gov.lk/national/nysc/index.html
The NYSC comes under the jurisdiction of the Ministry of Youth Affairs. It was established in 1967 and became a nation-wide organisation in 1979. It is the sole state organisation with responsibility for policy making, planning and co-ordinating youth activities at the national level in order to ensure the development of youth in Sri Lanka. Its aim is to encourage youth in self-employment by providing technical and vocational training facilities. It currently runs 25 technical and vocational training centres around the country.
Ministry of Women’s Affairs: www.womens-affairs.gov.lk
This Ministry aims to improve the socio-economic status of women in Sri Lanka. It runs Economic Empowerment Programmes, including the identification of potential women entrepreneurs, development training for entrepreneurship, and training programmes in skills development.
THAILAND
National Statistical Office (NSO): www.nso.go.th/
The NSO web site has been redesigned. It provides considerable statistical information on a timely basis. A population census was conducted in April 2000. The full preliminary report, giving results at the national level, is available on the site as well as an advanced report, giving regional-level data. The population was found to be 60.6 million people (29.8 million males and 30.8 million females). The Statistical Yearbook for 2000 is also available on the site.
The LFS has been running for a long time. Initially, from 1971 to 1983, LFS was conducted twice a year in February (the non-agricultural season) and August (the peak agricultural season). Then, from 1984 to 1997, a third round was added in May to represent the time when students finish school and come onto the labour market. From 1998 the LFS has been conducted on a full quarterly basis, with an additional round in November, to represent the harvesting season. Another interesting change over the years has involved the age cut-off point. Initially the minimum working age was taken as being 11 years and was raised to 13 years in 1989. In 2001 it was raised again to 15 years, which brings it more into line with international practice. Starting in 2001, NSO has also updated the classification systems used for analysis of LFS data. It is now using ISIC Rev.3 (1990) for classifying industry, ISCO-88 for classifying occupation, and ICSE-93 for classifying status in employment.
LFS data from the first two quarters of 2001 are already available on the web site. These tables are: population by LF status; employed persons by industry, by occupation, by work status, and by
Youth employment statistics in Asia and the Pacific: A review of Internet resources 44

level of educational attainment; unemployment by age group; average wage of employed persons by industry; population aged 13+ by LF status and sex; and employed persons by industry and sex. A general problem is that most of the tables do not show both age and sex.
Ministry of Labour and Social Welfare (MOLSW): www.molsw.go.th
The MOLSW was set up in 1993, with seven departments. The old Labour Department had previously been located in the Ministry of the Interior. Most of the MOLSW web sites are in Thai only. Thai-only web sites include:
Department of Employment: www.doe.go.th (except for a section for the Alien Occupational Control Division)
Department of Public Welfare: www.dopw.go.th Department of Skill Development: www.dsd.go.th
The web sites that have a significant part in English include:
Department of Labour Protection and Welfare: www.labour.go.th. Its vision is described as that the Department should be “the main body for setting labour standards and maintaining efficient and effective labour management in order to gain international acceptance.” The web site has a section dealing with labour studies and labour statistics. There are several tables, for instance, one showing the number of establishments of different sizes and number of employees in different provinces. One particularly relevant table relates to women and child labour. It shows that in 1999 some 38,000 establishments were inspected, employing over a million women and almost 9,000 children (age not stated). The table indicates that nearly 15,000 establishments (some 39 per cent of those inspected) were “illegal establishments” (although no definition of “illegal” is given).
Social Security Office: www.sso.molsw.go.th SSO was established in 1990, in line with the Social Security Act of that year. It manages the Social Security Fund, aimed at providing protection and security for insured persons in case of injuries, sickness, invalidity, or death from non-work-related causes, maternity, child allowance, and old-age pension. The web site provides some statistics on the operations of the Fund. By May 2001 there were over 100,000 establishments registered with the Fund, covering about 6 million workers. The web site gives monthly details of use of the Fund. Around May 2001, monthly claims were running at about one million for sickness, half a million for child allowance, 15,000 for maternity, 1,000 for old age, 1,000 for death, and a minimal number for invalidity. Some 130 government hospitals and a similar number of private hospitals are now part of the scheme, and there are another 5,000 subcontracted hospitals or health networks.
SSO also looks after the Workmen's Compensation Fund, which provides protection for employees who are injured, sick, disabled, or who die from work-related causes. The number of adjudications annually reached a peak of a quarter of a million in 1996, but has declined since then. The monthly total in May 2001 was only about 10,000. Of these, some 6,500 were for temporary disability lasting no more than three days, 3,500 were for temporary disability lasting longer than three days, 100 cases were for permanent disability, and 50 were for death.
Ministry of Science, Technology and Environment (MOSTE): www.moste.go.th/S&Tmanpower
A link from the DOE site goes to this part of the MOSTE web site. The objective in setting up this web site is to construct a science and technology manpower database on both the demand and production (supply) side. This will enable the Ministry to establish a web of science and technology
Youth employment statistics in Asia and the Pacific: A review of Internet resources 45

manpower linkages to information held by related public and private organisations, which in turn will facilitate its use. In defining what is meant by science and technology, the Ministry will follow the ISCED system developed by UNESCO (where science and technology will be split into three categories: science; engineering; and agriculture, forestry and fishery). On the demand side, they aim to get information from the Federation of Thai Industry (www.fti.or.th), the Thai Chamber of Commerce (www.thaicommerce.com), and the Board of Investment (www.boi.go.th). On the supply side, information will be obtained from the Ministry of University Affairs (www.inter.mua.go.th), the Ministry of Education (www.moe.go.th), the Rajamangala Institute (rit.ac.th), and the Rajabhat Institute (www.rajabhat.ac.th).
VIET NAM
General Statistics Office (GSO)
GSO does not have a web site, but some limited information on the labour force survey is available from a paper by Nguyen Van Phai presented at the OECD/ESCAP meeting on key economic indicators held in Bangkok, 22-25 May 2000 (www.unescap.org/stat/meet/keyindic/keyindic.htm). The LFS is carried out each year in Viet Nam jointly by GSO and the Ministry of Labour, Invalids and Social Affairs (MOLISA). The 1998 survey had a sample size of 83,200 households, spreading across 2,856 enumeration areas (1,676 urban and 1,180 rural), and providing provincial-level estimates. On average 35 households were selected in each urban EA, and 40 households in each rural EA. The steering committee for the survey includes representatives of GSO and MOLISA, and reports to the Council of Ministers. Funding for the survey is provided by MOLISA (up to the year 2000) through the Employment Fund. Data collection is carried out by field staff from the provincial offices of GSO, assisted by some temporary staff recruited by MOLISA, and computer processing and tabulation is done at the GSO Computer Centre. MOLISA prepares the results for publication.
Apart from its work on the LFS, GSO’s Department of Population and Labour Statistics produces only a limited range of labour statistics based on six-monthly employment reports from state-owned enterprises and government agencies at central and local level. There is no employment survey of private sector establishments.
Viet Nam carried out a population census in 1999. A recent issue (volume 7, number 2, 2001) of UN News, the quarterly newsletter of the United Nations in Viet Nam focused on labour and employment. ( www.un.org.vn ). One article, written by a programme officer of UNFPA, is entitled “1999 Census shows decline in women’s participation in the labour force.” GSO, with the support of UNFPA, has prepared a Monograph on Employment, based on a 3 per cent sample of the data from the 1999 census. The monograph was due for release in June 2001. A comparison of the results of the 1989 and 1999 censuses indicates that there has been a consistent decline in female participation rates across all five-year age groups over the 10-year period. This is in marked contrast to the situation for males, where participation rates increased for each group between the ages of 25 and 49. It was only among the younger age groups (15-19 and 20-24) and the older age groups (those aged 50 and over) that male participation rates declined. The article does not present the actual figures for each age group, but the information is displayed in a graph. The article attributes the declining trend in male and female activity rates of the 15-19 age group to an increase in school enrolment for both sexes. The census data record more young men and women as being economically inactive because they are studying.
Ministry of Labour, Invalids and Social Affairs (MOLISA)
Youth employment statistics in Asia and the Pacific: A review of Internet resources 46

MOLISA does not appear to have an Internet presence but Mr. Nguyen Trong Phu, the Director of its Centre for Information and Statistics, presented a paper entitled “Organisation of system of labour market statistics and information in Viet Nam” at a recent seminar. (The paper itself is not available on the Internet). The seminar on the development of a labour market in Viet Nam was held on 3 May 2001. It was organised by the Central Institute for Economic Management (CIEM) with the support of GTZ (the official German development agency).
In the same issue of UN News referred to above, the Director of the Institute of Labour Science and Social Issues noted that the country’s greatest challenge in the field of labour and employment is fully utilising the available labour force and providing employment for all job seekers. It is estimated that over the next 10 years the available labour force will grow by about 2½ per cent a year, with more than a million young people entering the labour force every year. Viet Nam will continue to suffer from labour redundancy. Therefore, it will be very difficult to achieve the target of reducing the urban unemployment rate to below 5 per cent unless there is a breakthrough in employment generation.
Youth employment statistics in Asia and the Pacific: A review of Internet resources 47

Annex 2
Social security programmes by country and type
Types of social security programme
Old age, Sickness, Work Unemp- Familydisability, maternity injury loyment Allowances death
Developed (industrialized) countriesMajor non-Europe
Australia X X X X XJapan X X X X XNew Zealand X X X X X
Asia and the PacificEastern Asia
China X X X XKorea, Republic of X x X
South-central AsiaAfghanistan X X XBangladesh X X XIndia X X X
Nepal X XPakistan X X XSri Lanka X X X
South-eastern AsiaIndonesia X x XLao People's Democratic Republic X X X X XMalaysia X XMyanmar X X
Philippines X X XSingapore X x XThailand X X X xViet Nam X X X
Pacific Melanesia
Fiji X XPapua New Guinea X XSolomon Islands X X
Micronesia Kiribati x x
Middle East and North AfricaMiddle East
Iran, Islamic Republic of X X X X X
Notes: No information is available for Cambodia and Mongolia. Sickness and maternity refers to cash benefits for sickness and maternity. Medical and/or hospitalisation coverage are also provided in addition to cash benefits.
Source: Originally from: United States, Social Security Administration: Social Security Programs Throughout the World – 1999. The information shown here is taken from Table A.3 in KILM 2001.
Youth employment statistics in Asia and the Pacific: A review of Internet resources 48

Annex 3 Latest availability date of indicators in KILM 2001 for ILO-ROAP member countries
KILM indicator no. 1 2 3 4 5 6 7 8 9 10 11 12 13 14 15 16 17 18 19 20
Developed (industrialized) economies (Major non-Europe)Australia 1999 2000 2000 1999 1996 2000 2000 1999 2000 1998 2000 1999 1998 1999 1998 2000 2000 1994Japan 2000 2000 2000 2000 1996 2000 2000 2000 2000 1999 2000 2000 1997 1999 1998 2000 2000 1993New Zealand 1999 2000 2000 2000 2000 2000 1999 2000 1999 2000 1999 1999 1999 1991 2000 2000
Eastern AsiaChina 1995 1995 1998 2000 2000 1995 2001 1999 1999 1998 1998Korea, Rep. of 1999 2000 2000 2000 1997 2000 2000 1999 2000 1999 1999 2001 1999 1998 2000 2000 1993Mongolia 1998 1998 1999 1998 1998 1998 1995 1995 1995
South-central AsiaAfghanistan 1995 1990 1995 2001Bangladesh 1996 1996 1996 1996 1994 1993 1996 1996 1996 2001 1992 1998 1996India 1995 1995 1993 1999 1997 1996 1995 2001 1997 1999 1997
Nepal 1998 1999 1995 1994 1999 1998 2001 1996 1990 1996Pakistan 2000 1997 1997 1999 1994 1992 2000 1997 1995 2000 2001 1997 1999 1997Sri Lanka 1999 1999 1996 1998 1994 1985 1999 1999 1999 1999 2001 1999 1999 2000 1999 1996
South-eastern AsiaCambodia 1998 1993 1998 1993 1999 1997Indonesia 1999 1997 1992 2000 1995 2000 1996 1999 1999 2001 1996 1992 1999 1999Lao PDR 1995 1990 1995 2001 1994 1997
Malaysia 1999 1999 1993 1999 1994 2000 1999 2001 1997 1991 1999 1997Myanmar 1995 1990 1998 1996 1999 1995 2001 1999 1999Philippines 1999 1999 1994 1999 1995 2000 2000 2001 1999 2001 1995 1995 1999 1997
Singapore 1998 1998 1999 1999 1992 2000 1999 1999 1998 2001 1999 1998 2000 1999Thailand 1999 2000 1999 1999 1994 1995 2000 2000 1999 2000 1999 2001 1999 1995 1999 1998Viet Nam 1995 1995 1997 1995 2001 1998
PacificFiji 1995 1998 1994 1990 1995 1995 2001 1997 1988Papua New Guinea 1995 1990 1995 2001 1996 1996Solomon Islands 1995 1994 1995 1996Kiribati 1995
Middle EastIran, Islamic Rep. of 1996 1986 1996 1996 1996 1996 2001 1993
Note: The latest years for the KILM indicators of particular interest in the present context (1, 2, 8 and 9) are shown in bold, and for the additional indicators of interest (10, 12, and 14) in italics.
Youth employment statistics in Asia and the Pacific: A review of Internet resources 49