Embed Size (px)
Citation preview

page 1
This survey was requested by Directorate-General Education and Culture and
coordinated by Directorate-General Communication
This document does not represent the point of view of the European Commission. The interpretations
and opinions contained in it are solely those of the authors.
Fla
sh E
uro
ba
rom
ete
r 3
19
a –
Th
e G
allu
p O
rga
niz
atio
n
Flash Eurobarometer
Youth on the move Analytical report Fieldwork: February 2011
Publication: May 2011
European Commission

Flash EB Series #319a
Youth on the move
Survey conducted by The Gallup Organization, Hungary upon the request of
Directorate-General Education and Culture
Coordinated by Directorate-General Communication
This document does not represent the point of
view of the European Commission. The interpretations and opinions contained in it
are solely those of the authors.
THE GALLUP ORGANIZATION

Flash EB No 319a – Youth on the move Analytical report
page 3
Table of contents
Table of contents ................................................................................................................................... 3
Introduction .......................................................................................................................................... 4
Main findings ........................................................................................................................................ 5
1. Participation in activities of various organisations ....................................................................... 7
2. Participation in cultural activities ................................................................................................. 12
3. Participation in political elections ................................................................................................. 17
4. Participation in voluntary activities .............................................................................................. 19
5. Participation in international youth projects ............................................................................... 23
6. Summary of variations in participation rates – by young people’s socio-demographic characteristics ..................................................................................................................... 25
I. Annex tables .................................................................................................................................... 27
II. Survey details ................................................................................................................................. 53
III. Questionnaire ............................................................................................................................... 57

Analytical report Flash EB No 319a – Youth on the move
page 4
Introduction
The primary objective of the Flash Eurobarometer survey “Youth on the Move” (No 319a) was to study young EU citizens’ participation in society. In detail, the survey examined young people’s participation in:
• sports clubs, youth organisations, cultural organisations and non-governmental organisations • political elections at the local, regional, national or EU level • voluntary activities; particularly those aimed at changing respondents’ local community/
environment • activities and projects fostering cooperation between young people from various countries.
The survey obtained interviews – fixed-line, mobile phone – with nationally representative samples of young people (aged between 15 and 30) living in the 27 EU Member States. The target sample size in all countries was 1,000 interviews; in total, 27,029 interviews were conducted by Gallup’s network of fieldwork organisations from 31 January to 4 February 2011. Statistical results were weighted to correct for known demographic discrepancies.

Flash EB No 319a – Youth on the move Analytical report
page 5
Main findings Participation in activities of various organisations
• Roughly a third of young people in the EU had been active in a sports club in the year prior to the survey. About a sixth had been involved in a youth organisation and roughly one in seven had participated in a cultural organisation’s activities.
• About a tenth of respondents had taken part in activities of a local organisation that aimed to
improve their local community/environment. Less than 1 in 10 young people said they had been active in other types of organisations; for example, one promoting human rights or a political organisation (both 5%).
• Young people in the Netherlands were the most likely to name at least one type of organisation
that they had participated in, during the past 12 months (72%). In six other countries, roughly two-thirds of respondents had participated in at least one type of organisation: Ireland, Luxembourg, Denmark, Austria, Germany and Belgium. Conversely, young people in Poland (33%), Bulgaria (35%) and Cyprus (36%) were the least likely to have participated in an activity of at least one of the organisations listed in the survey.
• Young people involved in a sports clubs’ activities were more likely to be men, 15-19 year-olds
and still in education, especially those studying at a secondary school. Similar patterns were seen when looking at the participation rates in youth organisations.
• Among those who had completed their education, 6% of respondents who had left school without
completing their lower secondary education mentioned that they had been active in a cultural organisation, compared to 16% among those that had a higher education qualification.
Participation in cultural activities
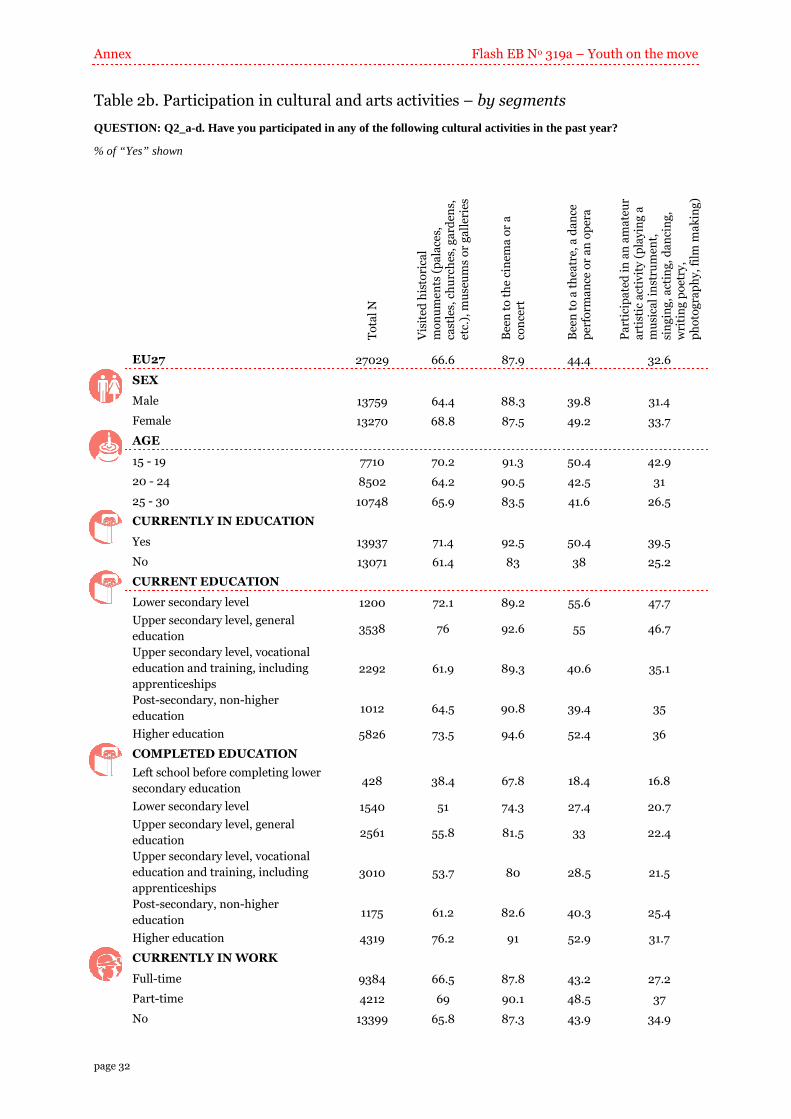
• Two-thirds of respondents had visited a museum, gallery or historical monument in the past 12 months, while more than 4 in 10 (44%) had seen a dance, theatre or opera performance. Of the cultural activities listed, young people were the least likely to have participated in an amateur artistic activity (33%).
• Young people in Latvia, Austria, Estonia and the Czech Republic were the most likely to have
visited a historical monument, museum or gallery in the past year (75%-77%). The proportions of young adults who had been to a theatre, dance or opera performance in the past 12 months were the highest in Estonia (61%), the Czech Republic, Latvia and Austria (all 56%).
• Young women, 15-19 year-olds and those still in education were more likely than their
counterparts to have visited a museum, gallery or monument, to have attended a dance, opera or theatre performance or to have participated in an amateur artistic activity.
• The largest differences in participation rates for cultural activities were found when comparing
respondents with the lowest level of educational attainment and those with the highest level. While 38% of respondents who had left school before completing lower secondary education had visited a museum, gallery or historical monument in the past 12 months, this proportion was twice as high among those that had achieved a higher education qualification (76%).
Analytical report Flash EB No 319a – Youth on the move
page 6
Participation in political elections
• Among young people in the EU who were old enough to vote, roughly 8 in 10 said that they had voted in a political election at the local, regional, national or EU level in the past three years. The proportion of “voters” ranged from 67% in Luxembourg to 93% in Belgium (where voting is compulsory). Poland, Austria, Malta and Sweden had results close to those of Belgium.
• Educational attainment was positively related to political participation: while half of young adults
who had left the educational system before completing their lower secondary education said they had voted in an election in the past three years, this proportion was 88% among those with a higher education qualification.
Participation in voluntary activities
• About a quarter of young adults in the EU had been involved in an organised voluntary activity in the year prior to the survey. At the individual country level, the highest proportions of young people who had been involved in voluntary activities were observed in Slovenia, Denmark, Ireland and the Netherlands (36%-40%).
• Roughly one in two young adults – who had been involved in an organised voluntary activity in
the past 12 months – said that this activity had been aimed at changing something in their local community. A quarter of respondents had received some kind of formal recognition (e.g. a certificate or diploma) for their participation in an organised voluntary activity.
• Among respondents still in education, students in vocational training were less likely than their
counterparts to have participated in an organised voluntary activity in the past year (23% vs. 27%-30% across other educational categories). Among respondents who had completed their education, those who had obtained higher levels of education were more likely to have been involved in voluntary activities (26% of those with a higher education qualification vs. 17% of respondents who had left school before completing secondary education).
Participation in international youth projects
• About a tenth of young adults in the EU said that, in the year prior to the survey, they had participated in activities or projects aiming at fostering cooperation with young people from other countries; more precisely, 6% had taken part in activities with young people from other European countries, while 4% mentioned activities with young people from other continents.
• Across all countries, a minority of young people said they had been involved in activities or
projects aiming at fostering cooperation with young people from other countries; the proportion of respondents who had participated in this type of activity in the year prior to the survey ranged from 4% in Italy to 16% in Austria.
• While 14% of 15-19 year-olds had participated in activities or projects with young people from
other countries, in the year prior to the survey, this proportion was 8% for 20-24 year-olds and 6% for 25-30 year-olds. Similarly, those still in education – especially those currently in secondary level education – were more likely than those who had completed their education to have participated in an international youth project in the past 12 months.
• Among those who had completed their education, respondents with the highest level of education
were somewhat more likely to have participated in an international youth project in the past 12 months (8% of respondents with a higher education qualification, compared to 2% of those who had left school without completing lower secondary education).

Flash EB No 319a – Youth on the move Analytical report
page 7
1. Participation in activities of various organisations Roughly a third (34%) of young people in the EU said they had been active in a sports club in the year prior to the survey. About half as many respondents (18%) had been involved in a youth club, leisure-time club or other type of youth organisation and roughly one in seven (14%) said they had participated in a cultural organisation’s activities. Roughly a tenth of respondents had taken part in activities of a local organisation that aimed to improve their local community/environment (11%). Less than 1 in 10 young people said they had been active in each of the other types of organisations listed in the survey: one promoting human rights or global development, or a political organisation/party (both 5%), one active in the domain of global climate change/global warming (3%). Slightly less than a tenth (8%) of respondents mentioned activities of another type of non-governmental organisation (NGO).
Participation in activities of various organisations
34
18
14
11
8
5
5
3
A sports club
A youth club, leisure-time club or any kind ofyouth organisation
A cultural organisation
A local organisation aimed at improving yourlocal community and/or local environment
Any other non-governmental organisations
An organisation promoting human rights orglobal development
A political organisation or a political party
An organisation active in the domain of globalclimate change/global warming
Q1. Have you in the past year participated in any activities of the following organisations?
Base: all respondents, % of ’Yes’ answers shown, EU27 Country variations In 14 of the 27 EU Member States, more than half of the surveyed young people reported that, in the past year, they had been active in at least one of the types of organisation listed in the survey. Young people in the Netherlands were the most likely to name at least one type of organisation that they had participated in, during the past 12 months (72%). In six other countries, roughly two-thirds of respondents had participated in at least one type of organisation: Ireland (67%), Luxembourg (66%), Denmark (65%), Austria, Germany and Belgium (all 64%). Conversely, young people in Poland (33%), Bulgaria (35%) and Cyprus (36%) were the least likely to say that they had participated in an activity of at least one of the organisations listed in the survey; almost all other eastern and southern European countries also had participation rates below the EU average (from 40% in Hungary to 46% in Lithuania and Slovakia).

Analytical report Flash EB No 319a – Youth on the move
page 8
Proportion that had participated in at least one of the types of organisation
7267 66 65 64 64 64
59 57 57 55 54 53 53 5246 46 45 44 44 43 43 42 42 40
36 35 33
0
20
40
60
80
100
NL IE LU
DK
BE
DE
AT
SE SI
UK
FR
EE FI
IT
EU
27
SK
LT
PT
RO
MT
LV
CZ
ES
EL
HU
CY
BG
PL
Q1. Have you in the past year participated in any activities of the following organisations?Base: all respondents, % by country
The table on the following page shows, for each country, the proportion of young people who had participated in at least one of the types of organisation listed in the survey. A first glance at the table shows that in all Member States, except Romania, participation in a sports club was mentioned by the largest group of respondents. Young people in the Netherlands were the most likely to have participated in at least one activity of a sports club in the year prior to the survey (59%); they were followed by young adults in Ireland (53%), Belgium (48%), Germany (47%) and Luxembourg (46%). In Romania, 13% of interviewees said that they had taken part in a sports club’s activities in the past 12 months; similar figures were observed in Poland (15%), Bulgaria (17%) and Cyprus (18%). In fact, for each of the types of organisation listed in the survey, respondents in the three last-named countries were among the last likely to say that they had participated in such an organisation. Romania, however, had one of the largest proportions of young people who had participated in the activities organised by a youth club or leisure-time club (24%); other countries where roughly a quarter of young people had attended a meeting of a youth organisation in the past year were the UK (24%), Belgium (25%), Ireland and Luxembourg (both 26%). In Romania, activities organised by youth organisations were selected by the largest proportion of respondents; in most other countries, these types of activities also appeared in the top three of frequently mentioned activities, without ever being selected by the largest proportion of respondents. For example, in Netherlands, 59% of respondents had been involved in a sports club’s activities in the past 12 months, while 19% had participated in the activities of a youth organisation. In some other countries, the difference between the most-frequently mentioned organisational activity and the second most-frequently mentioned activity was smaller: for example, in Italy, 36% of respondents said that they had participated in an activity of a sports club (in first position), compared to 22% who mentioned that they had been involved in a youth organisation (in second position). In 21 of the 27 Member States, participating in the activities of a cultural organisation also appeared in the top three of most-frequently mentioned activities; for example, this was mentioned by roughly a fifth of young adults in the Czech Republic, Italy, Luxembourg, Slovakia, Austria and Slovenia (19%-21%). In seven Member States, young people were more likely to mention activities of local organisations aiming at improving their local community/environment; the proportion selecting this type of organisation was the highest in Ireland (24%). In almost all countries, the remaining activities were mentioned by less than a tenth of young adults. Activities of an organisation promoting human rights or global development were mentioned by 11% of respondents in Denmark, while the activities of a political organisation/party were mentioned by 10% of respondents in Austria. In Malta, Sweden, the UK and Italy, slightly more than a tenth (11%-12%) of young people said that they had participated in an activity organised by another type of non-governmental organisation.

Flash EB No 319a – Youth on the move Analytical report
page 9
Participation in the activities of various organisations
A s
po
rts
clu
b
A y
ou
th c
lub
, le
isu
re-t
ime
clu
b o
r a
ny
kin
d o
f y
ou
th
org
an
isa
tio
n
A c
ult
ura
l o
rga
nis
ati
on
A l
oca
l o
rga
nis
ati
on
a
imed
at
imp
rov
ing
on
e’s
loca
l co
mm
un
ity
an
d/o
r lo
cal
env
iro
nm
ent
An
y o
ther
no
n-
go
ver
nm
enta
l o
rga
nis
ati
on
s
An
org
an
isa
tio
n
pro
mo
tin
g h
um
an
rig
hts
o
r g
lob
al
dev
elo
pm
ent
A p
oli
tica
l o
rga
nis
ati
on
or
a p
oli
tica
l p
art
y
An
org
an
isa
tio
n a
ctiv
e in
th
e d
om
ain
of
glo
ba
l cl
ima
te c
ha
ng
e/g
lob
al
wa
rmin
g
EU27 34 18 14 11 8 5 5 3
COUNTRY
Belgium 48 25 18 13 5 8 5 5
Bulgaria 17 10 9 7 5 6 4 3
Czech Rep. 25 14 19 8 6 4 3 2
Denmark 42 16 12 11 9 11 7 4
Germany 47 20 16 13 7 3 5 2
Estonia 35 17 16 10 9 2 5 2
Greece 21 11 10 12 7 5 7 5
Spain 27 14 10 6 8 6 3 3
France 40 18 12 8 6 2 2 2
Ireland 53 26 15 24 8 8 6 6
Italy 36 22 20 10 12 7 6 3
Cyprus 18 11 8 9 7 5 8 3
Latvia 26 15 16 10 7 3 3 1
Lithuania 24 17 14 12 9 5 5 3
Luxembourg 46 26 20 12 7 6 5 4
Hungary 23 11 10 10 5 1 3 2
Malta 20 16 9 9 11 3 4 3
Netherlands 59 19 12 10 7 8 4 4
Austria 38 22 21 15 7 7 10 4
Poland 15 9 11 9 7 3 2 1
Portugal 23 13 15 15 7 5 8 3
Romania 13 24 14 15 9 6 7 5
Slovenia 29 19 21 17 8 6 5 3
Slovakia 29 13 20 6 5 3 4 2
Finland 28 19 13 12 9 8 4 4
Sweden 36 17 14 10 11 8 7 5
United Kingdom 36 24 12 16 11 8 7 5
Q1. Have you in the past year participated in any activities of the following organisations? % “yes” answers by country
Shaded cells show the three most-frequently mentioned activities in each country, while bold number show the most frequently mentioned activity
Of the eight types of organisations listed in the survey, three could be identified as the ones that young people were the most likely to have participated in: (1) sports clubs, (2) youth organisations or leisure-time clubs and (3) cultural organisations. The proportion of respondents who reported that, in the past year, they had been active in at least one of the three above-mentioned organisations ranged from less than 3 in 10 in Poland (26%), Cyprus (27%) and Bulgaria (28%) to roughly two-thirds in the Netherlands (68%). Germany, Ireland, Luxembourg and Belgium were close to the Netherlands with 59%-61% of young people who had

Analytical report Flash EB No 319a – Youth on the move
page 10
participated in an activity of a sports club, youth organisation or cultural organisation in the year prior to the survey.
Proportion that had been active in a sports club, youth club or cultural organisation
6861 61 61 59 56 55
51 50 48 48 48 47 46 44 4239 38 38 36 36 35 35 32 32
28 27 26
0
20
40
60
80
100
NL
BE
LU IE DE
AT
DK
FR
SE
UK IT SI
EE
EU
27 FI
SK
LV
LT
CZ
PT
MT
RO ES
EL
HU
BG
CY
PL
Q1. Have you in the past year participated in any activities of the following organisations?Base: all respondents, % by country
Socio-demographic considerations Across all age groups, sports clubs were the most-frequently mentioned type of organisation of the ones listed in the survey. Nonetheless, large differences were seen across age groups in the proportions that had been active in a sports club in the past year: 28% of 25-30 year-olds and 32% of 20-24 year-olds, compared to 44% of 15-19 year-olds. Furthermore, the younger the respondents were, the more likely they were to have been involved in a youth club, leisure-time club or other type of youth organisation: while just 12% of 25-30 year-olds had taken part in such an activity in the past 12 months, this proportion increased to 27% for 15-19 year-olds. Differences between age groups in participation rates for the remaining types of organisation were minor. Summarising the results across the three most popular types of organisational activities, it was noted that 57% of 15-19 year-olds had participated in an activity of a sports club, youth organisation or cultural organisation in the year prior to the survey; this proportion decreased to 45% for 20-24 year-olds and 39% for 25-30 year-olds. Participation in activities of various organisations
A sports club
A youth club, leisure-time club or any kind ofyouth organisation
A cultural organisation
A local organisation aimed at improving yourlocal community and/or local environment
Any other non-governmental organisations
An organisation promoting human rights orglobal development
A political organisation or a political party
An organisation active in the domain ofglobal climate change/global warming
Q1. Have you in the past year participated in any activities of the following organisations?Base: all respondents, % of ’Yes’ answers shown, EU27
44
27
14
11
7
6
4
4
a
b
c
f
j
i
e
g
32
18
14
10
8
5
5
3
a
b
c
f
j
i
e
g
28
12
14
12
8
5
5
3
a
b
c
f
j
i
e
g
15-19 year-olds
20-24 year-olds
25-30 year-olds

Flash EB No 319a – Youth on the move Analytical report
page 11
In regards to other socio-demographic characteristics, it was noted that young people involved in a sports clubs’ activities were also more likely to be male (39% vs. 28% of women) and still in education, especially those studying at a secondary school (47% vs. 34%-36% in vocational or post-secondary education). Similarly, those with living arrangements that could be associated with a younger age group (e.g. those living with their parents or sharing accommodation) were more likely to have been involved in a sports club’s activities, while respondents in “couple households with small children” were less likely to have done so (35%-39% vs. 22%). Among respondents who had completed their education, then the higher the level of education they had reached, the more likely they were to have been involved at a sports club in the year prior to the survey (30%-31% of respondents with a post-secondary or higher education qualification, compared to 22% of those who had left school without completing lower secondary education). Non-working respondents (no longer in education) were overall the least likely to have participated in a sports club’s activities; for example, 13% of homemakers, 17% of those on maternity/paternity leave and 16% of respondents with a disability had taken part in such an activity in the past 12 months (compared to 32% of full-time working respondents and 37% of “full-time” students). Similar patterns were seen when looking at the participation rates in youth organisations. For example, roughly a quarter (23%) of students, as opposed to 13% of those who had completed their education, said they had participated in these types of organisations’ activities. Furthermore, among those still in education, the highest participation rates were found among respondents in secondary school (28% vs. 20%-22% for respondents in higher levels of training). Comparing respondents with different levels of education, large differences were also seen in the proportions that had been involved in cultural organisations. Among those who had completed their education, 6% of respondents who had left school without completing their lower secondary education mentioned that they had been active in a cultural organisation, compared to 16% among those that had a higher education qualification. Non-working respondents – no longer in education – were also less likely to have been involved in activities of a cultural organisation (for example, 6% of respondents with a disability and 8% of unemployed respondents, compared to 12% of full-time working respondents). Respondents who had a part-time job alongside their studies, on the other hand, were the most likely to have been active in a cultural organisation (19%). In fact, young people who had a part-time job, alongside their studies, appeared to be the “most active” group in all types of organisations (from sports clubs to non-governmental organisations). For more details, see annex table 1b.

Analytical report Flash EB No 319a – Youth on the move
page 12
2. Participation in cultural activities A vast majority (88%) of young people in the EU said that they had been to the cinema or a concert in the year prior to the survey. Two-thirds (67%) of respondents answered that they had visited a museum, gallery or historical monument (such as a castle or church), while more than 4 in 10 (44%) said they had seen a dance performance or been to the theatre or opera in that time frame. Of the cultural activities listed, the surveyed young people were the least likely to have participated in an amateur artistic activity (e.g. having played a musical instrument, sung or acted or wrote poetry) – this type of cultural activity was mentioned by a third of respondents.
Participation in cultural and arts activities
88
67
44
33
Been to the cinema or a concert
Visited historical monuments (palaces, castles,churches, gardens, etc.), museums or galleries
Been to a theatre, a dance performance or an opera
Participated in an amateur artistic activity (e.g.playing a musical instrument, singing, acting,
dancing, writing poetry, photography, film making)
Q2. Have you participated in any of the following cultural activities in the past year? Base: all respondents, % of ’Yes’ answers shown, EU27
Country variations In almost all Member States, more than three-quarters of young adults had been to the cinema or a concert in the year prior to the survey; this proportion ranged from 78% in Cyprus to 95% in Slovenia and Denmark. Young people in Romania, on the other hand, were less likely than their peers in other EU countries to have seen a film or concert in the past year (65%).
95 95 94 93 92 91 91 91 91 91 91 90 90 89 89 88 88 88 87 87 84 84 84 81 81 80 78
65
0
20
40
60
80
100
DK SI
AT
LU IE EE IT FI
SE
DE
FR
ES
BE
LV
PT
NL
PL
EU
27
CZ
UK
LT
SK
MT
BG
EL
HU
CY
RO
Q2. Have you participated in any of the following cultural activities in the past year? Base: all respondents, % of ’Yes’ answers shown by country
Participation in cultural and arts activities:Going to the cinema or a concert

Flash EB No 319a – Youth on the move Analytical report
page 13
Going to the cinema or attending a concert was the most-frequently mentioned cultural activity across all Member States; while the second largest proportion of respondents answered that they had visited a historical monument, museum or gallery in the past 12 months. In almost all countries, a majority of young adults said they had visited a historical monument, museum or gallery in the past year; young people in Latvia, Austria, Estonia and the Czech Republic were the most likely to have done so (75%-77%). Malta was the only country were less than half (48%) of respondents had participated in this type of cultural activities in the year prior to the survey. Participation in cultural and arts activities:Visiting a historical monument, museum or gallery
77 76 75 75 73 73 72 71 71 70 70 70 68 67 67 66 66 66 65 63 63 62 62 6158 58 57
48
0
20
40
60
80
100
CZ
EE
AT
LV
SK SI
DE
BG
PT
LU PL
ES
LT
DK
EU
27
SE FI
HU IT UK
EL
RO
FR IE CY
NL
BE
MT
Q2. Have you participated in any of the following cultural activities in the past year? Base: all respondents, % of ’Yes’ answers shown by country
Young people in Austria, Latvia, the Czech Republic and Estonia were not only the most likely to have visited a historical monument, museum or gallery in the past year, they were also the most likely to say that they had been to a theatre, dance or opera performance in that timeframe (56%-61%). Young people in Malta, on the other hand, were once more the least likely to have attended such a performance (32%).
6156 56 56 53 53 52 51 51 50 50 49 48 47 47 46 46 44 44 44 43 42 41 41 40 39 37
32
0
20
40
60
80
100
EE
CZ
LV
AT SI
LT
SK
BG IE FI
HU
DE
EL
CY
UK
LU PT
EU
27
BE
NL
PL
SE
ES
RO
FR
DK IT
MT
Q2. Have you participated in any of the following cultural activities in the past year? Base: all respondents, % of ’Yes’ answers shown by country
Participation in cultural and arts activities:Going to a theatre, dance or opera perfomance

Analytical report Flash EB No 319a – Youth on the move
page 14
Across all countries, in the year prior to the survey, more than 80% of young people had participated in at least one of the cultural activities discussed so far in this chapter (from 81% in Romania to 97% in Luxembourg, Denmark and Slovenia). Furthermore, in about half of the countries surveyed, this proportion was 95% or higher: for example, 96% in Austria and 95% in countries such as the Czech Republic, Italy, Ireland and Sweden. Proportion that had participated in cultural or arts activities activities(i.e. been to the cinema or a concert, visited a historical monument, museum or gallery, or attended a theatre, dance or opera performance)
97 97 97 96 95 95 95 95 95 95 95 95 94 94 94 93 93 93 93 92 92 91 91 89 88 87 8781
0
20
40
60
80
100
SI
DK
LU
AT FI
SE IT DE
EE
LV
CZ IE PT
ES
FR
NL
EU
27
BE
PL
UK
LT
SK
BG
MT
EL
HU
CY
RO
Q2. Have you participated in any of the following cultural activities in the past year? Base: all respondents, % by country
Participation in an amateur artistic activity was the least popular cultural pursuit among young adults in all EU Member States. In only two countries had more than 4 in 10 respondents participated in such an activity: Germany (45%) and Austria (50%). In most countries, between a quarter and a third of respondents had taken part in an amateur artistic activity in the year prior to the survey (for example, 24% in Bulgaria, 26% in Portugal, 29% in the Netherlands and 32% in Ireland).
5045
3835 35 34 33 33 32 32 32 31 31 31 30 30 29 29 29 28 28 27 27 27 26 26 24 24
0
20
40
60
80
100
AT
DE
EE
LU SI
SE
EU
27 FI
IE UK
LT
ES
LV
PL
EL
FR
CZ IT NL
BE
SK
HU
DK
RO
CY
PT
MT
BG
Q2. Have you participated in any of the following cultural activities in the past year? Base: all respondents, % of ’Yes’ answers shown by country
Participation in cultural and arts activities:Amateur artistic activities(e.g. playing a musical instrument, singing, acting, dancing, writing poetry, photography or film making)
Socio-demographic considerations Across most socio-demographic segments, more than 80% of interviewees said they had been to the cinema or a concert in the year prior to the survey. The largest difference in participation rates for this type of cultural activity was seen among those who had completed their education; 68% of respondents who had left school without completing their lower secondary education had seen a film or concert in the past year, this proportion increased to 91% among those who had gained a higher education qualification.

Flash EB No 319a – Youth on the move Analytical report
page 15
Respondents in “couple households with small children” (74% vs. 94% of those sharing accommodation) and non-working respondents (for example, 61% of homemakers and 69% of respondents with a disability) were also less likely to have been to the cinema or a concert in the year prior to the survey. For the remaining cultural activities, the largest differences in participation rates were – once more – found when comparing respondents with the lowest level of educational attainment and those with the highest level. For example, while 38% of respondents who had left school before completing lower secondary education had visited a museum, gallery or historical monument in the past 12 months, this proportion was twice as high among those that had achieved a higher education qualification (76%). Similarly, 18% of the former, as opposed to 53% of the latter, had attended a theatre, dance or opera performance in the past year. Looking at respondents’ age, the survey showed that 15-19 year-olds were more likely than their older counterparts to have visited a museum, gallery or monument in the year prior to the survey (70% vs. 64%-66% of 20-30 year-olds) or to have seen a dance performance or been to the theatre or opera in that time frame (50% vs. 42%-43%). The proportions of respondents who had participated in at least one of the cultural activities discussed so far in this section (i.e. been to the cinema or a concert, visited a museum or historical monument or attended a dance, opera or theatre performance) ranged from 91% among 25-30 year-olds to 96% among 15-19 year-olds. Participation in cultural and arts activities
Been to the cinema or a concert
Visited historical monuments (palaces, castles,churches, gardens, etc.), museums or galleries
Been to a theatre, a dance performance or an opera
Participated in an amateur artistic activity (e.g.playing a musical instrument, singing, acting,
dancing, writing poetry, photography, film making)
Q2. Have you participated in any of the following cultural activities in the past year? Base: all respondents, % of ’Yes’ answers shown, EU27
15-19 year-olds
20-24 year-olds
25-30 year-olds
91
70
50
43
b
a
c
d
91
64
43
31
b
a
c
d
84
66
42
27
b
a
c
d
Young women were also more likely than their counterparts to have visited a museum, gallery or monument or to have attended a dance, opera or theatre performance. For example, 40% of young men, as opposed to 49% of young women, had been to a theatre, dance or opera performance in the past 12 months. Focusing solely on those still in education, respondents in secondary school and those in higher education were more likely than respondents in vocational training or post-secondary (non-higher) education to have visited a museum, gallery or monument or to have attended a dance, opera or theatre performance. For example, 62% of students in vocational training had visited a museum, gallery or monument in the year prior to the survey, compared to 74% of respondents in higher education. In accordance with the findings discussed in the previous section, students with a part-time job were somewhat more likely than “full-time” students to have participated in cultural activities. For example, 55% of the former, as opposed to 50% of the latter, said they had been to a theatre, dance or opera performance in the past 12 months. Non-working respondents (no longer in education) were the least likely to have participated in cultural activities; for example, 52% of unemployed respondents and 47% of homemakers and respondents on maternity/paternity leave said they had visited a museum,

Analytical report Flash EB No 319a – Youth on the move
page 16
gallery or historical monument in the past 12 months (compared to 66% of full-time working respondents and 71% of “full-time” students). In regards to participating in an amateur artistic activity, the highest participation rates were found among 15-19 year-olds (43% vs. 27% of 25-30 year-olds and 31% of 20-24 year-olds) and among respondents in secondary school (47%-48% vs. 35%-36% for respondents in higher levels of training). For more details, see annex table 2b.

Flash EB No 319a – Youth on the move Analytical report
page 17
3. Participation in political elections Among young people in the EU who were old enough to vote, roughly 8 in 10 (79%) said that they had voted in a political election at the local, regional, national or EU level in the past three years; a fifth of respondents said they had not voted in an election in that time frame. Across all EU Member States (the exception being Lithuania), a majority of young adults − who were old enough to vote – said they had participated in an election at the local, regional, national or EU level in the three years prior to the survey; the proportion of “voters” ranged from 67% in Luxembourg to 93% in Belgium (where voting is compulsory). Poland, Austria, Malta and Sweden had results close to those of Belgium; in these countries, 90%-92% of eligible young people had voted in an election. Lithuania was the only country where less than half (47%) of young people, eligible to vote, said they had participated in an election in the past three years. Other countries with low proportions of young people who said they had voted in an election were Luxembourg, the UK, Ireland, Finland, Spain, Italy and the Czech Republic (67%-72%). Participation in elections at the local, regional, national or EU level
93 92 91 91 90 88 86 85 85 84 84 82 82 82 80 80 79 78 78 78 72 71 70 68 68 68 67
47
7 7 8 9 10 12 14 15 15 15 15 17 18 18 20 19 20 21 22 21 2822 30 30 31 31 31
52
0
20
40
60
80
100
BE
SE
MT
AT
PL
NL
DK
EL SI
SK
RO
HU
BG
FR
LV
DE
EU
27
CY
EE
PT
CZ IT ES FI
IE UK
LU LT
Yes No DK/NA
Q3. During the last 3 years, did you vote in any political election at the local, regional, national or EU level? If you were, at that time, not eligible to vote, please say so.
Base: respondents who were old enough to vote, % by country Socio-demographic considerations This section focuses solely on respondents who said they were old enough to vote. The older these respondents were, the more likely they were to answer that they had voted in local, regional, national or EU elections in the past three years. For example, 78% of 20-24 year-olds said that they had voted in an election compared to 82% of 25-30 year-olds. Similarly, students in higher levels of education (i.e. older students) were more likely to have voted in an election. Educational attainment was also positively related to political participation: while half of young adults who had left the educational system before completing their lower secondary education said they had voted in an election in the past three years, this proportion was 88% among those with a higher education qualification. Somewhat more than 8 in 10 (82%) full-time working respondents said they had participated in an election at the local, regional, national or EU level; this proportion was lower among non-working respondents (76% for “full-time” students and 74% for other non-working respondents – no longer in education – such as homemakers and the unemployed) and part-time working respondents (73%; note: the corresponding figure for part-time working students was 83%).

Analytical report Flash EB No 319a – Youth on the move
page 18
In regard to respondents’ household composition, single parents were less likely to have voted in local, regional, national or EU elections in the past three years: 71% compared to 78%-81% of respondents across all other household types. Finally, looking at respondents’ place of residence, the survey showed that, compared to urban residents, a larger proportion of metropolitan and rural residents said that they had participated in an election in the past three years (81%-82% vs. 75%). For more details, see annex table 3c.

Flash EB No 319a – Youth on the move Analytical report
page 19
4. Participation in voluntary activities Roughly a quarter (24%) of young adults in the EU said that they had been involved in an organised voluntary activity in the year prior to the survey; 75% had not participated in this type of voluntary activity. At the individual country level, the highest proportions of young people who had participated in an organised voluntary activity in the past 12 months were observed in Slovenia, Denmark, Ireland and the Netherlands (36%-40%). Conversely, young Swedes and Italians (both 13%) were the least likely to have taken part in an organised voluntary activity in that time frame. In Poland, Greece and Hungary, roughly a sixth of young people had been involved in such a voluntary activity (16%-17%). Participation in organised voluntary activities
40 38 36 36 30 29 29 29 29 28 27 26 25 25 24 23 23 22 22 22 22 21 20 17 16 16 13 13
60 62 64 64 69 70 71 71 70 72 73 74 75 75 75 77 77 78 78 78 78 79 79 83 84 84 86 85
0
20
40
60
80
100
NL IE DK SI
LV
UK
DE
BE
LT
AT
MT
FR
EE
RO
EU
27
ES
LU
CY FI
BG
CZ
PT
SK
HU
EL
PL
SE IT
Yes No DK/NA
Q4. Have you been involved in any organised voluntary activities in the past year?
Base: all respondents, % by country
Voluntary actions aimed at changing one’s local community At the EU level, about half (51%) of young adults – who had been involved in an organised voluntary activity in the past 12 months – said that this activity had been aimed at changing something in their local community/environment. Still focusing solely on young people who said they had participated in an organised voluntary activity in the year prior to the survey, respondents in Lithuania and Hungary were the most likely to answer that this activity had been aimed at changing something in their local community (72%-73%). In 12 other EU Member States, a majority of respondents answered in the same way (from 51% in Bulgaria to 68% in Romania). Young adults in Denmark (34%), Finland (36%), France (37%), Cyprus (39%) and the Netherlands (40%), on the other hand, were the least likely to say that the voluntary activity they had contributed to, had been aimed at changing something in their local community.

Analytical report Flash EB No 319a – Youth on the move
page 20
73 72 68 66 66 64 64 63 61 58 58 57 55 54 51 51 48 47 45 45 45 44 44 40 39 37 36 34
27 27 31 33 34 35 36 37 38 42 43 43 42 45 48 49 52 53 53 55 54 55 55 60 61 63 63 66
0
20
40
60
80
100
HU LT
RO
LV
PT
AT
EE
SK SI
EL IT IE DE
UK
EU
27
BG
CZ
MT
SE
LU PL
BE
ES
NL
CY
FR FI
DK
Yes No DK/NA
Q5. Was the voluntary action aimed at changing something in your local community?Base: respondents who have been involved in any organised voluntary activities, % by country
Participation in organised voluntary activities:Voluntary actions aimed at changing respondents’ local communities
Formal recognition of participation in voluntary activities A quarter of young adults in the EU – who had been involved in an organised voluntary activity in the past 12 months – had received some kind of formal recognition (e.g. a certificate or diploma) for their participation. The individual country results showed that, among respondents who had participated in an organised voluntary activity in the past year, those in Cyprus (44%) were the most likely to have received formal acknowledgment of their participation. Poland and Romania were the closest to Cyprus with more than a third of respondents who had received a certificate or diploma for their participation in a voluntary activity (39% and 35%, respectively). Young people in France, on the other hand, were the least likely to say that they had received any formal recognition for their voluntary work (7%); this proportion was also low among young people in the Netherlands (12%).
44 39 35 32 31 29 28 28 28 27 27 26 25 24 23 23 23 23 22 21 21 18 16 16 16 16 12 7
56 61 66 68 69 71 72 72 72 72 73 74 75 76 76 76 77 78 79 79 80 82 84 84 84 84 88 93
0
20
40
60
80
100
CY
PL
RO
DE
UK
BG
PT
EE
LT
AT IT LU
EU
27
ES SI
CZ FI
HU IE
MT
EL
LV
SK
DK
SE
BE
NL
FR
Yes No DK/NA
Q6. Did you receive a certificate, diploma or other formal recognition for your participation in these voluntary activities?Base: respondents who have been involved in any organised voluntary activities, % by country
Participation in organised voluntary activities:Receiving a certificate or diploma for voluntary activities

Flash EB No 319a – Youth on the move Analytical report
page 21
Socio-demographic considerations Although young men and women were about equally likely to have participated in an organised voluntary activity in the past 12 months, more variation was seen across other socio-demographic groups. For example, 28% of rural residents, compared to 22%-23% of city dwellers, had volunteered in the past 12 months. Similarly, 28% of respondents in the educational system gave a similar response, compared to 21% of respondents who had completed their studies. In regards to respondents’ age, it was noted that roughly a fifth of 15-24 year-olds (25%-26%) said they had been involved in an organised voluntary activity in the year prior to the survey; this proportion was somewhat lower for 25-30 year-olds (22%). Participation in organised voluntary activities
26
73
1
Q4. Have you been involved in any organised voluntary activities in the past year?Base: all respondents, %EU27
Yes No DK/ΝΑ
25
74
0
22
78
0
15-19 year-olds 20-24 year-olds 25-30 year-olds
Among respondents still in education, students in vocational training were less likely than their counterparts to have participated in an organised voluntary activity in the past year (23% vs. 27%-30% across other educational categories). Among respondents who had completed their education, those who had obtained higher levels of education were more likely to have been involved in voluntary activities (26% of those with a higher education qualification vs. 17% of respondents who had left school before completing secondary education). Looking at respondents’ work situation, it was noted that young people working alongside their studies were the most likely to have volunteered: 36% for those with a part-time job and 30% for those with a full-time job, compared to 25% of “full-time” students. Non-working respondents (no longer in education), on the other hand, were the least likely to have participated in an organised voluntary activity in the past 12 months (for example, 15% of homemakers and respondents on maternity/paternity leave and 16% of unemployed respondents); they were followed by full-time working respondents (22%). The younger the respondents were, the more likely they were to have received a formal recognition for their voluntary activities : while 34% of 15-19 year-olds – who had participated in an organised voluntary activity in the past 12 months – said that they had received a certificate or diploma for their participation in this activity, this proportion dropped to 16% for 25-30 year-olds. Similarly, respondents still in education – and especially those in secondary levels of education – were more likely than those who had completed their education to have received a certificate or diploma for their participation in voluntary activities (30% vs. 17%).

Analytical report Flash EB No 319a – Youth on the move
page 22
Participation in organised voluntary activities:Receiving a certificate or diploma for voluntary activities
34
66
0
Q6. Did you receive a certificate, diploma or other formal recognition for your participation in these voluntary activities?Base: respondents who have been involved in any organised voluntary activities, %EU27
Yes No DK/ΝΑ
26
74
016
84
0
15-19 year-olds 20-24 year-olds 25-30 year-olds
Some differences were also seen in the proportion of respondents who had participated in voluntary activities aimed at changing something in their local community. For example, focusing solely on young people who had participated in an organised voluntary activity in the past 12 months, 54% of 25-30 year-olds said that this activity had been aimed at changing something in their local community, compared to 48%-50% of 15-24 year-olds. For more details, see annex tables 4b, 5b and 6b.

Flash EB No 319a – Youth on the move Analytical report
page 23
5. Participation in international youth projects About a tenth (9%) of young adults in the EU said that, in the year prior to the survey, they had participated in activities or projects aiming at fostering cooperation with young people from other countries; more precisely, 6% had taken part in activities or projects with young people from other European countries, while 4% mentioned activities with young people from other continents.
Participation in activities or projects aimed at fostering cooperation with youth from other countries
6
4
91
0
Yes, in activities / projects with young peoplefrom other European countries
Yes, in activities / projects with young peoplefrom other continents
No
DK/NA
Q7. Have you participated in any activities or projects during the past year aimed at
fostering cooperation with youth from other countries?Base: all respondents, % of ’mentions’ shown, EU27
Yes: 9%
Across all countries, a minority of young people said they had been involved in activities or projects aiming at fostering cooperation with young people from other countries; the proportion of respondents who had participated in this type of activity in the year prior to the survey ranged from 4% in Italy to 16% in Austria. Participation in activities or projects aimed at fostering cooperation with young people from other countries
16 15 14 14 14 14 13 13 13 12 11 10 10 9 9 9 9 9 9 9 8 7 7 7 7 6 5 4
84 85 86 86 86 86 87 87 87 87 89 90 90 91 91 91 91 91 91 91 92 93 93 93 93 94 94 93
0
20
40
60
80
100
AT
LU
EE
DE
LT SI
FI
DK
HU
LV
BE
RO
CY
BG
MT
CZ
FR
SE
EU
27
NL
ES
PT
PL
EL
SK
UK IE IT
Yes No DK/NA
Q7. Have you participated in any activities or projects during the past year aimed at fostering cooperation with youth from other countries?
Base: all respondents, % by country The proportion of young people who had taken part in activities or projects with young people from other European countries ranged from 2% in Italy to 13% in Slovenia. Similarly, the proportion that had participated in activities or projects aiming at fostering cooperation with young people from other continents ranged from 1% in Bulgaria, Poland and Romania to 8% in Germany and Austria. Socio-demographic considerations While 14% of 15-19 year-olds said they had participated in activities or projects aiming at fostering cooperation with young people from other countries, in the year prior to the survey, this proportion was 8% for 20-24 year-olds and 6% for 25-30 year-olds. Similarly, those still in education (12%) –

Analytical report Flash EB No 319a – Youth on the move
page 24
especially those currently in secondary level education (15%-16%) – were more likely than those who had completed their education (5%) to have participated in an international youth project in the past 12 months.
Participation in activities or projects aimed at fostering cooperation with young people from other countries
14
86
1
Q7. Have you participated in any activities or projects during the past year aimed at fostering cooperation with youth from other countries?
Base: all respondents, %EU27
Yes No DK/ΝΑ
8
92
1 6
93
0
15-19 year-olds 20-24 year-olds 25-30 year-olds
Single young adults, either living with their parents, sharing accommodation or living on their own, were also more likely to answer that they had participated in activities or projects aiming at fostering cooperation with young people from other countries (10%-13% vs. 6% of young couples without children and 5%-7% of young parents). Among those who had completed their education, respondents with the highest level of education were somewhat more likely to have participated in an international youth project in the past 12 months (8% of respondents with a higher education qualification, compared to 2% of those who had left school without completing lower secondary education). Young people working part-time alongside their studies were – once again – the most likely to have participated in activities or projects aiming at fostering cooperation with young people from other countries (16%); they were followed by those with a full-time job alongside their studies (11%) and “full-time” students (12%). As noted above, respondents who had completed their studies were less likely to have participated in an international youth project in the past 12 months: 6% for full-time working respondents and 4% for part-time working and non-working respondents. Finally, looking at respondents’ place of residence, metropolitan residents were somewhat more likely than those living in urban and rural areas to have participated in an international youth project in the past 12 months (12% vs. 8%-9%). For more details, see annex table 7c.

Flash EB No 319a – Youth on the move Analytical report
page 25
6. Summary of variations in participation rates – by young people’s socio-demographic characteristics This last chapter summarises young people’s participation rates in various social, cultural and political activities in terms of their socio-demographic characteristics, such as their educational attainment and their work situation. The younger the respondents were, the more likely they were to have been active in various organisations, to have participated in cultural and arts activities, to have taken part in an organised voluntary activity and to have been involved in activities or projects aiming at fostering cooperation with young people from other countries. For example, as noted in Chapter 1, 57% of 15-19 year-olds had participated in an activity of a sports club, youth organisation or cultural organisation in the year prior to the survey; this proportion decreased to 45% for 20-24 year-olds and 39% for 25-30 year-olds. Similarly, respondents still in education – and especially those in secondary levels of education – were more likely than those who had completed their education to have participated in organisational activities, cultural activities, voluntary work and international youth projects. For example, students in vocational training were less likely than their counterparts to have taken part in an organised voluntary activity in the past year (23% vs. 27%-30% across other educational categories – see Chapter 4). Among respondents who had completed their education, those who had obtained higher levels of education were more likely to have participated in organisational, cultural, voluntary and international activities. For example, it was noted in Chapter 2 that, for all cultural activities listed in the survey, the largest differences in participation rates were found when comparing respondents with the lowest level of educational attainment and those with the highest level. Furthermore, educational attainment was also positively related to political participation: while 50% of those who had left the educational system before completing their lower secondary education had voted in an election in the past three years, this proportion was 88% among those with a higher education qualification (see Chapter 3). Finally, looking at respondents’ work situation, two groups were worthy of particular attention: non-working respondents (no longer in education) and young people who had a part-time job alongside their studies. While the latter appeared to be the “most active” group, the former were each time among the least likely to have participated in various activities. For example, while just 6% of respondents with a disability and 8% of the unemployed had been involved in a cultural organisation, this proportion increased to 19% for respondents who had a part-time job alongside their studies (see Chapter 2).

Flash EB Series #319a
Youth on the move
Annex tables and
survey details
THE GALLUP ORGANIZATION

Flash EB No 319a – Youth on the move Annex
page 27
I. Annex tables Table 1a. Participation in activities of various organisations – by country .......................................... 28
Table 1b. Participation in activities of various organisations – by segments ....................................... 29
Table 2a. Participation in cultural and arts activities – by country ....................................................... 31
Table 2b. Participation in cultural and arts activities – by segments .................................................... 32
Table 3a. Participation in elections at the local, regional, national or EU level – by country .............. 34
Table 3b. Participation in elections at the local, regional, national or EU level – by segments ........... 35
Table 3c. Participation in elections at the local, regional, national or EU level – by segments ........... 37
Table 4a. Participation in organised voluntary activities – by country ................................................. 39
Table 4b. Participation in organised voluntary activities – by segments .............................................. 40
Table 5a. Voluntary actions aimed at changing respondents’ local communities – by country ........... 42
Table 5b. Voluntary actions aimed at changing respondents’ local communities – by segments ........ 43
Table 6a. Receiving a certificate or diploma for voluntary activities – by country .............................. 45
Table 6b. Receiving a certificate or diploma for voluntary activities – by segments ........................... 46
Table 7a. Participation in activities or projects aimed at fostering cooperation with young people from other countries – by country ........................................................................................ 48
Table 7b. Participation in activities or projects aimed at fostering cooperation with young people from other countries – by segments ...................................................................................... 49
Table 7c. Participation in activities or projects aimed at fostering cooperation with young people from other countries – by segments ...................................................................................... 51

Annex Flash EB No 319a – Youth on the move
page 28
Table 1a. Participation in activities of various organisations – by country
QUESTION: Q1_a-j. Have you in the past year participated in any activities of the following organisations?
% of “Yes” shown
To
tal
N
A s
po
rts
clu
b
A y
ou
th c
lub
, le
isu
re-t
ime
clu
b o
r a
ny
kin
d o
f y
ou
th
org
an
isa
tio
n
A c
ult
ura
l o
rga
nis
ati
on
A p
oli
tica
l o
rga
nis
ati
on
or
a p
oli
tica
l p
art
y
A l
oca
l o
rga
nis
ati
on
a
imed
at
imp
rov
ing
yo
ur
loca
l co
mm
un
ity
an
d/o
r lo
cal
env
iro
nm
ent
An
org
an
isa
tio
n a
ctiv
e in
th
e d
om
ain
of
glo
ba
l cl
ima
te c
ha
ng
e/g
lob
al
wa
rmin
g
An
org
an
isa
tio
n
pro
mo
tin
g h
um
an
rig
hts
o
r g
lob
al
dev
elo
pm
ent
An
y o
ther
no
n-
go
ver
nm
enta
l o
rga
nis
ati
on
s
EU27 27029 33.6 18.1 13.9 4.6 11.1 3.2 5.2 7.9
COUNTRY
Belgium 1000 47.6 25 17.5 4.8 12.7 5.4 8 4.5
Bulgaria 1000 16.8 10.2 9.3 3.6 6.8 3.4 5.7 4.6
Czech Rep. 1002 25.3 13.8 19.1 3.3 7.5 1.5 3.5 6.2
Denmark 1003 42.2 16.3 11.6 6.7 10.5 4.4 11.1 8.7
Germany 1002 47.1 19.9 16 4.9 13.4 2.4 3.4 6.7
Estonia 1000 34.7 16.7 16.3 5 9.7 2.1 2.1 8.8
Greece 1005 21 11.2 9.9 7 11.6 5 5.1 7.4
Spain 1002 26.7 14.2 10.4 2.7 6 3.3 6.3 8.2
France 1000 39.6 17.7 12.4 2 8.3 2.2 2.4 5.7
Ireland 1003 52.7 26.1 14.7 6.1 24.3 5.6 8.4 8.2
Italy 1003 36.3 22.1 20.4 5.5 9.7 3.4 7.1 12
Cyprus 1001 18 11.3 8 7.6 8.9 3.1 4.5 6.7
Latvia 1001 25.8 15.1 16.2 3 9.8 1.4 2.6 6.8
Lithuania 1000 24.3 17 13.5 4.7 12.3 2.9 4.7 9.3
Luxembourg 1000 46.2 25.7 19.6 4.5 11.6 4.4 5.8 7.3
Hungary 1000 22.9 11.2 9.6 2.6 9.7 2.1 1.3 5.1
Malta 1004 19.8 15.7 9.4 3.5 9.2 2.9 3.4 10.8
Netherlands 1000 58.7 18.7 12.3 4.3 9.7 3.7 7.6 6.7
Austria 1000 37.5 22.3 20.6 9.9 14.6 3.5 7.2 6.7
Poland 1000 14.7 9.4 10.8 2.4 8.5 1.3 3.1 6.9
Portugal 1001 23.2 13.2 14.9 7.8 14.7 2.6 4.6 7.3
Romania 1000 13.2 24 13.6 7.1 14.9 5.3 6.2 8.6
Slovenia 1000 28.9 19.1 20.7 4.5 17.1 3.3 5.7 8.4
Slovakia 1000 29 13.3 20.2 3.9 6 2 2.8 4.8
Finland 1001 28.4 19.4 13.2 4.1 12.2 3.8 7.8 9
Sweden 1001 35.6 16.6 13.7 7.3 9.6 4.8 8.4 10.7
United Kingdom 1000 35.7 23.5 11.5 6.5 16 4.9 7.6 10.5

Flash EB No 319a – Youth on the move Annex
page 29
Table 1b. Participation in activities of various organisations – by segments
QUESTION: Q1_a-j. Have you in the past year participated in any activities of the following organisations?
% of “Yes” shown
To
tal
N
A s
po
rts
clu
b
A y
ou
th c
lub
, le
isu
re-t
ime
clu
b o
r a
ny
kin
d o
f y
ou
th o
rga
nis
ati
on
A c
ult
ura
l o
rga
nis
ati
on
A p
oli
tica
l o
rga
nis
ati
on
or
a
po
liti
cal
pa
rty
A l
oca
l o
rga
nis
ati
on
aim
ed a
t im
pro
vin
g y
ou
r lo
cal
com
mu
nit
y
an
d/o
r lo
cal
env
iro
nm
en
t
An
org
an
isa
tio
n a
ctiv
e in
th
e d
om
ain
of
glo
ba
l cl
ima
te
cha
ng
e/g
lob
al
wa
rmin
g
An
org
an
isa
tio
n p
rom
oti
ng
h
um
an
rig
hts
or
glo
ba
l d
evel
op
men
t
An
y o
ther
no
n-g
ov
ern
me
nta
l o
rga
nis
ati
on
s
EU27 27029 33.6 18.1 13.9 4.6 11.1 3.2 5.2 7.9
SEX
Male 13759 39.3 19.4 13.5 5.5 11.5 3.4 5.2 8.2
Female 13270 27.8 16.8 14.3 3.6 10.7 3 5.2 7.6
AGE
15 - 19 7710 44 26.9 13.9 3.9 10.9 3.9 5.8 7.2
20 - 24 8502 31.9 17.5 13.9 4.5 9.9 3.1 5.3 8
25 - 30 10748 27.6 12.4 13.8 5.2 12.1 2.7 4.7 8.4
CURRENTLY IN
EDUCATION
Yes 13937 39 23.1 16.1 4.9 11.3 3.9 6.2 8.2
No 13071 27.9 12.9 11.6 4.3 10.8 2.5 4.1 7.6
CURRENT EDUCATION
Lower secondary level 1200 46.7 27.6 13.3 1.9 8.5 4.6 4.1 6.1
Upper secondary level,
general education 3538 47.4 28.4 16.4 3.3 11.4 3.7 6.3 7
Upper secondary level,
vocational education and
training, including
apprenticeships
2292 36.1 21.5 11.7 4 10.4 2.8 4.4 4.7
Post-secondary, non-higher
education 1012 36 19.5 11.3 4.5 11.2 3.9 5.1 10
Higher education 5826 34 20.2 19 6.7 12.3 4.3 7.5 10.4
COMPLETED
EDUCATION
Left school before
completing lower secondary
education
428 22.3 9.4 5.7 4.3 9.2 1.5 1.3 4.6
Lower secondary level 1540 24.7 10.8 8.7 2.4 8.2 1.3 3.3 5.3
Upper secondary level,
general education 2561 26 13.7 11.1 5.1 9.7 2.8 3.6 6.4
Upper secondary level,
vocational education and
training, including
apprenticeships
3010 26.3 10.9 8.3 2.9 10.2 1.2 2.2 5.9
Post-secondary, non-higher
education 1175 29.7 14 12.1 4.7 12.6 2.7 4.4 9.8
Higher education 4319 31.4 14.4 15.5 5.4 12.4 3.6 6.2 10.3

Annex Flash EB No 319a – Youth on the move
page 30
To
tal
N
A s
po
rts
clu
b
A y
ou
th c
lub
, le
isu
re-t
ime
clu
b o
r a
ny
kin
d o
f y
ou
th o
rga
nis
ati
on
A c
ult
ura
l o
rga
nis
ati
on
A p
oli
tica
l o
rga
nis
ati
on
or
a
po
liti
cal
pa
rty
A l
oca
l o
rga
nis
ati
on
aim
ed a
t im
pro
vin
g y
ou
r lo
cal
com
mu
nit
y
an
d/o
r lo
cal
env
iro
nm
en
t
An
org
an
isa
tio
n a
ctiv
e in
th
e d
om
ain
of
glo
ba
l cl
ima
te
cha
ng
e/g
lob
al
wa
rmin
g
An
org
an
isa
tio
n p
rom
oti
ng
h
um
an
rig
hts
or
glo
ba
l d
evel
op
men
t
An
y o
ther
no
n-g
ov
ern
me
nta
l o
rga
nis
ati
on
s
EU27 27029 33.6 18.1 13.9 4.6 11.1 3.2 5.2 7.9
CURRENTLY IN WORK
Full-time 9384 32.8 13.9 12.9 5 12.1 2.8 3.9 8
Part-time 4212 39.6 22.3 16.6 6.9 14 5.5 9.5 10.6
No 13399 32.3 19.8 13.7 3.6 9.5 2.8 4.7 7
CURRENT SITUATION
Unemployed 2291 20.6 10.6 7.7 2.4 6.6 2.2 4 6.7
Disability or illness 117 16 16.3 5.6 2.1 11.4 4.6 3.7 11.9
On maternity/paternity/
parental leave 455 16.7 9.4 13.1 1.8 11.8 0.5 1.7 3.9
Homemaker 496 13.1 6.6 9.4 4.2 10.5 0.5 0.7 7.1
Other 326 28.7 19.8 18.9 7.7 14.3 4.5 2.9 9.9
CURRENTLY IN WORK /
EDUCATION
Full-time work, not in
education 7738 31.5 12.9 12.2 4.8 11.8 2.6 3.7 7.5
Part-time work, not in
education 1632 28.6 15.8 12.8 4.4 11.5 2.9 7.8 9.2
Full-time work, in education 1639 38.8 18.5 16.2 5.6 13.4 3.6 5.1 10.5
Part-time work, in education 2575 46.6 26.4 19 8.5 15.5 7.1 10.5 11.5
Full-time education, not
working 9713 37 23 15.3 3.8 9.9 3.1 5.3 6.9
Not in education, not
working 3680 20 11.3 9.7 3.1 8.6 2.1 3.3 7.1
CURRENT HH
SITUATION
Living with partner, no
children 3009 30.7 11.2 13.7 4.2 10.7 3.6 5.5 9.5
Living with partner, children
at home 3790 22.3 11.3 10.9 4.2 13.5 2.4 3.3 6
Single parent 763 26.8 16.2 11.5 6.2 12.1 4.5 7.9 9.6
Single, living with parents 15778 36.6 21.4 13.6 4.2 10.1 3.1 4.9 7.4
Single, living alone 2183 35.2 16 17.4 6 12.7 3 6.8 10.4
Single, sharing
accommodation 1343 39.4 19.4 21 7.5 14.7 5.3 8.4 10.1
URBANISATION
Metropolitan 5111 32.8 16.8 15.3 5.1 10.6 3.7 7 9.1
Urban 12692 32.8 17.4 14.2 4.3 9.5 3.4 5.5 8.2
Rural 9032 35.6 19.9 12.7 4.7 13.5 2.7 3.7 6.9
(continued)

Flash EB No 319a – Youth on the move Annex
page 31
Table 2a. Participation in cultural and arts activities – by country
QUESTION: Q2_a-d. Have you participated in any of the following cultural activities in the past year?
% of “Yes” shown
To
tal
N
Vis
ited
his
tori
cal
mo
nu
me
nts
(p
ala
ces,
ca
stle
s, c
hu
rch
es,
ga
rden
s, e
tc.)
, m
use
um
s o
r g
all
erie
s
Bee
n t
o t
he
cin
ema
or
a
con
cert
Bee
n t
o a
th
eatr
e, a
d
an
ce p
erfo
rma
nce
or
an
op
era
Pa
rtic
ipa
ted
in
an
a
ma
teu
r a
rtis
tic
act
ivit
y
(pla
yin
g a
mu
sica
l in
stru
men
t, s
ing
ing
, a
ctin
g,
da
nci
ng
, w
riti
ng
p
oet
ry,
ph
oto
gra
ph
y,
film
ma
kin
g)
EU27 27029 66.6 87.9 44.4 32.6
COUNTRY
Belgium 1000 56.9 90 44 27.9
Bulgaria 1000 71.1 81.1 51.4 23.5
Czech Rep. 1002 77.1 87.2 56.3 29.3
Denmark 1003 67.4 94.5 38.5 26.9
Germany 1002 72.2 90.9 48.7 45.2
Estonia 1000 76 91.2 61.4 38.3
Greece 1005 62.6 80.8 47.9 30
Spain 1002 69.6 90.2 41.3 31.3
France 1000 62 90.6 39.8 29.7
Ireland 1003 61.3 92.4 50.5 32.4
Italy 1003 64.5 91.2 36.7 29
Cyprus 1001 57.7 77.6 46.9 26.1
Latvia 1001 74.9 88.7 56.1 31.3
Lithuania 1000 67.7 84.4 52.8 32
Luxembourg 1000 69.9 92.6 45.6 34.7
Hungary 1000 65.5 80.3 49.5 27.2
Malta 1004 47.6 83.5 32.4 24.2
Netherlands 1000 57.5 88.2 43.8 29
Austria 1000 75 94.3 55.5 49.8
Poland 1000 69.8 88.1 42.9 30.7
Portugal 1001 70.6 88.5 45.6 26
Romania 1000 62.4 65.3 41 26.7
Slovenia 1000 72.7 94.5 53 34.5
Slovakia 1000 72.8 84.4 51.5 27.8
Finland 1001 65.6 91.2 49.7 32.5
Sweden 1001 65.8 91.2 42.1 33.8
United Kingdom 1000 63.3 86.6 46.5 32.2
Annex Flash EB No 319a – Youth on the move
page 32
Table 2b. Participation in cultural and arts activities – by segments
QUESTION: Q2_a-d. Have you participated in any of the following cultural activities in the past year?
% of “Yes” shown
To
tal
N
Vis
ited
his
tori
cal
mo
nu
me
nts
(p
ala
ces,
ca
stle
s, c
hu
rch
es,
ga
rden
s,
etc.
), m
use
um
s o
r g
all
erie
s
Bee
n t
o t
he
cin
ema
or
a
con
cert
Bee
n t
o a
th
eatr
e, a
da
nce
p
erfo
rma
nce
or
an
op
era
Pa
rtic
ipa
ted
in
an
am
ate
ur
art
isti
c a
ctiv
ity
(p
lay
ing
a
mu
sica
l in
stru
men
t,
sin
gin
g,
act
ing
, d
an
cin
g,
wri
tin
g p
oet
ry,
ph
oto
gra
ph
y,
film
ma
kin
g)
EU27 27029 66.6 87.9 44.4 32.6
SEX
Male 13759 64.4 88.3 39.8 31.4
Female 13270 68.8 87.5 49.2 33.7
AGE
15 - 19 7710 70.2 91.3 50.4 42.9
20 - 24 8502 64.2 90.5 42.5 31
25 - 30 10748 65.9 83.5 41.6 26.5
CURRENTLY IN EDUCATION
Yes 13937 71.4 92.5 50.4 39.5
No 13071 61.4 83 38 25.2
CURRENT EDUCATION
Lower secondary level 1200 72.1 89.2 55.6 47.7
Upper secondary level, general
education 3538 76 92.6 55 46.7
Upper secondary level, vocational
education and training, including
apprenticeships
2292 61.9 89.3 40.6 35.1
Post-secondary, non-higher
education 1012 64.5 90.8 39.4 35
Higher education 5826 73.5 94.6 52.4 36
COMPLETED EDUCATION
Left school before completing lower
secondary education 428 38.4 67.8 18.4 16.8
Lower secondary level 1540 51 74.3 27.4 20.7
Upper secondary level, general
education 2561 55.8 81.5 33 22.4
Upper secondary level, vocational
education and training, including
apprenticeships
3010 53.7 80 28.5 21.5
Post-secondary, non-higher
education 1175 61.2 82.6 40.3 25.4
Higher education 4319 76.2 91 52.9 31.7
CURRENTLY IN WORK
Full-time 9384 66.5 87.8 43.2 27.2
Part-time 4212 69 90.1 48.5 37
No 13399 65.8 87.3 43.9 34.9

Flash EB No 319a – Youth on the move Annex
page 33
To
tal
N
Vis
ited
his
tori
cal
mo
nu
me
nts
(p
ala
ces,
ca
stle
s, c
hu
rch
es,
ga
rden
s,
etc.
), m
use
um
s o
r g
all
erie
s
Bee
n t
o t
he
cin
ema
or
a
con
cert
Bee
n t
o a
th
eatr
e, a
da
nce
p
erfo
rma
nce
or
an
op
era
Pa
rtic
ipa
ted
in
an
am
ate
ur
art
isti
c a
ctiv
ity
(p
lay
ing
a
mu
sica
l in
stru
men
t,
sin
gin
g,
act
ing
, d
an
cin
g,
wri
tin
g p
oet
ry,
ph
oto
gra
ph
y,
film
ma
kin
g)
EU27 27029 66.6 87.9 44.4 32.6
CURRENT SITUATION
Unemployed 2291 51.5 76.3 25.4 23.4
Disability or illness 117 37.9 69.3 24.9 22.3
On maternity/paternity/parental
leave 455 47.4 70.4 36.7 19.6
Homemaker 496 47.3 61.3 23.8 11.9
Other 326 69.2 82.9 51.3 42.8
CURRENTLY IN WORK /
EDUCATION
Full-time work, not in education 7738 65.7 87.1 42.1 25.8
Part-time work, not in education 1632 62.8 84 38.7 26.5
Full-time work, in education 1639 70.3 91.2 48.6 33.6
Part-time work, in education 2575 73 94 54.7 43.7
Full-time education, not working 9713 71.2 92.3 49.5 39.4
Not in education, not working 3680 51.6 73.9 29.1 23
CURRENT HH SITUATION
Living with partner, no children 3009 71.8 88.8 47.7 28.3
Living with partner, children at
home 3790 57.7 73.7 34.7 20.8
Single parent 763 57.6 83 39.7 26.9
Single, living with parents 15778 66.8 90.5 44.6 35.4
Single, living alone 2183 69.9 90 48.9 31.8
Single, sharing accommodation 1343 75.6 94.2 57.3 45.8
URBANISATION
Metropolitan 5111 73 93.6 54.1 35.5
Urban 12692 65.9 88.7 44 31.4
Rural 9032 64 83.6 39.5 32.7
(continued)

Annex Flash EB No 319a – Youth on the move
page 34
Table 3a. Participation in the elections at local, regional, national or EU level – by country
QUESTION: Q3. During the last 3 years, did you vote in any political election at the local, regional, national or EU level? If you were, at that time, not eligible to vote, please say so.
Total N % Yes
% No, did not
vote in an
election
% No, because
you were not old
enough to vote % DK/NA
EU27 27029 61.8 15.9 21.3 0.9
COUNTRY
Belgium 1000 72.6 5.4 21.8 0.2
Bulgaria 1000 62.3 13.5 24 0.2
Czech Rep. 1002 59.8 23.1 16.9 0.1
Denmark 1003 63.7 10.4 25.8 0.1
Germany 1002 63 14.6 21.5 0.9
Estonia 1000 62.1 17.7 20.1 0.1
Greece 1005 67.8 11.6 20.4 0.2
Spain 1002 54.6 23.2 21.9 0.3
France 1000 60.1 13.2 26.6 0.1
Ireland 1003 53.1 24.2 22.1 0.7
Italy 1003 56.4 17.8 20.6 5.2
Cyprus 1001 56 15.2 28.2 0.6
Latvia 1001 66.9 16.2 16.9 0
Lithuania 1000 34.1 37.2 27.9 0.7
Luxembourg 1000 49.9 23 25.8 1.3
Hungary 1000 66.5 14 19.4 0.1
Malta 1004 65.9 6 27.7 0.3
Netherlands 1000 67.7 9.2 22.6 0.4
Austria 1000 82.5 8.3 9 0.2
Poland 1000 74.1 8.5 17.5 0
Portugal 1001 59.6 16.4 23.2 0.7
Romania 1000 66.1 11.7 21.5 0.7
Slovenia 1000 71.8 12.6 15.5 0.1
Slovakia 1000 71.3 13.1 15.3 0.2
Finland 1001 52.5 23.2 23.1 1.2
Sweden 1001 73.9 5.7 19.8 0.6
United Kingdom 1000 53.5 24.9 20.8 0.8

Flash EB No 319a – Youth on the move Annex
page 35
Table 3b. Participation in the elections at local, regional, national or EU level – by segments
QUESTION: Q3. During the last 3 years, did you vote in any political election at the local, regional, national or EU level? If you were, at that time, not eligible to vote, please say so.
Total N % Yes
% No, did
not vote in
an
election
% No, because
you were not
old enough to
vote
%
DK/NA
EU27 27029 61.8 15.9 21.3 0.9
SEX
Male 13759 62 16.1 20.9 1
Female 13270 61.5 15.8 21.8 0.9
AGE
15 - 19 7710 17.5 10.2 71.6 0.7
20 - 24 8502 76.5 19.9 2.1 1.6
25 - 30 10748 81.8 17 0.7 0.6
CURRENTLY IN EDUCATION
Yes 13937 48.2 11.9 38.9 1
No 13071 76.2 20.2 2.7 0.9
CURRENT EDUCATION
Lower secondary level 1200 7.2 6.1 86.3 0.4
Upper secondary level, general
education 3538 16.2 9 74.1 0.7
Upper secondary level, vocational
education and training, including
apprenticeships
2292 39.3 14.3 45.8 0.6
Post-secondary, non-higher education 1012 54.6 16.8 28.2 0.4
Higher education 5826 78.3 13.3 6.9 1.5
COMPLETED EDUCATION
Left school before completing lower
secondary education 428 44.6 44.3 10.5 0.7
Lower secondary level 1540 64.4 27.4 7.3 0.9
Upper secondary level, general
education 2561 69.4 24.5 4.3 1.8
Upper secondary level, vocational
education and training, including
apprenticeships
3010 76.4 21.6 1.6 0.4
Post-secondary, non-higher education 1175 76.2 21 1.2 1.6
Higher education 4319 87.7 11.4 0.4 0.5
CURRENTLY IN WORK
Full-time 9384 79.9 17.2 2.3 0.5
Part-time 4212 65.2 17.3 16.2 1.2
No 13399 48 14.6 36.3 1.1
CURRENT SITUATION
Unemployed 2291 67.1 23.1 8.4 1.3
Disability or illness 117 53.7 44.9 1.4 0
On maternity/paternity/parental
leave 455 75.5 22.7 1.7 0.1
Homemaker 496 73.8 20.2 4.4 1.6
Other 326 74.3 15.4 8.1 2.2
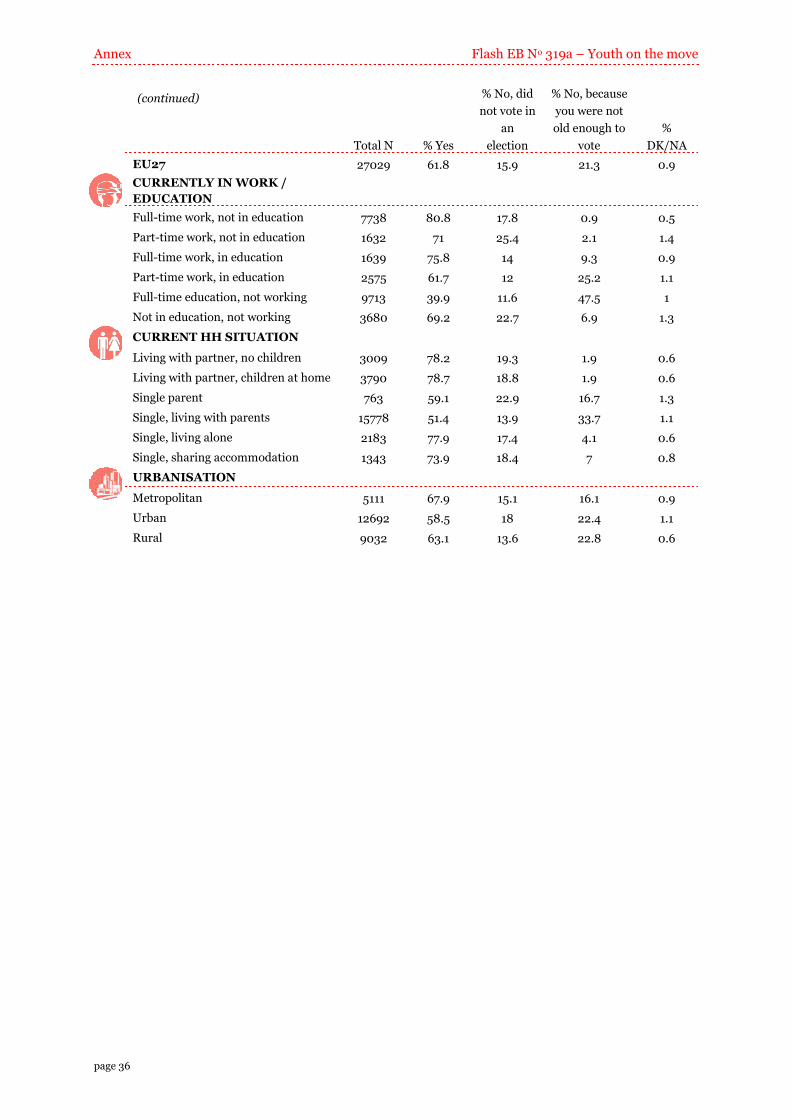
Annex Flash EB No 319a – Youth on the move
page 36
Total N % Yes
% No, did
not vote in
an
election
% No, because
you were not
old enough to
vote
%
DK/NA
EU27 27029 61.8 15.9 21.3 0.9
CURRENTLY IN WORK /
EDUCATION
Full-time work, not in education 7738 80.8 17.8 0.9 0.5
Part-time work, not in education 1632 71 25.4 2.1 1.4
Full-time work, in education 1639 75.8 14 9.3 0.9
Part-time work, in education 2575 61.7 12 25.2 1.1
Full-time education, not working 9713 39.9 11.6 47.5 1
Not in education, not working 3680 69.2 22.7 6.9 1.3
CURRENT HH SITUATION
Living with partner, no children 3009 78.2 19.3 1.9 0.6
Living with partner, children at home 3790 78.7 18.8 1.9 0.6
Single parent 763 59.1 22.9 16.7 1.3
Single, living with parents 15778 51.4 13.9 33.7 1.1
Single, living alone 2183 77.9 17.4 4.1 0.6
Single, sharing accommodation 1343 73.9 18.4 7 0.8
URBANISATION
Metropolitan 5111 67.9 15.1 16.1 0.9
Urban 12692 58.5 18 22.4 1.1
Rural 9032 63.1 13.6 22.8 0.6
(continued)

Flash EB No 319a – Youth on the move Annex
page 37
Table 3c. Participation in elections at the local, regional, national or EU level – by segments
QUESTION: Q3. During the last 3 years, did you vote in any political election at the local, regional, national or EU level? If you were, at that time, not eligible to vote, please say so.
Total N % Yes
% No, did not
vote in an
election % DK/NA
EU27 21258 78.5 20.3 1.2
SEX
Male 10878 78.4 20.4 1.2
Female 10381 78.6 20.2 1.2
AGE
15 - 19 2190 61.7 35.8 2.5
20 - 24 8325 78.1 20.3 1.6
25 - 30 10676 82.3 17.1 0.6
CURRENTLY IN EDUCATION
Yes 8522 78.8 19.5 1.7
No 12716 78.4 20.8 0.9
CURRENT EDUCATION
Lower secondary level 164 53.0 44.5 2.4
Upper secondary level, general
education 917 62.5 34.7 2.8
Upper secondary level, vocational
education and training, including
apprenticeships
1241 72.6 26.3 1.0
Post-secondary, non-higher education 727 76.1 23.4 0.6
Higher education 5422 84.2 14.3 1.6
COMPLETED EDUCATION
Left school before completing lower
secondary education 383 49.9 49.3 0.8
Lower secondary level 1427 69.4 29.6 1.0
Upper secondary level, general
education 2450 72.5 25.6 1.9
Upper secondary level, vocational
education and training, including
apprenticeships
2961 77.7 21.9 0.4
Post-secondary, non-higher education 1161 77.1 21.3 1.6
Higher education 4301 88.1 11.5 0.5
CURRENTLY IN WORK
Full-time 9164 81.8 17.6 0.6
Part-time 3528 77.9 20.7 1.4
No 8534 75.3 23.0 1.7
CURRENT SITUATION
Unemployed 2098 73.3 25.2 1.5
Disability or illness 115 54.8 46.1 0.0
On maternity/paternity/parental
leave 447 76.7 23.0 0.2
Homemaker 474 77.2 21.1 1.7
Other 300 80.7 16.7 2.3

Annex Flash EB No 319a – Youth on the move
page 38
Total N % Yes
% No, did not
vote in an
election % DK/NA
EU27 21258 78.5 20.3 1.2
CURRENTLY IN WORK /
EDUCATION
Full-time work, not in education 7671 81.5 18.0 0.5
Part-time work, not in education 1597 72.6 26.0 1.4
Full-time work, in education 1486 83.6 15.5 0.9
Part-time work, in education 1926 82.5 16.1 1.5
Full-time education, not working 5100 76.0 22.1 1.9
Not in education, not working 3428 74.3 24.4 1.3
CURRENT HH SITUATION
Living with partner, no children 2953 79.6 19.7 0.6
Living with partner, children at home 3717 80.3 19.1 0.6
Single parent 636 70.9 27.5 1.6
Single, living with parents 10464 77.5 20.9 1.6
Single, living alone 2093 81.2 18.2 0.6
Single, sharing accommodation 1249 79.5 19.8 0.8
URBANISATION
Metropolitan 4289 81.0 18.0 1.0
Urban 9843 75.4 23.2 1.5
Rural 6976 81.7 17.6 0.7
(continued)

Flash EB No 319a – Youth on the move Annex
page 39
Table 4a. Participation in organised voluntary activities – by country
QUESTION: Q4. Have you been involved in any organised voluntary activities in the past year?
Total N % Yes % No % DK/NA
EU27 27029 24.2 75.4 0.4
COUNTRY
Belgium 1000 29 70.9 0.1
Bulgaria 1000 21.5 78.1 0.3
Czech Rep. 1002 21.5 77.9 0.6
Denmark 1003 35.9 64 0.1
Germany 1002 29.2 70.5 0.3
Estonia 1000 25.2 74.7 0.1
Greece 1005 16.3 83.6 0.1
Spain 1002 23.4 76.5 0.2
France 1000 26.4 73.6 0
Ireland 1003 38 61.7 0.3
Italy 1003 13 85.2 1.8
Cyprus 1001 22.4 77.5 0.1
Latvia 1001 30 69.3 0.7
Lithuania 1000 28.8 69.9 1.3
Luxembourg 1000 22.6 77.2 0.2
Hungary 1000 17.3 82.5 0.2
Malta 1004 27.2 72.7 0.1
Netherlands 1000 39.7 60 0.4
Austria 1000 28 71.7 0.3
Poland 1000 15.8 84.1 0.1
Portugal 1001 20.6 79.3 0.1
Romania 1000 24.8 75 0.3
Slovenia 1000 35.6 64.2 0.1
Slovakia 1000 20.3 79.2 0.6
Finland 1001 21.8 78.2 0
Sweden 1001 13.2 86 0.7
United Kingdom 1000 29.3 70.4 0.3

Annex Flash EB No 319a – Youth on the move
page 40
Table 4b. Participation in organised voluntary activities – by segments
QUESTION: Q4. Have you been involved in any organised voluntary activities in the past year?
Total N % Yes % No % DK/NA
EU27 27029 24.2 75.4 0.4
SEX
Male 13759 23.6 76.2 0.2
Female 13270 24.8 74.6 0.6
AGE
15 - 19 7710 26.2 73.3 0.5
20 - 24 8502 25.1 74.4 0.4
25 - 30 10748 22 77.7 0.3
CURRENTLY IN EDUCATION
Yes 13937 27.5 72.1 0.4
No 13071 20.7 78.9 0.4
CURRENT EDUCATION
Lower secondary level 1200 28.1 71.2 0.7
Upper secondary level, general education 3538 26.6 72.8 0.5
Upper secondary level, vocational
education and training, including
apprenticeships
2292 23.2 76.6 0.2
Post-secondary, non-higher education 1012 29.7 69.7 0.6
Higher education 5826 29.2 70.6 0.2
COMPLETED EDUCATION
Left school before completing lower
secondary education 428 16.7 83.2 0.1
Lower secondary level 1540 16.1 83.7 0.2
Upper secondary level, general education 2561 16 83.7 0.3
Upper secondary level, vocational
education and training, including
apprenticeships
3010 19.6 80.2 0.3
Post-secondary, non-higher education 1175 21.3 76.2 2.5
Higher education 4319 26 73.9 0.1
CURRENTLY IN WORK
Full-time 9384 23.4 76.4 0.2
Part-time 4212 31.1 68.4 0.5
No 13399 22.6 77 0.4
CURRENT SITUATION
Unemployed 2291 15.6 83.9 0.5
Disability or illness 117 18.1 81.6 0.2
On maternity/paternity/parental leave 455 14.6 85.3 0.1
Homemaker 496 15.2 84.8 0
Other 326 23.4 75.3 1.3

Flash EB No 319a – Youth on the move Annex
page 41
Total N % Yes % No % DK/NA
EU27 27029 24.2 75.4 0.4
CURRENTLY IN WORK /
EDUCATION
Full-time work, not in education 7738 22 77.9 0.2
Part-time work, not in education 1632 24.3 75 0.7
Full-time work, in education 1639 30.2 69.6 0.2
Part-time work, in education 2575 35.5 64.1 0.4
Full-time education, not working 9713 25 74.7 0.4
Not in education, not working 3680 16.4 83 0.6
CURRENT HH SITUATION
Living with partner, no children 3009 22.7 77.1 0.2
Living with partner, children at home 3790 19.8 80 0.1
Single parent 763 22.6 76.5 0.9
Single, living with parents 15778 24.4 75.2 0.4
Single, living alone 2183 26.8 73 0.2
Single, sharing accommodation 1343 32.8 67 0.2
URBANISATION
Metropolitan 5111 23.4 76.5 0.2
Urban 12692 22.1 77.4 0.5
Rural 9032 27.8 72 0.2
(continued)

Annex Flash EB No 319a – Youth on the move
page 42
Table 5a. Voluntary actions aimed at changing respondents’ local communities – by country
QUESTION: Q5. Was the voluntary action aimed at changing something in your local community?
Base: respondents who have been involved in any organised voluntary activities
Total N % Yes % No % DK/NA
EU27 6537 50.6 48.3 1.1
COUNTRY
Belgium 290 44.3 54.6 1.1
Bulgaria 215 50.5 49 0.6
Czech Rep. 216 47.7 51.9 0.4
Denmark 360 33.9 65.6 0.6
Germany 293 54.9 42.4 2.7
Estonia 252 63.8 35.8 0.4
Greece 164 58.1 41.9 0
Spain 234 44.3 55.2 0.5
France 264 36.6 63.1 0.3
Ireland 381 56.8 43.2 0
Italy 130 57.5 42.5 0
Cyprus 225 38.6 61.4 0
Latvia 300 66 32.8 1.2
Lithuania 288 72 27.3 0.8
Luxembourg 226 44.7 54.8 0.5
Hungary 173 72.7 27.3 0
Malta 273 46.6 53.4 0
Netherlands 397 40.2 59.5 0.3
Austria 280 64.1 34.6 1.3
Poland 158 44.7 53.5 1.7
Portugal 206 65.6 33.5 1
Romania 248 67.8 31.1 1.1
Slovenia 356 61.1 38.2 0.8
Slovakia 203 62.5 37 0.5
Finland 218 35.9 62.7 1.5
Sweden 133 44.8 53.4 1.8
United Kingdom 293 53.6 45.2 1.2

Flash EB No 319a – Youth on the move Annex
page 43
Table 5b. Voluntary actions aimed at changing respondents’ local communities – by segments
QUESTION: Q5. Was the voluntary action aimed at changing something in your local community?
Base: respondents who have been involved in any organised voluntary activities
Total N % Yes % No % DK/NA
EU27 6537 50.6 48.3 1.1
SEX
Male 3246 51 48.1 0.9
Female 3290 50.2 48.5 1.3
AGE
15 - 19 2018 49.5 49.3 1.3
20 - 24 2138 47.9 51 1.1
25 - 30 2364 53.9 45.1 1
CURRENTLY IN EDUCATION
Yes 3834 50.4 48.1 1.4
No 2701 50.8 48.6 0.6
CURRENT EDUCATION
Lower secondary level 337 42.4 56.2 1.4
Upper secondary level, general education 942 50.4 48.1 1.5
Upper secondary level, vocational
education and training, including
apprenticeships
532 47.3 52 0.6
Post-secondary, non-higher education 300 49.3 46.7 4
Higher education 1700 52.8 46 1.2
COMPLETED EDUCATION
Left school before completing lower
secondary education 71 58.8 33.3 7.9
Lower secondary level 247 52.5 47.5 0
Upper secondary level, general education 409 49.2 50.8 0
Upper secondary level, vocational
education and training, including
apprenticeships
589 47.8 51.7 0.6
Post-secondary, non-higher education 250 56.5 43.3 0.2
Higher education 1122 50.1 49.3 0.7
CURRENTLY IN WORK
Full-time 2196 52.2 47 0.8
Part-time 1310 49.8 49.3 0.9
No 3026 49.7 48.9 1.4
CURRENT SITUATION
Unemployed 357 51 47.4 1.6
Disability or illness 21 52 48 0
On maternity/paternity/parental leave 66 55.8 44 0.2
Homemaker 75 61.1 38.9 0
Other 76 55.7 44.3 0

Annex Flash EB No 319a – Youth on the move
page 44
Total N % Yes % No % DK/NA
EU27 6537 50.6 48.3 1.1
CURRENTLY IN WORK /
EDUCATION
Full-time work, not in education 1700 51.1 48.4 0.5
Part-time work, not in education 396 46.3 53 0.7
Full-time work, in education 495 55.8 42.3 1.9
Part-time work, in education 914 51.3 47.7 1
Full-time education, not working 2424 49 49.4 1.5
Not in education, not working 602 52.5 46.5 1
CURRENT HH SITUATION
Living with partner, no children 683 49.4 50 0.6
Living with partner, children at home 751 56 43.8 0.2
Single parent 172 55.7 42.7 1.6
Single, living with parents 3852 48.2 50.5 1.3
Single, living alone 586 55.2 44.2 0.6
Single, sharing accommodation 441 55.7 42.6 1.7
URBANISATION
Metropolitan 1194 46.4 52.5 1.1
Urban 2809 50.4 48.6 1
Rural 2509 52.6 46.3 1.1
(continued)

Flash EB No 319a – Youth on the move Annex
page 45
Table 6a. Receiving a certificate or diploma for voluntary activities – by country
QUESTION: Q6. Did you receive a certificate, diploma or other formal recognition for your participation in these voluntary activities?
Base: respondents who have been involved in any organised voluntary activities
Total N % Yes % No % DK/NA
EU27 6537 24.6 75.3 0.2
COUNTRY
Belgium 290 15.6 83.8 0.6
Bulgaria 215 28.6 71.4 0
Czech Rep. 216 23.2 76.4 0.5
Denmark 360 16 83.7 0.3
Germany 293 31.8 68.2 0
Estonia 252 27.7 71.8 0.4
Greece 164 20.5 79.5 0
Spain 234 23.8 76.2 0
France 264 6.7 93.3 0
Ireland 381 21.5 78.5 0
Italy 130 26.8 73.2 0
Cyprus 225 44.2 55.8 0
Latvia 300 17.5 82.2 0.3
Lithuania 288 27.5 72.1 0.4
Luxembourg 226 26.2 73.5 0.3
Hungary 173 22.5 77.5 0
Malta 273 20.6 79.1 0.3
Netherlands 397 12.2 87.8 0
Austria 280 27.3 72 0.7
Poland 158 38.6 60.7 0.6
Portugal 206 28 72 0
Romania 248 34.5 65.5 0
Slovenia 356 23.3 76.4 0.2
Slovakia 203 16.3 83.7 0
Finland 218 22.9 77.1 0
Sweden 133 16 84 0
United Kingdom 293 30.6 69 0.4

Annex Flash EB No 319a – Youth on the move
page 46
Table 6b. Receiving a certificate or diploma for voluntary activities – by segments
QUESTION: Q6. Did you receive a certificate, diploma or other formal recognition for your participation in these voluntary activities?
Base: respondents who have been involved in any organised voluntary activities
Total N % Yes % No % DK/NA
EU27 6537 24.6 75.3 0.2
SEX
Male 3246 23.2 76.7 0.1
Female 3290 25.9 73.9 0.2
AGE
15 - 19 2018 33.6 66.3 0.1
20 - 24 2138 25.6 74 0.4
25 - 30 2364 15.9 84.1 0
CURRENTLY IN EDUCATION
Yes 3834 29.6 70.2 0.2
No 2701 17.4 82.5 0
CURRENT EDUCATION
Lower secondary level 337 32.2 67.6 0.2
Upper secondary level, general education 942 31.6 68.4 0
Upper secondary level, vocational
education and training, including
apprenticeships
532 38.4 61.6 0
Post-secondary, non-higher education 300 24.8 73.6 1.6
Higher education 1700 25.9 73.9 0.2
COMPLETED EDUCATION
Left school before completing lower
secondary education 71 30.7 69.3 0
Lower secondary level 247 14.3 85.5 0.1
Upper secondary level, general education 409 21 79 0.1
Upper secondary level, vocational
education and training, including
apprenticeships
589 17.4 82.6 0
Post-secondary, non-higher education 250 18.5 81.5 0
Higher education 1122 16 84 0.1
CURRENTLY IN WORK
Full-time 2196 19.8 80.1 0
Part-time 1310 25.1 74.6 0.3
No 3026 27.8 72 0.2
CURRENT SITUATION
Unemployed 357 20.2 79.7 0.1
Disability or illness 21 6.7 93.3 0
On maternity/paternity/parental leave 66 20.8 79.2 0
Homemaker 75 11.3 88.7 0
Other 76 27.3 72.7 0

Flash EB No 319a – Youth on the move Annex
page 47
Total N % Yes % No % DK/NA
EU27 6537 24.6 75.3 0.2
CURRENTLY IN WORK /
EDUCATION
Full-time work, not in education 1700 16.9 83.1 0
Part-time work, not in education 396 16.9 83.1 0
Full-time work, in education 495 29.8 70.2 0
Part-time work, in education 914 28.6 70.9 0.5
Full-time education, not working 2424 29.9 69.9 0.2
Not in education, not working 602 19.3 80.6 0.1
CURRENT HH SITUATION
Living with partner, no children 683 13.4 86.6 0
Living with partner, children at home 751 12.6 87.4 0
Single parent 172 28.3 71.7 0
Single, living with parents 3852 28.9 70.9 0.3
Single, living alone 586 19.7 80.3 0
Single, sharing accommodation 441 29.3 70.6 0
URBANISATION
Metropolitan 1194 20.7 79.1 0.2
Urban 2809 27.9 72 0.1
Rural 2509 22.5 77.2 0.2
(continued)

Annex Flash EB No 319a – Youth on the move
page 48
Table 7a. Participation in activities or projects aimed at fostering cooperation with young people from other countries – by country
QUESTION: Q7. Have you participated in any activities or projects during the past year aimed at fostering cooperation with youth from other countries?
Total N
% Yes, in activities /
projects with young
people from other
European countries
% Yes, in activities /
projects with young
people from other
continents % No % DK/NA
EU27 27029 6.2 4.1 90.7 0.4
COUNTRY
Belgium 1000 7.2 4.3 89 0.3
Bulgaria 1000 8.7 1.3 90.7 0
Czech Rep. 1002 7.6 2.1 90.9 0.1
Denmark 1003 7.9 7 86.8 0.4
Germany 1002 9.4 7.6 85.5 0.3
Estonia 1000 12.3 3 85.6 0.1
Greece 1005 6.6 2.2 93 0.1
Spain 1002 4.8 4.4 92 0.3
France 1000 5.8 4.4 90.9 0.1
Ireland 1003 3.2 2.7 94.5 0.2
Italy 1003 1.9 2.7 93.5 2.3
Cyprus 1001 9.4 2.1 89.8 0
Latvia 1001 11.8 2 87.4 0.3
Lithuania 1000 12.4 2.7 85.9 0
Luxembourg 1000 11.1 6.3 84.6 0.2
Hungary 1000 11.5 3.2 87 0.2
Malta 1004 7.9 2 90.8 0
Netherlands 1000 5.3 4.8 91.2 0.2
Austria 1000 10.9 7.6 84.1 0.4
Poland 1000 6.4 1.4 92.8 0.1
Portugal 1001 5.9 2.3 92.7 0.1
Romania 1000 9.7 1.4 89.6 0.1
Slovenia 1000 12.7 2.3 86.3 0
Slovakia 1000 5.6 2 93.2 0.2
Finland 1001 10.4 6.1 86.5 0.1
Sweden 1001 5.2 6.3 90.8 0.3
United Kingdom 1000 2.9 4.3 94.3 0.1

Flash EB No 319a – Youth on the move Annex
page 49
Table 7b. Participation in activities or projects aimed at fostering cooperation with young people from other countries – by segments
QUESTION: Q7. Have you participated in any activities or projects during the past year aimed at fostering cooperation with youth from other countries?
Total N
% Yes, in
activities /
projects with
young people
from other
European
countries
% Yes, in
activities /
projects with
young
people from
other
continents % No
%
DK/NA
EU27 27029 6.2 4.1 90.7 0.4
SEX
Male 13759 6.1 4 91.2 0.2
Female 13270 6.4 4.2 90.2 0.6
AGE
15 - 19 7710 9.4 5.6 85.9 0.5
20 - 24 8502 5.5 3.7 91.7 0.5
25 - 30 10748 4.5 3.4 93.4 0.3
CURRENTLY IN EDUCATION
Yes 13937 9.1 5.4 87.1 0.5
No 13071 3.2 2.7 94.6 0.3
CURRENT EDUCATION
Lower secondary level 1200 10.8 6.9 83.4 0.3
Upper secondary level, general
education 3538 10.8 5.5 84 0.8
Upper secondary level, vocational
education and training, including
apprenticeships
2292 7.2 4.8 89.5 0.2
Post-secondary, non-higher education 1012 6.4 4.4 88 1.6
Higher education 5826 8.9 5.5 88.5 0.2
COMPLETED EDUCATION
Left school before completing lower
secondary education 428 1.7 0.3 97.1 0.9
Lower secondary level 1540 2.9 3.2 94.6 0
Upper secondary level, general
education 2561 1.9 2.2 96.3 0.3
Upper secondary level, vocational
education and training, including
apprenticeships
3010 2.1 1.5 96.6 0.1
Post-secondary, non-higher education 1175 2.6 2.6 92.9 2.2
Higher education 4319 5.2 4 92.4 0.1
CURRENTLY IN WORK
Full-time 9384 4.7 3.3 93.4 0.1
Part-time 4212 7.3 6.3 87.9 0.8
No 13399 7 3.9 89.8 0.4

Annex Flash EB No 319a – Youth on the move
page 50
Total N
% Yes, in
activities /
projects with
young people
from other
European
countries
% Yes, in
activities /
projects with
young
people from
other
continents % No
%
DK/NA
EU27 27029 6.2 4.1 90.7 0.4
CURRENT SITUATION
Unemployed 2291 2.7 2.4 95.3 0.2
Disability or illness 117 2.6 0.6 96.3 0.6
On maternity/paternity/parental
leave 455 4.2 1.2 95.1 0.1
Homemaker 496 0.1 0 99.8 0
Other 326 4.5 2 92.6 1.1
CURRENTLY IN WORK /
EDUCATION
Full-time work, not in education 7738 3.8 3.1 94.2 0.1
Part-time work, not in education 1632 1.6 3 95.2 0.5
Full-time work, in education 1639 8.8 4.3 89.4 0
Part-time work, in education 2575 10.9 8.4 83.3 1
Full-time education, not working 9713 8.6 4.7 87.7 0.4
Not in education, not working 3680 2.6 1.8 95.5 0.5
CURRENT HH SITUATION
Living with partner, no children 3009 4.5 2.8 93.4 0.3
Living with partner, children at home 3790 3.5 2.5 94.8 0.1
Single parent 763 5.8 5.4 92.5 0.6
Single, living with parents 15778 6.7 4.2 89.8 0.5
Single, living alone 2183 8 6.5 88.7 0.2
Single, sharing accommodation 1343 9.8 5.5 86.9 0.2
URBANISATION
Metropolitan 5111 8.1 5.6 88 0.2
Urban 12692 5.7 3.7 91.4 0.6
Rural 9032 6 3.8 91.3 0.1
(continued)

Flash EB No 319a – Youth on the move Annex
page 51
Table 7c. Participation in activities or projects aimed at fostering cooperation with young people from other countries – by segments
QUESTION: Q7. Have you participated in any activities or projects during the past year aimed at fostering cooperation with youth from other countries?
Total N
% Yes, in
activities /
projects with
young people
from other
countries % No % DK/NA
EU27 27029 8.9 90.7 0.4
SEX
Male 13759 8.6 91.2 0.2
Female 13270 9.2 90.2 0.6
AGE
15 - 19 7710 13.6 85.9 0.5
20 - 24 8502 7.8 91.7 0.5
25 - 30 10748 6.3 93.4 0.3
CURRENTLY IN EDUCATION
Yes 13937 12.4 87.1 0.5
No 13071 5.1 94.6 0.3
CURRENT EDUCATION
Lower secondary level 1200 16.3 83.4 0.3
Upper secondary level, general
education 3538 15.2 84 0.8
Upper secondary level, vocational
education and training, including
apprenticeships
2292 10.3 89.5 0.2
Post-secondary, non-higher
education 1012 10.4 88 1.6
Higher education 5826 11.3 88.5 0.2
COMPLETED EDUCATION
Left school before completing lower
secondary education 428 2 97.1 0.9
Lower secondary level 1540 5.4 94.6 0
Upper secondary level, general
education 2561 3.4 96.3 0.3
Upper secondary level, vocational
education and training, including
apprenticeships
3010 3.3 96.6 0.1
Post-secondary, non-higher
education 1175 4.9 92.9 2.2
Higher education 4319 7.5 92.4 0.1
CURRENTLY IN WORK
Full-time 9384 6.5 93.4 0.1
Part-time 4212 11.3 87.9 0.8
No 13399 9.8 89.8 0.4

Annex Flash EB No 319a – Youth on the move
page 52
Total N
% Yes, in
activities /
projects with
young people
from other
countries % No % DK/NA
EU27 27029 8.9 90.7 0.4
CURRENT SITUATION
Unemployed 2291 4.5 95.3 0.2
Disability or illness 117 3.1 96.3 0.6
On maternity/paternity/parental
leave 455 4.8 95.1 0.1
Homemaker 496 0.2 99.8 0
Other 326 6.3 92.6 1.1
CURRENTLY IN WORK /
EDUCATION
Full-time work, not in education 7738 5.7 94.2 0.1
Part-time work, not in education 1632 4.3 95.2 0.5
Full-time work, in education 1639 10.6 89.4 0
Part-time work, in education 2575 15.7 83.3 1
Full-time education, not working 9713 11.9 87.7 0.4
Not in education, not working 3680 4 95.5 0.5
CURRENT HH SITUATION
Living with partner, no children 3009 6.3 93.4 0.3
Living with partner, children at home 3790 5.1 94.8 0.1
Single parent 763 6.9 92.5 0.6
Single, living with parents 15778 9.7 89.8 0.5
Single, living alone 2183 11.1 88.7 0.2
Single, sharing accommodation 1343 12.9 86.9 0.2
URBANISATION
Metropolitan 5111 11.8 88 0.2
Urban 12692 8 91.4 0.6
Rural 9032 8.6 91.3 0.1
(continued)

Flash EB No 319a – Youth on the move Annex
page 53
II. Survey details This special target group survey “Youth on the Move” (No 319a) was conducted for the European Commission, DG Education and Culture, Directorate E - Youth and Sport. Telephone interviews were conducted in each country from January 31 to February 4, 2011 by the following institutes: Belgium BE Gallup Europe (Interviews: 31/01/2011 - 04/02/2011) Czech Republic CZ Focus Agency (Interviews: 31/01/2011 - 04/02/2011) Denmark DK Norstat Denmark (Interviews: 31/01/2011 - 04/02/2011) Germany DE IFAK (Interviews: 31/01/2011 - 04/02/2011) Estonia EE Saar Poll (Interviews: 31/01/2011 - 04/02/2011) Greece EL Metroanalysis (Interviews: 31/01/2011 - 04/02/2011) Spain ES Gallup Spain (Interviews: 31/01/2011 - 04/02/2011) France FR Efficience3 (Interviews: 31/01/2011 - 04/02/2011) Ireland IE Gallup UK (Interviews: 31/01/2011 - 04/02/2011) Italy IT Demoskopea (Interviews: 31/01/2011 - 04/02/2011) Cyprus CY CYMAR (Interviews: 31/01/2011 - 04/02/2011) Latvia LV Latvian Facts (Interviews: 31/01/2011 - 04/02/2011) Lithuania LT Baltic Survey (Interviews: 31/01/2011 - 04/02/2011) Luxembourg LU Gallup Europe (Interviews: 31/01/2011 - 04/02/2011) Hungary HU Gallup Hungary (Interviews: 31/01/2011 - 04/02/2011) Malta MT MISCO (Interviews: 31/01/2011 - 04/02/2011) Netherlands NL MSR (Interviews: 31/01/2011 - 04/02/2011) Austria AT Spectra (Interviews: 31/01/2011 - 04/02/2011) Poland PL Gallup Poland (Interviews: 31/01/2011 - 04/02/2011) Portugal PT Consulmark (Interviews: 31/01/2011 - 04/02/2011) Slovenia SI Cati d.o.o (Interviews: 31/01/2011 - 04/02/2011) Slovakia SK Focus Agency (Interviews: 31/01/2011 - 04/02/2011) Finland FI Norstat Finland Oy (Interviews: 31/01/2011 - 04/02/2011) Sweden SE Norstat Sweden (Interviews: 31/01/2011 - 04/02/2011) United Kingdom UK Gallup UK (Interviews: 31/01/2011 - 04/02/2011) Bulgaria BG Vitosha (Interviews: 31/01/2011 - 04/02/2011) Romania RO Gallup Romania (Interviews: 31/01/2011 - 04/02/2011) Representativeness of the results Each national sample is representative of the population between 15 and 30 years of age. Sample sizes In all EU countries the target sample size was 1000 respondents, the table below shows the achieved sample size by country. A weighting factor was applied to the national results in order to compute a marginal total where each country contributes to the European Union result in proportion to its population. The table below presents, for each of the countries: (1) the number of interviews actually carried out (2) the population-weighted total number of interviews

Annex Flash EB No 319a – Youth on the move
page 54
TOTAL INTERVIEWS
Total Interviews
Conducted % of Total EU27
weighted % of Total (weighted)
Total 27029 100 27029 100 BE 1000 3.7 573 2.1 BG 1000 3.7 423 1.6 CZ 1002 3.7 602 2.2 DK 1003 3.7 282 1.0 DE 1002 3.7 4062 15.0 EE 1000 3.7 83 0.3 EL 1005 3.7 573 2.1 ES 1002 3.7 2410 8.9 FR 1000 3.7 3467 12.8 IE 1003 3.7 277 1.0 IT 1003 3.7 2768 10.2 CY 1001 3.7 54 0.2 LV 1001 3.7 142 0.5 LT 1000 3.7 213 0.8 LU 1000 3.7 27 0.1 HU 1000 3.7 565 2.1 MT 1004 3.7 25 0.1 NL 1000 3.7 862 3.2 AT 1000 3.7 450 1.7 PL 1000 3.7 2510 9.3 PT 1001 3.7 557 2.1 RO 1000 3.7 1327 4.9 SI 1000 3.7 112 0.4 SK 1000 3.7 357 1.3 FI 1001 3.7 286 1.1 SE 1001 3.7 516 1.9 UK 1000 3.7 3504 13.0
Questionnaires 1. The questionnaire prepared for this survey is reproduced at the end of this results volume, in English. 2. The institutes listed above translated the questionnaire in their respective national language(s). 3. One copy of each national questionnaire is annexed to the results (volume tables). Tables of results VOLUME A: COUNTRY BY COUNTRY The VOLUME A tables present the European Union results country by country. VOLUME B: RESPONDENTS’ DEMOGRAPHICS The VOLUME B tables present the European Union results with the following socio-demographic characteristics of respondents as breakdowns:
Flash EB No 319a – Youth on the move Annex
page 55
Volume B: • Sex (Male, Female) • Age (15-19, 20-24, 25-30) • Currently in education or training (Yes, No) • Current education or training (Lower secondary level; Upper secondary level, general education;
Upper secondary level, vocational education and training, including apprenticeships; Post-secondary, non-higher education; Higher education)
• Completed education or training (Left school before completing lower secondary education; Lower secondary level; Upper secondary level, general education; Upper secondary level, vocational education and training, including apprenticeships; Post-secondary, non-higher education; Higher education)
• Currently in work (Full-time; Part-time; No) • Current situation (Unemployed; Disability or illness; On maternity/paternity/parental leave;
Homemaker; Other) • Current household situation (Living with partner, no children; Living with partner, children at
home; Single parent; Single, living with parents; Single, living alone; Single, sharing accommodation)
• Subjective urbanisation (Metropolitan zone, Other town/urban centre, Rural zone) • Currently in work or /and education (Full-time work, no education; Part-time work, no education;
Full-time work, education; Part-time work, education; Full-time education, no work; Not in education, no work)
Sampling error Surveys are designed and conducted to provide an estimate of a true value of characteristics of a population at a given time. An estimate of a survey is unlikely to exactly equal the true population quantity of interest for a variety of reasons. One of these reasons is that data in a survey are collected from only some – a sample of – members of the population, this to make data collection cheaper and faster. The “margin of error” is a common summary of sampling error, which quantifies uncertainty about (or confidence in) a survey result. Usually, one calculates a 95 percent confidence interval of the format: survey estimate +/- margin of error. This interval of values will contain the true population value at least 95% of time. For example, if it was estimated that 45% of EU citizens are in favour of a single European currency and this estimate is based on a sample of 100 EU citizens, the associated margin of error is about 10 percentage points. The 95 percent confidence interval for support for a European single currency would be (45%-10%) to (45%+10%), suggesting that in the EU the support for a European single currency could range from 35% to 55%. Because of the small sample size of 100 EU citizens, there is considerable uncertainty about whether or not the citizens of the EU support a single currency. As a general rule, the more interviews conducted (sample size), the smaller the margin of error. Larger samples are more likely to give results closer to the true population quantity and thus have smaller margins of error. For example, a sample of 500 will produce a margin of error of no more than about 4.5 percentage points, and a sample of 1,000 will produce a margin of error of no more than about 3 percentage points.

Annex Flash EB No 319a – Youth on the move
page 56
Margin of error (95% confidence interval) Survey estimate
Sample size (n) 10 50 100 150 200 400 800 1000 2000 4000
5% 13.5% 6.0% 4.3% 3.5% 3.0% 2.1% 1.5% 1.4% 1.0% 0.7% 10% 18.6% 8.3% 5.9% 4.8% 4.2% 2.9% 2.1% 1.9% 1.3% 0.9% 25% 26.8% 12.0% 8.5% 6.9% 6.0% 4.2% 3.0% 2.7% 1.9% 1.3% 50% 31.0% 13.9% 9.8% 8.0% 6.9% 4.9% 3.5% 3.1% 2.2% 1.5% 75% 26.8% 12.0% 8.5% 6.9% 6.0% 4.2% 3.0% 2.7% 1.9% 1.3% 90% 18.6% 8.3% 5.9% 4.8% 4.2% 2.9% 2.1% 1.9% 1.3% 0.9% 95% 13.5% 6.0% 4.3% 3.5% 3.0% 2.1% 1.5% 1.4% 1.0% 0.7%
(The values in the table are the margin of error – at 95% confidence level – for a given survey estimate and sample size) The examples show that the size of a sample is a crucial factor affecting the margin of error. Nevertheless, once past a certain point – a sample size of 800 or 1,000 – the improvement is small. For example, to reduce the margin of error to 1.5% would require a sample size of 4,000.

Flash EB No 319a – Youth on the move Annex
page 57
III. Questionnaire SCREENER S0. Is anyone in your household between 15 and 30 years-of-age?
- Yes ...................................................................................................... 1 - No ...................................................... [THANK AND TERMINATE] - [DK/NA] ........................................... [THANK AND TERMINATE]
S1. Is more than one person in your household between 15 and 30 years-of-age?
- Yes ...................................................................................................... 1 - No ....................................................................................................... 2 - [DK/NA] ............................................................................................ 9
DEMO D1. How old are you?
[_][_]years old - [REFUSAL/NO ANSWER] ............................................................ 00
D2. Gender
- Male .................................................................................................... 1 - Female ................................................................................................ 2
D3. Are you currently in education or training? This can be full-time or part-time.
- Yes ...................................................................................................... 1 - No ....................................................................................................... 2 - [DK/NA] ............................................................................................ 9
[ASK IF D3=1] D4a. What type of education or training are you in?
- Lower secondary level ....................................................................... 1 - Upper secondary level, general education .......................................... 2 - Upper secondary level, vocational education and training,
including apprenticeships .................................................................. 3 - Post-secondary, non-higher education ............................................... 4 - Higher education ................................................................................. 5 - [DK/NA] ............................................................................................ 9

Annex Flash EB No 319a – Youth on the move
page 58
[ASK IF D3=2 or 9] D4b. What is the highest level of education or training that you have completed?
- Left school before completing lower secondary education ................ 1 - Upper secondary level, general education .......................................... 2 - Upper secondary level, vocational education and training
including apprenticeships .................................................................. 3 - Post-secondary non-higher education ................................................. 4 - Higher education ................................................................................. 5 - [DK/NA] ............................................................................................ 9
D5. NUTS region (not to be asked) D6. Do you live in a ...
- Metropolitan area ............................................................................... 1 - Other town/urban centre .................................................................... 2 - Rural area ........................................................................................... 3 - [DK/NA] ............................................................................................ 9
D7. Are you currently in work? This can be full-time or part-time, including alongside education / training.
- Yes, full-time ...................................................................................... 1 - Yes, part-time ..................................................................................... 2 - No ....................................................................................................... 3 - [DK/NA] ............................................................................................ 9
[ASK IF D3 = (2 or 9) AND D7=(3 or 9)] D8. Which of the following best describes your current situation?
- Unemployed and looking for a job ..................................................... 1 - Unemployed but not looking for work ............................................... 2 - Unable to work because of a disability or illness ............................... 3 - On maternity/paternity/parental leave ................................................ 4 - A homemaker ..................................................................................... 5 - Other ................................................................................................... 8 - [DK/NA] ............................................................................................ 9
D9. Which of the following best describes your current household situation?
- Living with spouse/partner, no children ............................................. 1 - Living with spouse/partner, children at home .................................... 2 - Single parent ....................................................................................... 3 - Single, living with parents .................................................................. 4 - Single, living alone ............................................................................. 5 - Single, sharing accommodation with friends/flatmates ...................... 6 - [DK/NA] ............................................................................................ 9

Flash EB No 319a – Youth on the move Annex
page 59
A. SOCIAL INCLUSION, HEALTH & WELL-BEING [ASK ALL] Q1. Have you in the past year participated in any activities of the following organisations?
- Yes ........................................................................................... 1 - No ............................................................................................ 2 - [DK/NA] .................................................................................. 9
a) A sports club ............................................................................................... 1 2 3 9 b) A youth club, leisure-time club or any kind of youth organisation ............. 1 2 3 9 c) A cultural organisation ................................................................................. 1 2 3 9 e) A political organisation or a political party .................................................. 1 2 3 9 f) A local organisation aimed at improving your local community
and/or local environment ............................................................................. 1 2 3 9 g) An organisation active in the domain of global climate
change/global warming, ............................................................................... 1 2 3 9 i) An organisation promoting human rights or global development ................ 1 2 3 9 j) Any other non-governmental organisations .................................................. 1 2 3 9
B. CULTURE & CREATIVITY [ASK ALL] Q2. Have you participated in any of the following cultural activities in the past year?
- Yes ........................................................................................... 1 - No ............................................................................................ 2 - [DK/NA] .................................................................................. 9
a) Visited historical monuments (palaces, castles, churches, gardens,
etc.), museums or galleries ............................................................................... 1 2 9 b) Been to the cinema or a concert ..................................................................... 1 2 9 c) Been to a theatre, a dance performance or an opera ........................................ 1 2 9 d) Participated in an amateur artistic activity (playing a musical
instrument, singing, acting, dancing, writing poetry, photography, film making). .................................................................................................. 1 2 9
C. PARTICIPATION [ASK ALL] Q3. During the last 3 years, did you vote in any political election at the local, regional, national or EU level? If you were, at that time, not eligible to vote, please say so.
- Yes ...................................................................................................... 1 - No, did not vote in an election ............................................................ 2 - No, because you were not old enough to vote ................................... 4 - [DK/ΝΑ] ............................................................................................ 9
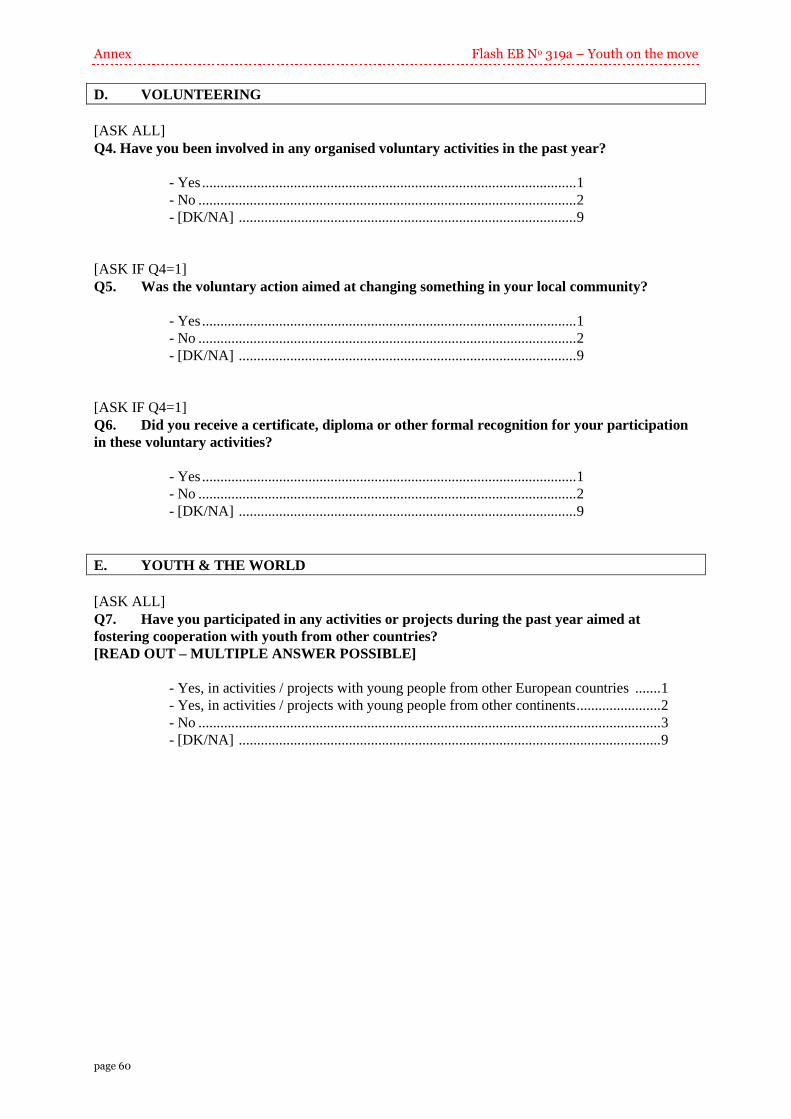
Annex Flash EB No 319a – Youth on the move
page 60
D. VOLUNTEERING [ASK ALL] Q4. Have you been involved in any organised voluntary activities in the past year?
- Yes ...................................................................................................... 1 - No ....................................................................................................... 2 - [DK/NA] ............................................................................................ 9
[ASK IF Q4=1] Q5. Was the voluntary action aimed at changing something in your local community?
- Yes ...................................................................................................... 1 - No ....................................................................................................... 2 - [DK/NA] ............................................................................................ 9
[ASK IF Q4=1] Q6. Did you receive a certificate, diploma or other formal recognition for your participation in these voluntary activities?
- Yes ...................................................................................................... 1 - No ....................................................................................................... 2 - [DK/NA] ............................................................................................ 9
E. YOUTH & THE WORLD [ASK ALL] Q7. Have you participated in any activities or projects during the past year aimed at fostering cooperation with youth from other countries? [READ OUT – MULTIPLE ANSWER POSSIBLE]
- Yes, in activities / projects with young people from other European countries ....... 1 - Yes, in activities / projects with young people from other continents ....................... 2 - No .............................................................................................................................. 3 - [DK/NA] ................................................................................................................... 9