Embed Size (px)
Citation preview
your partner in compliance
© 2017 McGee Pharma International 1
QP Forum 2017
Quality Risk Management &
Quality Metrics Ann McGee, Principal Consultant, MPI
April 2017

your partner in compliance
Workshop Content
Background to QRM & expectations
Current Expectations of Regulators for Metrics
Typical Current Metrics?
What metrics do we see now?
Limitations on current metrics?
How to interpret metrics?
Considerations when designing a Quality Metrics Programme
Xavier University / PwC Quality Metrics
Questions received from participants
Conclusion- What the Future Holds
© 2017 McGee Pharma International
your partner in compliance
© 2017 McGee Pharma International
your partner in compliance
© 2017 McGee Pharma International
your partner in compliance
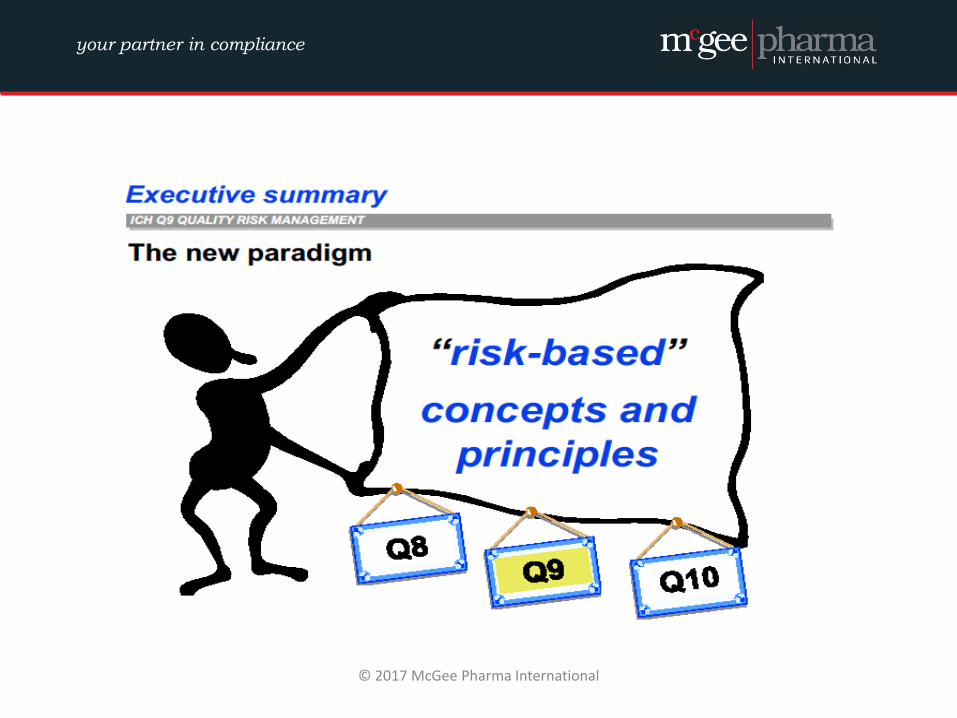
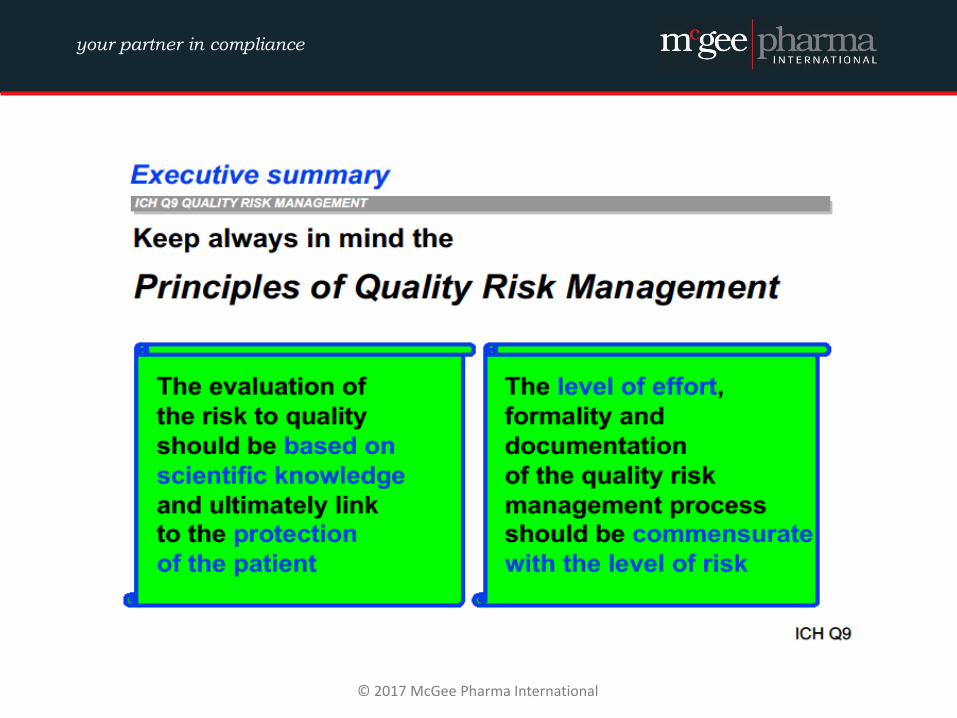
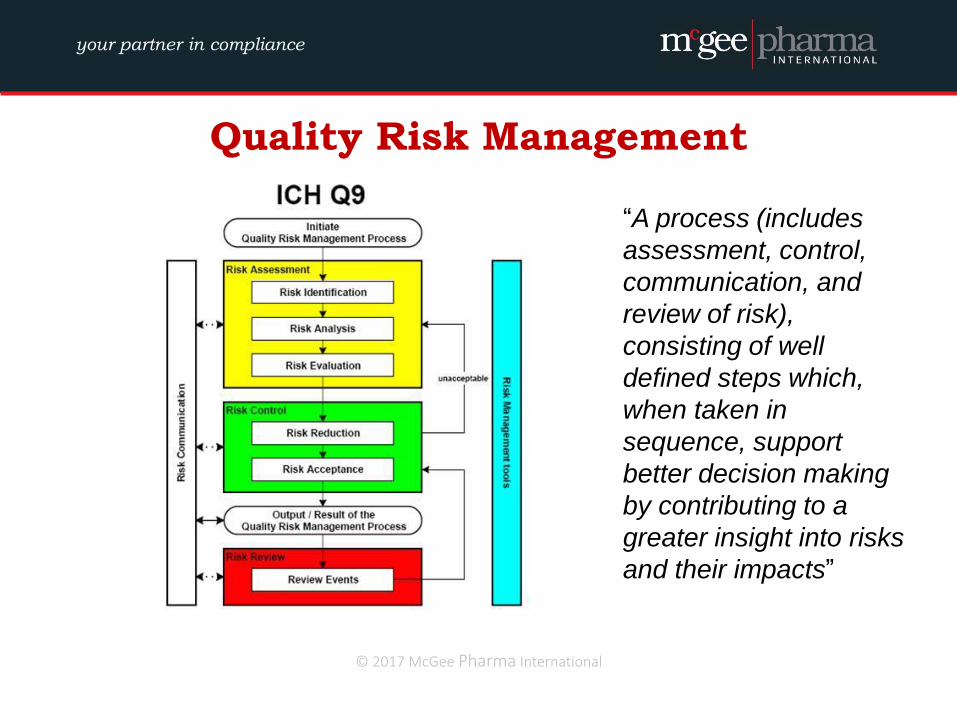
Quality Risk Management
“A process (includes
assessment, control,
communication, and
review of risk),
consisting of well
defined steps which,
when taken in
sequence, support
better decision making
by contributing to a
greater insight into risks
and their impacts”
© 2017 McGee Pharma International
your partner in compliance
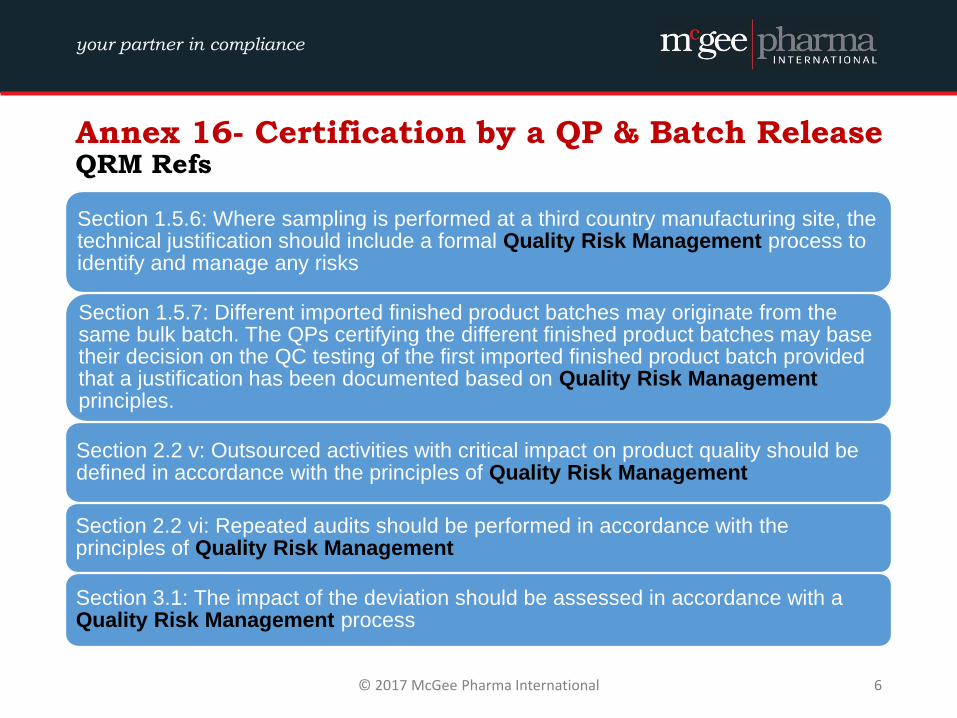
Annex 16- Certification by a QP & Batch Release QRM Refs
Section 1.5.6: Where sampling is performed at a third country manufacturing site, the technical justification should include a formal Quality Risk Management process to identify and manage any risks
Section 1.5.7: Different imported finished product batches may originate from the same bulk batch. The QPs certifying the different finished product batches may base their decision on the QC testing of the first imported finished product batch provided that a justification has been documented based on Quality Risk Management principles.
Section 2.2 v: Outsourced activities with critical impact on product quality should be defined in accordance with the principles of Quality Risk Management
Section 2.2 vi: Repeated audits should be performed in accordance with the principles of Quality Risk Management
Section 3.1: The impact of the deviation should be assessed in accordance with a Quality Risk Management process
© 2017 McGee Pharma International 6
your partner in compliance
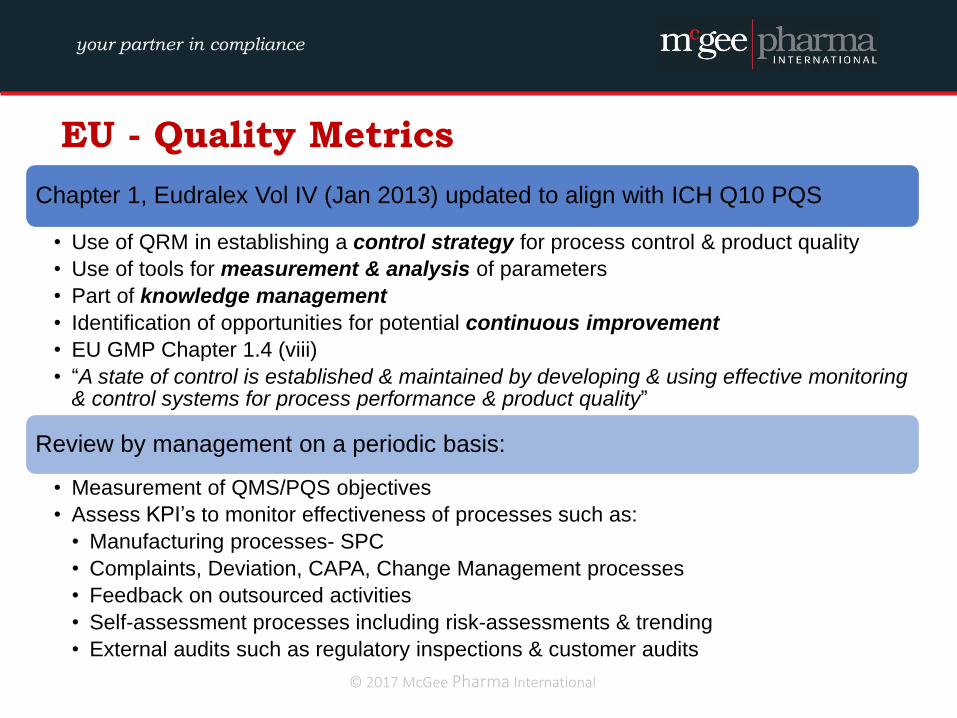
EU - Quality Metrics
Chapter 1, Eudralex Vol IV (Jan 2013) updated to align with ICH Q10 PQS
• Use of QRM in establishing a control strategy for process control & product quality
• Use of tools for measurement & analysis of parameters
• Part of knowledge management
• Identification of opportunities for potential continuous improvement
• EU GMP Chapter 1.4 (viii)
• “A state of control is established & maintained by developing & using effective monitoring & control systems for process performance & product quality”
Review by management on a periodic basis:
• Measurement of QMS/PQS objectives
• Assess KPI’s to monitor effectiveness of processes such as:
• Manufacturing processes- SPC
• Complaints, Deviation, CAPA, Change Management processes
• Feedback on outsourced activities
• Self-assessment processes including risk-assessments & trending
• External audits such as regulatory inspections & customer audits
© 2017 McGee Pharma International
your partner in compliance
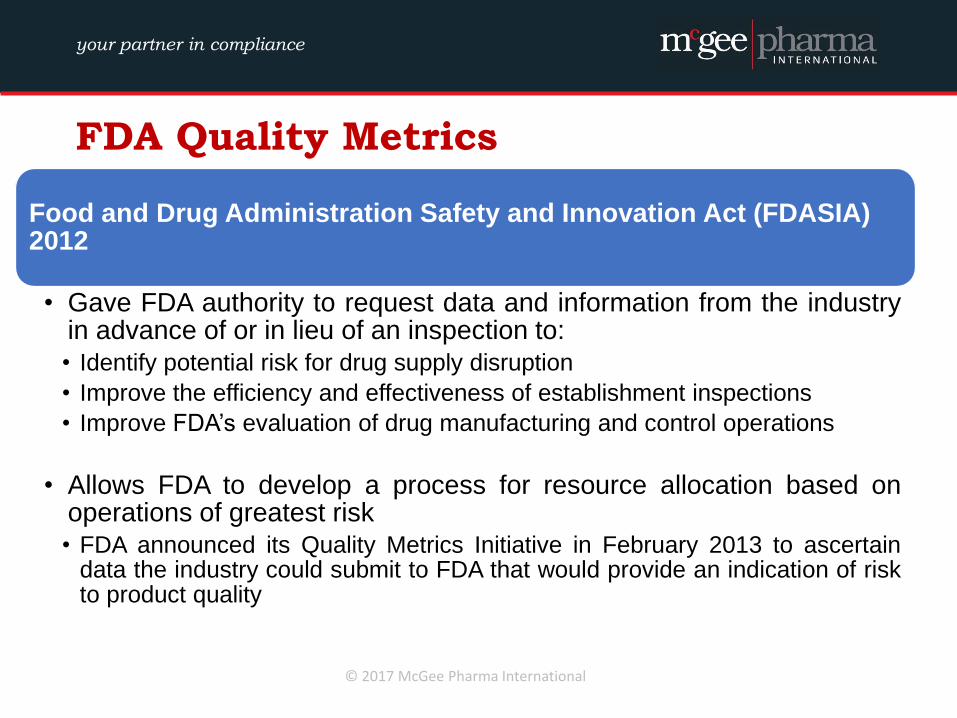
FDA Quality Metrics
Food and Drug Administration Safety and Innovation Act (FDASIA) 2012
• Gave FDA authority to request data and information from the industry in advance of or in lieu of an inspection to:
• Identify potential risk for drug supply disruption
• Improve the efficiency and effectiveness of establishment inspections
• Improve FDA’s evaluation of drug manufacturing and control operations
• Allows FDA to develop a process for resource allocation based on operations of greatest risk
• FDA announced its Quality Metrics Initiative in February 2013 to ascertain data the industry could submit to FDA that would provide an indication of risk to product quality
© 2017 McGee Pharma International
your partner in compliance
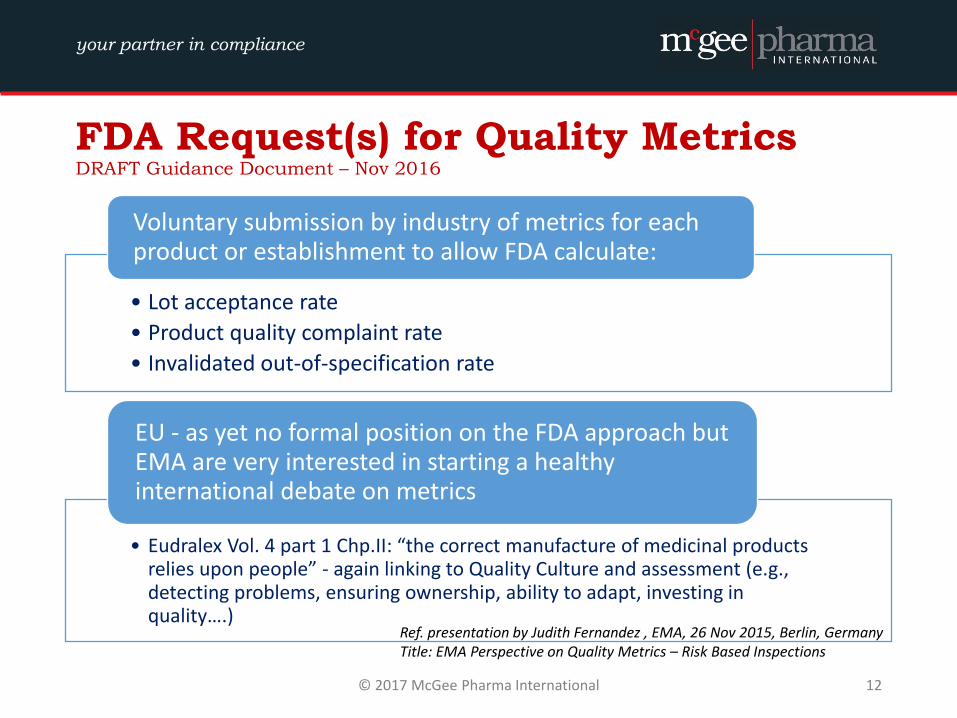
FDA Request(s) for Quality Metrics DRAFT Guidance Document – Nov 2016
• Lot acceptance rate
• Product quality complaint rate
• Invalidated out-of-specification rate
Voluntary submission by industry of metrics for each product or establishment to allow FDA calculate:
• Eudralex Vol. 4 part 1 Chp.II: “the correct manufacture of medicinal products relies upon people” - again linking to Quality Culture and assessment (e.g., detecting problems, ensuring ownership, ability to adapt, investing in quality….)
EU - as yet no formal position on the FDA approach but EMA are very interested in starting a healthy international debate on metrics
© 2017 McGee Pharma International 12
Ref. presentation by Judith Fernandez , EMA, 26 Nov 2015, Berlin, Germany Title: EMA Perspective on Quality Metrics – Risk Based Inspections
your partner in compliance
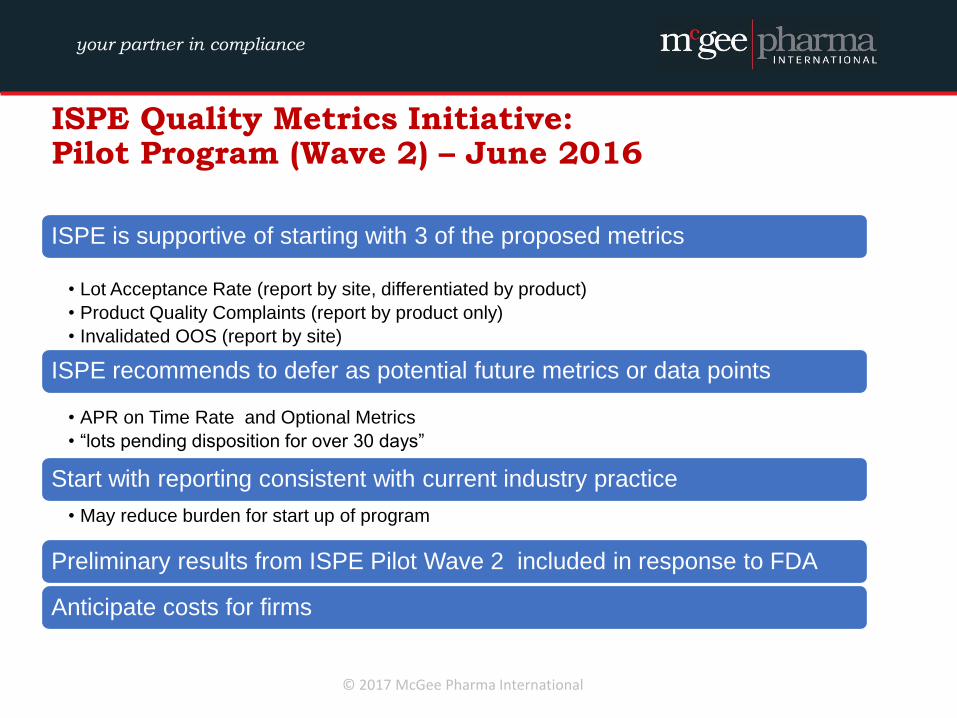
ISPE Quality Metrics Initiative: Pilot Program (Wave 2) – June 2016
ISPE is supportive of starting with 3 of the proposed metrics
• Lot Acceptance Rate (report by site, differentiated by product)
• Product Quality Complaints (report by product only)
• Invalidated OOS (report by site)
ISPE recommends to defer as potential future metrics or data points
• APR on Time Rate and Optional Metrics
• “lots pending disposition for over 30 days”
Start with reporting consistent with current industry practice
• May reduce burden for start up of program
Preliminary results from ISPE Pilot Wave 2 included in response to FDA
Anticipate costs for firms
© 2017 McGee Pharma International
your partner in compliance
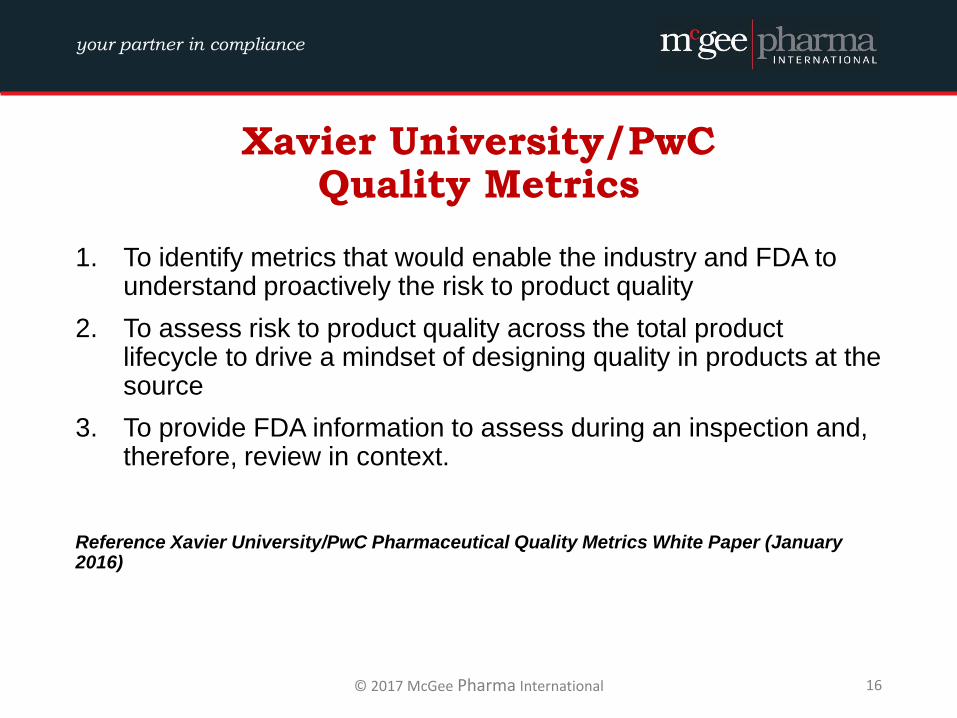
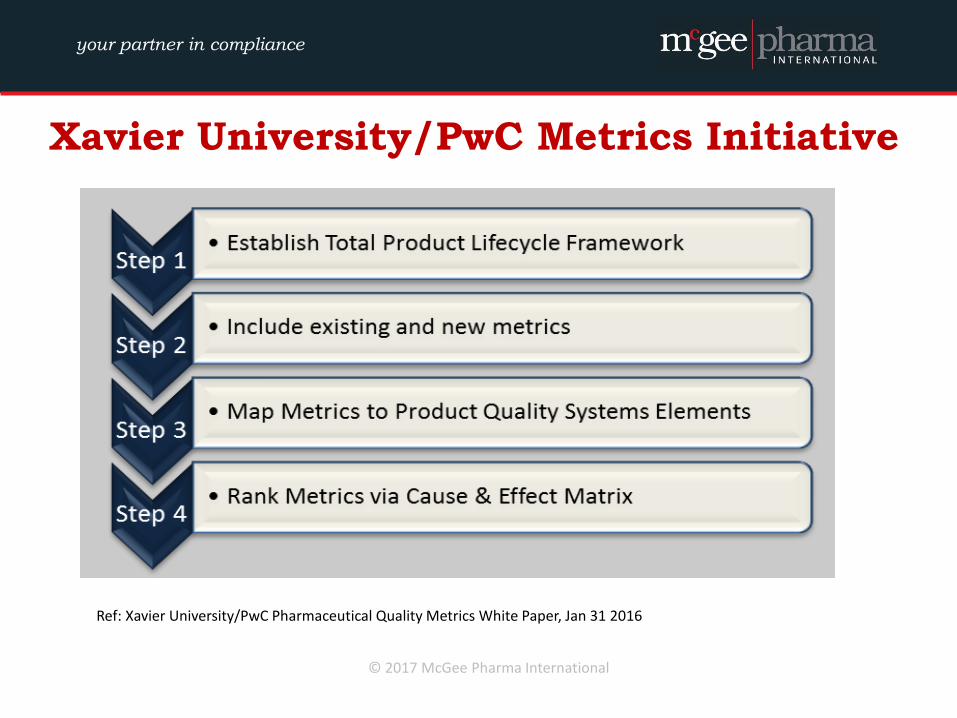
Xavier University/PwC Quality Metrics
1. To identify metrics that would enable the industry and FDA to understand proactively the risk to product quality
2. To assess risk to product quality across the total product lifecycle to drive a mindset of designing quality in products at the source
3. To provide FDA information to assess during an inspection and, therefore, review in context.
Reference Xavier University/PwC Pharmaceutical Quality Metrics White Paper (January 2016)
© 2017 McGee Pharma International 16
your partner in compliance
Xavier University/PwC Metrics Initiative
Ref: Xavier University/PwC Pharmaceutical Quality Metrics White Paper, Jan 31 2016
© 2017 McGee Pharma International
your partner in compliance
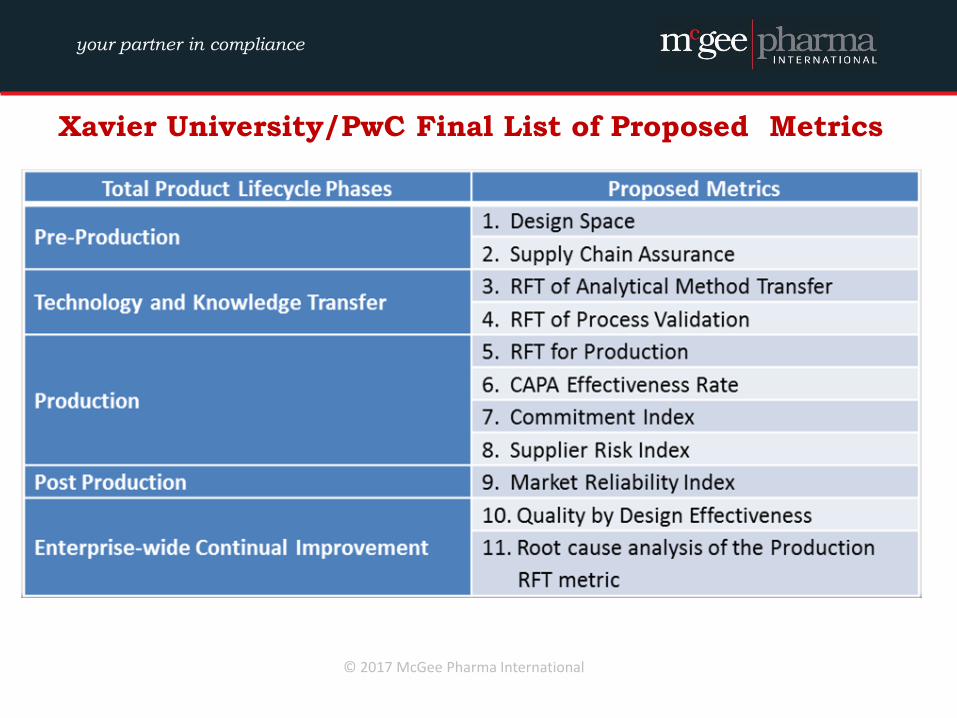
Xavier University/PwC Final List of Proposed Metrics
© 2017 McGee Pharma International
your partner in compliance
© 2017 McGee Pharma International 19
Quality Metrics
What do we see currently?
your partner in compliance
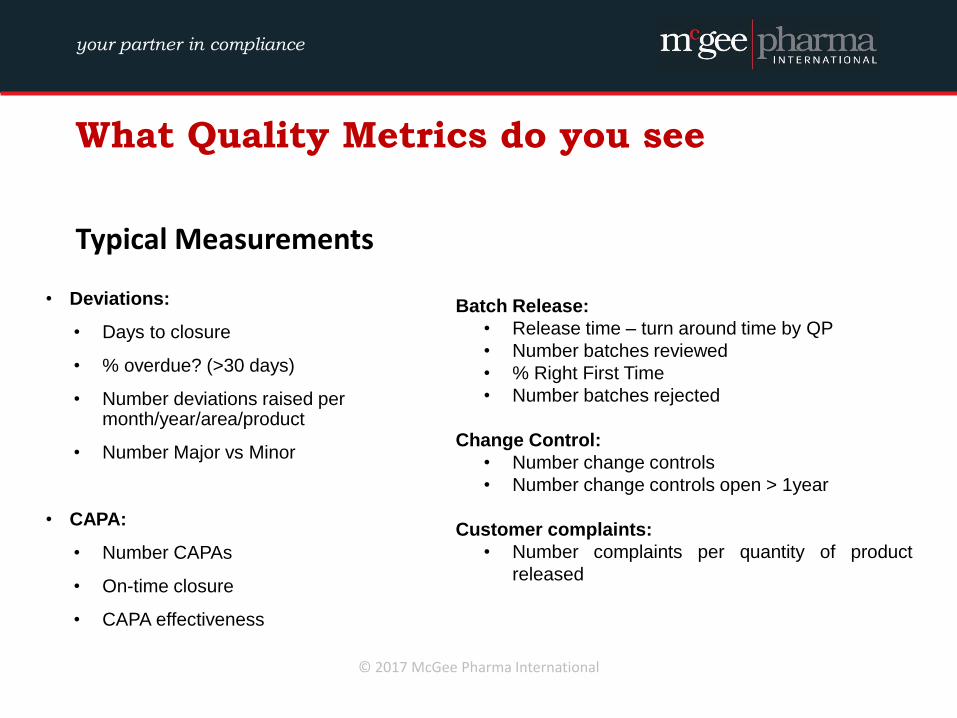
What Quality Metrics do you see
Typical Measurements
• Deviations:
• Days to closure
• % overdue? (>30 days)
• Number deviations raised per month/year/area/product
• Number Major vs Minor
• CAPA:
• Number CAPAs
• On-time closure
• CAPA effectiveness
Batch Release:
• Release time – turn around time by QP
• Number batches reviewed
• % Right First Time
• Number batches rejected
Change Control:
• Number change controls
• Number change controls open > 1year
Customer complaints:
• Number complaints per quantity of product
released
© 2017 McGee Pharma International
your partner in compliance
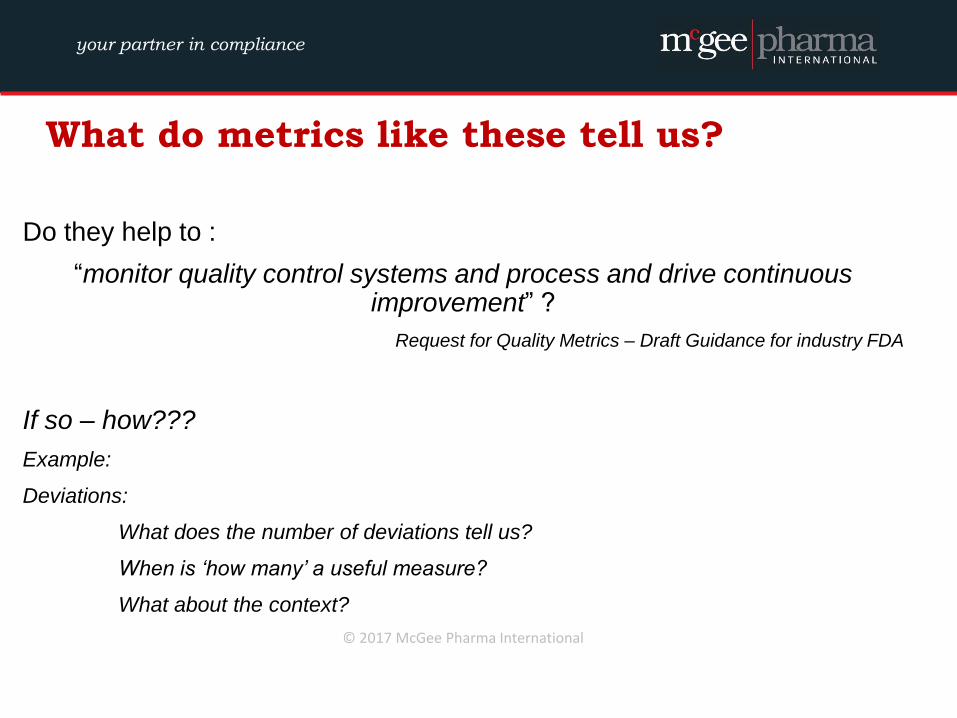
What do metrics like these tell us?
Do they help to :
“monitor quality control systems and process and drive continuous improvement” ?
Request for Quality Metrics – Draft Guidance for industry FDA
If so – how???
Example:
Deviations:
What does the number of deviations tell us?
When is ‘how many’ a useful measure?
What about the context?
© 2017 McGee Pharma International
your partner in compliance
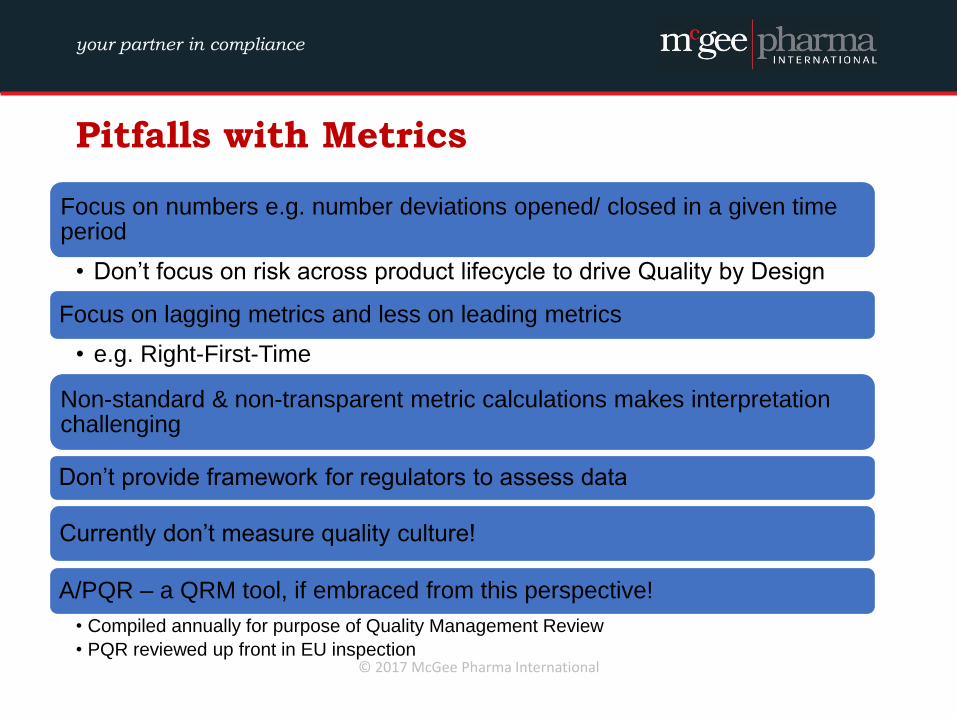
Pitfalls with Metrics
Focus on numbers e.g. number deviations opened/ closed in a given time period
• Don’t focus on risk across product lifecycle to drive Quality by Design
Focus on lagging metrics and less on leading metrics
• e.g. Right-First-Time
Non-standard & non-transparent metric calculations makes interpretation challenging
Don’t provide framework for regulators to assess data
Currently don’t measure quality culture!
A/PQR – a QRM tool, if embraced from this perspective!
• Compiled annually for purpose of Quality Management Review
• PQR reviewed up front in EU inspection © 2017 McGee Pharma International
your partner in compliance
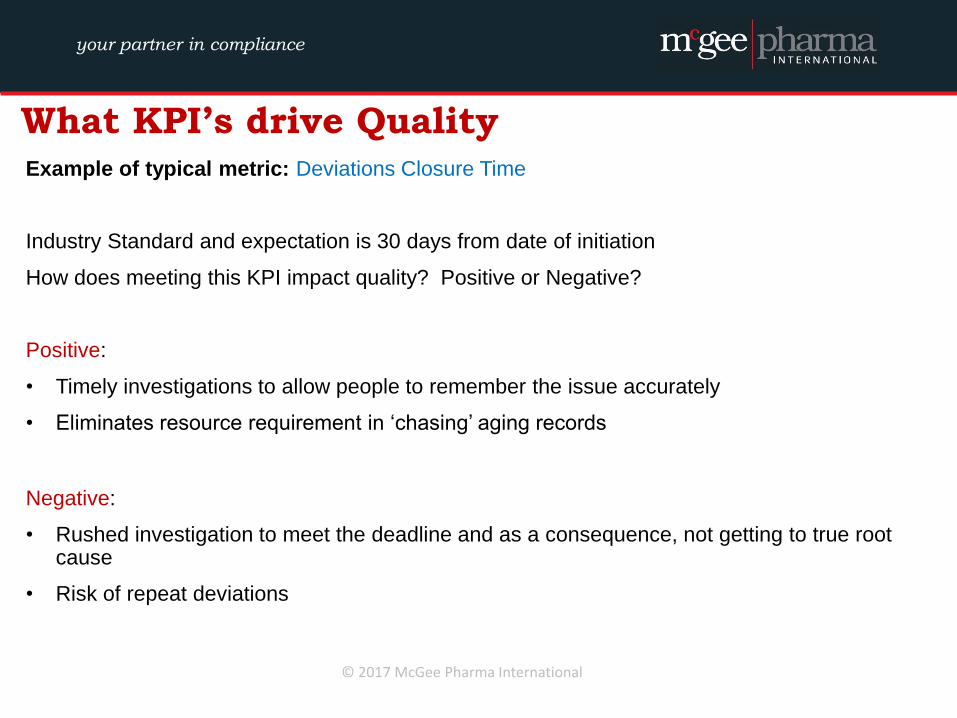
What KPI’s drive Quality Example of typical metric: Deviations Closure Time
Industry Standard and expectation is 30 days from date of initiation
How does meeting this KPI impact quality? Positive or Negative?
Positive:
• Timely investigations to allow people to remember the issue accurately
• Eliminates resource requirement in ‘chasing’ aging records
Negative:
• Rushed investigation to meet the deadline and as a consequence, not getting to true root cause
• Risk of repeat deviations
© 2017 McGee Pharma International
your partner in compliance
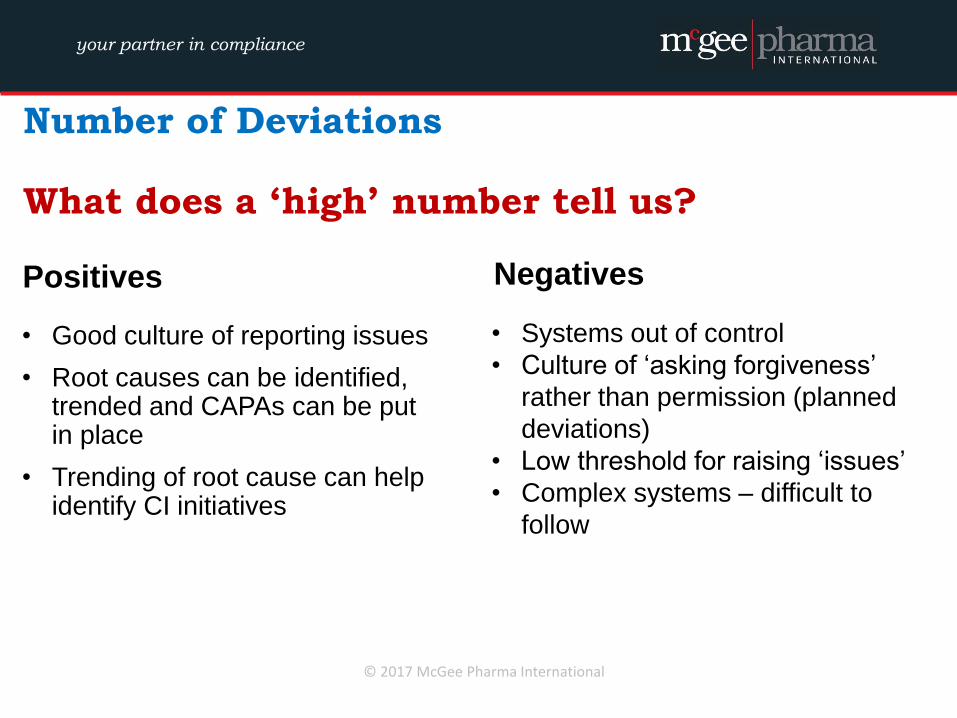
Number of Deviations What does a ‘high’ number tell us?
Positives
• Good culture of reporting issues
• Root causes can be identified, trended and CAPAs can be put in place
• Trending of root cause can help identify CI initiatives
Negatives
• Systems out of control
• Culture of ‘asking forgiveness’
rather than permission (planned
deviations)
• Low threshold for raising ‘issues’
• Complex systems – difficult to
follow
© 2017 McGee Pharma International
your partner in compliance
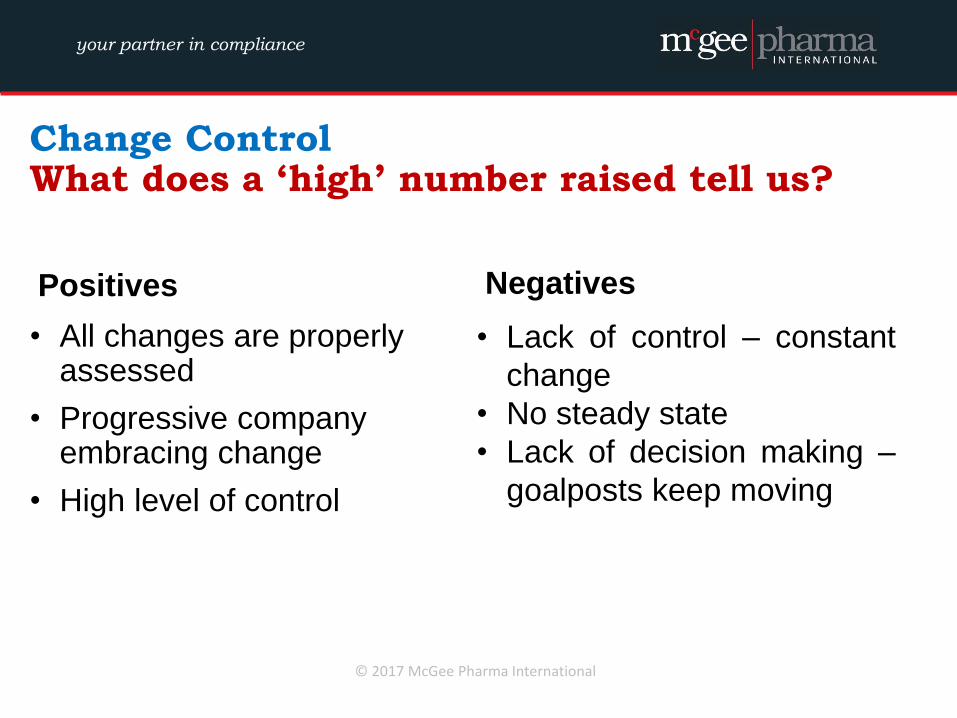
Change Control What does a ‘high’ number raised tell us?
Positives
• All changes are properly assessed
• Progressive company embracing change
• High level of control
Negatives
• Lack of control – constant
change
• No steady state
• Lack of decision making –
goalposts keep moving
© 2017 McGee Pharma International
your partner in compliance
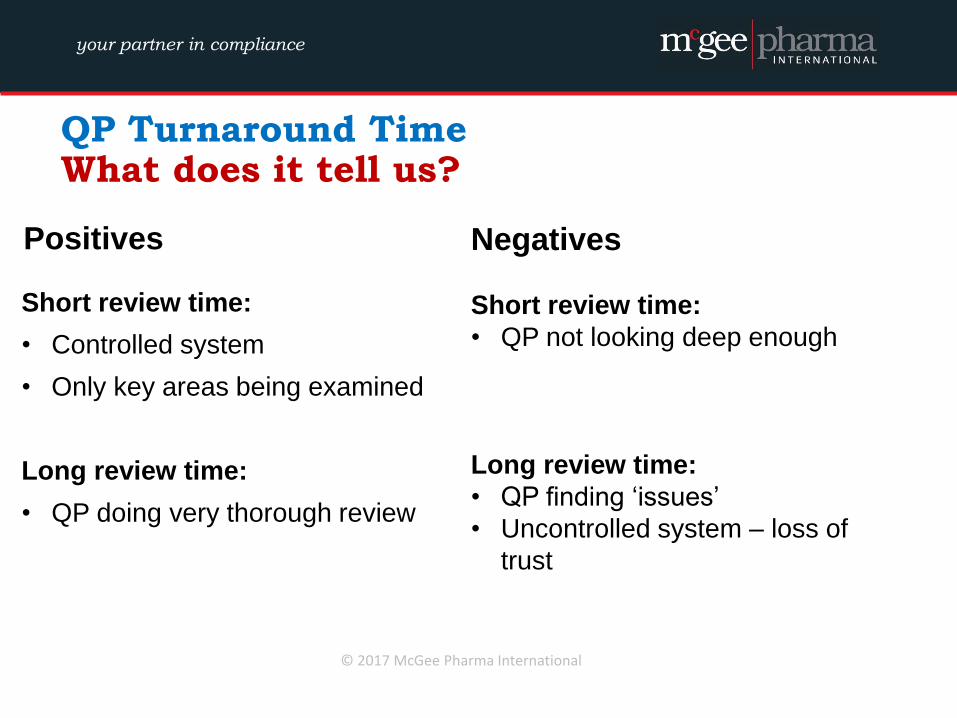
QP Turnaround Time What does it tell us?
Positives
Short review time:
• Controlled system
• Only key areas being examined
Long review time:
• QP doing very thorough review
Negatives
Short review time:
• QP not looking deep enough
Long review time:
• QP finding ‘issues’
• Uncontrolled system – loss of
trust
© 2017 McGee Pharma International
your partner in compliance
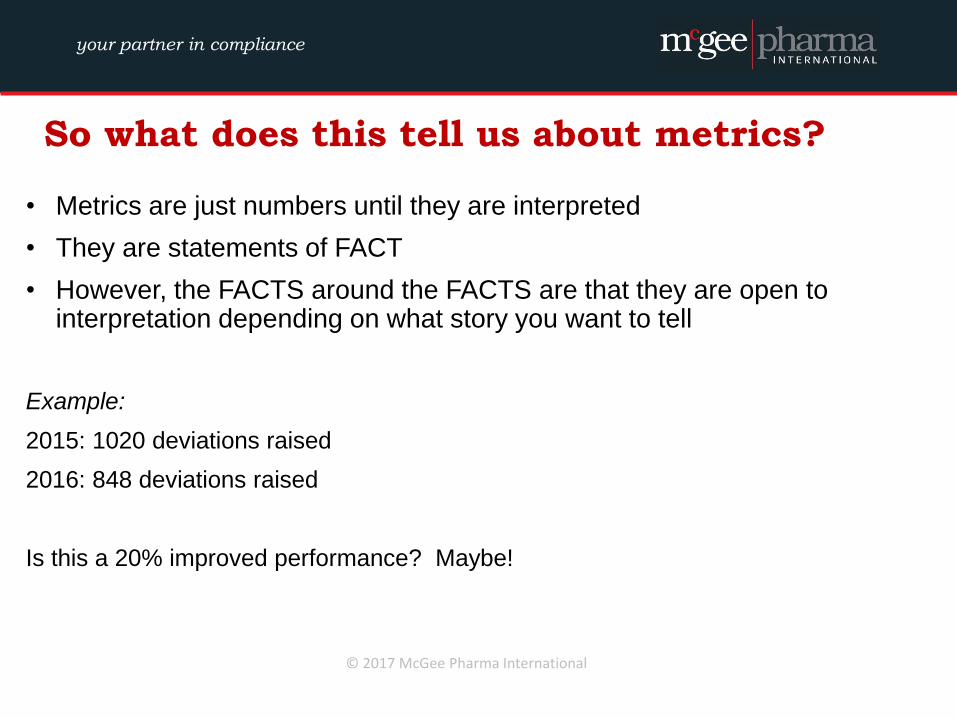
So what does this tell us about metrics?
• Metrics are just numbers until they are interpreted
• They are statements of FACT
• However, the FACTS around the FACTS are that they are open to interpretation depending on what story you want to tell
Example:
2015: 1020 deviations raised
2016: 848 deviations raised
Is this a 20% improved performance? Maybe!
© 2017 McGee Pharma International
your partner in compliance
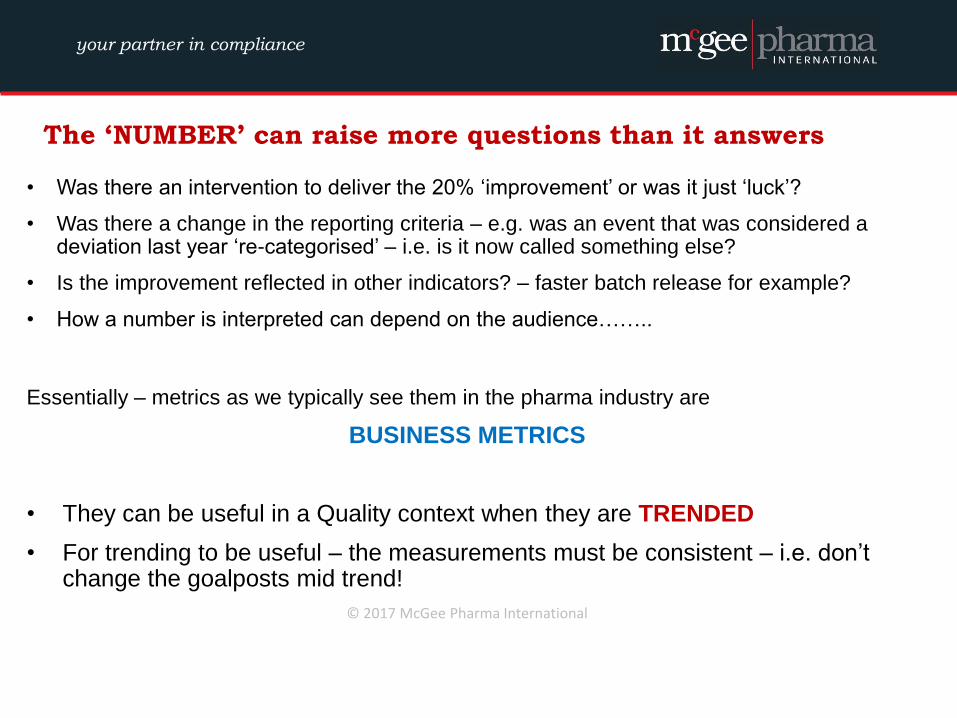
The ‘NUMBER’ can raise more questions than it answers
• Was there an intervention to deliver the 20% ‘improvement’ or was it just ‘luck’?
• Was there a change in the reporting criteria – e.g. was an event that was considered a deviation last year ‘re-categorised’ – i.e. is it now called something else?
• Is the improvement reflected in other indicators? – faster batch release for example?
• How a number is interpreted can depend on the audience……..
Essentially – metrics as we typically see them in the pharma industry are
BUSINESS METRICS
• They can be useful in a Quality context when they are TRENDED
• For trending to be useful – the measurements must be consistent – i.e. don’t change the goalposts mid trend!
© 2017 McGee Pharma International
your partner in compliance
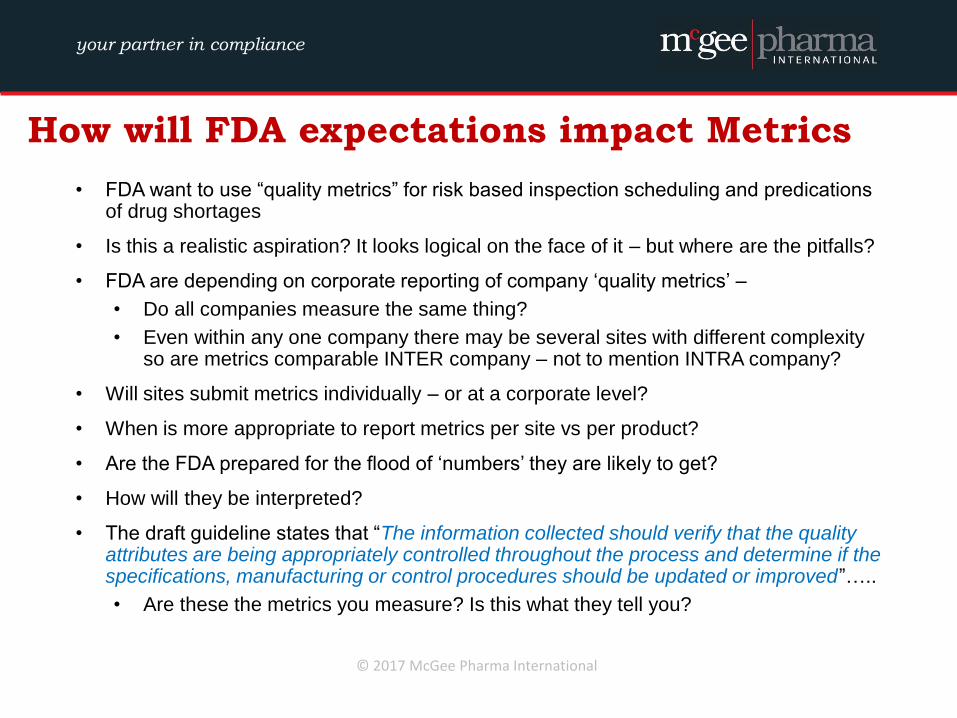
How will FDA expectations impact Metrics
• FDA want to use “quality metrics” for risk based inspection scheduling and predications of drug shortages
• Is this a realistic aspiration? It looks logical on the face of it – but where are the pitfalls?
• FDA are depending on corporate reporting of company ‘quality metrics’ –
• Do all companies measure the same thing?
• Even within any one company there may be several sites with different complexity so are metrics comparable INTER company – not to mention INTRA company?
• Will sites submit metrics individually – or at a corporate level?
• When is more appropriate to report metrics per site vs per product?
• Are the FDA prepared for the flood of ‘numbers’ they are likely to get?
• How will they be interpreted?
• The draft guideline states that “The information collected should verify that the quality attributes are being appropriately controlled throughout the process and determine if the specifications, manufacturing or control procedures should be updated or improved”…..
• Are these the metrics you measure? Is this what they tell you?
© 2017 McGee Pharma International
your partner in compliance
© 2017 McGee Pharma International 32
Designing an Effective
Quality Metrics Programme
Some Considerations!
your partner in compliance
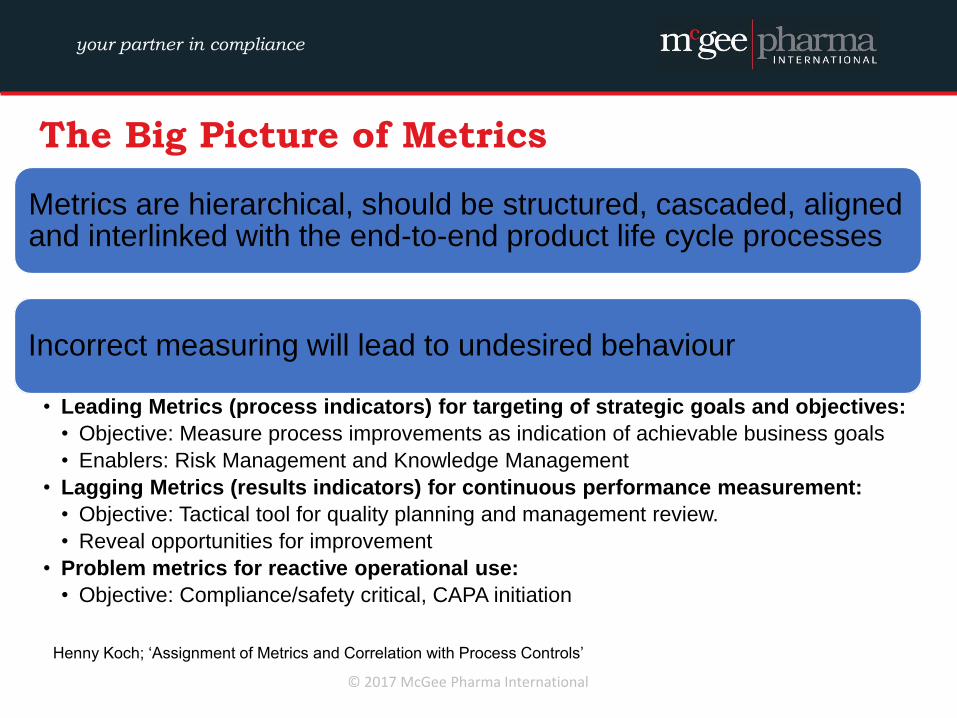
The Big Picture of Metrics
Metrics are hierarchical, should be structured, cascaded, aligned and interlinked with the end-to-end product life cycle processes
Incorrect measuring will lead to undesired behaviour
• Leading Metrics (process indicators) for targeting of strategic goals and objectives:
• Objective: Measure process improvements as indication of achievable business goals
• Enablers: Risk Management and Knowledge Management
• Lagging Metrics (results indicators) for continuous performance measurement:
• Objective: Tactical tool for quality planning and management review.
• Reveal opportunities for improvement
• Problem metrics for reactive operational use:
• Objective: Compliance/safety critical, CAPA initiation
Henny Koch; ‘Assignment of Metrics and Correlation with Process Controls’
© 2017 McGee Pharma International
your partner in compliance
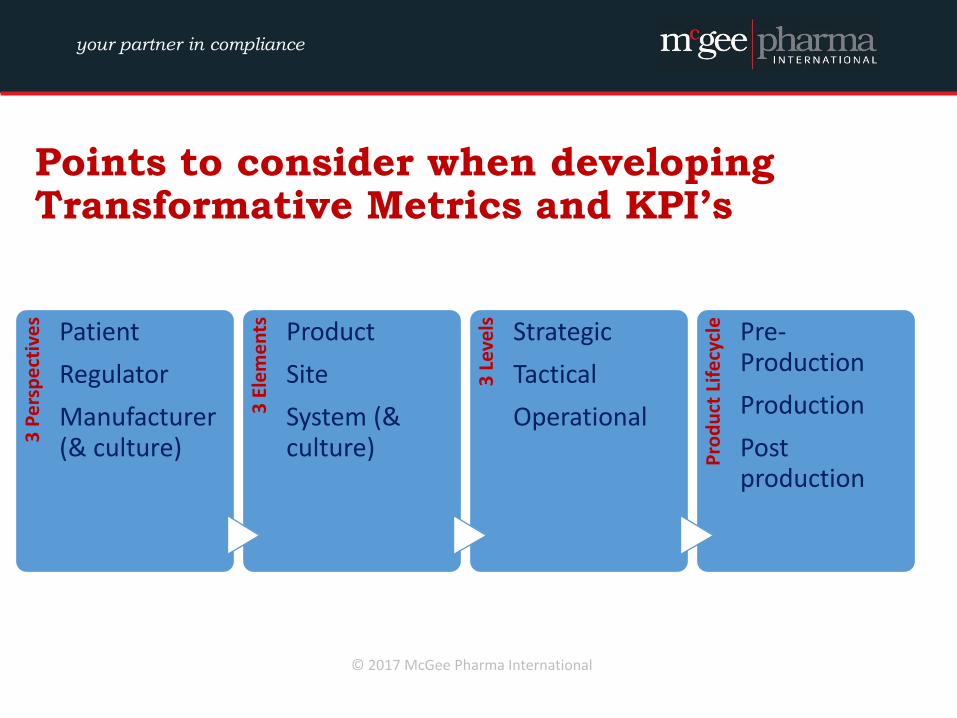
Points to consider when developing Transformative Metrics and KPI’s
3 P
ers
pe
ctiv
es
Patient
Regulator
Manufacturer (& culture)
3 E
lem
en
ts
Product
Site
System (& culture)
3 L
eve
ls
Strategic
Tactical
Operational
Pro
du
ct L
ife
cycl
e
Pre-Production
Production
Post production
© 2017 McGee Pharma International
your partner in compliance
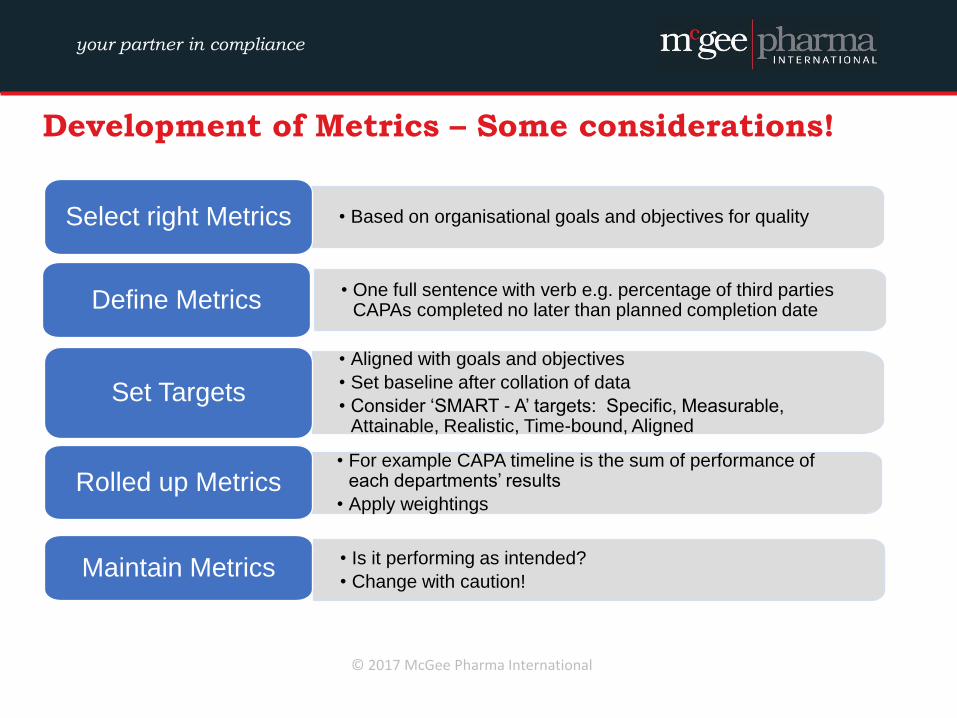
Development of Metrics – Some considerations!
• Based on organisational goals and objectives for quality Select right Metrics
• One full sentence with verb e.g. percentage of third parties CAPAs completed no later than planned completion date Define Metrics
• Aligned with goals and objectives
• Set baseline after collation of data
• Consider ‘SMART - A’ targets: Specific, Measurable, Attainable, Realistic, Time-bound, Aligned
Set Targets
• For example CAPA timeline is the sum of performance of each departments’ results
• Apply weightings Rolled up Metrics
• Is it performing as intended?
• Change with caution! Maintain Metrics
© 2017 McGee Pharma International

your partner in compliance
Xavier University/PwC Final List of Proposed Metrics
© 2017 McGee Pharma International
your partner in compliance
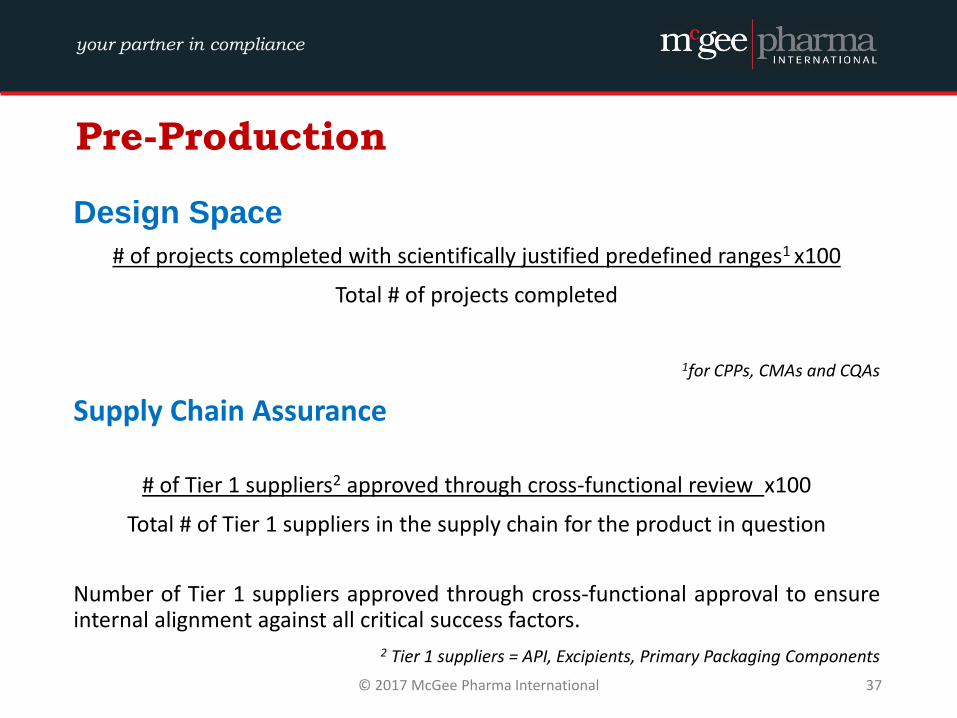
Pre-Production
Design Space
# of projects completed with scientifically justified predefined ranges1 x100
Total # of projects completed
1for CPPs, CMAs and CQAs
Supply Chain Assurance
# of Tier 1 suppliers2 approved through cross-functional review x100
Total # of Tier 1 suppliers in the supply chain for the product in question
Number of Tier 1 suppliers approved through cross-functional approval to ensure internal alignment against all critical success factors.
2 Tier 1 suppliers = API, Excipients, Primary Packaging Components
© 2017 McGee Pharma International 37
your partner in compliance
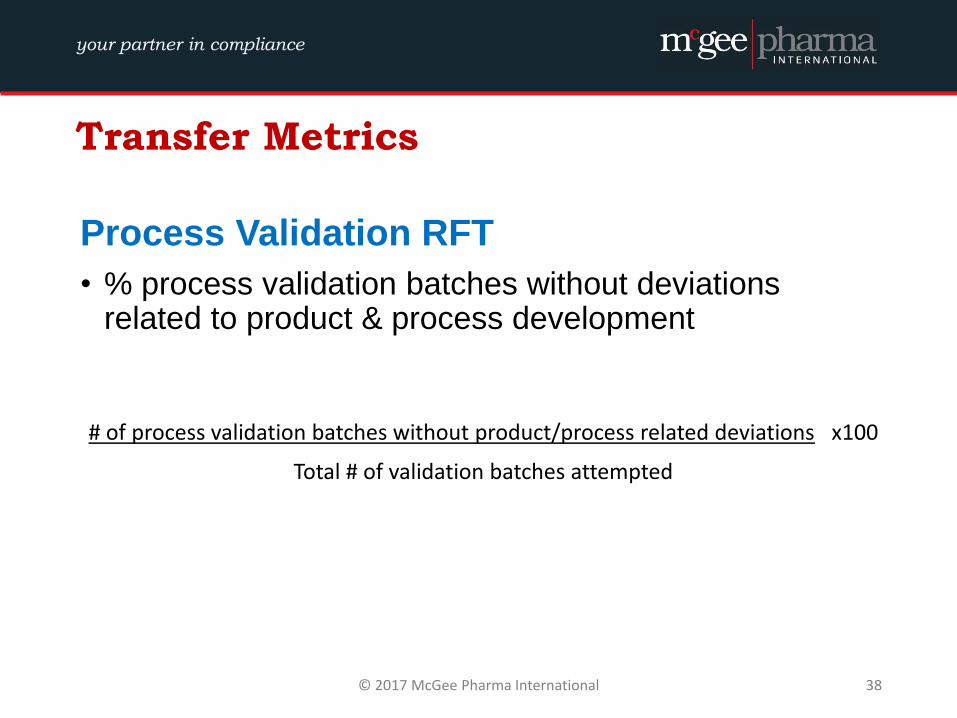
Transfer Metrics
Process Validation RFT
• % process validation batches without deviations related to product & process development
# of process validation batches without product/process related deviations x100
Total # of validation batches attempted
© 2017 McGee Pharma International 38
your partner in compliance
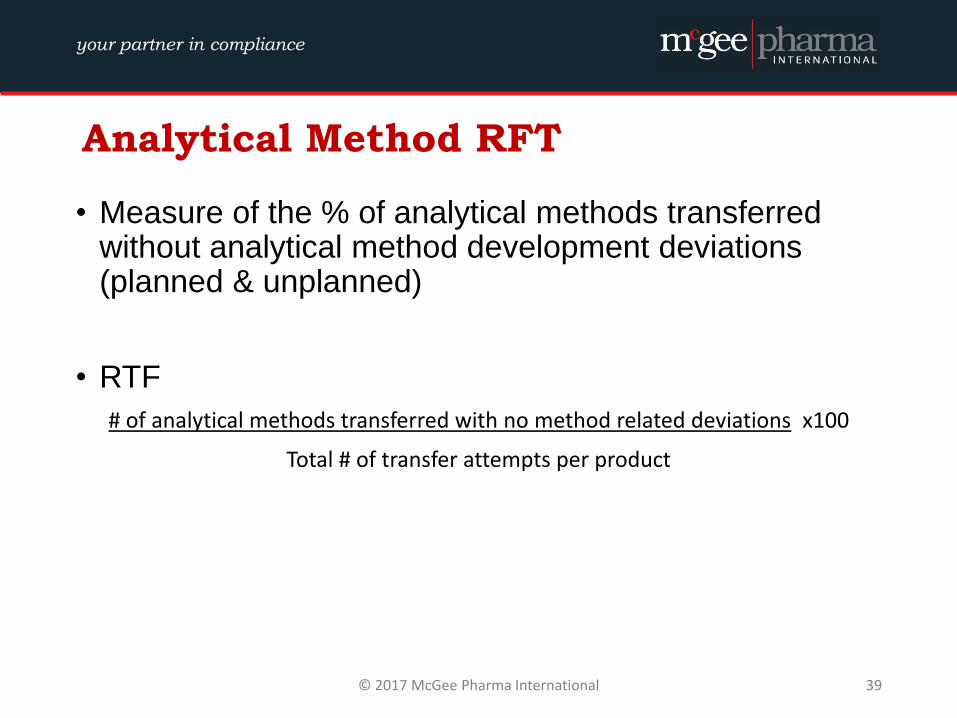
Analytical Method RFT
• Measure of the % of analytical methods transferred without analytical method development deviations (planned & unplanned)
• RTF
# of analytical methods transferred with no method related deviations x100
Total # of transfer attempts per product
© 2017 McGee Pharma International 39
your partner in compliance
Production Metrics
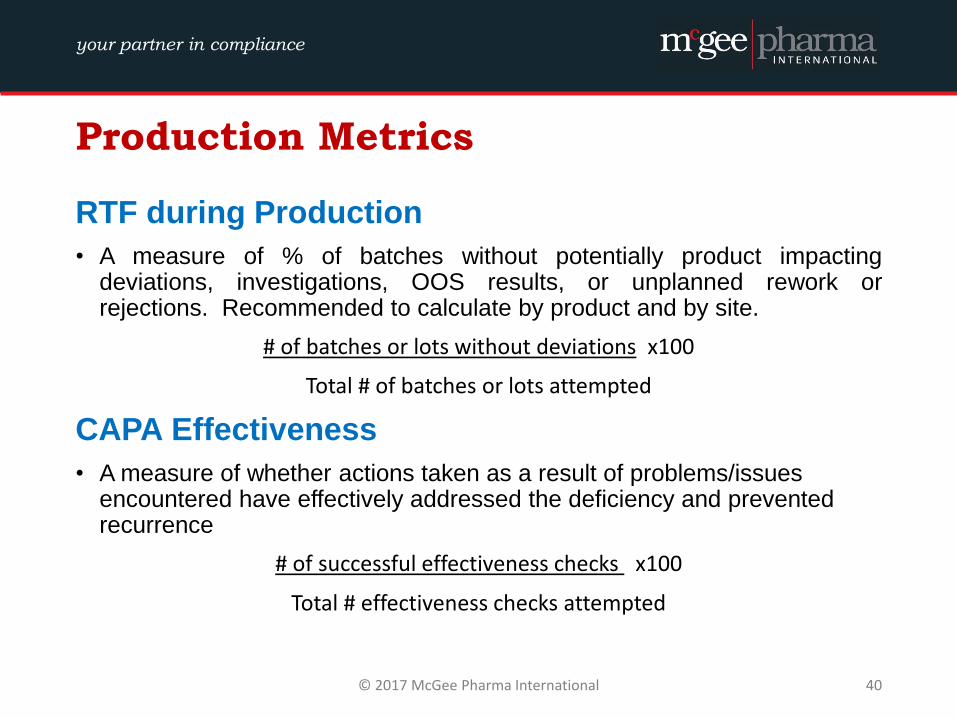
RTF during Production
• A measure of % of batches without potentially product impacting deviations, investigations, OOS results, or unplanned rework or rejections. Recommended to calculate by product and by site.
# of batches or lots without deviations x100
Total # of batches or lots attempted
CAPA Effectiveness
• A measure of whether actions taken as a result of problems/issues encountered have effectively addressed the deficiency and prevented recurrence
# of successful effectiveness checks x100
Total # effectiveness checks attempted
© 2017 McGee Pharma International 40
your partner in compliance
Production Metrics (2)
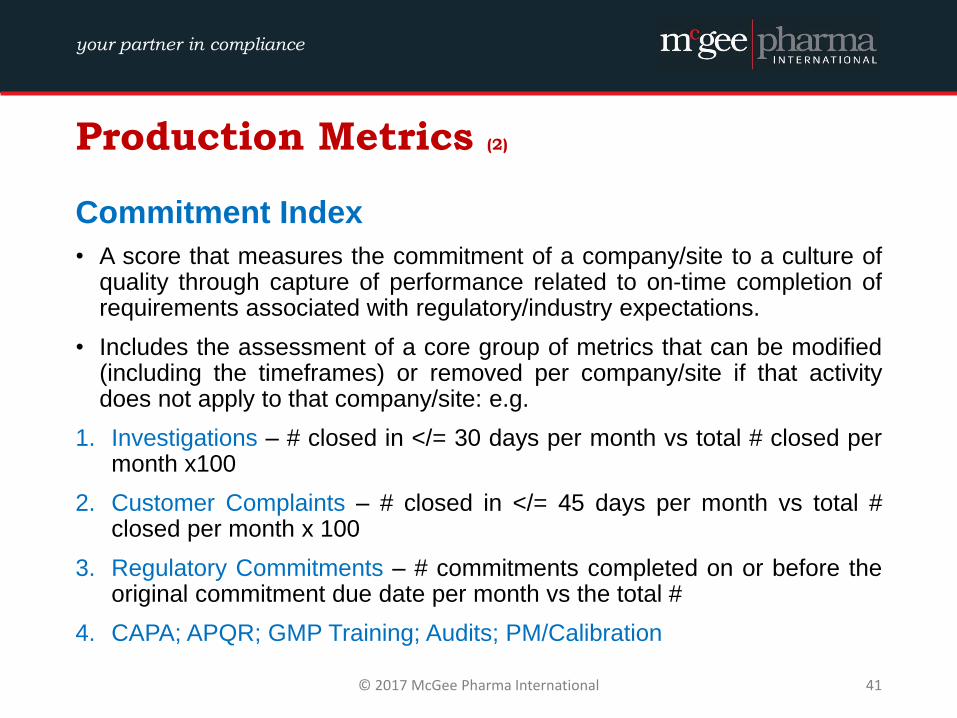
Commitment Index
• A score that measures the commitment of a company/site to a culture of quality through capture of performance related to on-time completion of requirements associated with regulatory/industry expectations.
• Includes the assessment of a core group of metrics that can be modified (including the timeframes) or removed per company/site if that activity does not apply to that company/site: e.g.
1. Investigations – # closed in </= 30 days per month vs total # closed per month x100
2. Customer Complaints – # closed in </= 45 days per month vs total # closed per month x 100
3. Regulatory Commitments – # commitments completed on or before the original commitment due date per month vs the total #
4. CAPA; APQR; GMP Training; Audits; PM/Calibration
© 2017 McGee Pharma International 41
your partner in compliance
Production Metrics (3)
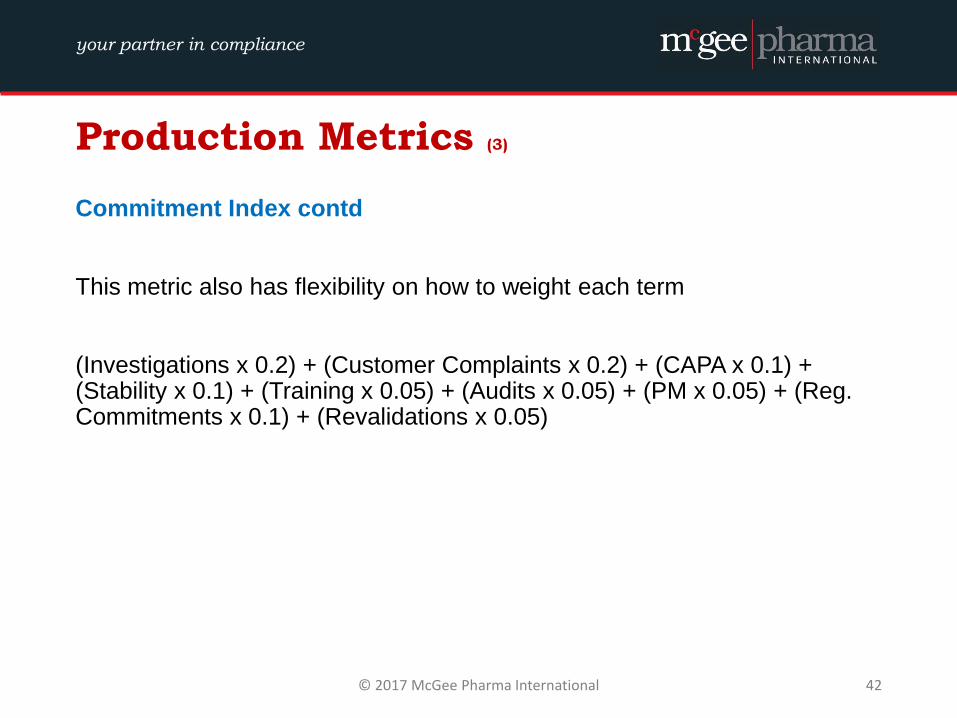
Commitment Index contd
This metric also has flexibility on how to weight each term
(Investigations x 0.2) + (Customer Complaints x 0.2) + (CAPA x 0.1) + (Stability x 0.1) + (Training x 0.05) + (Audits x 0.05) + (PM x 0.05) + (Reg. Commitments x 0.1) + (Revalidations x 0.05)
© 2017 McGee Pharma International 42
your partner in compliance
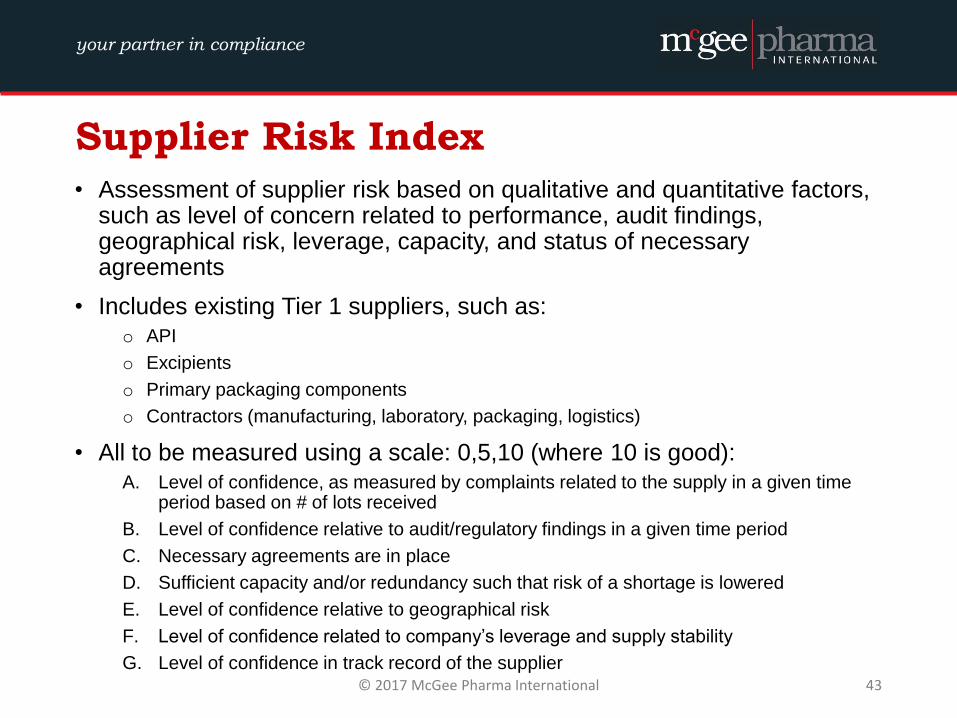
Supplier Risk Index
• Assessment of supplier risk based on qualitative and quantitative factors, such as level of concern related to performance, audit findings, geographical risk, leverage, capacity, and status of necessary agreements
• Includes existing Tier 1 suppliers, such as: o API
o Excipients
o Primary packaging components
o Contractors (manufacturing, laboratory, packaging, logistics)
• All to be measured using a scale: 0,5,10 (where 10 is good): A. Level of confidence, as measured by complaints related to the supply in a given time
period based on # of lots received
B. Level of confidence relative to audit/regulatory findings in a given time period
C. Necessary agreements are in place
D. Sufficient capacity and/or redundancy such that risk of a shortage is lowered
E. Level of confidence relative to geographical risk
F. Level of confidence related to company’s leverage and supply stability
G. Level of confidence in track record of the supplier
© 2017 McGee Pharma International 43
your partner in compliance
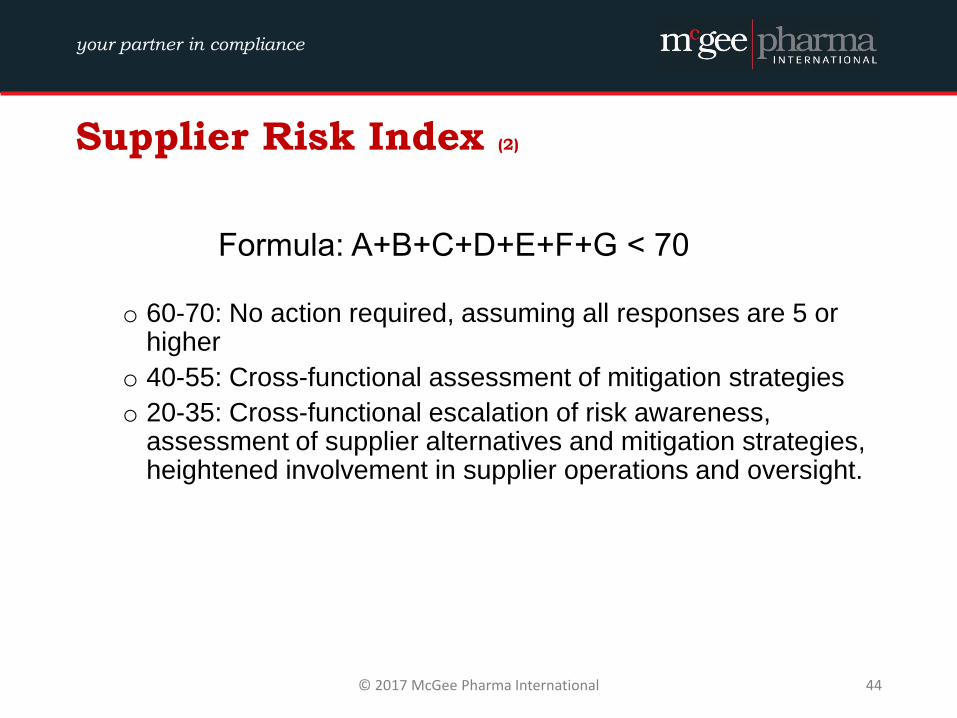
Supplier Risk Index (2)
Formula: A+B+C+D+E+F+G ˂ 70
o 60-70: No action required, assuming all responses are 5 or higher
o 40-55: Cross-functional assessment of mitigation strategies
o 20-35: Cross-functional escalation of risk awareness, assessment of supplier alternatives and mitigation strategies, heightened involvement in supplier operations and oversight.
© 2017 McGee Pharma International 44
your partner in compliance
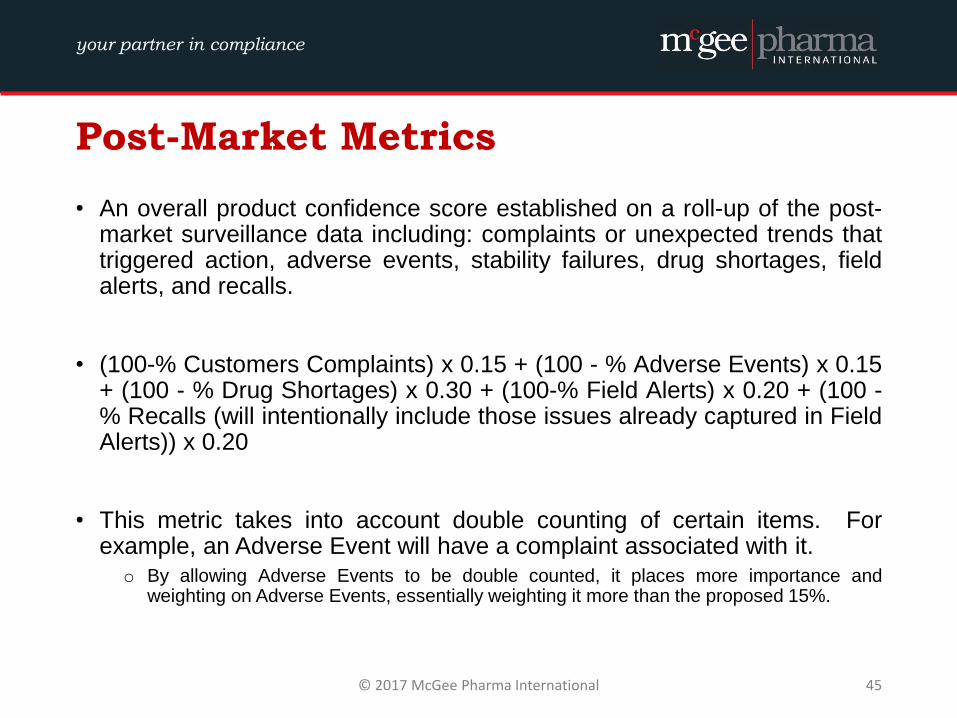
Post-Market Metrics
• An overall product confidence score established on a roll-up of the post-market surveillance data including: complaints or unexpected trends that triggered action, adverse events, stability failures, drug shortages, field alerts, and recalls.
• (100-% Customers Complaints) x 0.15 + (100 - % Adverse Events) x 0.15 + (100 - % Drug Shortages) x 0.30 + (100-% Field Alerts) x 0.20 + (100 -% Recalls (will intentionally include those issues already captured in Field Alerts)) x 0.20
• This metric takes into account double counting of certain items. For example, an Adverse Event will have a complaint associated with it.
o By allowing Adverse Events to be double counted, it places more importance and weighting on Adverse Events, essentially weighting it more than the proposed 15%.
© 2017 McGee Pharma International 45
your partner in compliance
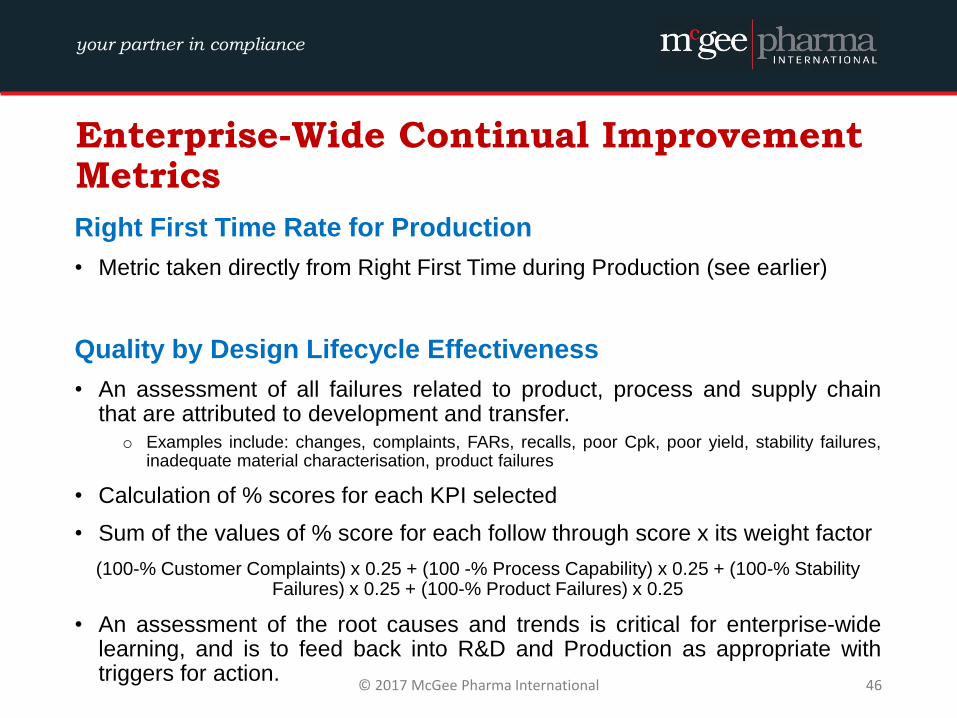
Enterprise-Wide Continual Improvement Metrics
Right First Time Rate for Production
• Metric taken directly from Right First Time during Production (see earlier)
Quality by Design Lifecycle Effectiveness
• An assessment of all failures related to product, process and supply chain that are attributed to development and transfer.
o Examples include: changes, complaints, FARs, recalls, poor Cpk, poor yield, stability failures, inadequate material characterisation, product failures
• Calculation of % scores for each KPI selected
• Sum of the values of % score for each follow through score x its weight factor
(100-% Customer Complaints) x 0.25 + (100 -% Process Capability) x 0.25 + (100-% Stability Failures) x 0.25 + (100-% Product Failures) x 0.25
• An assessment of the root causes and trends is critical for enterprise-wide learning, and is to feed back into R&D and Production as appropriate with triggers for action.
© 2017 McGee Pharma International 46
your partner in compliance
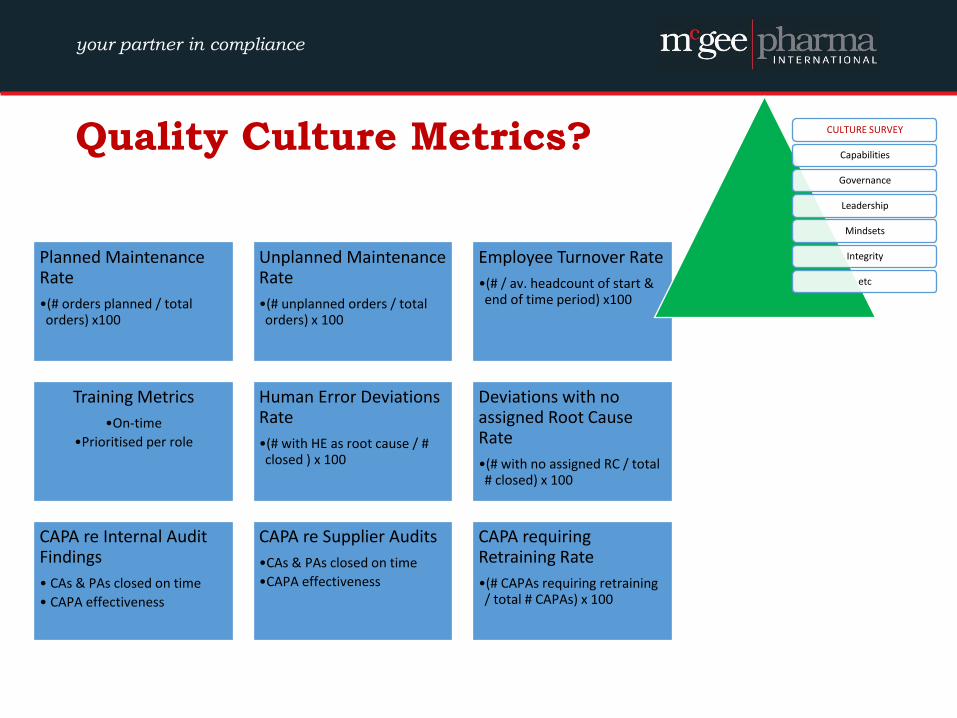
Quality Culture Metrics?
Planned Maintenance Rate
•(# orders planned / total orders) x100
Unplanned Maintenance Rate
•(# unplanned orders / total orders) x 100
Employee Turnover Rate
•(# / av. headcount of start & end of time period) x100
Training Metrics
•On-time
•Prioritised per role
Human Error Deviations Rate
•(# with HE as root cause / # closed ) x 100
Deviations with no assigned Root Cause Rate
•(# with no assigned RC / total # closed) x 100
CAPA re Internal Audit Findings
• CAs & PAs closed on time
• CAPA effectiveness
CAPA re Supplier Audits
•CAs & PAs closed on time
•CAPA effectiveness
CAPA requiring Retraining Rate
•(# CAPAs requiring retraining / total # CAPAs) x 100
CULTURE SURVEY
Capabilities
Governance
Leadership
Mindsets
Integrity
etc
your partner in compliance
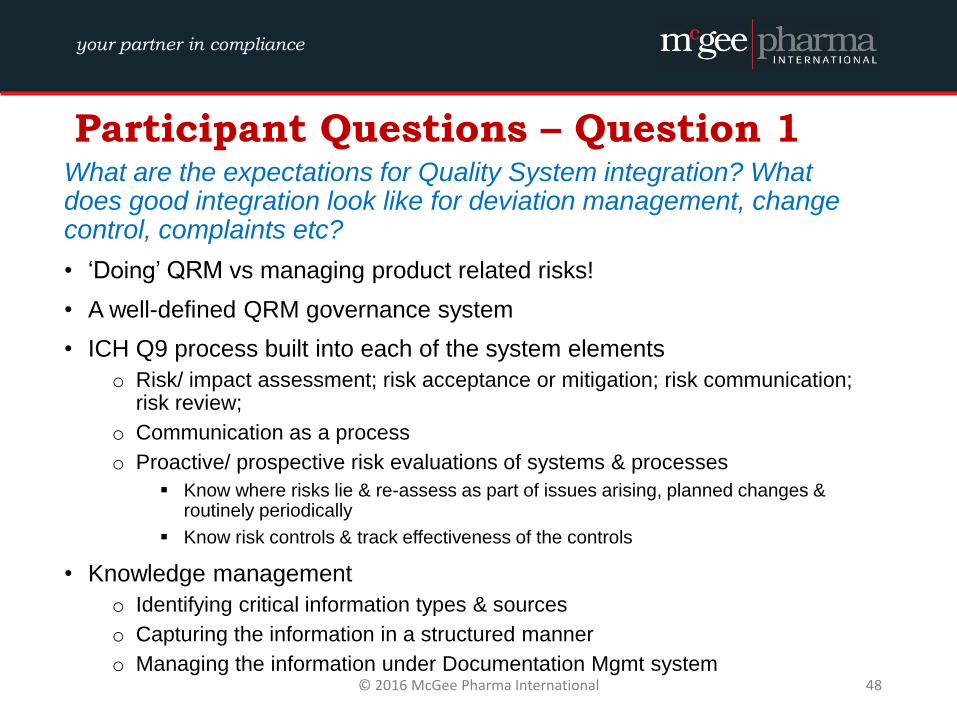
Participant Questions – Question 1 What are the expectations for Quality System integration? What does good integration look like for deviation management, change control, complaints etc?
• ‘Doing’ QRM vs managing product related risks!
• A well-defined QRM governance system
• ICH Q9 process built into each of the system elements
o Risk/ impact assessment; risk acceptance or mitigation; risk communication; risk review;
o Communication as a process
o Proactive/ prospective risk evaluations of systems & processes
Know where risks lie & re-assess as part of issues arising, planned changes & routinely periodically
Know risk controls & track effectiveness of the controls
• Knowledge management
o Identifying critical information types & sources
o Capturing the information in a structured manner
o Managing the information under Documentation Mgmt system
© 2016 McGee Pharma International 48
your partner in compliance
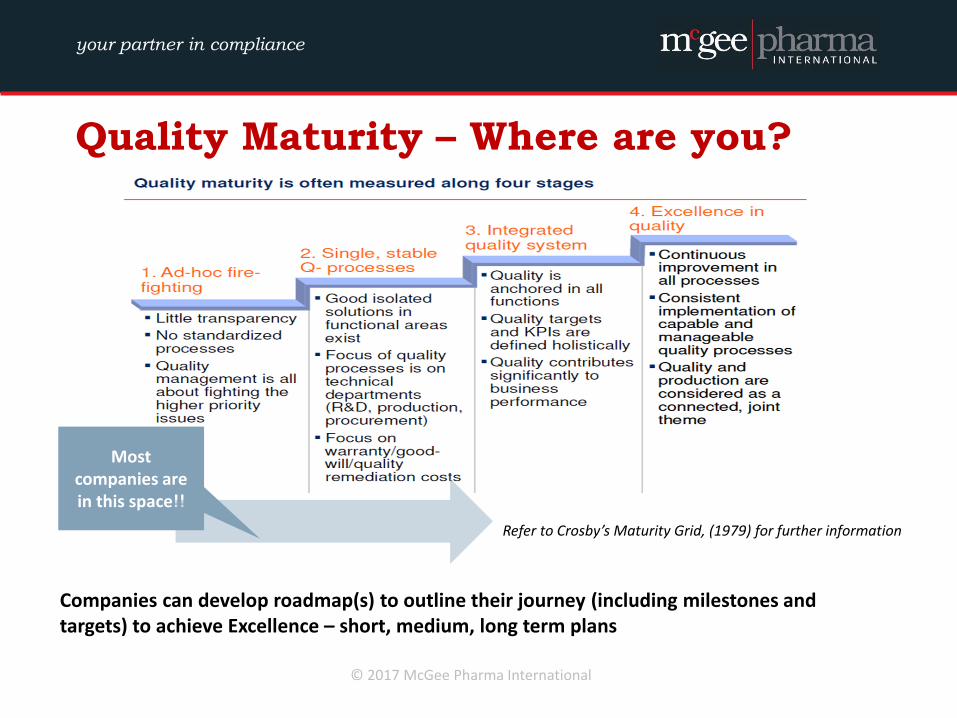
Quality Maturity – Where are you?
Most companies are in this space!!
Refer to Crosby’s Maturity Grid, (1979) for further information
Companies can develop roadmap(s) to outline their journey (including milestones and targets) to achieve Excellence – short, medium, long term plans
© 2017 McGee Pharma International
your partner in compliance
Participant Questions – Question 2
Leading metrics vs Lagging metrics. Meaningful metrics in the virtual pharma world?
• Leading vs Lagging metrics o Definitions - refer to slide deck
o Examples – covered in session
• Meaningful metrics – covered in session
© 2016 McGee Pharma International 50
your partner in compliance
Participant Questions – Question 3
Closure risk assessments’ appropriate to use? Should it be carried out in conjunction with a formal risk assessment or can it be used as a stand alone? Formal vs informal assessment?
• Tools to perform RA to be selected by the users
o Appropriate to the type of RA required
o Refer to ICH Q9 toolbox for guidance
• No clear definitions of formal vs informal RA o Refer to PDA Ireland website – QRM Seminar 20 March & next slides
© 2016 McGee Pharma International 51
your partner in compliance
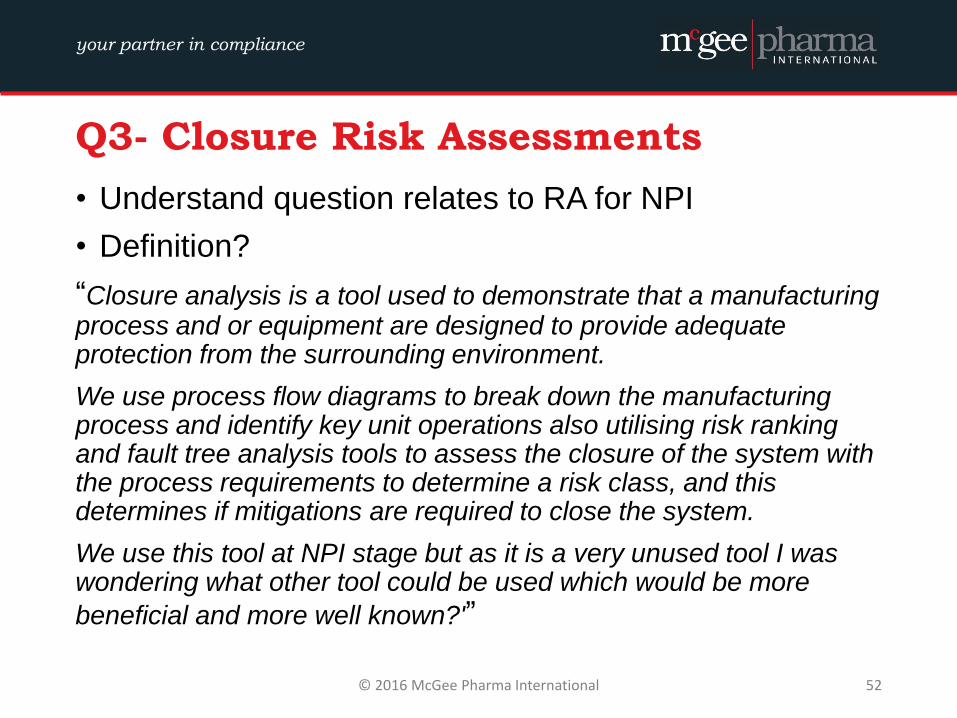
Q3- Closure Risk Assessments
• Understand question relates to RA for NPI
• Definition?
“Closure analysis is a tool used to demonstrate that a manufacturing process and or equipment are designed to provide adequate protection from the surrounding environment.
We use process flow diagrams to break down the manufacturing process and identify key unit operations also utilising risk ranking and fault tree analysis tools to assess the closure of the system with the process requirements to determine a risk class, and this determines if mitigations are required to close the system.
We use this tool at NPI stage but as it is a very unused tool I was wondering what other tool could be used which would be more
beneficial and more well known?'”
© 2016 McGee Pharma International 52
your partner in compliance
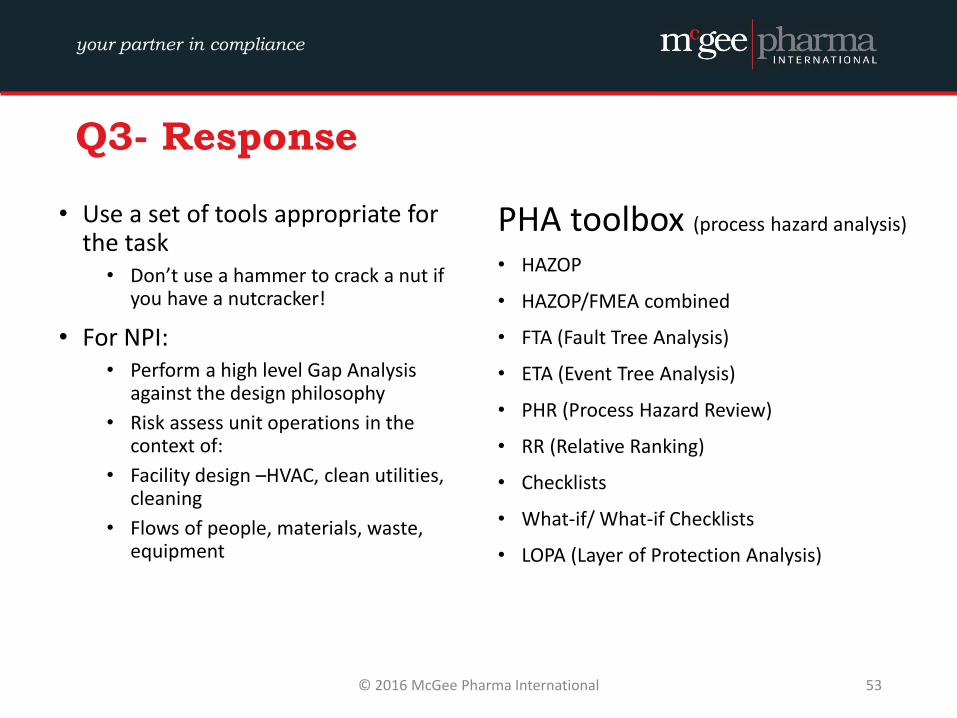
• Use a set of tools appropriate for the task
• Don’t use a hammer to crack a nut if you have a nutcracker!
• For NPI: • Perform a high level Gap Analysis
against the design philosophy
• Risk assess unit operations in the context of:
• Facility design –HVAC, clean utilities, cleaning
• Flows of people, materials, waste, equipment
PHA toolbox (process hazard analysis)
• HAZOP
• HAZOP/FMEA combined
• FTA (Fault Tree Analysis)
• ETA (Event Tree Analysis)
• PHR (Process Hazard Review)
• RR (Relative Ranking)
• Checklists
• What-if/ What-if Checklists
• LOPA (Layer of Protection Analysis)
© 2016 McGee Pharma International 53
Q3- Response
your partner in compliance
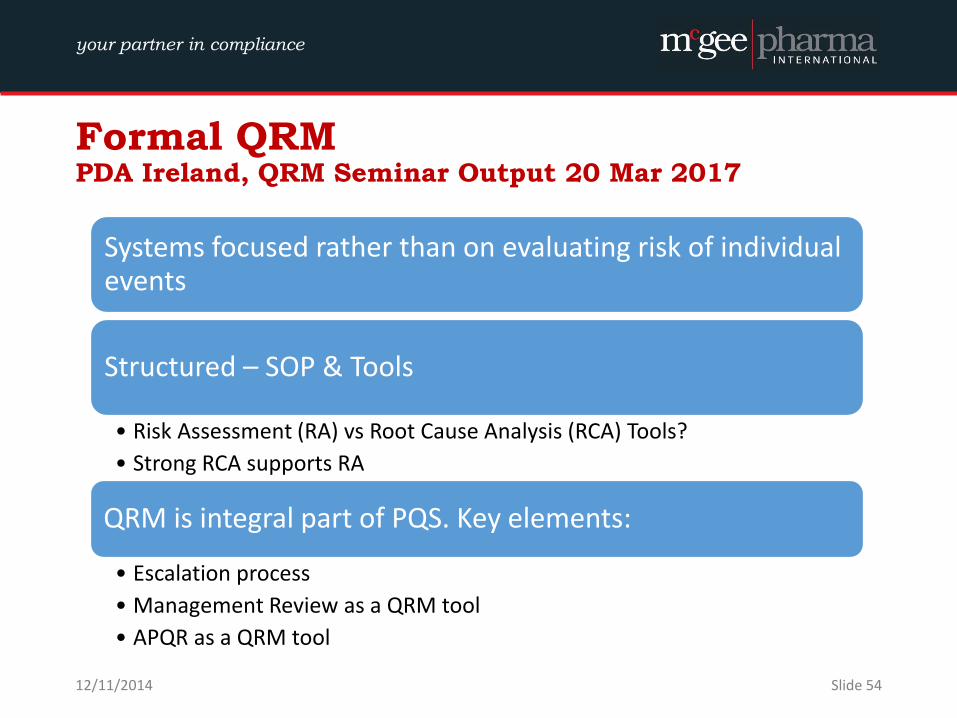
Formal QRM PDA Ireland, QRM Seminar Output 20 Mar 2017
Systems focused rather than on evaluating risk of individual events
Structured – SOP & Tools
• Risk Assessment (RA) vs Root Cause Analysis (RCA) Tools?
• Strong RCA supports RA
QRM is integral part of PQS. Key elements:
• Escalation process
• Management Review as a QRM tool
• APQR as a QRM tool
12/11/2014 Slide 54
your partner in compliance
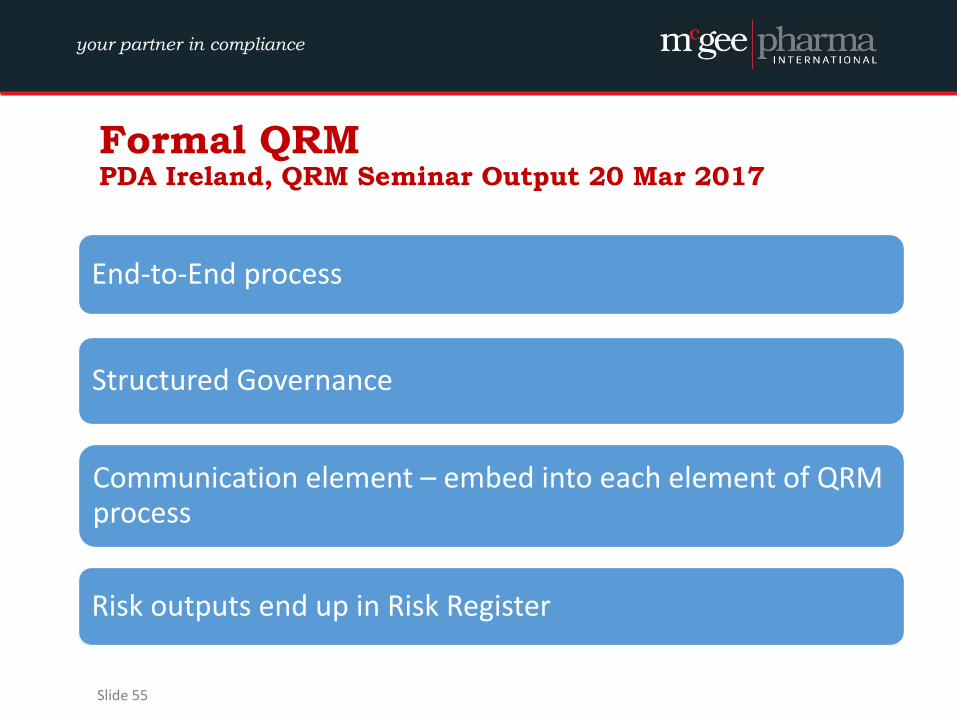
Formal QRM PDA Ireland, QRM Seminar Output 20 Mar 2017
End-to-End process
Structured Governance
Communication element – embed into each element of QRM process
Risk outputs end up in Risk Register
Slide 55
your partner in compliance
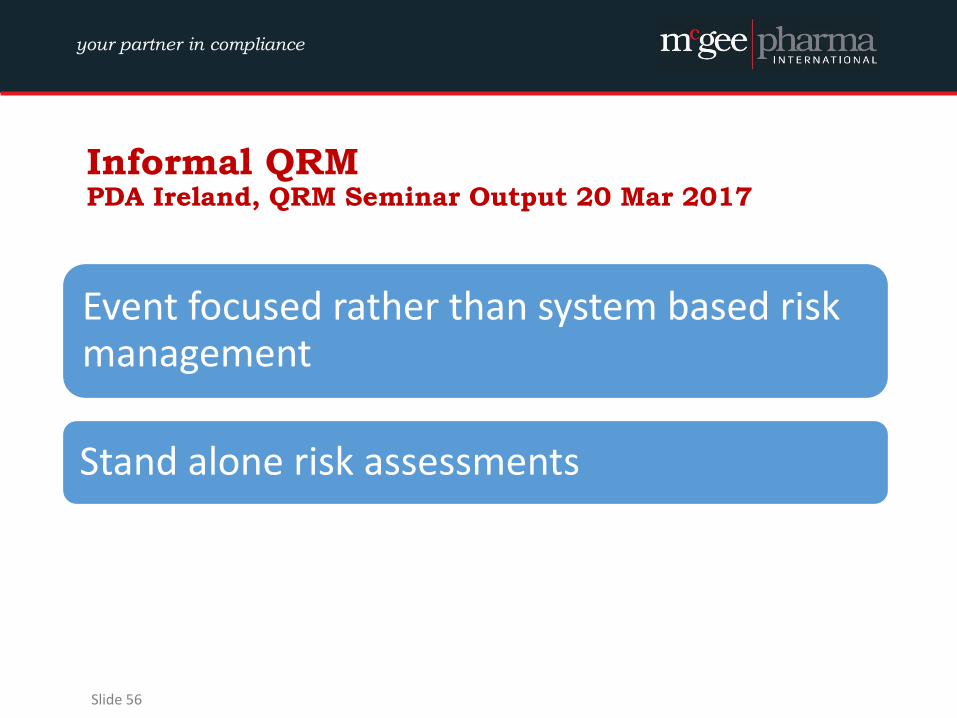
Informal QRM PDA Ireland, QRM Seminar Output 20 Mar 2017
Event focused rather than system based risk management
Stand alone risk assessments
Slide 56
your partner in compliance
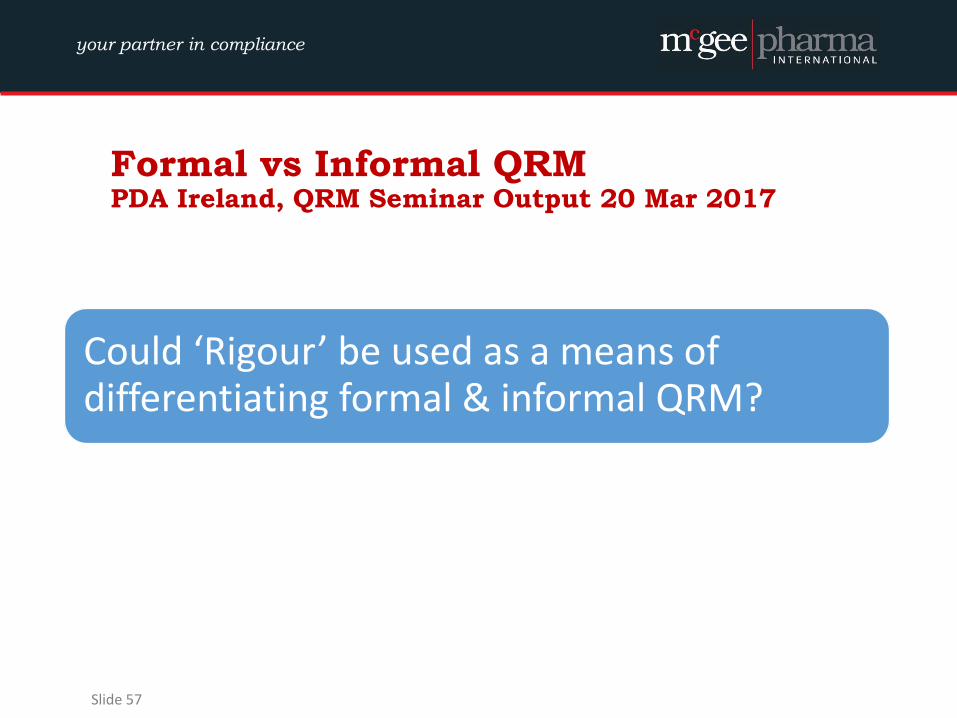
Formal vs Informal QRM PDA Ireland, QRM Seminar Output 20 Mar 2017
Could ‘Rigour’ be used as a means of differentiating formal & informal QRM?
• Definition of Rigour?
Slide 57
your partner in compliance
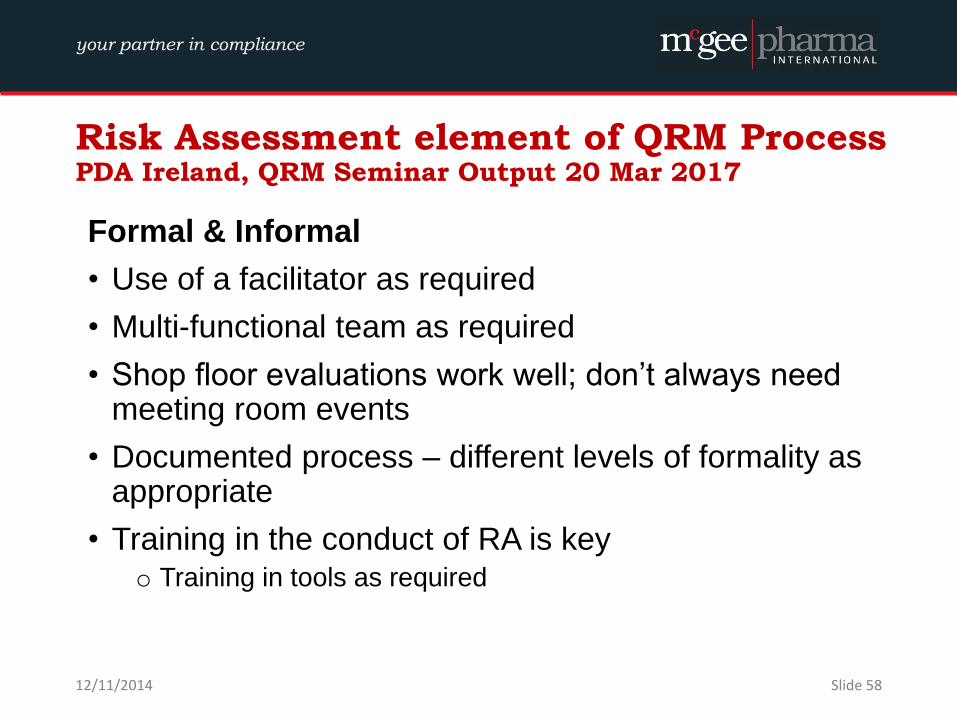
Risk Assessment element of QRM Process PDA Ireland, QRM Seminar Output 20 Mar 2017
12/11/2014 Slide 58
Formal & Informal
• Use of a facilitator as required
• Multi-functional team as required
• Shop floor evaluations work well; don’t always need meeting room events
• Documented process – different levels of formality as appropriate
• Training in the conduct of RA is key o Training in tools as required
your partner in compliance
What does the Future Hold?
© 2017 McGee Pharma International
your partner in compliance
Present and Future Expected Developments
Traditional GMP and QA have now evolved into the overall Pharmaceutical Quality System
Lifecycle Approach – Quality embedded from development though to post-marketing and ongoing monitoring (note upcoming ICH Q12)
Active CAPA and CAPA effectiveness management
Supply chain and distribution - controls and oversight
MA Compliance – transparency for manufacturing sites
Data integrity
your partner in compliance
Present and Future Expected Developments
FDA & EMA may request quality metrics
Further transitioning from a reactive to proactive quality culture
Further use of quality metrics to ensure reliable, consistent processes
More electronic systems are now generating metrics
Quality Management Review – metrics play a key role to help identify risks and challenges and to ensure improvement planning and delivery of actions
© 2017 McGee Pharma International
your partner in compliance
Current Challenges within the Industry
Balance time to generate sufficient metrics with time for action
Visual information adequate to drive action
Not overloading people with metrics
Less may be more !
Optimising teamwork and partnership
Quality personnel interacting from development through
the product lifecycle to pharmacovigilance (looping back)
LEAN programmes - building in the ‘pillar of Quality’
High business pace – challenge to get products to market, even faster
Process mapping skills – adequate to achieve the best outputs
Time to allow adequate QbD during product development
your partner in compliance
Current Challenges within the Industry
Use of trends and statistics
Trained personnel, adequate skills
Understanding the limitations
How much is enough?
Skills for process mapping and problem solving
Not wasting too much time mapping– plan so adequate time for ‘action’
Ensuring the right improvement actions are identified
Awareness of process demands downstream and upstream from you
Not just measuring process performances in isolation
Awareness of existing or other data, so not duplicating data
Adequate risk assessment skills
Qualitative vs quantitative approaches
Knowing the limitations, ensuring the right people inputs
your partner in compliance
Current Challenges within the Industry
Continuous Process Verification, PQR and Quality
Management Reviews – connecting data
Optimising data generation and review processes
so that they are action focussed and drive real
improvements for the overall business
Establishing the best system for sharing of metrics
Visual systems
Adequate information for internal personnel
Also facilitating visitors and inspectors!
© 2017 McGee Pharma International
your partner in compliance
Effective Quality Metrics - Benefits
These assist the delivery of improved performance
Corporate quality goals cascading through the organisation - systemised
Small number of key metrics to highlight overall quality performance at corporate/senior level
Real risks are visible, leading to adequate improvement plans
Highlight opportunities for improved resource management
Metrics are established for key activities which are absorbing resources
Measure performance of Quality departments along with operational departments – fair is fair !
© 2017 McGee Pharma International
your partner in compliance
Benefits of Effective Quality Metrics
Help to increase personnel engagement with Quality improvement agendas
Performance awareness can lead to the right behaviours and interest
Invite departments to Quality review sessions and ensure data speaks!
Promote Quality and consider running awareness campaigns
Ensure Quality performance is communicated within operational metrics
Operational departments also present Quality metrics/improvement plans
Can lead to reductions in test levels and other controls – cost saving
Deceased frequencies/sampling levels for example
Can help to reduce quality defect levels – know where there is waste
Some Authorities highlight that despite QA and Quality System developments, levels of quality defect are still perceived to be high
Help to identify business areas worthy of future investment
supporting the journey towards operational excellence
your partner in compliance
Tips to Aid Effective Quality Metrics and Use
Clear roles/responsibilities - for metrics preparation and improvement actions. Ownership of metrics
Review the right performance data, at agreed frequencies
for example, at least weekly at operational level
‘stand around’ meetings at visual boards, action focussed
enable performance discussion and dialogue
boardroom vs “go see” and walkabouts
Perform data benchmarking across sites, within industry
to drive and maintain momentum
Recognition and reward
Ensure quality metrics are linked to business plans
Use metrics to build standard processes with standard times
© 2017 McGee Pharma International
your partner in compliance
Workshop Content
Background to QRM & expectations
Current Expectations of Regulators for Metrics
Typical Current Metrics?
What metrics do we see now?
Limitations on current metrics?
How to interpret metrics?
Considerations when designing a Quality Metrics Programme
Xavier University / PwC Quality Metrics
Questions received from participants
Conclusion- What the Future Holds
© 2017 McGee Pharma International
your partner in compliance
Quality Metrics
Some final food for thought….!
You get what you inspect,
not what you expect…
Is it wise to “ass.u.me” ?
Good data speaks !
© 2017 McGee Pharma International
your partner in compliance
Acknowledgements
• Marie O‘Callaghan, Sanofi, Waterford
• Team at MPI
© 2017 McGee Pharma International
your partner in compliance
Contact
© 2013 McGee Pharma International 71
A | Suite 2, Stafford House, Strand Road, Portmarnock, Co. Dublin, Ireland
P | +353 (0)1 846 47 42 E | [email protected]
F | +353 (0)1 846 4898 W| www.mcgeepharma.com