Embed Size (px)
Citation preview

youryour HOSTHOSTyouryour HOSTHOSTon the waterfrontwaterfront
HowMuchCoalCantheU.S.Export& HowMuchWill It Export?&HowMuchWillItExport?
Finn Host, Executive Vice President
Our only asset is our people. Our only product is our service. Let us put them to work for you.

T. Parker Host, Inc. – Agency• Full‐service ship agency since 1923Full service ship agency since 1923• Handle over 2,000 ships annually
T. Parker Host, Inc. – Cargo Services• Documentation, cargo supervision, KPI tracking, and other
transportation and logistical servicestransportation and logistical services• Currently handling over 60 million tons per year, mainly coal
Host Terminals – Stevedoring
• Terminal Operations in 7 East Coast locations• Handle over 5 million tons of bulk and break ‐ bulk cargoes annuallyHandle over 5 million tons of bulk and break ‐ bulk cargoes annually• Customers include Perdue, Alcoa, Enviva, Honeywell, Dominion Power

Our Port Service NORTHEAST• Baltimore• Sparrows PointNORTHEAST
• Bayonne
WEST GULF• Lake Charles
B t
EAST GULF• Mobile• Panama City
P l
• Cove Point• Piney Point• Philadelphia• Chester• Fairless Hills
• Bayonne• Morrisville• Bristol• Camden• Port Elizabeth
• Beaumont• Houston• Galveston• Port Arthur• Corpus Christi
• Pascagoula• Gulfport• New Orleans• Baton Rouge• Port Fourchon
Fairless Hills• Gloucester• Paulsboro• Camden• Marcus Hook
Cl t
• Trenton• NYC• Wilmington, DE
• Point Comfort• Brownsville• Freeport
• Morgan City• Venice• Davant• Myrtle Grove• Braithwaite
SOUTHEAST• Norfolk
• Claymont• Big Stone
Anchorage
• Braithwaite• Chalmette• Harvey• Westwego• Destrehan
EAST GULF• Convent• Donaldsonville• Darrow• Geismar
• Norfolk• Newport News• Portsmouth• Chesapeake• Yorktown
• Norco• Taft• Reserve• Gramercy
• Geismar• Plaquemine• Port Allen
• Hopewell• Richmond• Moorehead City• Wilmington• Georgetown
SOUTHEAST • Savannah• Brunswick• Jacksonville • Georgetown
• Charleston• Jacksonville• Fernandina Beach
Coal – Grain – Tankers – Biomass – Fertilizers – Minerals – Metals

HamptonRoadsHi t i l T t l C l E tHistoricalTotalCoalExports
70,000,000
50,000,000
60,000,000
s
1957: 52 million1970: 48 million
1980: 50 million
1991: 59 million
2012: 48 million
30,000,000
40,000,000
Short Ton
s
20,000,000
, ,
0
10,000,000
936
939
942
945
948
951
954
957
960
963
966
969
972
975
978
981
984
987
990
993
996
999
002
005
008
011
19 19 19 19 19 19 19 19 19 19 19 19 19 19 19 19 19 19 19 19 19 19 20 20 20 20

T t l U S E t 1996 2012TotalU.S.Exports,1996‐2012Met Coal Exports Steam Coal Exports Total Exports
100 000 000
120,000,000
80,000,000
100,000,000
Ton
s
40,000,000
60,000,000
Short
0
20,000,000
1996 1997 1998 1999 2000 2001 2002 2003 2004 2005 2006 2007 2008 2009 2010 2011 2012
Source: U.S. Energy Information Administration

U.S.CoalExportsasPercentagef T l C l P d iofTotalCoalProduction,1996‐2012
12%
14%1,200,000,000
10%
12%
10%
12%1,150,000,000
9%8%
7%
5% 5% 5%
7%
5%
8%
6%
8%
1,050,000,000
1,100,000,000
5%
4%4%
4% 4% 4% 4%
5%
4%
6%
950 000 000
1,000,000,000
0%
2%
900,000,000
950,000,000
1996 1997 1998 1999 2000 2001 2002 2003 2004 2005 2006 2007 2008 2009 2010 2011 2012
U.S. Coal Production Coal Exports as % of U.S. Production

U.S.CoalExportC t i f D ti tiCountriesofDestination(ShortTons)
Af i2007Destinations 2012Destinations
NorthAmerica9% South
0%Africa3%
SouthAmerica8%Asia
28%NorthAmerica
32% SouthAmerica12%
0%
Africa8%
Europe52%
Europe46%
Asia2%
0%
Source: U.S. Energy Information Administration
Total:59,163,103st Total:125,745,662st
B lti M l dBaltimore,Maryland
Chesapeake Bay Piers [CSX]
CNX Marine Terminal [Consol][ ]
2012 Exports = 8 M TonsCurrent Capacity = 14 M Tons
[ ]2012 Exports = 12.1 M Tons
Current Capacity = 14.5 M TonsPotential Capacity = 16 5 M TonsPotential Capacity = 16.5 M Tons
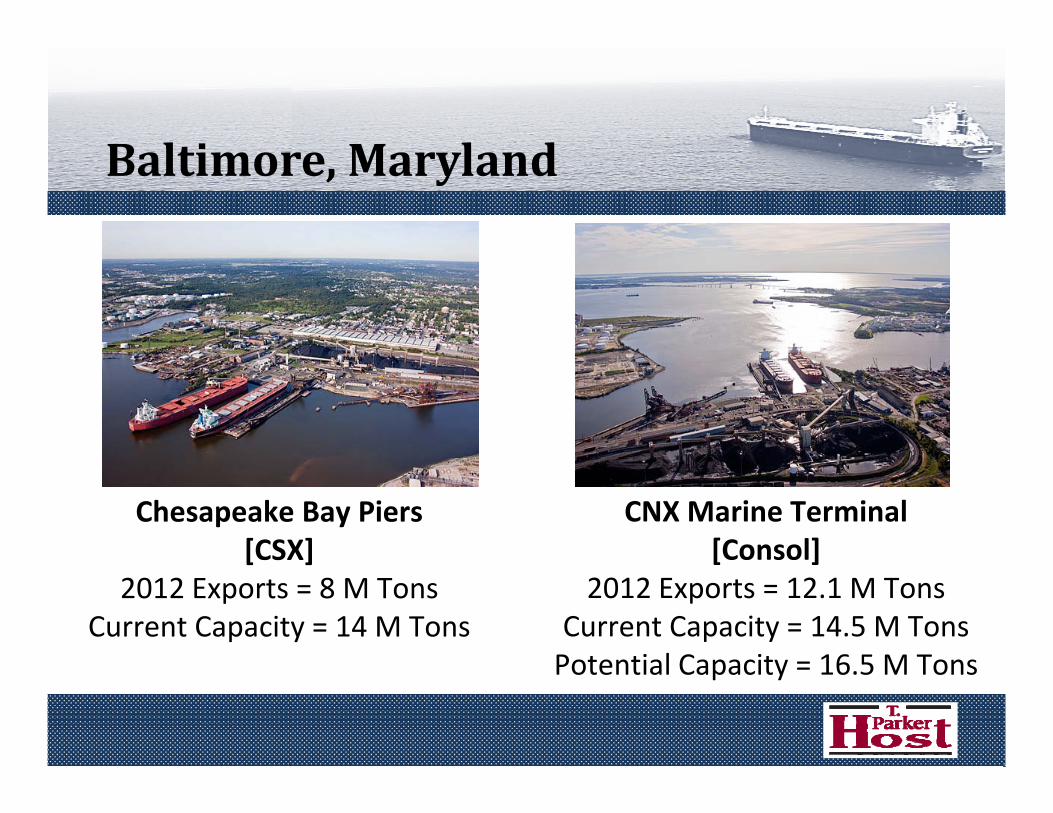
H t R d Vi i iHamptonRoads,VirginiaLamberts Point/ Pier 6
[NS]– 18.5 MM tons exported in 2012– 38 MM tons current capacityp y
Dominion Terminal Associates [Alpha, Arch, and Peabody]
– 15 2 MM tons exported in 201215.2 MM tons exported in 2012 – 22 MM tons current capacity
Kinder Morgan Pier IX [KM][KM]
– 14.3 MM tons exported in 2012 – 16.8 MM tons current capacity– 17.8 MM tons committed capacity

Hampton Roads i l 2012 Export Tons Current Capacity Committed Capacity Potential Capacity
U.S.EastCoastExportCapacity
Terminals 2012 Export Tons Current Capacity Committed Capacity Potential Capacity
Norfolk Southern Lamberts Point 18.5 M Tons 38 M Tons ‐‐ ‐‐ ‐‐ ‐‐
Kinder MorganPi IX 14.3 M Tons 16.8 M Tons + 1 M Tons 17.8 M Tons ‐‐ ‐‐Pier IX 14.3 M Tons 16.8 M Tons 1 M Tons 17.8 M Tons
Dominion Terminal Associates 15.2 M Tons 22 M Tons ‐‐ ‐‐ ‐‐ ‐‐
TOTALS 48 M Tons 76.8 M Tons + 1 M Tons 77.8 M Tons ‐‐ ‐‐
BaltimoreTerminals 2012 Export Tons Current Capacity Committed Capacity Potential Capacity
CNX Marine 12.1 M Tons 14.5 M Tons ‐‐ ‐‐ + 2 M Tons 16.5 M Tons
Chesapeake Bay Piers 8 M Tons 14 M Tons ‐‐ ‐‐
TOTALS 20.1 M Tons 28.5 M Tons ‐‐ ‐‐ + 2 M Tons 30.5 M Tons
*Data is in Short Tons (2,000 lbs.)
U.S. EastU.S. East CoastCoastGRAND TOTALSGRAND TOTALS
2012 Export Tons2012 Export Tons
68.1 M Tons68.1 M TonsCurrent CapacityCurrent Capacity
105.3 M Tons105.3 M TonsCommittedCommitted CCapacityapacity
106.3106.3 M TonsM TonsPotential CapacityPotential Capacity
108.3 M Tons108.3 M Tons
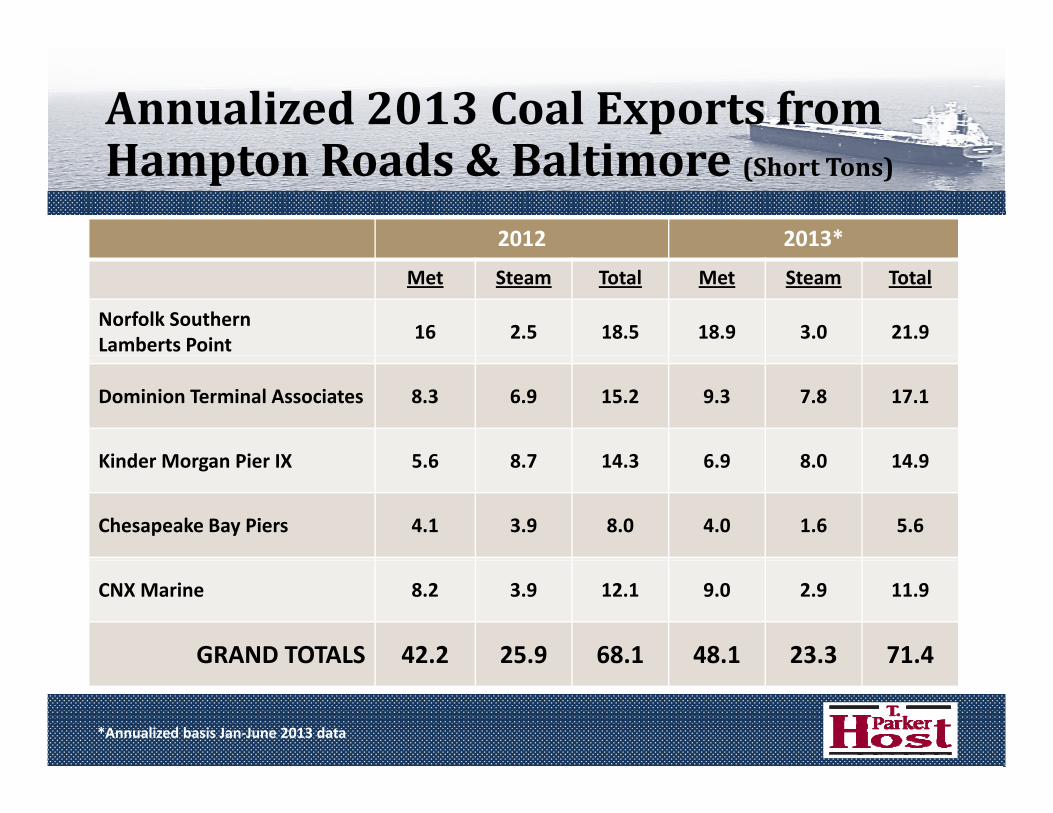
Annualized2013CoalExports fromH t R d & B ltiHamptonRoads&Baltimore(ShortTons)
2012 2013*
Met Steam Total Met Steam Total
Norfolk SouthernLamberts Point 16 2.5 18.5 18.9 3.0 21.9
Dominion Terminal Associates 8.3 6.9 15.2 9.3 7.8 17.1
Kinder Morgan Pier IX 5 6 8 7 14 3 6 9 8 0 14 9Kinder Morgan Pier IX 5.6 8.7 14.3 6.9 8.0 14.9
Chesapeake Bay Piers 4.1 3.9 8.0 4.0 1.6 5.6
CNX Marine 8.2 3.9 12.1 9.0 2.9 11.9
GRAND TOTALS 42.2 25.9 68.1 48.1 23.3 71.4G O S . 5.9 68. 8. 3.3 .
*Annualized basis Jan‐June 2013 data

M bil Al bMobile,Alabama
McDuffie Coal Terminals[Alabama State Port Authority]
Bulk Material Handling Plant[Alabama State Port Authority][ y]
2012 Exports = 9.9 M TonsCurrent Capacity = 10 M Tons
Committed Capacity = 16 M Tons
[ y]2012 Exports = 370 K Tons
Current Capacity = 2‐3 M TonsCommitted Capacity = 16 M Tons

M bil Al bMobile,Alabama
Chipco Terminal [Cooper Marine and Timberlands]
Blue Creek Coal Terminal[Walter Energy][Cooper Marine and Timberlands]
2012 Exports = 600 K TonsCurrent Capacity = 1 M Tons
[Walter Energy]2012 Exports = 0 M Tons
Potential Capacity = 6 M Tons(2017)(2017)

L i iLouisiana
IMT[KM/AEP]
UBT [Oil Tanking][ / ]
2012 Exports = 3.8 M TonsCurrent Capacity = 10 M Tons
Committed Capacity = 16 M Tons
[ g]2012 Exports = 7.2 M Tons
Current Capacity = 12 M TonsCommitted Capacity = 22 M TonsCommitted Capacity 16 M Tons p y

L i iLouisiana
Convent Marine Terminal[Foresight Energy]
Burnside Terminal[Trafigura/Impala][Foresight Energy]
2012 Exports = 6 M TonsCurrent Capacity = 10 M Tons
C i d C i 20 M T
[Trafigura/Impala]2012 Exports = 0 M Tons
Committed Capacity = 7.5 M TonsP i l C i 15 M TCommitted Capacity = 20 M Tons Potential Capacity = 15 M Tons

MississippiRiverMid t O tMidstreamOperators
Operator2012ExportTonnage
#CurrentCranes
#CranestoComeOn‐line
CommittedCapacity(Basis2012Throughput
PerCraneforEachCompany)p y)
CooperConsolidated 3M 8 2
(Q2/Q32013) 3.8M
LMO 2M 1 0 2.0 MSt.JamesStevedoring 6.5M 8 2
(Q32013) 8.1M
Associated 9 M 7 1 10 3 MAssociatedTerminals 9M 7 1
(Q32013) 10.3M
TOTAL 20.5M 24 5 24.2M

U.S.GulfCurrentandPotentialTerminalDevelopments?p
Burnside Marine TerminalCooper Darrow Midstream
Cooper LaPlaceMidstream
Pin Oak?MP 144
Burnside Marine TerminalMidstream
Associated TerminalsSt. Bernard MidstreamCooper Waggaman
MidstreamAssociated Terminals South LA Midstream
Convent Marine Terminal
Castleton?MP 79
St. James DestrehamMidstream
Potential Terminals? Potential Capacity?
RAM / Armstrong 8 M Tons
Associated Terminals Myrtle Grove Midstream
RAM / Armstrong?MP 61
Pin Oak 6‐8 M Tons
Castleton 5‐7 M TonsInternational Marine Terminals
United BulkTerminal
MP 61

H t & C Ch i ti THouston&CorpusChristi,TexasDeepwater Terminal [KM] p [ ]
– 300 K tons exported in 2012– 6 MM tons current capacity– 10 MM tons committed capacity
Houston Bulk Terminal [KM] – 1.5 MM tons exported in 2012– 2.5 MM tons current capacity
Corpus ChristiCorpus Christi– 1.5‐2.5 MM tons current capacity– 4.5 MM tons potential capacity4.5 MM tons potential capacity

Louisiana Terminals 2012 CurrentC i Committed Capacity Potential Capacity
U.S.GulfExportCapacity– LowerMississippiLouisiana Terminals Export Tons Capacity Committed Capacity Potential Capacity
United Bulk Terminal 7.2 M Tons 12 M Tons +10 M Tons 22 M Tons ‐‐ ‐‐
International Marine Terminals 3.8 M Tons 10 M Tons +6 M Tons 16 M Tons ‐‐ ‐‐Terminals
Convent Marine Terminal 6 M Tons 10 M Tons +10 M Tons 20 M Tons ‐‐ ‐‐
Burnside Marine Terminal ‐‐ ‐‐ +7.5 M Tons 7.5 M Tons + 7.5 M Tons 15 M Tons
Associated Terminals 9 M Tons 9 M Tons +1.3 M Tons 10.3 M Tons ‐‐ ‐‐
St. James Stevedoring 6.5 M Tons 6.5 M Tons +1.6 M Tons 8.1 M Tons ‐‐ ‐‐
Cooper Consolidated 3 M Tons 3 M Tons +0 8 M Tons 3 8 M TonsCooper Consolidated 3 M Tons 3 M Tons +0.8 M Tons 3.8 M Tons ‐‐ ‐‐
LMO 2 M Tons 2 M Tons ‐‐ ‐‐
RAM / Armstrong ‐‐ ‐‐ ‐‐ ‐‐ + 8 M Tons 8 M Tons
Pin Oak ‐‐ ‐‐ ‐‐ ‐‐ + 6‐8 M Tons 6‐8 M Tons
LDH Energy/ Castleton ‐‐ ‐‐ ‐‐ ‐‐ + 5‐7 M Tons 5‐7 M Tons
Coeclerici & Associated ‐‐ ‐‐ ‐‐ ‐‐ + 6‐8 M Tons 6‐8 M Tons
TOTALS 37.5 M Tons 52.5 M Tons +37.2 M Tons 89.7 M Tons +32.5 M Tons 122.2 M Tons
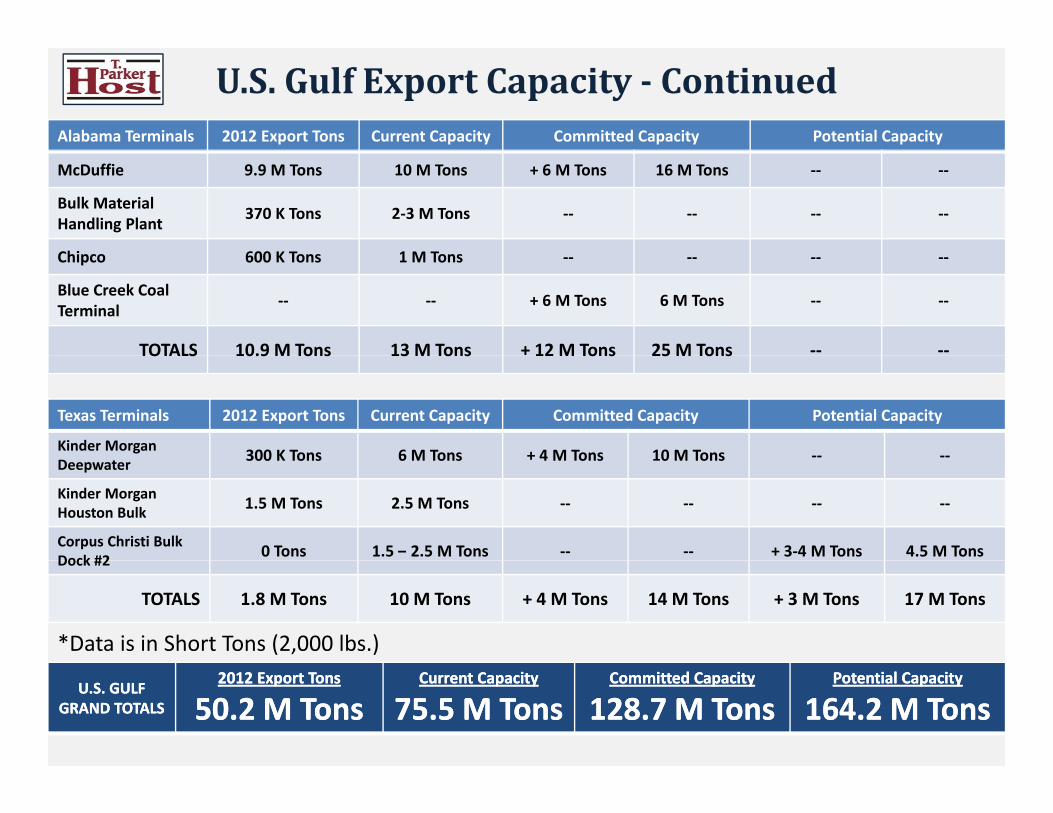
Alabama Terminals 2012 Export Tons Current Capacity Committed Capacity Potential Capacity
U.S.GulfExportCapacity‐ Continued
McDuffie 9.9 M Tons 10 M Tons + 6 M Tons 16 M Tons ‐‐ ‐‐
Bulk Material Handling Plant 370 K Tons 2‐3 M Tons ‐‐ ‐‐ ‐‐ ‐‐
Chi 600 K T 1 M TChipco 600 K Tons 1 M Tons ‐‐ ‐‐ ‐‐ ‐‐
Blue Creek Coal Terminal ‐‐ ‐‐ + 6 M Tons 6 M Tons ‐‐ ‐‐
TOTALS 10.9 M Tons 13 M Tons + 12 M Tons 25 M Tons ‐‐ ‐‐TOTALS 10.9 M Tons 13 M Tons 12 M Tons 25 M Tons
Texas Terminals 2012 Export Tons Current Capacity Committed Capacity Potential Capacity
Kinder Morgan 300 K Tons 6 M Tons + 4 M Tons 10 M Tons ‐‐ ‐‐Deepwater 300 K Tons 6 M Tons + 4 M Tons 10 M Tons
Kinder Morgan Houston Bulk 1.5 M Tons 2.5 M Tons ‐‐ ‐‐ ‐‐ ‐‐
Corpus Christi Bulk Dock #2 0 Tons 1.5 – 2.5 M Tons ‐‐ ‐‐ + 3‐4 M Tons 4.5 M TonsDock #2
TOTALS 1.8 M Tons 10 M Tons + 4 M Tons 14 M Tons + 3 M Tons 17 M Tons
*Data is in Short Tons (2,000 lbs.)
U.S. GULFU.S. GULFGRAND TOTALSGRAND TOTALS
2012 Export Tons2012 Export Tons
50.2 M Tons50.2 M TonsCurrent CapacityCurrent Capacity
75.5 M Tons75.5 M TonsCommittedCommitted CCapacityapacity
128.7 M Tons128.7 M TonsPotential CapacityPotential Capacity
164.2 M Tons164.2 M Tons

Annualized2013CoalExportsf U S G lffromU.S.Gulf(MShortTons)
Louisiana 2012 2013*
IMT 3.8 1.7
UBT 7.2 4.0
Convent Marine Terminal 6.0 5.3
Midstream Operators 20.5 11.9
Mobile
McDuffie 9.9 11.3McDuffie 9.9 11.3
BMHP 0.37 0.39
Chipco 0.6 0.6
HoustonHouston
Deepwater 0.3 0.7
Houston Bulk 1.5 2.6
GRAND TOTALS 50.2 38.5
*Annualized basis Jan‐June 2013 data

X l T ff O tiXcoal Topoff Operation
Canso, Nova Scotia
From Baltimore
From Hampton Roads

U S G lf T ff L tiU.S.GulfTopoff Locations

1
TheStatusofNorthwestExports
3
Operating
Permits lodged
Permits to be lodged2
41. Ridley Terminal2. Westshore Terminal3 Neptune Bulk Terminal 6b
85
73. Neptune Bulk Terminal4. Gateway Pacific Terminal5. Millennium Bulk Terminals‐
Longview, LLC6a. Coyote Island Terminal
Morrow Pacific
6b 6a
6b. Port Westward7. Kinder Morgan Terminal8. Coos Bay
Pacific Project
Source: Kinder Morgan/ Ambre Energy

P ifi N th t P t ti lPacificNorthwestPotentials
Gateway Pacific Terminal [SSA Marine & Peabody]– Cherry Point, Washington– Permit Filed– 45 MM tons potential capacity– Investment = $665 M
Millennium Bulk Terminal [Ambre & Arch] – Longview, Washington– Permit Re‐filed
44 MM tons potential capacity– 44 MM tons potential capacity– Investment = $600 M
Source: Kinder Morgan

MorrowPacificProject(A b )(Ambre)
• $160 M project (including cost of 20 $ p j ( gbarges and floating transloader)
• Coyote Island Terminal to be constructed at publicly‐owned Port of M (OR)Morrow (OR)
• Coal barged to Port Westward
S 1 St 23.5 t/
8.0 /Stage 1 Stage 2mt/yr
(2014)mt/yr(2016)
Source: Ambre Energy

C d E t C l T i lCanadaExportCoalTerminalsRidley Coal Terminal
– 8.5 MM tons exported in 2012– 12 MM tons current capacity– 25 MM tons committed capacity
Westshore Terminal – 25 MM tons exported in 2012– 30 MM tons current capacity
Neptune Bulk Terminal 9 MM t t d i 2012– 9 MM tons exported in 2012
– 12.5 MM tons current capacity– 18.5 MM tons committed capacity
*C i i ll di i– *Capacity is all commodities

TotalU.S.CoalExportCapacity
U.S. RegionalTerminals
2012 Export Tons
Current Capacity Committed Capacity Potential Capacity
East Coast 68.1 M Tons 105.3 M Tons + 1 M Tons 106.3 M Tons + 2 M Tons 108.3 M TonsTons
Gulf Coast 50.2 M Tons 75.5 M Tons + 53.2 M Tons 128.7 M Tons + 35.5 M Tons 164.2 M Tons
U.S. Northwest Coast ‐‐ ‐‐ ‐‐ ‐‐ + 97 M Tons 97 M Tons
TOTALS 118.3 M Tons 180.8 M Tons + 54.2 M
Tons 235 M Tons + 134.5 M Tons 369.5 M Tons
2012 U.S. CurrentCanadian Terminals 2012 U.S. Export Tons
Current Capacity Committed Capacity Potential Capacity
Westshore Terminal, Neptune Bulk Terminal, Ridley Terminal
7.4 M Tons 54.5 M Tons + 19 M Tons 73.5 M Tons ‐‐ ‐‐
*Data is in Short Tons (2,000 lbs.)
Terminal
GRAND GRAND TOTALSTOTALS
2012 U.S. Export Tons2012 U.S. Export Tons
125.7125.7 M TonsM TonsCurrent CapacityCurrent Capacity
235.3 M Tons235.3 M TonsCommittedCommitted CCapacityapacity
308.5308.5 M TonsM TonsPotential CapacityPotential Capacity
443443 M TonsM Tons

Th U di t blTheUnpredictables
Breakdowns/Unscheduled Maintenance
Labor Strikes
Weather/ Flooding i l i i
Market
Weather/ Flooding Environmental Opposition

U S M t C l E t & P iU.S.MetCoalExports&PriceU.S. Met Coal Exports & Price
$160
$180
$200
60 000 000
70,000,000
80,000,000
$100
$120
$140
40,000,000
50,000,000
60,000,000
per S
hort Ton
ort T
ons
$40
$60
$80
20,000,000
30,000,000
Dollars p
Sho
$0
$20
0
10,000,000
1996 1997 1998 1999 2000 2001 2002 2003 2004 2005 2006 2007 2008 2009 2010 2011 2012
Source: U.S. Energy Information Administration
Met Coal Exports Average Price


2013TotalEastCoastC l E t b PiCoalExportsbyPier3,000,000
2 000 000
2,500,000
1,500,000
2,000,000
Norfolk Southern
DTA
Pier IXort Ton
s
500,000
1,000,000
Pier IX
CNX
CSX
Sh
0

Questions?Questions?
Thankyou!